Comparative flood damage model assessment: towards a European approach
←
→
Page content transcription
If your browser does not render page correctly, please read the page content below
Nat. Hazards Earth Syst. Sci., 12, 3733–3752, 2012
www.nat-hazards-earth-syst-sci.net/12/3733/2012/                                                   Natural Hazards
doi:10.5194/nhess-12-3733-2012                                                                           and Earth
© Author(s) 2012. CC Attribution 3.0 License.                                                     System Sciences

Comparative flood damage model assessment: towards a European
approach
B. Jongman1,2 , H. Kreibich3 , H. Apel3 , J. I. Barredo5 , P. D. Bates4 , L. Feyen5 , A. Gericke3 , J. Neal4 ,
J. C. J. H. Aerts1,2 , and P. J. Ward1,2
1 Institute
          for Environmental Studies (IVM), VU University Amsterdam, The Netherlands
2 Amsterdam   Global Change Institute (AGCI), VU University Amsterdam, The Netherlands
3 Section Hydrology, German Research Centre for Geosciences (GFZ), Potsdam, Germany
4 School of Geographical Sciences, Bristol University, UK
5 European Commission – Joint Research Centre, Ispra, Italy

Correspondence to: B. Jongman (brenden.jongman@ivm.vu.nl)

Received: 26 June 2012 – Revised: 15 October 2012 – Accepted: 25 October 2012 – Published: 19 December 2012

Abstract. There is a wide variety of flood damage models in         1   Introduction
use internationally, differing substantially in their approaches
and economic estimates. Since these models are being used
more and more as a basis for investment and planning deci-          Flooding of river systems is the most frequent and costly nat-
sions on an increasingly large scale, there is a need to reduce     ural hazard, affecting the majority of the world’s countries
the uncertainties involved and develop a harmonised Euro-           on a regular basis (UNISDR, 2011; IPCC, 2012). Over the
pean approach, in particular with respect to the EU Flood           past few decades the economic damage as a result of flood-
Risks Directive. In this paper we present a qualitative and         ing has increased in most regions. Several studies state that
quantitative assessment of seven flood damage models, us-           most of this increase can be attributed to a growth of popula-
ing two case studies of past flood events in Germany and the        tion and wealth in flood prone areas (Barredo, 2009; Bouwer
United Kingdom. The qualitative analysis shows that mod-            et al., 2010; Kreft, 2011; UNISDR, 2011; Barredo et al.,
elling approaches vary strongly, and that current methodolo-        2012). Studies of past flood events show that the majority of
gies for estimating infrastructural damage are not as well de-      losses arise in urban areas, due to impairment of structures,
veloped as methodologies for the estimation of damage to            costs of business shut-down and failure of infrastructure (EA,
buildings. The quantitative results show that the model out-        2010; ADB and The World Bank, 2010). Government agen-
comes are very sensitive to uncertainty in both vulnerability       cies, insurance companies and research institutions in many
(i.e. depth–damage functions) and exposure (i.e. asset val-         countries develop and use flood damage models to assess the
ues), whereby the first has a larger effect than the latter. We     expected economic flood impact. Estimates of potential ex-
conclude that care needs to be taken when using aggregated          ante damage are used, for example, for land use planning,
land use data for flood risk assessment, and that it is essen-      flood risk mapping and cost-benefit analysis of required in-
tial to adjust asset values to the regional economic situation      vestments in flood defences (e.g. Charnwood Borough Coun-
and property characteristics. We call for the development of a      cil, 2003; Kind, 2011).
flexible but consistent European framework that applies best           Flood damage can be divided into four types: direct tangi-
practice from existing models while providing room for in-          ble (e.g. physical damage due to contact with water), indirect
cluding necessary regional adjustments.                             tangible (e.g. loss of production and income), direct intan-
                                                                    gible (e.g. loss of life) and indirect intangible (e.g. trauma)
                                                                    (e.g. Smith and Ward, 1998; Messner et al., 2007; Merz et
                                                                    al., 2010; Bubeck and Kreibich, 2011). In this paper we will
                                                                    only assess methodologies relating to the estimation of di-
                                                                    rect tangible damage. The estimation of direct flood damage

Published by Copernicus Publications on behalf of the European Geosciences Union.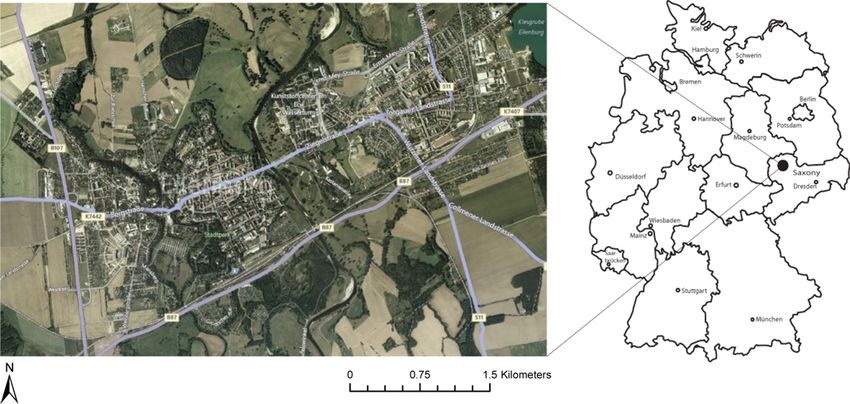
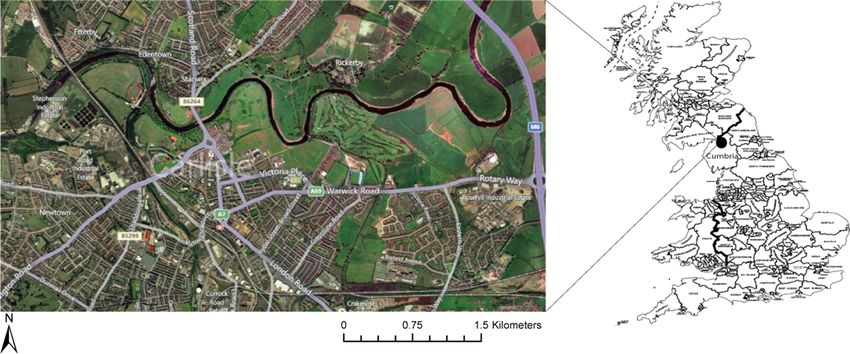
3734                                                         B. Jongman et al.: Comparative flood damage model assessment

is a complex process involving a large number of hydro-             First, it can be used to improve currently existing flood dam-
logic and socioeconomic factors. The structure, inputs and          age models and their results. Second, it can assist in the de-
outputs of a specific damage model are defined not only by          velopment of a consistent supra-national damage assessment
the available data, but also by the purpose of the model. For       approach (te Linde et al., 2010; Bubeck et al., 2011). In the
example, while insurance companies model the estimated in-          EU Flood Risks Directive, consistency in assessment meth-
sured damages, government agencies and academics are gen-           ods is already aimed at within individual river basins in the
erally interested in the accurate assessment of total economic      European Union (European Parliament, 2007). On a larger
losses. All damage models are by definition based on a de-          scale, there is an increasing interest in a harmonised Europe-
gree of generalisation, but the level of detail varies signif-      wide modelling approach (Lugeri et al., 2006; De Roo et al.,
icantly between them.In this paper we compare a range of            2007; Barredo and De Roo, 2010). Such a consistent mod-
flood damage models in order to qualify and quantify the dif-       elling approach could be valuable for the identification of ar-
ferences.                                                           eas of high potential risk; the support of European policy; and
   In almost all models in use today, flood depth is treated as     the estimation of the expected costs of compensation mech-
the determining factor for expected damage, sometimes com-          anisms such as the EU Solidarity Fund (European Council,
plemented by other parameters like velocity, duration, water        2002; Hochrainer et al., 2009). A first pan-European damage
contamination, precaution and warning time (Messner et al.,         model has been developed on the request of the European
2007; Merz et al., 2010; Green et al., 2011). Some recently         Commission – Joint Research Centre (Huizinga, 2007), and
developed multi-parameter models are conceptual (Nicholas           is discussed in Sect. 4.
et al., 2001) or developed (and validated) for specific areas,         Flood damage modelling methodologies have been eval-
e.g. for Japan (Zhai et al., 2005) or FLEMO for Germany             uated in several comparison studies (e.g. Meyer and Mess-
(Kreibich et al., 2010). Thus, more research is needed on           ner, 2005; Messner et al., 2007; Merz et al., 2010; De Moel
their validation and transferability (e.g. in this study the Ger-   and Aerts, 2011; Green et al., 2011). However, these stud-
man multi-parameter model FLEMO is included).                       ies either: (1) focus on a small selection of models; (2) are
   However, the internationally accepted and most common            limited to qualitative assessment; or (3) only measure quan-
method for the estimation of direct flood damage is still the       titative model outcomes relative to other models due to a lack
application of depth–damage functions (Smith, 1994; Kel-            of available empirical damage data. In this paper we present
man and Spence, 2004; Meyer and Messner, 2005; Merz et              a first comprehensive qualitative and quantitative compari-
al., 2010; Green et al., 2011). Depth–damage functions repre-       son of seven damage models.The objectives are to identify
sent relationships between flood depth and the resulting mon-       strengths and weaknesses in existing modelling approaches,
etary damage. For a given flood depth the function gives ex-        specify the uncertainties involved and use these findings to
pected losses to a specific property or land use type, either as    assist the development of a harmonised European approach.
a percentage of a pre-defined asset value (relative function)       We conducted the qualitative comparison by analysing the
or directly in financial terms (absolute function).                 properties of the models using a literature study, and com-
   There is a large degree of uncertainty in the construction       paring them on a set of defined aspects. We carried out the
of the damage curves, the asset values connected to these           quantitative assessment by running all models on two case
curves and the larger methodological framework (Merz et al.,        studies of past flood events, for which both spatial hydrolog-
2004; Hall et al., 2005; Meyer and Messner, 2005; Messner           ical and land use data as well as reported flood damage data
et al., 2007; Apel et al., 2008; Freni et al., 2010; Merz et al.,   are available.
2010; De Moel and Aerts, 2011; Green et al., 2011; Ward et
al., 2011). Differences in the methodological framework of
flood damage models are for example apparent in the spa-            2     Case studies
tial scale (object- versus area-based), damage-function type
(absolute versus relative), damage classes, cost base (replace-     The first case study for the quantitative comparison of dam-
ment cost versus depreciated cost) and the number of hydro-         age model outcomes is based on a 2002 flood event in Eilen-
logical characteristics included. Also, while some damage           burg, Germany (Fig. 1). The second case study covers the
models are constructed using empirical damage data, others          2005 flooding in Carlisle, United Kingdom (Fig. 2). Both
are defined on expert judgement in combination with artifi-         flood events have been analysed in detail in several previ-
cial inundation scenarios.                                          ous studies outlined below, and the available data are used
   De Moel and Aerts (2011) show that uncertainty in depth–         in subsequent sections of this paper to estimate uncertainties
damage curves and corresponding asset values constitutes            involved in flood damage modelling.
the most important factor in damage estimation, and has a
much stronger effect on the outcome than uncertainties in           2.1    Eilenburg
hydrological and land use (“assets at stake”) inputs. The
assessment and reduction of these uncertainties by cross-           The August 2002 flooding of the Mulde River in the Ger-
comparison of damage models is important on two levels.             man municipality of Eilenburg, Saxony (Fig. 1), has been

Nat. Hazards Earth Syst. Sci., 12, 3733–3752, 2012                           www.nat-hazards-earth-syst-sci.net/12/3733/2012/
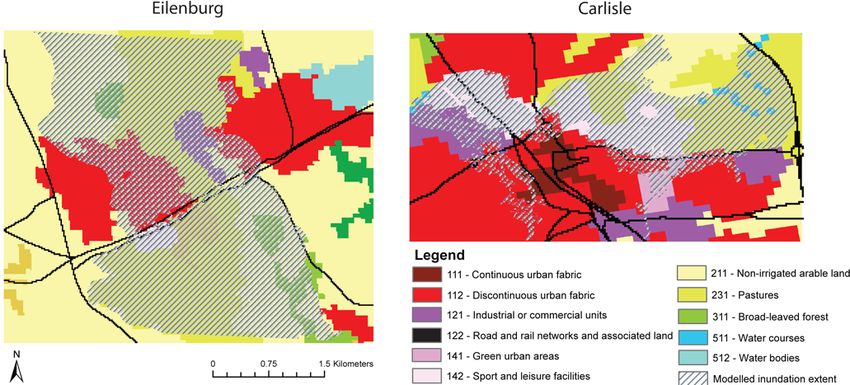
B. Jongman et al.: Comparative flood damage model assessment                                                                     3735

                                                                      Fig. 2. Location and map of the case study area of Carlisle in the
Fig. 1. Location and map of the case study area of Eilenburg in the   county of Cumbria, United Kingdom.
province of Saxony, Germany.

                                                                      of £30 000 (C42 000) in England (Office for National Statis-
documented extensively and used as a case study in several            tics, 2012). The relative sectoral employment in Carlisle is
preceding flood risk studies (e.g. Apel et al., 2009; Kreibich        generally in line with the national average, except for larger
et al., 2009; Kuhlicke, 2008; Meyer et al., 2009). During the         proportions working in agriculture (3.1 % versus 1.5 %) and
flood event, water reached a depth of up to 5 m in large parts        manufacturing (15.9 % versus 14.8 %), and a smaller fraction
of the city, forcing the evacuation of ca. 10 000 people. An          employed in finance and property (10.4 % versus 18.0 %)
estimated area of 9.2 million km2 was inundated, consisting           (Office for National Statistics, 2005). Similar to the Mulde
of approximately 3.4 million km2 of built-up area and infras-         river in Germany, the Eden river basin has a history of flood
tructure, and 5.8 million km2 of agriculture and natural land         events recorded as far back as the 1700s. Floods in recent
cover, resulting in total damage estimated at C218 million            years have been recorded in 1963, 1968, 1979, 1980, 1984
(Sect. 2.2.3).                                                        and 2005.
   The federal state of Saxony has a population of over
4 million people, with a GDP per capita of approximately
C21 000, compared to C29 000 for Germany as a whole (Eu-
                                                                      3     Methodologies
ropean Commission, 2012). Compared to the German aver-
age, a relatively large part of the Saxon economy is based
                                                                      We qualitatively and quantitatively compared seven flood
on industry, construction and public services (SMWA, 2010).
                                                                      damage models developed for simulating direct flood dam-
Financial services and trade contribute less to the economy in
                                                                      age: FLEMO (Germany), Damage Scanner (The Nether-
relative terms compared to the national average. Eilenburg is
                                                                      lands), Rhine Atlas (Rhine basin), the Flemish Model (Bel-
located in the north-western district of Saxony, about 20 km
                                                                      gium), Multi-Coloured Manual (United Kingdom), HAZUS-
from the city of Leipzig, and has a population of 19 000. The
                                                                      MH (United States) and the JRC Model (European Com-
Eilenburg region has a history of flooding, with high water
                                                                      mission/HKV). We are aware that more damage models are
events in the 20th century in 1926, 1932, 1954, 1958, 1974
                                                                      available, but we selected these specific ones because: (1) for
and 2002 (Pech et al., 2008).
                                                                      these models there is enough background information avail-
2.2   Carlisle                                                        able for consistent comparison; (2) they all use water depth
                                                                      as the main determining parameter for direct damage esti-
Between 7 and 9 January 2005, 36 h of heavy rain caused               mation; and (3) they were developed in economically simi-
a discharge with an estimated return period of 150 yr in the          lar regions as the case studies. Furthermore, all models in-
river Eden in the county of Cumbria (Day, 2005), leading to           volved in this study are developed and applied by govern-
severe flooding along the length of the river. In the county          ments and academic institutions rather than the insurance in-
capital, Carlisle (Fig. 2), 1844 properties were affected and         dustry, which ensures a degree of consistency in the purpose
three people lost their lives. The inundated area covered an          of the models. We compared the models quantitatively on the
estimated 2.3 million km2 , of which 1 million km2 consisted          basis of two case studies described in Sect. 2.
of built-up area and infrastructure, and the rest of nature
and agriculture. Total losses are estimated at £383 million           3.1    Qualitative assessment
( C535 million1 ) (Sect. 2.2.3).
   Cumbria has a total population of 496 000, of which                The framework used for the qualitative assessment of the
77 000 live in Carlisle. The GDP per capita of Cumbria was            damage models is presented in Fig. 3. We assessed all mod-
approximately £23 000 (C32 000), compared to an average               els on three main aspects: scale, input data and damage cal-
                                                                      culation. On the basis of preceding comparison studies (e.g.
   1 At exchange rate of January 2005.                                Meyer and Messner, 2005; Messner et al., 2007; Merz et al.,

www.nat-hazards-earth-syst-sci.net/12/3733/2012/                              Nat. Hazards Earth Syst. Sci., 12, 3733–3752, 2012
3736 B. Jongman et al.: Comparative flood damage model assessment
2010), we defined nine specific characteristics within these
Flood Damage Models
three categories that were compared between models:
– Scale of application: the spatial scale of application for
which the model is developed, ranging from local to Scale Input data Damage calculation
supra-national;
Units of analysis Hydrological Land-use Damage functions
Scale of application Cost base
– Regional differentiation: the options for differentiation characteristics classification
Regional Empirical validation
in parameters (such as maximum damage values) be- differentiation
Data method
tween areas of analysis;
Fig. 3. Schematic display of the framework for qualitative assess-
– Units of analysis: the units used for damage estimation, ment of the damage models included in this study. The summarised
which can be the level of individual objects or aggre- results are listed in Table 3.
gated land use classes, or a combination of these;
– Hydrological characteristics: the inundation character- 3.2.1 Damage modelling
istics taken into account in damage assessment, such as
depth, duration, velocity and contamination; In order to calculate flood damages with the different dam-
age models, several inputs are needed for both case study ar-
– Data method: the method used in developing the dam- eas. First, we obtained inundation maps, which provide flood
age models, either using empirical data from past flood depths for the inundation zones in Eilenburg and Carlisle
events or synthetic data from “what-if” analyses of a (Sect. “Inundation maps”). Second, we constructed consis-
simulated potential flood; tent land use maps for both areas using freely available Euro-
– Land use classification: the detail of the classification pean datasets (Sect. “Land use maps”). Finally, we adjusted
system used to differentiate between various object or the damage models to enable their application with these land
land use types; use maps (Sect. “Damage model modification”).
– Cost base: the type of values on which the maximum Inundation maps
damage per object or land use class is based. The val-
ues can be expressed as either replacement costs, i.e. the Both case study areas have recently been subject to a signif-
estimated new value of the object or class, or depreci- icant flood event, inundating an estimated 1 to 3 million km2
ated/repair costs, i.e. an estimate of the present-day cost in Carlisle and Eilenburg respectively, and affecting thou-
of replacement or reparation. Replacement costs repre- sands of properties. After the events, discharge patterns were
sent total expected monetary flows and are an estimated reconstructed using measuring gauges, on the basis of which
factor 2 higher than depreciated costs, which express various inundation models with different complexity were
real economic loss (e.g. ICPR, 1998; Penning-Rowsell built to simulate water depths and flow velocities (Fig. 4).
et al., 2010); The depth histograms for both study areas are presented in
Fig. 5.
– Empirical validation: the validation of the damage
model after development on the basis of reported flood Eilenburg
damage data; Because of the large impact of the event, the hydrolog-
– Damage functions: the type of depth–damage function, ical characteristics of the Eilenburg flooding have been
which can represent either the relative percentage loss studied in detail. River discharges were measured at the
with respect to a pre-defined maximum damage value, nearby gauging station of Golzern. In addition, maxi-
or the absolute monetary loss with depth. mum inundation depths were recorded at 380 observa-
tion points throughout the city (J. Schwarz et al., per-
The model description in Sect. 3 also includes information sonal communication, 2005). On the basis of the dis-
on complementary aspects such as the methodologies with charge, and a 25 m × 25 m DEM, Apel et al. (2009) sim-
respect to indirect effects, but these will not be discussed fur- ulated the flooded area using four different inundation
ther in the results section. models, which were calibrated using the node data of
observed flood depths. In the present study we use in-
3.2 Quantitative assessment undation depths from the 1-D/2-D model, which was
found by Apel et al. (2009) to be the most suited ap-
We carried out a quantitative comparison and sensitivity proach (Fig. 4).
analysis of the various damage models using the flood events
in Carlise and Eilenburg described in Sect. 2. In the following
subsections, we describe the steps required in this process.
Nat. Hazards Earth Syst. Sci., 12, 3733–3752, 2012 www.nat-hazards-earth-syst-sci.net/12/3733/2012/B. Jongman et al.: Comparative flood damage model assessment 3737
25%
Frequency (% of grid cells)
20%
15%
Eilenburg
10% Carlisle
5%
0%
0.5 1 1.5 2 2.5 3 3.5 4 4.5 5 5.5 6 6.5 7 7.5 8 8.5 9 9.5 10
Inundation depth (metres)
Fig. 5. Histogram of the validated inundation depth simulations for
Fig. 4. The case study areas of Eilenburg and Carlisle with the land the Eilenburg and Carlisle case studies. The histogram provides the
use and inundation data used in this study. The land use data con- percentage of grid cells (y-axis) inundated with a water depth within
sist of CORINE 2006 (EEA, 2009) and manually added main roads a specific 50 cm interval (x-axis).
from ESRI Europe Base Map (ESRI, 2009). The inundation areas
are derived from various modelling efforts that are further explained
in Sect. 2.2.1. Damage model modification
Carlisle We conducted a comparative damage assessment by applying
the various damage models to the study areas employing the
As is the case in Eilenburg, the flood that occurred in
simulated flood inundation depths and CORINE 2006 land
Carlisle in 2005 has subsequently been the focus of sev-
cover data (Fig. 4). In order to compute direct damage for the
eral inundation simulations (e.g. Neal et al., 2009, 2012;
two available case studies in a consistent way, we adjusted
Horrit et al., 2010; Fewtrell et al., 2011). In the present
the seven models to be compatible with CORINE land cover
study, we use the results of a 2-D inertial wave model
data. For most damage models the adjustment to CORINE
(Bates et al., 2010) developed using the 2-D channel
led to two main generalisations. First, the spatial resolution
geometry from Horritt et al. (2010). The model is based
of the land use input was set to the CORINE 100 m × 100 m
on a deterministic approach, using gauged hydrographs,
grid size. Second, the number of classes was decreased to
LiDAR elevation data, and Mastermap®land use data
match the four selected CORINE classes containing urban,
to aid the LiDAR processing (Mason et al., 2007).
commercial/industrial and infrastructural land cover.
Discharge data were available from four Environment
For all models one original depth–damage curve and cor-
Agency gauging stations along the river. In addition, an
responding maximum damage value was assigned to each
ex-post survey delivered a set of 263 water marks that
CORINE land use class (Table 1). If more than one original
were used for roughness calibration (Neal et al., 2009).
model class could be applicable to a certain CORINE class,
The resulting inundation map covers the larger Carlisle
we chose the class that was considered to be most compa-
city area with a horizontal resolution of 5 m × 5 m and
rable to the other models. For example, from the HAZUS
has a vertical root mean square error of 0.26 m with the
residential classification we selected the class three or more
checked water marks. Compared to the Eilenburg sim-
floors, no basement, since this corresponds best to building
ulation, the Carlisle inundation area is smaller (Fig. 4)
types assumed in the Damage Scanner, Multi-Coloured Man-
and has relatively fewer cells with high (> 2 m) flood
ual and Rhine Atlas models. Five out of seven damage mod-
depths (Fig. 5).
els used in this study (FLEMO, Damage Scanner, Rhine At-
Land use maps las, Flemish Model, JRC Model) are developed for aggre-
gated land use data such as CORINE, which take into ac-
To ensure a consistent comparison between the two case count that each of the land use classes containing built-up
study areas, we use CORINE 2006 (EEA, 2009) land cover area also include a fair share of less damage-prone land cover
data, which is available in both areas. The resolution of the apart from buildings (e.g. gardens and public grounds in res-
land use data is 100 m × 100 m. From the original CORINE idential areas). In contrast, HAZUS and the Multi-Coloured
data, we selected the classes “111 – Continuous urban fab- Manual are specifically designed for individual objects and
ric”, “112 – Discontinuous urban fabric”, “121 – Industrial thus cannot be applied directly to CORINE land use data.
or commercial units” and “122 – Road and rail networks Therefore, we analysed the average surface and density of
and associated land”, which are the areas containing residen- buildings in each of the case study areas and adjusted the
tial, commercial, industrial and infrastructural constructions. maximum damage values accordingly (Table 2). For Eilen-
Since we observed that CORINE does not classify any sur- burg, the building surface and density estimates were derived
face within the two case study areas as infrastructure and from a detailed dataset covering all individual buildings in
associated land, we added the main roads manually to this the city (Apel et al., 2009). For Carlisle, we used 1 m × 1 m
class using ESRI’s Europe Base Map (ESRI, 2009) (Fig. 4). resolution MasterMap®land use data in combination with
www.nat-hazards-earth-syst-sci.net/12/3733/2012/ Nat. Hazards Earth Syst. Sci., 12, 3733–3752, 20123738 B. Jongman et al.: Comparative flood damage model assessment
Table 1. Reclassification of the original categories of the damage models to the four CORINE land use classes applied in this study. Selection
of a specific damage category is done manually, whereby the median category is chosen in case of multiple possibilities.
CORINE classification Original classification
CLC CLC Label FLEMO Damage Flemish HAZUS-MH Multi-Coloured Rhine Atlas JRC Approach
Code Scanner method Manual
111 Continuous Mixed High density Residential Residential, Residential Residential Linked to CLC
urban fabric residential plus urban areas three or more homes average
average floors, no (indicative
commercial basement susceptibility)
112 Discontinuous Mixed Mixed Residential Residential, Residential Residential Linked to CLC
urban fabric residential plus urban-green three or more homes average,
average areas floors, no (indicative
commercial basement susceptibility)
121 Industrial or Average “Labour” Industrial Average light Weighted mean Industrial (incl. Linked to CLC
commercial commercial (commercial industrial retail commercial)
units and industrial plus industrial) (indicative
susceptibility)
122 Road and rail – Infrastructure Roads and rail – Estimated Traffic, Linked to CLC
networks and percent immobile
associated land
information on the total count of buildings. The new maxi- Maximum damage per square metre of continuous urban fabric (€)
FLEMO DSM Flemish HAZUS MCM RA JRC DE JRC UK
mum damage values represent the expected damage to build- 268 852 718 329 286 256 277 348
ings within the respective CORINE land use classes. 1.00
Damage as percentage of maximum damage figure
The depth–damage functions (Fig. 6) give the percentage
loss (y-axis) to the maximum damage values as a function of 0.80 FLEMO
water depth (x-axis). As has been shown in previous studies DSM
(e.g. Barredo and De Roo, 2010), the models vary strongly Flemish
0.60
HAZUS
in terms of the shape of the applied functions and maximum MCM
damage values. 0.40
RA
JRC DE
JRC UK
3.2.2 Empirical comparison
0.20
In this study we aim at comparing the damage models mu-
0.00
tually as well as with reported damage figures provided by 0 1 2 3 4 5 6
financial institutions. To facilitate this comparison, we anal- Inundation depth (metres)
ysed the empirical damage data available, and as far as possi-
Fig. 6. Depth–damage functions and corresponding maximum dam-
ble linked the data to the four CORINE land use classes used age figures for the CORINE land use class “continuous urban fab-
to run the damage models. ric”. The functions of each damage model are based on a manual
selection of available damage classes, except for the JRC Model
Eilenburg which is designed to match CORINE land use data (Table 1;
Sect. 3).
The direct economic damage of the 2002 flood in Eilenburg
was documented by Saxonian Relief Bank (SAB). According
to SAB data, an estimated 765 residential properties were af- the same in Eilenburg, we estimated infrastructure losses for
fected with a total damage of C77.1 million. Damage to com- the case study area at C109 million. Hence, total damage is
mercial buildings totalled an estimated C33.9 million (Apel estimated at C218 million.
et al., 2009; Seifert et al., 2010a; SAB, personal commu-
nication, 2004). Infrastructure losses were not reported by Carlisle
SAB. However, the federal state of Saxony has published a
report for the whole of Saxony, reporting damage to infras- The Association of British Insurers estimated the total in-
tructure of 1.4 times residential losses (Leitstelle Wiederauf- sured damage in Carlisle at £272 million ( C382 million2 ).
bau, 2003). Infrastructure losses in Eilenburg resulted from Although a more detailed breakdown of damage from this
a collapse of a railway bridge and severe damage to roads, event is not available, we have made an estimate on the basis
amongst other things. Thus, assuming the Saxony-wide 1.4
ratio of infrastructure to residential losses is approximately 2 At exchange rate of January 2005.
Nat. Hazards Earth Syst. Sci., 12, 3733–3752, 2012 www.nat-hazards-earth-syst-sci.net/12/3733/2012/B. Jongman et al.: Comparative flood damage model assessment 3739
Table 2. Conversion of original object-based maximum damage values of HAZUS and MCM (left) to area-based values (right), on the basis
of average building densities and surface areas for Eilenburg and Carlisle. Building densities and surface area estimates are derived from a
spatial dataset of individual buildings for Eilenburg and 1 m × 1 m resolution MasterMap®data for Carlisle, specifically for the areas in the
simulated inundation zones (Fig. 4).
Object-based Average Average Area-based
maximum damage building surface building density maximum damage
(C m−2 ) area (m2 ) (# ha−1 ) ( C m−2 )
HAZUS MCM
CLC Code HAZUS MCM Eilenburg Carlisle Eilenburg Carlisle
Eilenburg Carlisle Eilenburg Carlisle
111 823 714 – 100 – 40 – 329 – 286
112 823 714 105 120 15 25 130 247 113 214
121 1156 1290 114 135 10 15 132 234 147 261
of the detailed economic assessment after the wide-spread 4 Flood damage models
flooding that occurred across England during the year 2007
(EA, 2010). The EA report outlines that: (1) 75 % of house- In this section we provide a brief description of the focus,
hold losses and 95 % of commercial and industrial damage development and characteristics of the different models in-
were insured; and (2) an average of 54 % of the total dam- cluded in this study, as well as an explanation on the appli-
age was attributed to households, the other 32 % to com- cation of each model in the quantitative section of our study.
mercial and industrial properties and 14 % to infrastructure. The aim of this section is to identify key methodological dis-
Applying the relative losses per class found in this study similarities, rather than to provide an exhaustive description
to the available insured damage data for Carlisle, we esti- of the approaches. For more detailed information, the reader
mated total direct damage at £228 million (C321 million), is referred to the publications cited.
£108 million (C151 million) and £46 million ( C64 million)
to residential properties, commercial/industrial units and in- 4.1 FLEMO
frastructure, respectively. Total direct damages amount to
£383 million (C535 million). Note that the estimated dam- The FLEMO model family has been developed at the Ger-
age to infrastructure in Carlisle is much lower relative to the man Research Centre for Geosciences, primarily for sci-
total damage than the figures estimated for Eilenburg. This is entific flood risk analyses from the local to national scale
mainly a result of high losses from a railway bridge and road (e.g. Apel et al., 2009; Vorogushyn et al., 2012). It contains
sections in the Eilenburg area. the rule-based multi-factorial Flood Loss Estimation MOdel
for the private sector (FLEMOps) for the estimation of di-
3.2.3 Sensitivity analysis rect tangible damage to residential buildings (Thieken et al.,
2008) and the rule-based multi-factorial Flood Loss Estima-
Finally, we conducted a sensitivity analysis to quantify the tion MOdel for the commercial sector (FLEMOcs) for the
effect of uncertainties associated with the modelling of flood estimation of direct tangible damage to buildings, equipment
damage. In the analysis we distinguished between two dif- and goods of companies (Kreibich et al., 2010; Seifert et al.,
ferent types of uncertainties: function uncertainty and value 2010a).
uncertainty. The first is defined as sensitivity of the out- FLEMOps calculates the flood damage using five different
come to uncertainty in the shape of the depth–damage func- classes of inundation depth, three individual building types,
tions, while the latter relates to uncertainty in maximum dam- two classes of building quality, three classes of contamina-
age values. We calculated function uncertainty by combin- tion and three classes of private precaution (Thieken et al.,
ing fixed maximum damage estimates with all seven depth– 2008). The FLEMOps model has been further developed for
damage functions. Following the same logic, we computed different flood types (Kreibich and Thieken, 2008; Elmer et
value uncertainty by combining a fixed depth–damage func- al., 2010, Kreibich et al., 2011a), but these specific versions
tion with all seven maximum damage values and assessed the have not been used in this study. FLEMOcs has a similar
spread. Both types of uncertainty can be expressed in terms structure, it calculates the flood damage using five classes
of the absolute and relative difference between the highest of inundation depth, four different economic sectors, three
and lowest damage estimates. We refer to these as absolute classes of company size in respect to the number of employ-
value/function uncertainty and relative value/function uncer- ees as well as three classes of contamination and three classes
tainty, respectively. of private precaution (Kreibich et al., 2010).
The models are based on empirical damage data from
the floods in 2002, 2005 and 2006 in the Elbe and Danube
www.nat-hazards-earth-syst-sci.net/12/3733/2012/ Nat. Hazards Earth Syst. Sci., 12, 3733–3752, 20123740 B. Jongman et al.: Comparative flood damage model assessment
catchments in Germany (Thieken et al., 2007; Kreibich et The underlying estimates of the Damage Scanner are
al., 2007, 2011b). For local studies the models are applica- mainly based on synthetic data, using “what-if analyses” es-
ble on the building level (micro-scale). For applications on timating the damage that would be expected in case of a cer-
the regional to national level (meso-scale) the models have tain flood situation. Maximum damage values are based on
been adapted using census, geo-marketing and land use data. rebuilding values (buildings), replacement values (contents)
For the Germany-wide application, asset values of residen- and market values (agriculture) (Briene et al., 2002). Indirect
tial buildings and companies have been calculated and dis- losses are calculated as an additional 5 % on top of the direct
aggregated on different land use classes (Kleist et al., 2006; losses, and are consequently also subject to depth–damage
Thieken et al., 2006; Seifert et al., 2010b; Kreibich et al., curves.
2010). The models have been intensively validated on the The application of the Damage Scanner in our case study
micro- as well as on the meso-scale using different data sets areas was relatively straight-forward, since the land use clas-
of repair costs at the scale of single buildings and whole mu- sification of the Damage Scanner already corresponds well to
nicipalities (Thieken et al., 2008; Seifert et al., 2010a). the CORINE system. Similar to CORINE, the Damage Scan-
To enable an easy quantitative comparison with the other ner recognises a high density and a medium density class for
damage models in this study, simplified adapted model ver- urban areas, plus an additional low density class for rural ar-
sions are used in this study: FLEMOps for estimating resi- eas which we did not use. Also, the Damage Scanner has a
dential damage and FLEMOcs to estimate commercial and single land use class for “Labour”, including both commer-
industrial damage. The models have been reduced to their cial and industrial properties, and one class for infrastructure.
main determining parameter, i.e. water-depth, in only us- The asset and vulnerability estimates for the aggregated ur-
ing their depth–damage functions. For the model parameters ban classes of the Damage Scanner assume a degree of non-
residential building types and quality (FLEMOps) and eco- property land-occupation such as roads and open space.
nomic sectors and company size (FLEMOcs), average val-
ues per case study area have been used. Only the first model 4.3 Flemish model
stage of both models has been applied, which means that con-
tamination and precaution have not been taken into consid- A model for flood damage estimation developed for the
eration. Results of the application and validation of the full Flemish Environmental Agency in Belgium is described by
FLEMOps model in Eilenburg have been published by Apel Vanneuville et al. (2006). Similar to the Damage Scanner,
et al. (2009). the Flemish methodology is specifically designed for assess-
ments on a regional and national scale using aggregated land
4.2 Damage Scanner use data. The methodology has been applied for identifying
vulnerable areas (Vanderkrimpen et al., 2009) and calculat-
The standard method for the detailed estimation of flood ing efficient flood defence investments (Giron et al., 2010).
damage in the Netherlands is the Damage and Victims Mod- The maximum damage values in the Flemish model are
ule (SSM) (Kok et al., 2005). The HIS-SSM model is used based on national averages of housing prices, surface areas
extensively by government agencies to estimate potential and market values. Damage to residential content is assumed
flood damage on a regional or national scale and calculate to be 50 % of the structural losses. Furthermore, indirect
economically efficient investments in defences (Kind, 2011). costs are included as a percentage on top of the direct dam-
The disadvantage of the HIS-SSM is that it requires highly age, ranging from 10 % for agriculture to 40 % for industry.
detailed data on individual buildings, industries and infras- The Flemish model has been developed specifically for ag-
tructures. Since this information is not always available, the gregated land use data and, like the Damage Scanner, tailor-
Damage Scanner model (DSM) was developed (Klijn et al., ing to CORINE for the use in our quantitative analysis was
2007). The Damage Scanner is based on the economic val- relatively simple. The Flemish model has a separate structure
ues and depth–damage curves of the HIS-SSM module, but and content class for residential areas, which we summed and
works with aggregated land use data instead of individual allocated to the CORINE urban fabric classes. There is only
units. It is specifically designed for estimations at the re- one infrastructure and one “industry” (industry plus com-
gional scale and local variations are averaged out as much merce) class
as possible. Maximum damage values for identical land use
classes are defined at the national scale and do not vary spa- 4.4 HAZUS-MH
tially. Also, velocity is not taken into account as an influ-
encing factor. The Damage Scanner has been used for the The HAZUS Multi-Hazard software (FEMA, 2009;
estimation of future flood risk under climate and land use Scawthorn, 2006) is a tool for the estimation of the potential
changes in various regions of the Netherlands (e.g. Bouwer economic, financial and societal effects of natural hazards
et al., 2010; Aerts and Botzen, 2011; te Linde et al., 2011; within the United States. HAZUS-MH comprises water,
De Moel et al., 2011; Ward et al., 2011; Poussin et al., 2012). wind and earthquake induced hazards. In this paper we only
discuss the Flood Model. The HAZUS-MH Flood Model
Nat. Hazards Earth Syst. Sci., 12, 3733–3752, 2012 www.nat-hazards-earth-syst-sci.net/12/3733/2012/B. Jongman et al.: Comparative flood damage model assessment 3741
has been applied in different settings, to spatially assess reflecting actual buildings and not the surrounding area, we
potential flood risk (e.g. FEMA Region IV, 2008) or plan adjusted the values by an estimated building surface area
actual emergency support for upcoming flood events (e.g. per CORINE grid cell (Table 2). The resulting area-weighted
FEMA Region VII, 2008). The typical scales of application maximum damage estimates for the selected CORINE land
are city, county and state level. use classes are 61–88 % lower than the maximum damage
The development of HAZUS started in 1997 with an ex- estimates for individual objects, and should be more suited
ploratory study and continued to the publication of HAZUS- to reflect the reported damage patterns.
MH MR4 in 2009. Over several years, all inputs required for
flood damage estimation were collected and included in the 4.5 Multi-Coloured Manual
software:
The Multi-Coloured Manual (MCM) and its predecessors
– building data on the census block level, including build- present the most advanced method for flood damage esti-
ing type, number of floors, presence of a basement and mation within Europe (e.g. Penning-Rowsell and Chatterton,
date of construction; 1977; Penning-Rowsell et al., 1992, 2010). The purpose of
– infrastructure and high-potential facilities (e.g. hospi- the MCM is explicitly defined as to support water manage-
tals, energy plants) data on an object level, with infor- ment policy and enable quantitative assessment of the effect
mation on construction costs for all infrastructural ob- of investment decisions (Penning-Rowsell et al., 2010, p. 1).
jects; For these purposes, Penning-Rowsell et al. (2010) have de-
veloped a wide range of depth–damage relationships and ad-
– a large number of nationally applicable depth–damage ditional methodologies for the estimation of the losses and
functions for buildings developed by the Federal Insur- benefits of flooding.
ance Agency on the basis of 20 yr of empirical dam- Contrary to most other damage models, the MCM assesses
age data, as well as separate functions developed by the building losses using absolute depth–damage curves, defin-
US Army Corps of Engineers (USACE) for specific re- ing potential damage in British Pounds with depth, rather
gions of the United States; than using relative curves and maximum damage values.
These relationships are developed for a wide variety of res-
– failure probabilities and damage functions for infras- idential, commercial and industrial buildings, using mostly
tructure, constructed on the basis of modelling, expert synthetic analysis and expert judgment. Within each dam-
opinion and historical data; age class, distinctive damage curves are available for differ-
– a separate module for the estimation of indirect costs ent levels of physical building susceptibility (low-indicative-
and larger economic effects of the flood event, with high) and the presence of a basement. Since the calculated
functions based on user-defined economic variables damage is aimed at representing national economic losses, all
(e.g. size of the economy and unemployment figures). damage values are based on the pre-flood depreciated value
of the affected properties.
Users of the HAZUS software have to choose between Infrastructure losses are calculated in the MCM on the ba-
a basic “level 1” analysis using default input data, a “level sis of observed traffic volumes on the affected road trajec-
2” analysis using default data supplemented with regionally tory, the additional travel time and traffic cost per vehicle
specified information, or a “level 3” analysis that requires ex- type. There are no damage functions to estimate physical
tensive additional economic and engineering studies by the damage to infrastructure. However, on the basis of empiri-
user. This choice pertains to both direct and indirect cost es- cal data from the 2007 floods, direct infrastructure recovery
timations. Ding et al. (2008) have shown that level 2 analy- costs are estimated at 5.6 % of property losses for urban and
ses bring more reliable results than level 1 analyses. Further- 10.7 % for rural areas (J. Pardoe, personal communication,
more the user can define the intensity and timing of the flood, 2011). We used these generic figures in the present study.
how much warning time the community has, and whether the The MCM describes the calculation of indirect flood dam-
losses should be calculated on the basis of replacement or de- age as problematic (Penning-Rowsell et al., 2010, p. 38) and
preciated asset values. does not offer a generic methodology for such an assess-
The high level of detail of HAZUS implies that we have to ment.For the benefit of mutual comparison with the other
make several decisions when applying the model to our case models, we have converted the absolute functions of the
studies on the basis of aggregated land use data. First, out of MCM to a relative system. In doing so we respected the max-
the different HAZUS object classes we selected one function imum damage and proportional increase with depth, keeping
for each CORINE land use class, thereby picking the class the model outcomes unchanged.
that was considered most consistent with the other models Similar to HAZUS, the MCM is an object-based model, of
(Table 1). We used maximum damage values based on re- which the maximum damage per square metre estimates only
placement values, not depreciated values. Since HAZUS is reflect expected repair costs to buildings and not damage to
an object-based model with maximum damage values only the surrounding land. From the available MCM categories
www.nat-hazards-earth-syst-sci.net/12/3733/2012/ Nat. Hazards Earth Syst. Sci., 12, 3733–3752, 20123742 B. Jongman et al.: Comparative flood damage model assessment
we selected the classes that were considered to be most con- The JRC Model comprises differentiated depth–damage
sistent with the classification of the other damage models functions and maximum damage values for all EU-27 coun-
and assigned them to the corresponding CORINE land use tries. Asset values are based on the CORINE land use
classes (Table 1). Again, we made a correction for the esti- data and are classified into five damage classes: residential,
mated surface area and density of buildings in each of the commercial, industrial, roads and agriculture.These damage
case study areas to generate an average maximum damage classes are more specific than the original CORINE classes
per square metre value for each CORINE class in both case of continuous urban fabric, discontinuous urban fabric, in-
studies (Table 2). As is the case for HAZUS, the CORINE- dustrial or commercial units and roads and rail networks and
adjusted maximum damage values are 61–88 % lower than associated lands. An estimate is made of the relative break-
the original values. down of CORINE classes into the specific damage classes on
the basis of the more detailed LUCAS photographic point-
4.6 Rhine Atlas database (European Commission, 2009). As a result, the
flood depth in every grid cell is multiplied with a weighted
As a response to the 1995 floods in the Rhine basin, an Ac- average of depth–damage functions and maximum damage
tion Plan on Floods was agreed upon in 1998 to bundle all values. Depth–damage functions of nine countries were ac-
knowledge and measures, and to identify flood risk perfor- quired from existing studies and applied to the corresponding
mance targets within the Rhine area (ICPR, 1998). In order damage classes. Where national studies were not available,
to meet the performance targets in terms of risk reduction and an average of all available functions for the specific class
flood awareness, the Rhine Atlas damage model (RAM) was was assigned. The average function is also applied when a
developed (ICPR, 2001). country-specific function has a maximum relative damage
The RAM has the least detailed classification system of factor of 0.6 or less,because in that case the maximum dam-
the models included in this study by recognising only five age at even the highest water levels is reduced to such an ex-
land use classes, three of which are attributed to built-up area. tent that the function is considered invalid (Huizinga, 2007,
The depth–damage functions and the corresponding maxi- p. 2–19).
mum damage values were established on the basis of the em- Maximum damage values were collected from all EU
pirically based HOWAS flood damage database and expert countries for which this information could be found and dam-
judgement (ICPR, 2001). For the land use classes residential, age functions were known. Subsequently, an average of these
industrial and infrastructure, the RAM applies both a struc- values was calculated for each of the damage classes, which
ture and contents damage assessment. Since the RAM is de- can be applied to any EU-27 country or region, scaled to the
veloped to estimate direct economic costs, all damage values GDP per capita. The administrative levels used were both
are calculated on the basis of depreciated values. Through country level and NUTS 2 level (800 000 to 3 million inhab-
a comparison with insurance data, the ICPR (2001) esti- itants). Hence, the JRC damage functions are uniform within
mates that the replacement values are approximately a fac- countries, whereas the maximum damage values can vary
tor 2 higher than depreciated values. Indirect losses are not among regions within countries.
included in the RAM. For the United Kingdom, Huizinga (2007) applied depth–
The relatively simple classification system of the RAM damage functions based on Penning-Rowsell et al. (2005)
makes it easy to apply the model to case studies using and Van der Sande (2001). Maximum damage values for the
CORINE land use data. We assigned the maximum damage Carlisle region were calculated using the average GDP per
values and depth–damage curves for residential areas to both capita in the county Cumbria. For Germany, depth–damage
continuous and discontinuous urban fabric in CORINE. As functions were chosen using a combination of data from
is the case with CORINE, the RAM contains a single class ICPR (2001), Apel et al. (2004), Meyer and Messner (2005),
for industrial/commercial areas as well as one class for in- Büchele et al. (2006), Lindenschmidt et al. (2006) and Mess-
frastructure. ner et al. (2007). Maximum damage values for Eilenburg
were based on GDP figures from the Leipzig region.
4.7 JRC Model
As a result of the averaging of maximum damage val-
In support of European policy on flood risk management, the ues, the existing strong discrepancy that sometimes exists
European Commission’s Joint Research Centre – Institute for between maximum values across (adjacent) countries is re-
Environment and Sustainability (JRC-IES) has developed a duced, but so is the consistency in these values to a certain
pan-European damage model (Huizinga, 2007), which has extent. One reason for the reduction in consistency is that
been applied to estimate trends in European flood risk under the average maximum damage values are made up of both
climate change (Ciscar et al., 2011; Feyen et al., 2012). In depreciated and replacement values. Also, some of the max-
this paper, we refer to this as the JRC Model. imum damage values include a percentage addition for indi-
rect damage, while others do not. The JRC Model does not
include a separate calculation of indirect effects.
Nat. Hazards Earth Syst. Sci., 12, 3733–3752, 2012 www.nat-hazards-earth-syst-sci.net/12/3733/2012/B. Jongman et al.: Comparative flood damage model assessment 3743
Table 3. Qualitative properties of the damage models included in this study, relating to their calculation of losses to residential, commercial
and industrial units. A more extensive description of the models is provided in Sect. 4.
Damage Scale of ap- Regional Units of Hydrological Data Number Cost base Empirical Function Reference
model plication differentia- analysis characteris- method of unit valida-
tion tics classes tion
FLEMO Local Local asset Surface Depth Con- Empirical 5–10 Replacement Yes Relative Thieken et al. (2008)
Regional values area tamination values Kreibich et al. (2010)
National
Damage Regional No Surface Depth Synthetic 5–10 Replacement No Relative Klijn et al. (2007)
Scanner National area values
Flemish Regional No Surface Depth Synthetic 5–10 Replacement No Relative Vanneuville et al. (2006)
Model National area values
HAZUS- Local Local asset Individual Depth Empirical- > 20 Replacement Yes Relative FEMA (2009)
MH Regional values objects Duration synthetic values
Surface Velocity Depreciated
area Debris values
Rate of rise (user’s
Timing choice)
MCM Local No Individual Depth Synthetic > 20 Depreciated Limited Absolute Penning-Rowsell et
Regional objects values al. (2010)
Rhine Atlas Local No Surface Depth Empirical- 10–20 Depreciated No Relative ICPR (1998)
Regional area synthetic values
JRC Model Regional GDP- Surface Depth Empirical 5–10 Replacement No Relative Huizinga (2007)
National normalisation area Synthetic values
European (Statistical) Depreciated
values
(averaged
values)
5 Results and discussion 5.1.2 Regional differentiation
5.1 Qualitative assessment Also, the models vary regarding the ability to apply spatial
differentiation in their input parameters. The DSM, Flem-
In Sect. 4 we presented a broad description of the seven flood ish, RAM and MCM models have average parameters de-
damage models included in this study. A structured evalu- fined for each object or land use class, which are applied
ation of the methodologies on the basis of the parameters to their entire area of application (Netherlands, Belgium, the
defined in the qualitative framework (Fig. 3) is presented in Rhine basin and the United Kingdom, respectively). FLEMO
Table 3. The results show that while all models are devel- calculates damage using asset values differentiated on a mu-
oped around depth-based flood damage assessment, there are nicipality level, while applying the same depth–damage re-
strong differences in the approaches used. In this section we lationships to all areas. The HAZUS model accesses an ex-
describe the main differences between the models that have tended US-wide database with asset values at the level of
an effect on the damage estimates, following the three aspects objects (e.g. important facilities, bridges) and census blocks
of the qualitative framework (Fig. 3). (e.g. residential areas), in combination with a set of standard
values for most object types. The same depth–damage func-
5.1.1 Object versus area based models
tions are used nation-wide for the different types of objects.
An important division that can be recognised is between the The JRC model differentiates maximum damage values on a
object-based HAZUS and MCM models on the one hand, NUTS 2 administrative level based on GDP per capita data,
which use a large number of object types and corresponding and depth–damage functions on the country level based on
flood damage characteristics, and the more aggregated sur- available studies. It can be expected that models that do not
face area-based models on the other hand. The object-based use regional differentiation will overestimate flood damage
models have the advantage that they can control for varying in the periphery, where values are low, and might underesti-
building density in areas that have the same CORINE land mate losses in areas where values are higher than average.
use class. At the same time, area-based models are used more
easily for rapid calculation over larger areas and can be ap- 5.1.3 Input data
plied to scenario analysis (e.g. Klijn et al., 2007; Aerts et al.,
A further difference relates to the data upon which the mod-
2008; Aerts and Botzen, 2011).
els are based. FLEMO has a strong empirical foundation,
with reported damage data used both in the development and
www.nat-hazards-earth-syst-sci.net/12/3733/2012/ Nat. Hazards Earth Syst. Sci., 12, 3733–3752, 20123744 B. Jongman et al.: Comparative flood damage model assessment
validation of the model. HAZUS and the Rhine Atlas are to a in Carlisle. Estimated infrastructural losses, on the other
limited extent based on empirical data. The other models are hand, are more than twice as high in Eilenburg.
almost purely synthetic, with maximum damage values and For Eilenburg, the model estimates that show the strongest
depth–damage curves developed using “what-if” analysis of agreement with the reported damage are those from MCM
the effect of simulated flood characteristics on different land and JRC. If we exclude the infrastructure component, which
use classes. Models based on empirical data could be more is not covered in all models, FLEMO, HAZUS and RAM
accurate when applied to a similar case study, but, as with are all within 50 % error margins of the reported losses. The
synthetic models, the question remains whether data from a DSM and Flemish models strongly overestimate residential
flood event in a certain location can be applied to another losses in Eilenburg. In Carlisle, on the other hand, all models
region or country (Green et al., 2011). strongly underestimate total losses. HAZUS and JRC show
the strongest agreement both with and without the inclusion
5.1.4 Damage calculation of infrastructure. The HAZUS and JRC models are also the
only models that correctly simulate higher losses in Carlisle
Finally, we found that there is an important difference in than Eilenburg (Fig. 7). The RAM strongly underestimates
methods for the valuation of assets at risk. FLEMO, DSM damage in both areas, which is in line with findings from
and the Flemish model value assets at replacement costs; earlier comparison studies (e.g. De Moel and Aerts, 2011;
MCM and RAM are based on depreciated values; the JRC Bubeck et al., 2011).
model is a mixture of both; and HAZUS allows the user to
choose which of the value types to use. Replacement val- Relative distribution
ues are interesting from an insurance perspective, since they
provide information on the potential pay-outs involved. On Figure 7 shows the magnitude of the modelled damage as
the other hand, depreciated values are an estimated factor 2 well as the relative distribution over the residential, commer-
lower than replacement values (e.g. ICPR, 1998) and give a cial/industrial and infrastructure classes. Note that FLEMO,
better indication of the true economic costs associated with HAZUS and MCM do not have depth–damage curves for in-
the (partial) loss of the asset (e.g. Penning-Rowsell et al., frastructure and thus do not include an estimate for this class.
2010). Given the big effect on the outcome, one should be In both study areas, the reported residential damage is higher
aware of the type of valuation used in the model and choose than commercial and industrial flood losses. Figure 7 shows
a valuation based on the purpose of the analysis. that all models capture this.The same is not true for the esti-
mation of infrastructure losses, which make up a significant
5.2 Quantitative assessment share of the total damage in Eilenburg. Even with the com-
plementary infrastructure data added to CORINE, all damage
5.2.1 Damage estimates models that include this class strongly underestimate the cor-
responding losses in both case studies. This finding matches
Table 4 shows that the modelled inundation zone in the the general consensus that estimation of direct residential and
Eilenburg study area is about three times as large as in the commercial building damage is the best developed part of
Carlisle area. Modelled flood depths vary strongly per loca- flood damage models, and is surrounded by less uncertainty
tion and land use class, with the average overall flood depth than the estimation of infrastructure losses (Meyer and Mess-
per grid cell being slightly higher in Eilenburg (1.83 m) than ner, 2005; Merz et al., 2010; Green et al., 2011). At the same
in Carlisle (1.54 m). Carlisle has more than twice as much time, it is important to note that the DSM, Flemish, RAM and
total urban fabric in the inundated area than Eilenburg, 5 % JRC models all include a component of local infrastructure
of which is classified as continuous urban fabric, a class as part of the asset values in residential areas. In these cases
not present in the Eilenburg area (Fig. 4). At the same time, the infrastructure loss is represented in the damage estimates,
Eilenburg has about 50 % more inundated area classified as but not distinguishable as a separate class.
industrial and commercial units. Also, based on the vector
infrastructure data that we added manually to the original Object versus area based
CORINE data, we find the area classified as infrastructure to
be greater by approximately a factor four in Eilenburg than One reason why the reported damage is more than twice as
in Carlisle. high in Carlisle than in Eilenburg,whilst the area of the for-
The total estimated reported damage is approximately mer is more than half that of the latter, is found in differ-
145 % higher in Carlisle than in Eilenburg, in spite of the ent building densities between the two areas. While the total
fact that the inundated area is 220 % smaller. The reported area of urban fabric is a factor 3.7 times larger in Eilenburg
damage per square metre of the total inundated area is on av- (2.2 million km2 ) than in Carlisle (0.6 million km2 ), the re-
erage C64 in Eilenburg and C497 in Carlisle, a difference of ported total number of affected properties (765 vs. 1844) is
a factor 7.8. The difference results from substantially higher a factor 2.4 lower. The Carlisle case study does have about
losses from residential, commercial and industrial properties 5 % of its urban surface classified as continuous urban fabric
Nat. Hazards Earth Syst. Sci., 12, 3733–3752, 2012 www.nat-hazards-earth-syst-sci.net/12/3733/2012/You can also read