Evidence of Open Access of scientific publications in Google Scholar: a largescale analysis
←
→
Page content transcription
If your browser does not render page correctly, please read the page content below

Journal of Informetrics, vol. 12, no. 3, pp. 819-841, 2018. https://doi.org/10.1016/j.joi.2018.06.012

Evidence of Open Access of scientific
publications in Google Scholar: a large-
scale analysis
Alberto Martín-Martín1, Rodrigo Costas2,3, Thed van Leeuwen2,
Emilio Delgado López-Cózar1
Version 1.4
July 24, 2018

Abstract
This article uses Google Scholar (GS) as a source of data to analyse Open Access (OA) levels
across all countries and fields of research. All articles and reviews with a DOI and published
in 2009 or 2014 and covered by the three main citation indexes in the Web of Science
(2,269,022 documents) were selected for study. The links to freely available versions of these
documents displayed in GS were collected. To differentiate between more reliable
(sustainable and legal) forms of access and less reliable ones, the data extracted from GS
was combined with information available in DOAJ, CrossRef, OpenDOAR, and ROAR. This
allowed us to distinguish the percentage of documents in our sample that are made OA by the
publisher (23.1%, including Gold, Hybrid, Delayed, and Bronze OA) from those available as
Green OA (17.6%), and those available from other sources (40.6%, mainly due to
ResearchGate). The data shows an overall free availability of 54.6%, with important
differences at the country and subject category levels. The data extracted from GS yielded
very similar results to those found by other studies that analysed similar samples of
documents, but employed different methods to find evidence of OA, thus suggesting a relative
consistency among methods.

Keywords: Academic Publishers, Academic search engines, Academic social networks,
Creative Commons, CrossRef, Google Scholar, Institutional repositories, Open Access, Open
research metadata, ResearchGate, self-archiving

1
  Facultad de Comunicación y Documentación, Universidad de Granada, Granada, Spain.
2
  CWTS, Leiden University, Leiden, The Netherlands.
3
  DST-NRF Centre of Excellence in Scientometrics and Science, Technology and Innovation Policy,
Stellenbosch University, South Africa.

✉   Alberto Martín-Martín
    albertomartin@ugr.es

                    This accepted manuscript is made available under the CC-BY-NC-ND 4.0 license.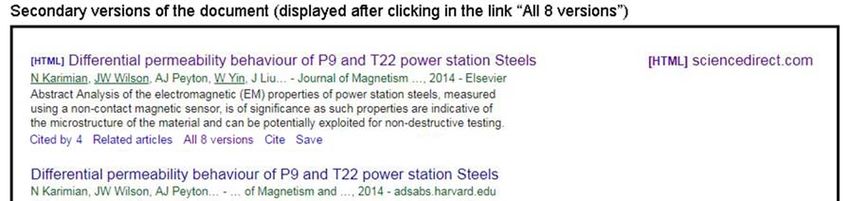
1. Introduction

1.1. Beginnings of the Open Access movement
The widespread adoption of web technologies removed most of the physical impediments for
accessing scientific information (Harnad, 2001). Since then, the issue of Open Access
(henceforth referred to as OA) to the scholarly literature has been hotly debated by all sorts of
actors in the academic community, including researchers, publishers, funding institutions,
librarians, and policy makers. Many of these discussions revolved around the ways in which
the system of scholarly communication should change, taking advantage of this new virtual
environment to become more effective and efficient and thus hopefully solve problems like the
affordability and accessibility to scientific information that afflict many research institutions.

One of the first crystallizations of these intentions to change the scholarly communication
system was the Budapest Open Access Initiative (Chan et al., 2002) (BOAI). This was the first
time the term “Open Access” was used, although the practices described in that document
had already been taking place in some scientific communities long before that date. The BOAI
defined OA to the literature as:

“free availability on the public internet, permitting any users to read, download, copy, distribute,
print, search, or link to the full texts of these articles, crawl them for indexing, pass them as
data to software, or use them for any other lawful purpose, without financial, legal, or technical
barriers other than those inseparable from gaining access to the internet itself. The only
constraint on reproduction and distribution, and the only role for copyright in this domain,
should be to give authors control over the integrity of their work and the right to be properly
acknowledged and cited”.

Additionally, the BOAI also described the two main ways to realise the goal of OA: by self-
archiving documents in public archives (which later came to be known as Green OA), or by
publishing in OA journals (later dubbed as Gold OA). Poynder (2018) provides a historic
overview of OA since the BOAI declaration.

Since the original BOAI declaration was first published, the discussion has continued and the
panorama of scholarly publishing and OA has greatly changed. All actors have had to adapt
in some way to the new reality. In addition, the Web gave rise to new types of academic
platforms, which further complicated the issue of access to scientific information by expanding
the access points to scientific content (e.g. Google Scholar, ResearchGate, etc.). Some of
these new platforms were quickly adopted by the scientific community and have already
become an important part of the system. These platforms will be discussed later on.

1.2. Reactions of academic institutions, funders and publishers
to OA
In the beginnings of the OA movement, a great emphasis was put on the importance of authors
self-archiving their own publications on public repositories (Harnad, 2001). Many research
institutions, which saw in self-archiving a potential solution to the journal affordability problem

                                                 2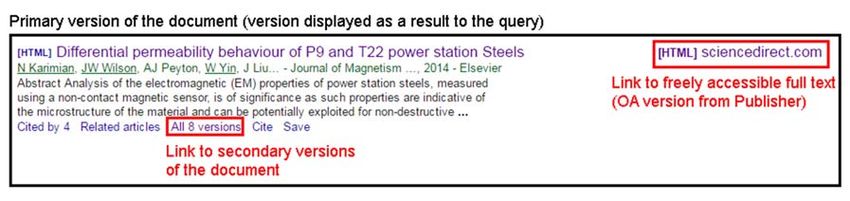
(the problem of selecting which journals to subscribe to, when economic resources are
limited), put systems in place to allow researchers to self-archive and make public their
research. These institutional repositories are under the direct control of the institution, and are
usually managed by the libraries. Additionally, other subject-specific repositories were
launched. Apart from arXiv4, the physics repository created in 1991 in Cornell University, many
other repositories are now available to researchers. ROAR5 (Registry of Open Access
Repositories) and OpenDOAR6 (Directory of Open Access Repositories) provide an
exhaustive list of these institutional and subject based OA repositories. More recently, there
has been an explosion in the growth of the so-called preprint servers, largely enabled by the
infrastructure developed by the Open Science Framework7, a project launched by the Center
for Open Science, which is a non-profit organization founded in 2013 to "increase the
openness, integrity, and reproducibility of scientific research" (Mellor, 2016, para. 6). These
servers are designed to share manuscripts that still have not gone through a process of peer
review, although they usually welcome accepted manuscripts as well.

One of the notions that has served to justify the need of OA is that money from public
institutions to fund research was not realizing its true potential, because most publicly-funded
research ended up behind publishers’ paywalls, and other researchers who could make use
of that research had no access to it. For these reasons, many funding institutions,
governments, and policy makers started to issue OA mandates to force researchers who use
their funding to make their results OA. Among these we can find the National Institutes of
Health (NIH) in the USA, the Research Councils in the United Kingdom, or the European
Research Council. In 2016, the European Union announced its resolve to make all scientific
publications based on publicly-funded research freely accessible by 2020 (Enserink, 2016).
ROARMAP8 (Registry of Open Access Repository Mandates and Policies) provides an
exhaustive database of OA mandates issued by all kinds of organizations worldwide.

Largely because of these mandates, most publishers adapted their business models, which
previously relied almost exclusively on journal subscriptions paid by academic institutions, to
business models compatible with the OA requirements mandated by funders:
   ● Gold OA journals publish all their articles as OA. Their revenue usually comes from
       charging Article Processing Charges (APC) to authors instead of charging subscription
       fees to academic libraries. There is much controversy concerning the price of these
       APCs, which range from a few hundreds of dollars, to over $5,000 per article. There
       are also Gold OA journals that do not charge APCs to authors, and instead absorb
       publishing costs in other ways (like via member subscriptions fees in the cases of
       academic societies that also publish journals). These are sometimes called Diamond
       OA or Platinum OA journals (Fuchs & Sandoval, 2013; Haschak, 2007).
   ● Hybrid OA journals maintain the subscription model, but give authors the choice to
       make their article OA, also by paying an APC (Prosser, 2003; Walker, 1998). This
       model has also been controversial, because in addition to charging APCs to authors
       to make the articles OA, they still charge libraries ever-increasing subscription costs

4
  https://arxiv.org/
5
  http://roar.eprints.org/
6
  http://www.opendoar.org/
7
  https://osf.io/
8
  http://roarmap.eprints.org/

                                                3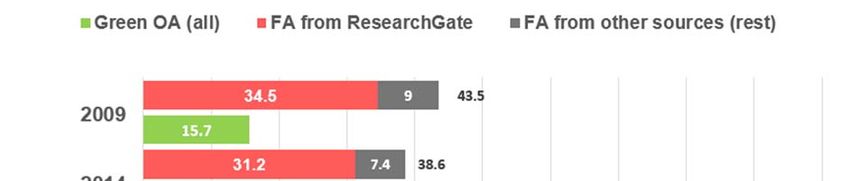
for access to the entire collection of articles published by the journals. This
          phenomenon has been dubbed “double-dipping”, because publishers seem to be
          charging twice for the same content. Some publishers, like Elsevier, claim that Hybrid
          OA articles are excluded when calculating subscription costs9, while other publishers
          compensate institutions “for the extra money they are putting into the system through
          payment of APCs” (Kingsley, 2017, para. 3) by means of the so-called “offset
          agreements”, which can take many forms. Lawson (2018) reports on the offset
          agreements made with publishers by the organization JISC Collections, which works
          on behalf of UK academic libraries.
      ●   Delayed OA journals are subscription journals that convert their articles to OA once a
          specific amount of time has passed after publication. Laakso and Björk (2013)
          analyzed a sample of 111,312 articles published in 492 journals and found that 77.8%
          of them were available from the publisher website twelve months after publication. The
          percentage reached 85.4% 24 months after publication.
      ●   Gratis Access Journals (Suber, 2008a, 2008b): journals that make their articles free-
          to-read, but don’t extend other rights to users (such as reuse or distribution) apart from
          the right to read. The publisher retains the copyright of these articles. This type of
          access is also referred to as “public access”, especially by the publishing industry
          (Crotty, 2017). Sometimes publishers intend to maintain access to these documents
          free indefinitely, but sometimes access is only free for a specific period of time
          (promotional access). Therefore, this type should not be conflated with Gold, Hybrid,
          or Delayed OA.

The costs of subscriptions and APCs are continually increasing (Tickell et al., 2017). This fact
has led a number of institutions and governments to re-negotiate the so-called Big Deals (flat
rates to access large numbers of journals published by a single publisher) so that they also
include flat rates or considerable discounts for the APCs of the articles their researchers
publish (Elsevier, 2015). In other cases, governments have refused to pay the increasing costs
that large commercial publishers demanded. This was the case with Germany and the
publisher Elsevier. A coalition of German institutions (grouped under the name project DEAL10)
decided not to renew their license to Elsevier content at the end of 2016. Elsevier subsequently
stopped allowing them to access its content, but decided to restore access shortly after, “in
good faith” while negotiations lasted. By June 2018 an agreement had still not been reached.
After Germany, other countries have followed suit: in March 2018, the Couperin consortia in
France decided to not to renew their agreement with Springer-Nature, and in May 2018 the
Bibsam Consortium in Sweden decided not to renew their agreement with Elsevier (Else,
2018).

Most journal publishers also offer alternative sharing policies for the articles that they do not
publish as OA. The freedom these policies give to researchers to self-archive their content
greatly varies by publisher and by specific journal. These policies often include embargo
periods that prohibit authors to share their research on public repositories for a period of time
after publication (from less than a year, to over two years). Despite initiatives like

9
    https://www.elsevier.com/about/our-business/policies/pricing#dipping
10
     https://www.projekt-deal.de/about-deal/

                                                    4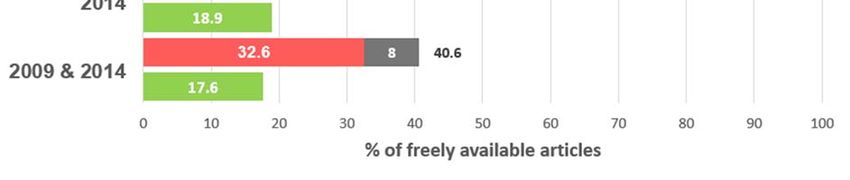
Sherpa/Romeo11 or the publisher-backed How Can I Share It12, which try to aggregate and
standardise publisher’s sharing policies, it is difficult to keep track of them because they
change over time, usually to become more restrictive regarding how, where, and when self-
archiving is permitted (Gadd & Troll Covey, 2016; Kingsley, 2013). These policies are often
arbitrary and complicated, for example allowing to share an article immediately upon
publication from the author’s personal website, but imposing an embargo to share the same
article from an institutional repository (Bolick, 2017; Tickell et al., 2017).

1.3. New players in the system
Other types of platforms, different from repositories and publishers but also with a large impact
in the free availability of scholarly literature, have been launched since the BOAI declaration.
In 2007 the academic search engine CiteSeerX13 (based on an even earlier version called
CiteSeer) was launched by Pennsylvania State University. In 2008, the academic social
networks ResearchGate14 and Academia.edu15 were launched. In 2015, the search engine
Semantic Scholar16, developed by the Allen Institute for Artificial Intelligence, was launched,
focusing mostly on the areas of Computer Science, and recently also Biomedicine. All these
platforms share the characteristic that they host copies of the full texts of scholarly documents
(automatically harvested from other sources or uploaded by users themselves) and make
them available to their users, thus becoming another source from which readers can access
scientific information.

Academic social networks (ASN) in particular have attracted a lot of attention because of how
quickly users have taken to sharing their work on them (Björk, 2016). Borrego (2017) found
that researchers from 13 Spanish universities used ResearchGate much more frequently to
upload and share their research than the repositories available at their institutions. Martín-
Martín, Orduna-Malea, Ayllón, and Delgado López-Cózar (2014; 2016), and Jamali and
Navabi (2015) studied the free accessibility to a sample of documents covered by Google
Scholar. Both studies found that ResearchGate was the source that provided the highest
number of freely available full texts. However, full text documents in ASNs are uploaded by
researchers themselves and, unlike OA repositories, these platforms do not carry out any kind
of checks to guarantee copyright compliance. This resulted in a large portion of documents
being accessible from ASN in violation of their copyright. Jamali (2017) found that 51.3% of
the non-OA documents in a sample of 500 random documents were available from
ResearchGate in violation of their copyright.

Moreover, despite some similarities, academic social networks engage in practices that clearly
set them apart from OA repositories. The ongoing dispute between publishers and
ResearchGate (Coalition for Responsible Sharing, 2017a, 2017b, 2017c) is unequivocal proof
of the instability of these platforms as sources of full texts. A related issue is that in
ResearchGate users are allowed to delete full texts of documents they have uploaded, even

11
   http://www.sherpa.ac.uk/romeo
12
   http://www.howcanishareit.com/
13
   http://citeseerx.ist.psu.edu
14
   https://www.researchgate.net
15
   http://www.academia.edu
16
   https://www.semanticscholar.org

                                               5
in the cases when the platform generates a DOI for the document (through their collaboration
with DataCite17). This entirely differs from the policies of repositories such as arXiv or socArxiv,
where the academic record is always maintained (authors cannot delete files but retain the
right to issue a retraction notice if they feel a document they deposited should no longer be
used). Full texts uploaded by a user to ResearchGate are also deleted if the user deletes
his/her account in the platform. Academia.edu also engages in practices that make it different
from repositories. This academic social network requires users to log in to their platform to
access full texts. However, perhaps because this contravenes Google Scholar’s indexing
policies18, they left open a back door so that users coming from a Google Scholar search19
would be allowed to access full texts without the need to log in. Presumably, they did this to
avoid being dropped as a source by Google Scholar, a large source of web traffic given its
huge user-base. These cases raise the need to distinguish between merely uploading a
document to the Internet (to ResearchGate, Academia.edu or to any privately managed
personal website) and depositing or archiving a document in a repository, which usually
provides more guarantees as to the long-term preservation of the documents that they host.
There is another player who is currently having a major influence in the accessibility to
scholarly literature: Sci-Hub. This website was launched in 2011 by a graduate student called
Alexandra Elbakyan, and it illegally provides access to over 60 million research articles.
Elbakyan developed a system that automatically accesses publisher websites using
credentials donated by users who work at institutions with access to paywalled journal articles.
There are reports, however, that claim that some of these credentials might have been stolen
rather than donated (Bohannon, 2016). The system then copies the full texts of articles to the
Library Genesis database (LibGen), which is the platform that hosts the articles that in turn
are provided to the users. The kind of copyright-infringing access that Sci-Hub provides is
sometimes called Robin Hood OA, Rogue OA, and Black OA (Archambault et al., 2014; Björk,
2017; Green, 2017). Despite the efforts made by large commercial publishers like Elsevier to
shut down Sci-Hub’s operations, the website remained functional at the time of this writing,
providing access to the vast majority of recently-published paywalled articles (Himmelstein et
al., 2018) and virtually providing access to all scientific publications worldwide.
1.4. Current landscape of free availability of scientific
information
To summarise the scenario described above, Figure 1 provides a representation of the main
paths by which a journal article may become freely available on the Web.
17
https://www.datacite.org/
18
https://scholar.google.com/intl/en/scholar/inclusion.html#content
19
Technically speaking, users who accessed Academia.edu with the Referer HTML request header
“https://scholar.google.com”
6Figure 1. Model of free availability of academic journal articles: Where are freely available journal articles hosted?
The figure divides articles in two different spaces: the space in which articles are not free-to-
read (to the left of the paywall) and the space in which articles are free-to-read (to the right of
the paywall).
Articles published in Gold OA journals (regardless of whether they charge APCs or not), and
articles published in OA in Hybrid journals are immediately made OA, hence their placement
in the free-to-read section of Figure 1.
Articles that are initially not free-to-read (published in toll access journals) may become free-
to-read in several ways (represented by lines going from the toll access journals box to the
free-to-read space in Figure 1):
By breaching the paywall, generating copyright-infringing availability (represented in the
figure with a red continuous line and red asterisks). This is the case of Sci-hub, which
cannot really be considered as a sustainable form of OA (van Leeuwen, Meijer, Yegros-
Yegros, & Costas, 2017).
Via self-archiving, when the journal allows it (represented by a line from the toll access
journals box to the free-to-read space). Self-archiving mostly takes place in repositories,
academic social networks, and personal websites. Repositories (both institutional or
subject-specific) usually check for copyright compliance when articles are submitted. In
personal websites and academic social networks, however, no such checks are made.
Therefore, these venues might also contain articles in violation of their copyright (Jamali,
2017). This is represented with red asterisks in Figure 1. There is also a line from Gold
and Hybrid OA journals to the self-archiving section, because OA articles can always be
self-archived.
Delayed OA, which is practiced by some journals (also represented by a line from the
toll access journals box to the free-to-read section).
7Once articles are free-to-read in any of the ways described above, they may be distributed
(legally or not) to any other part of the Web at large. For example, some platforms, like the
academic search engines CiteSeerX and Semantic Scholar harvest the full texts of articles
available in other sources, and provide a copy from their own servers.
Lastly, apart from being freely available, documents must also be discoverable in order to be
used. There are several services that address the discoverability problem, like the academic
search engines BASE20 and Google Scholar, or the browser extension Unpaywall21. Google
Scholar and Unpaywall are described in more detail in the following section. Coverage of freely
available documents varies by platform. Google Scholar, the focus of this article, serves as a
gateway for all types of sources described in Figure 1, with the exception of Sci-Hub.
1.5. Quantification of OA levels
In a scenario like the one described above, it is not surprising that the question of how much
of the scholarly literature is openly accessible (or at least freely available) has attracted much
attention, because many agents of the scholarly community are interested in its answer.
Funders are interested in the degree to which their OA mandates are being obeyed. Libraries
need to decide how to best use their acquisitions budget (whether to renew, renegotiate, or
cancel license agreements with publishers). Publishers routinely monitor how the documents
they publish are shared on the Web in order to protect their business. Countries, for their part,
want to know how much of the scientific literature published by its researchers is openly
accessible. Researchers may also be interested in the proportion of their publications that is
openly accessible, especially if this is an issue that is taken into account in the performance
evaluations to which they are subjected in their country.
Numerous studies have analyzed the levels of OA for different samples of documents,
presenting results at various levels of aggregation (publication year, subject areas, countries
of authors’ affiliations, OA types...). Methods to ascertain levels of OA include using data
collected by custom crawlers (1science database, Unpaywall data) and carrying out searches
in diverse search engines (BASE, Google, Google Scholar...). Table 1 contains information on
the sample of documents analyzed, source of OA evidence used, and OA levels found by
studies that used a source of OA evidence other than Google Scholar.
20
https://www.base-search.net/
21
http://unpaywall.org/
8Table 1.Studies that analyse OA levels using sources of OA evidence other than Google Scholar
Sample of documents OA evidence
Study Pub. Doc Date of data Levels of Methodological OA levels
Source Field Size Source
Year types collection aggregation Observations
Björk et al., Scopus All 2008 Articles 1,837 Searches on Google 2009/10 Subject areas, OA types 20.4% freely accessible (8.5%
2010 (random) fields from publisher)
Gargouri, Web of 11 1998- Articles 110,212 Custom crawler (no details 2009 Publication year, subject 20% freely accessible (average of
Larivière, Science fields 2006 given) areas, OA types entire period)
Gingras, Carr, & (random)
Harnad, 2012 = 14 2005- = 107,052 = 2011 = 24% freely accessible (average of
fields 2010 entire period). 21.4% as Green
OA, 2.4% as Gold OA
Archambault et Scopus All 1996- Articles ~ 245,000 Custom crawler: Scielo, 2013/04, OA types Calibration factor Over 50% of articles published
al., 2014 (random) fields 2013 PubMed Central, 2014/04 (1.146) applied to 2007-2012 were freely available in
ResearchGate, CiteSeerX, account for limited 2014
publisher websites, arXiv, recall of custom
repositories in ROAR and crawler
OpenDOAR
Scopus 22 2008- Articles ~ 1 million = 2014/04 Subject areas, countries = Top OA field (2011-2013): General
(random) fields 2013 (ERA) Science & Technology (90%)
Top OA countries (2008-2013):
Netherlands, Croatia, Estonia, and
Portugal (>70%)
van Leeuwen et Web of All 2009- All types Not declared DOAJ, ROAD, CrossRef, 2017 Publication year, Almost 30% of articles were OA.
al., 2017 Science fields 2014 PubMed Central, OA evidence source, Top countries: Netherlands (37%),
(all OpenAIRE countries Sweden, Ireland, and UK (34%)
records)
Smith et al., PubMed Global 2010- Articles 3,366 PubMed, manual searches 2016 OA types 29.2% OA from publisher, 27.2%
2017 (selected Health 2014 on Google Green OA, 1.3% OA from other
subject sources. Total OA: ~ 58%
heading)
Science-Metrix Web of All 2006- Not Not declared 1science database: 2016/07-09 Publication year, Calibration factor Pub. Year 2006: 50%, pub. year
Inc., 2018 Science fields 2015 declared scholarly material indexed countries, Subject areas, (1.2) applied. 2011: 60%
(all in over 180,000 websites OA types PubMed Central Top countries 2014: Brazil (74%),
records) considered Gold Netherlands (68%)
OA; ResearchGate Top fields: Health Sciences (59%)
considered Green
OA
Piwowar et al., CrossRef All All Articles 100,000 Unpaywall data 2017/05 Publication year, ResearchGate not 27.9% are OA; 44.7% for pub.
2018 (random) fields years publisher, OA types included in year 2015
Unpaywall
Web of All 2009- Articles 100,000 Unpaywall data 2017/05 Subject areas, OA types = 36.1% are OA
Science fields 2015 and
(random) reviews
Unpaywall All All All types 100,000 Unpaywall data 2017/06/05-11 OA types = 47% of documents accessed by
use logs fields years users via Unpaywall are OA
Bosman & Web of All 2010- Articles 12.3 million Unpaywall data integrated 2017/12/20 – Publication year, Subject ResearchGate not Almost 30% OA for pub. year
Kramer, 2018 Science fields 2017 and in Web of Science 2018/01/05 areas, languages, included. Preprints 2016
(all reviews countries, institutions, not included
records) funders
91.5.1 Google Scholar as a source of OA evidence
Google Scholar has become one of the most widely used tools for researchers to search
scientific information (Bosman & Kramer, 2016; Mussell & Croft, 2013; Nicholas et al., 2017;
Van Noorden, 2014a). By automatically parsing the entire academic web instead of indexing
only some specific sources, Google Scholar’s coverage is much more extensive than the
coverage of any other multidisciplinary commercial databases like Web of Science and
Scopus. Although there are not official figures on the size of its document base, it was
estimated in approximately 170 million records in 2014 (Orduna-Malea, Ayllón, Martín-Martín,
& Delgado López-Cózar, 2015). Recently, Google Scholar’s chief engineer, Anurag Acharya,
has declared that the size of its document base is “larger than the estimates that are out there”
(Rogers, 2017).
An important feature of Google Scholar is that it usually provides links to freely available
versions of the documents displayed in its results page, also when the document is not openly
accessible from the publisher website. Unfortunately, despite the wealth of information
available in Google Scholar, the platform does not provide a way to easily extract and analyse
its data (something like an open API), reportedly because the agreements that Google Scholar
had to reach with publishers to access their content preclude this (Van Noorden, 2014b).
Perhaps because of this limitation, all OA-related studies based on Google Scholar data either
used very small samples of documents, mostly focusing on specific case studies, or the
samples of documents they analyzed were not random because the selection of documents
relied on searches in the platform, and Google Scholar is known to rank documents primarily,
although not only, on descending order of citations (Martin-Martin, Orduna-Malea, Harzing, &
Delgado López-Cózar, 2017). Moreover, most of these studies only analyzed the links to freely
accessible full texts that are displayed beside the primary version of the document in Google
Scholar, but not the links available in the secondary versions (see Figure 2). Table 2 contains
information on the sample of documents analyzed, source of OA evidence used, and OA levels
found by studies that used Google Scholar as a source of OA evidence.
These studies all pointed to the value of Google Scholar as a source of free availability of
scientific literature, but were limited in scope and thematically. Thus, it is still missing in the
literature a relatively large-scale study of the free availability of scientific publications that can
be identified through Google Scholar. This paper aims at filling this gap.
10Table 2. Studies that analyse OA levels using Google Scholar as a source of OA evidence
Sample of documents OA evidence
Study Date of OA levels
Pub. Doc Levels of
Source Field Size Source data
Year types aggregation
collection
Christianson, Journals in CSA’s Ecology 1945- Articles 840 Google Scholar 2005/03 Only total figure 9% of the articles were freely accessible from Google
2007 Ecology Abs. and 2005 Scholar
JCR: Ecology
(random)
Norris, Web of Science Ecology, Appl. 2003 Articles 4,633 OAIster, Not declared Subject area Economics: 65%; Appl. Math.: 59%; Ecology: 53%;
Oppenheim, & (selected journals) Math., Sociology, OpenDOAR, Sociology: 21%. Overall OA: 49%
Rowland, 2008 Economics Google, Google
Scholar
Pitol & De Web of Science Psychology, 2006- Articles 982 Google Scholar Not declared OA version 70% of documents were freely accessible in some form
Groote, 2014 (organization Chemistry, 2011 provider, OA
search) Electrical type
Engineering, Earth
Sciences
Khabsa & Giles, Microsoft All fields All Not 1,500 Google Scholar 2013/01 Subject areas Top OA categories: Computer Science (50%),
2014 Academic Search years specified (100x15) Multidisciplinary (43%), Economics & Business (42%).
(random sample) Overall OA: 24%
Jamali & Google Scholar All fields 2004- All except 8,310 Google Scholar 2014/04 Subject areas, Top OA category: Life Sciences (66.9%). Lowest OA
Nabavi, 2015 (topic search) 2014 citations OA types category: Health Sciences (59.7%). Overall OA: 57.3%
and
patents
Laakso & Scopus Information 2010- Articles 1,515 Google, Google 2015/02 Journal, OA 60% of the articles were freely accessible from Google
Lindman, 2016 (selected journals) Systems 2014 Scholar types Scholar
Martín-Martín et Google Scholar All fields 1950- All types 64,000 Google Scholar 2014/05 Publication year 40% of documents were freely accessible for the whole
al., 2016 (pub. year search) 2013 period. Over 66% considering only pub. years 2000-
2009
Teplitzky, 2017 Pangaea Earth Sciences 2010, All types 744+482 Google Scholar 2016/05 OA types 75% of documents in pub. year 2010, and 72% in pub.
(topic search) 2015 = 1,226 year 2015
Abad-García, Web of Science Health 2012- Articles 762 OpenAIRE, BASE, Not declared Only total figures 46.3% of the documents were freely available from some
González- (funding search) 2014 Recolecta, Google source. Recall of Google was 93.5%
Teruel, & Scholar
González-
Llinares, 2018
Mikki, Ruwehy, Web of Science Climate and All All types 639 Google Scholar Not declared Publication 74% of the documents were freely accessible
Gjesdal, & (topic search) ancient societies years years
Zygmuntowska,
2018
Laakso & Publication lists of Ethics 2010- Articles 1,682 Google Scholar 2017 Publication 56% of the documents were freely accessible
Polonioli, 2018 ethics researchers 2015 years, OA types
111.6. Research questions
This paper mainly intends to ascertain the suitability of the data available in Google Scholar
to gauge the levels of adoption of OA in scientific journal articles, across all subject categories
and countries, thus overcoming the limitations related to sample selection and sample size of
the previous OA-related studies that used this source of data. Specifically, this article aims to
answer the following questions:
RQ1. How much of the recently published scientific literature is freely available according
to the data available in Google Scholar, by year of publication, subject categories,
and country of affiliation of the authors?
RQ2. How much is openly accessible in a sustainable and legal way, and what proportion
is freely available but does not meet these criteria?
RQ3. What is the distribution of freely available documents by web domains?
2. Methods
The three main citation indexes of the Web of Science Core Collection (Science Citation Index
Expanded [SCIE], Social Sciences Citation Index [SSCI], and Arts & Humanities Citations
Index [A&HCI]) were used to select the sample of documents analysed in this study. All
documents with a DOI indexed in either the SCIE, SSCI, or the A&HCI, and published in 2009
or 2014 were selected on the 19th of May, 2016. The rationale behind choosing these two
years was that we wanted to analyse a large sample of documents from various publication
years, but we also wanted to keep the sample manageable because of the difficulty of
extracting data from Google Scholar. At the time of data collection, 2014 was the most recent
year in which most articles scheduled to become OA after an embargo (Delayed OA) had
already become OA. The data from articles published in 2009 would give us information on
the trend.
The records of these documents were extracted from the local version of the Web of Science
database available at the Centre for Science and Technology Studies (CWTS) in Leiden
University. A total of 2,610,305 records were extracted, 1,080,199 from 2009, and 1,530,106
from 2014. We decided to use this source (as opposed to the CrossRef registry) because it
would later enable us to carry out detailed analyses of the data, with breakdowns by subject
categories, country affiliations, publication years, and journals.
It is worth noting that the number of Web of Science documents in these two years (2009 and
2014) at the time of writing this article had increased from 2,610,305 to 2,893,175. This could
have been caused by backwards indexing of new documents, or by the addition of DOIs to
records that previously did not contain one in the Web of Science database.
Each of these documents was searched on Google Scholar, using a non-documented method
to search documents by their DOI. Example of query for the document with DOI
“10.1010/j.jmmm.2013.09.059”:
https://scholar.google.com/scholar_lookup?doi=10.1010/j.jmmm.2013.09.059
12Given that Google Scholar does not provide an API to query its database, a custom Python
script was developed to carry out a query for each of the DOIs in our sample and scrape the
data from the results page. Queries were distributed across a pool of different IP addresses
to minimise the amount of CAPTCHAs (Completely Automated Public Turing test to tell
Computers and Humans Apart) that Google Scholar requests users to solve from time to time.
However, this approach did not entirely suppress the appearance of CAPTCHAs, which were
solved manually when the system requested them. Additionally, when it was detected that
Google Scholar provided a link to a freely accessible full text of a document, the link to the
secondary versions of the same document was also followed through, in order to extract all
the additional links to freely accessible full texts of the document that Google Scholar might
have found (Figure 2). Searches were carried out off-campus to avoid retrieving links to full
texts that are only accessible through library subscriptions. The process of extracting the data
from Google Scholar was very time-consuming, taking over three months (from the end of May
to the end of August of 2016) to collect data for the 2,610,305 selected documents.
Figure 2. Example of primary and secondary versions of an article in Google Scholar
Using the search strategy described above, Google Scholar retrieved results for 99.3% of the
documents searched. The system did not retrieve any results for 0.7% of the DOIs searched.
However, this does not necessarily mean that these documents were not covered by Google
Scholar. These documents might have been covered by Google Scholar without a DOI, and
therefore they might have been found using other search strategies, for example, searching
by the title of the document. However, we did not try other search strategies, as we considered
the results could not be overly affected by these missing documents.
13A test was also carried out to assess the accuracy of the results retrieved from Google Scholar.
That is, whether or not we had actually retrieved data about the documents we were looking
for. In order to do this, we compared the bibliographic information available from Web of
Science, with the data extracted from Google Scholar. The match was considered successful
if at least one of the following criteria were met:
● Similarity of document titles in the two sources of data (based on the Levenshtein
distance of the two strings of text) was equal or greater than 0.8 (similarity is 1 when
the titles are exactly the same, and 0 when they are completely different).
● Similarity of document titles was between 0.6 and 0.8 AND the documents shared the
same first author AND the same publication year.
● Same first author and same publication year, and title of document in Google Scholar
was not in English. In some cases when the journal publishes in a language other than
English, the title provided by Google Scholar is the original title, whereas in Web of
Science, the title of the document is always displayed in English (even when the
document itself is not written in English). In these cases the title similarity was very
low, and using it resulted in a significant number of false negatives.
Based on these criteria, we classified as good matches 96% of the documents in our sample
(2.51 million documents). The proportion of good matches was slightly higher if we only
considered documents of the type “article” or “review” (97.6%). Therefore, we decided to
analyze only the articles and reviews in our sample that we had considered as good matches,
a total of 2,269,022 documents.
Google Scholar does not provide any information on the type of source that is providing free
access to the full text of a document. For this reason, we combined information from a variety
of sources in order to provide more detailed information about the type of free access that
Google Scholar had been able to detect. We classified each full text link in one of the following
categories:
● Publisher: when the full text is hosted on a publisher website, or on journal aggregators
such as JSTOR or SciELO. Data from the oaDOI dataset from 18 August 2017, DOAJ
(Directory of Open Access Journals), and the Ulrich’s Directory of Journals was used
to create a list of websites where journal publishers make their articles available.
● Repository: when the full text is hosted in a repository, as defined by the Registry of
Open Access Repositories (ROAR), and the Directory of Open Access Repositories
(openDOAR).
● Research Institutions: when the full text is hosted in the web domain of a research
institution (universities, research centers, institutes), excluding the website of the
institutional repository. That is to say, this category mostly contains personal websites
of individual researchers, research groups, departments, etc. inside an academic
domain. In order to determine which domains belonged to academic institutions, a list
of academic domains was also extracted from openDOAR.
● Academic Social Networks: in this category we only classified the full texts available
from ResearchGate and Academia.edu.
● Harvesters: websites that copy full texts from other sources and make them available
from their own servers. In this category we classified full texts hosted in the search
engines CiteSeerX and Semantic Scholar, and the British CORE service.
● Non-categorized: any website that could not be classified in the previous categories.
14After combining the information from the sources described above, there were still thousands
of web domains that had not been classified. Therefore, we decided to manually check the
hosts with a higher number of occurrences in our sample that still had not been categorised.
Specifically, we checked the domains in which Google Scholar had found 100 or more full
texts of documents in our sample, and the hosts that Google Scholar more frequently selected
as the primary full text version (because these hosts would likely be publishers, as declared
in Google Scholar’s publisher guidelines22). Thus, approximately 1,000 hosts were classified
after visiting the website and checking it manually. The rest of the web domains that had not
been classified were considered as “non-categorized”. The specific categorisation of hosts
used in this study is available in the complementary material to this article23.
In this article we make a distinction between Freely Available (FA) documents, and OA
documents. We consider that all documents for which Google Scholar provided a link to a FA
version of the document, regardless of the legality under which they were shared and their
sustainability over time, are FA. When FA documents meet certain additional criteria
(described below) they were also considered OA.
Unfortunately, there is no clear consensus regarding the minimum rights that any user should
have in order to be able to consider a document OA. Some definitions, like the one declared
by the BOAI or the Open Definition24 are clear in that mere right to access the document free
of charge is not enough to consider a document OA. They consider it necessary that the
license extends other rights to all users, like redistribution, modification, or application for any
lawful purpose. The reality, however, is that in many cases documents are made FA under
licenses that fail to meet one or several of these criteria. For example, there are Creative
Commons licenses that include Non-Commercial and/or Non-derivatives clauses, thus limiting
the ways in which a document can be reused. The Elsevier user license25 (the license under
which Elsevier makes FA after an embargo period articles published in journals included in its
Open Archive26) prohibits redistribution of the documents and reuse for commercial purposes.
Moreover, there is a large portion of articles that publishers make available free of charge,
without extending any other rights to users other than access. This is usually called “public
access” in the publishing industry (Crotty, 2017). These issues have led some researchers to
think in terms of degrees of openness, instead of considering OA a binary quality (Chen &
Olijhoek, 2016).
Apart from the conceptual issues, there are also practical limitations for classifying documents
as OA. In many cases, especially when we are talking about Green OA, there is no license
attached to the document, or it is attached in a way that cannot be easily detected by
automated systems. Fortunately, publishers are increasingly taking to sending license
information to CrossRef (which makes these data openly accessible) or they display it as
metadata in their own websites.
22
https://scholar.google.com/intl/en/scholar/publishers.html#policies
23
https://osf.io/fsujy/
24
http://opendefinition.org/
25
https://www.elsevier.com/open-access/userlicense/1.0
26
https://www.elsevier.com/about/open-science/open-access/open-archive
15For the reasons described above, in this article we use a more inclusive definition of OA than
the one declared by the BOAI or the Open Definition, and we instead set our focus on
sustainability and legality. Specifically, this article considers the following types of OA:
Gold OA: when the journal that published the article was listed in DOAJ.
Hybrid OA: when the journal was not listed in DOAJ but an OA license was recorded
in the metadata available in CrossRef, and the Open license came into effect at the
same time the article was published (OA immediately upon publication). We
considered as OA licenses all Creative Commons licenses, the Elsevier OA user
license, and other OA licenses registered in CrossRef by publishers like the ASPB27,
ACS28, and IEEE29. Our operational definition of “OA immediately upon publication”
was that the value recorded in the delay-in-days field of the License element available
in the CrossRef metadata (defined as the “[n]umber of days between the publication
date of the work and the start date of this license”30), should be less than 30 (one
month). We decided to set this limit instead of delay-in-days = 0 because we noticed
that for some articles published as OA, the Open license came into effect a few days
after publication, and we considered that these articles should also be classified as
“OA immediately upon publication”.
Delayed OA: when the journal was not listed in DOAJ but an Open Access license was
recorded in the metadata available in CrossRef, and the Open license came into effect
more than 30 days after the publication of the article.
Bronze OA: when the full text is FA from the publisher, but the journal is not listed in
DOAJ and no OA license could be found. This category includes gratis / public access
from the publisher (free to read but the publisher retains copyright), but might also
contain masked Hybrid or Delayed OA (when the publishers fail to disclose an OA
license in machine-readable form), and possibly even some masked Gold OA (if a full
OA journal is not listed in DOAJ and the publisher does not discloses an OA license).
Green OA: the documents that are FA from institutional or subject-based repositories,
as listed in ROAR and OpenDOAR.
All the documents that were available from sources other than the publisher website and
repositories (such as websites of research institutions excluding the repository, academic
social networks, harvesters, and the rest) were only considered as FA, and not OA. We took
this conservative measure because we wanted to make a distinction between more legally
sound and sustainable sources (publishers and repositories) which are more likely to be
copyright-compliant and usually implement long-term preservation plans for the documents
they host, and less stable sources (personal websites, academic social networks…) where
any document (regardless of its copyright status) can be uploaded and deleted at any time.
Lastly, Google Scholar does not provide data on the publication stage of the freely accessible
versions that it finds: that is, whether the free version is a preprint (before peer-review), an
author’s accepted manuscript (after peer-review, but before typesetting), or the journal’s
version of record (final published article). Although this is an interesting aspect of OA
27
https://aspb.org
28
https://pubs.acs.org
29
https://www.ieee.org
30
https://github.com/CrossRef/rest-api-doc/blob/master/api_format.md
16publishing, identifying the type of version would have required accessing the full text of each
individual article, and so it falls outside the scope of this study.
Data was processed and analyzed using the R programming language. The percentages of
OA documents were computed by publication year, subject category, country of affiliation
(considering all co-authors), and journal. The data used in this study is openly available
(Martín-Martín, Costas, van Leeuwen, & Delgado López-Cózar, 2018). This will facilitate the
creation of custom analyses that focus on the research done in specific countries, specific
fields, specific journals, etc.
3. Results
3.1. General overview
Google Scholar provided links to FA full texts for 54.7% of our sample of documents (Figure
3). If we break down the results by year of publication, documents published in 2014 show a
slightly higher percentage of FA documents (55.8%) than documents published in 2009 (53%),
even though the number of documents published in 2014 (1,331,795) was larger than the
number of documents published in 2009 (937,227), and the fact that at the time of data
collection documents from 2014 had had considerably less time to be made freely available
on the Web than documents from 2009.
Figure 3. Overall OA and FA levels found in Google Scholar, by year of publication and both years combined
If we consider the two years under study (Figure 3), we can see that 23.1% of the documents
are FA from publisher websites (Gold + Hybrid + Delayed + Bronze). It is worth noting that
most of the documents available from publishers are Bronze OA, which are usually made
accessible under very restrictive reuse terms. However, it seems like Gold and Hybrid are
gaining importance, judging by the increment from 3.3% to 10.1% from 2009 to 2014 of Gold
OA, and from 0.5% to 1.5% for Hybrid OA. Bronze OA decreased from 14.1% to 12.6%, and
Delayed OA decreased as well (from 2% in 2009 to 1.1% in 2014).
Figure 3 displays OA provided by the publisher (Gold, Hybrid, Delayed, Bronze), Green OA,
and FA from other sources. However, in the cases where a document is available from several
17types of sources, publisher-provided OA is given preference over Green OA and FA from other
sources. In a similar manner, Green OA versions are given preference over FA from other
sources. Therefore, Figure 3 does not display the total percentages of Green OA and FA from
other sources. These are displayed in Figure 4.
The proportion of documents available as Green OA (repositories) was higher in the
publication year 2014 (18.9%) than in 2009 (15.7%), as displayed in Figure 4. However, the
number of documents that were available from repositories and not from the publisher
(displayed in Figure 3) was slightly higher in the publication year 2009 (11.3%) than in 2014
(10.5%).
Figure 4. Total percentage of Green OA and FA found in Google Scholar, by year of publication and both years
combined
Apart from publisher websites and repositories, there is a large fraction of documents that are
available from other sources (mainly the academic social network ResearchGate, but also
personal websites, and harvesters). Google Scholar found that 43.5% of the documents in the
sample published in 2009 were available from other sources (Figure 4). This percentage was
lower in the publication year 2014 (38.6%). Nevertheless, in both years this percentage is
larger than the sum of what all publishers and repositories together provided. Moreover, a
considerable portion of these documents are FA only from these other sources (that is, these
documents are not openly accessible from the publisher or from repositories). This figure
remains relatively stable in the two publication years (21.8% in 2009, and 20% in 2014), as
can be observed in Figure 3.
The predominance of sources other than publishers and repositories can also be observed if
we take a look at the number of freely available documents by website (Table 3). By far, the
source that provided more freely available full texts was the academic social network
ResearchGate, which by itself provided access to 32.6% of the documents in our sample
(738,573). If we compare this figure to the percentage of documents provided as OA by
publishers available in Figure 3 (23.1%, approx. 525,000 documents), we see that
ResearchGate provided access to more documents in our sample than all publishers together.
Moreover, 32.7% of the documents available from ResearchGate (over 240,000) were not
freely available from any other source.
18Table 3 also shows how often Google Scholar displays links from each host as the primary full
text links. This is interesting because the primary link is likely to be the link that most Google
Scholar users click to access the full text of an article. Again, ResearchGate is first in the rank,
followed by Pubmed Central (www.ncbi.nlm.nih.gov) and arXiv. However it is worth noting that
some hosts that provided many FA documents (europepmc.org, academia.edu,
citeseerx.ist.psu.edu) are rarely selected by Google Scholar as the primary full text links (only
in 10.3%, 14.1%, and 9.3% of the cases, respectively), meaning that the documents these
platforms provide are also available from other platforms which are placed higher in Google
Scholar’s host precedence rules. Regarding these precedence rules, the data in Table 3
shows that Google Scholar does indeed tend to select the publisher version as the primary
version whenever it is an option (as stated in its indexing policies). Most publisher websites
are selected as the primary full text version in over 90% of the cases. The exceptions seem to
be Springer and BioMed Central, which are only selected as the primary version in about 45%
of the cases. Lastly, it appears that Google Scholar chooses the arXiv repository even over
most publishers, as this repository is selected as the primary source of full text in 99.9% of the
cases. This means that when an article is openly accessible from arXiv, Google Scholar
always chooses the arXiv version as the primary full text version, presumably even when the
article is also openly accessible from the publisher.
Table 3. Top 20 websites according to the number of FA full texts they host.
Host Type # of FA % as only # of FA as % as primary
documents FA provider primary version version
www.researchgate.net Social network 738,573 32.7 323,372 43.8
europepmc.org Repository 177,930 5.1 18,312 10.3
www.academia.edu Social network 168,485 4.2 23,681 14.1
www.ncbi.nlm.nih.gov Repository 165,403 1.8 74,109 44.8
citeseerx.ist.psu.edu Harvester 120,378 1.8 11,203 9.3
arxiv.org Repository 72,862 25.0 72,753 99.9
onlinelibrary.wiley.com Publisher 49,887 32.8 47,712 95.6
www.sciencedirect.com Publisher 47,356 26.1 43,825 92.5
pdfs.semanticscholar.org Harvester 38,164 1.0 2,790 7.3
journals.plos.org Publisher 37,984 12.5 37,380 98.4
link.springer.com Publisher 35,295 6.2 15,335 43.4
www.biomedcentral.com Publisher 27,400 2.1 12,328 45.0
www.nature.com Publisher 23,726 26.1 21,699 91.5
downloads.hindawi.com Publisher 18,566 38.8 18,565 100.0
core.ac.uk Harvester 15,344 1.4 769 5.0
pubmedcentralcanada.ca Repository 14,286 1.0 461 3.2
hal.archives‐ouvertes.fr Repository 11,293 10.7 5,530 49.0
www.mdpi.com Publisher 11,084 12.9 11,083 100.0
www.infona.pl Repository 10,060 41.4 6,132 61.0
www.tandfonline.com Publisher 8,973 61.2 8,730 97.3
193.2. Analysis by disciplines
We mapped the original WoS subject categories to more general classification schemes: one
containing 7 broad subject areas, and the other containing 35 scientific disciplines. The
schemes were introduced by Tijssen et al. (2010), and the specific correspondence with WoS
categories is available in the complementary materials.
There is a high inter-area variability, ranging from 60% overall availability in the Medical and
Life Sciences, to 32.3% overall availability in Law, Arts, and Humanities (Figure 5).
Multidisciplinary journals achieve a 93.6% overall availability, which is natural if we consider
that this category includes Gold OA multidisciplinary mega-journals such as PLOS ONE.
Figure 5. OA and Free Availability levels found in Google Scholar, by broad subject areas.
If we descend to the level of disciplines (Figure 6) we can see that Bronze OA is usually the
predominant type in which publishers provide OA. In 28 out of the 35 disciplines shown in
Figure 6, the percentage of Bronze OA is higher than the sum of Gold, Hybrid, and Delayed
OA. Bronze OA is especially important in Basic Life Sciences, Biomedical Sciences, and
Clinical Medicine.
20Figure 6. OA and Free Availability levels found in Google Scholar, by scientific discipline
Figure 6 also shows the percentage of articles in Green OA that are not openly accessible
from the publisher: Green OA (only)31. In 19 out of the 35 disciplines, the number of documents
that are accessible only through Green OA was higher than the sum of Gold, Hybrid, Delayed,
and Bronze OA. The disciplines with a larger share of documents in the Green OA (only)
category are Astronomy and Astrophysics (56.2%), and Mathematics (21.1%).
If we consider FA only (the cases when documents were only available from sources other
than publishers and repositories), Figure 6 shows that this is the most frequent type of
availability in most disciplines. In 23 out of the 35 disciplines, FA (only) achieves higher
percentages than Gold, Hybrid, Delayed, Bronze, and Green combined. In four of these
disciplines (Management and Planning, Political Science and Public Administration, Energy
Science and Technology, and Civil Engineering and Construction), more than two thirds of the
documents that were FA in some form, were only available from sources other than the
publisher or repositories.
Lastly, it is worth noting that there is a large degree of intra-discipline variability as well. Figure
A2 in the complementary materials32 displays the correspondence between the 35 disciplines
in Figure 6, and the subject categories used by the Web of Science. This figure shows that in
31
Total percentages of Green OA by subject categories (including the cases when the article is also
openly accessible from the publisher) are available from the complementary materials and in the web
application.
32
https://osf.io/fsujy/
21You can also read