Discovering Motifs in Ranked Lists of DNA Sequences
←
→
Page content transcription
If your browser does not render page correctly, please read the page content below
Discovering Motifs in Ranked Lists of DNA
Sequences
Eran Eden1*, Doron Lipson1, Sivan Yogev1,2, Zohar Yakhini1,3*
1 Computer Science Department, Technion, Haifa, Israel, 2 IBM Research Laboratories, Haifa, Israel 3 Agilent Laboratories, Santa Clara, California, United States of America

Computational methods for discovery of sequence elements that are enriched in a target set compared with a
background set are fundamental in molecular biology research. One example is the discovery of transcription factor
binding motifs that are inferred from ChIP–chip (chromatin immuno-precipitation on a microarray) measurements.
Several major challenges in sequence motif discovery still require consideration: (i) the need for a principled approach
to partitioning the data into target and background sets; (ii) the lack of rigorous models and of an exact p-value for
measuring motif enrichment; (iii) the need for an appropriate framework for accounting for motif multiplicity; (iv) the
tendency, in many of the existing methods, to report presumably significant motifs even when applied to randomly
generated data. In this paper we present a statistical framework for discovering enriched sequence elements in ranked
lists that resolves these four issues. We demonstrate the implementation of this framework in a software application,
termed DRIM (discovery of rank imbalanced motifs), which identifies sequence motifs in lists of ranked DNA sequences.
We applied DRIM to ChIP–chip and CpG methylation data and obtained the following results. (i) Identification of 50
novel putative transcription factor (TF) binding sites in yeast ChIP–chip data. The biological function of some of them
was further investigated to gain new insights on transcription regulation networks in yeast. For example, our
discoveries enable the elucidation of the network of the TF ARO80. Another finding concerns a systematic TF binding
enhancement to sequences containing CA repeats. (ii) Discovery of novel motifs in human cancer CpG methylation
data. Remarkably, most of these motifs are similar to DNA sequence elements bound by the Polycomb complex that
promotes histone methylation. Our findings thus support a model in which histone methylation and CpG methylation
are mechanistically linked. Overall, we demonstrate that the statistical framework embodied in the DRIM software tool
is highly effective for identifying regulatory sequence elements in a variety of applications ranging from expression
and ChIP–chip to CpG methylation data. DRIM is publicly available at http://bioinfo.cs.technion.ac.il/drim.
Citation: Eden E, Lipson D, Yogev S, Yakhini Z (2007) Discovering motifs in ranked lists of DNA sequences. PLoS Comput Biol 3(3): e39. doi:10.1371/journal.pcbi.0030039

                                                                                          profile has gained much attention in the literature. Any
Introduction
                                                                                          approach to motif discovery must address several fundamen-
Background                                                                                tal issues. The first issue is the way by which motifs are
   This paper examines the problem of discovering ‘‘interest-                             represented. There are several strategies for motif represen-
ing’’ sequence motifs in biological sequence data. A widely                               tation: using a k-mer of IUPAC symbols where each symbol
accepted and more formal definition of this task is: given a
                                                                                          represents a fixed set of possible nucleotides at a single
target set and a background set of sequences (or a background
                                                                                          position (examples of methods that use this representation
model), identify sequence motifs that are enriched in the target set
                                                                                          include REDUCE [3], YMF [4,5], ANN-SPEC [6], and a
compared with the background set.
                                                                                          hypergeometric-based method [7]) or using a position weight
   The purpose of this paper is to extend this formulation and
to make it more flexible so as to enable the determination of                              matrix (PWM), which specifies the probability of observing
the target and background set in a data driven manner.                                    each nucleotide at each motif position (for example MEME
   Discovery of sequences or attributes that are enriched in a                            [8], BioProspector [9], MotifBooster [10], DME-X [11], and
target set compared with a background set (or model) has                                  AlignACE [12]). Both representations assume base position
become increasingly useful in a wide range of applications in                             independence. Alternatively, higher order representations
molecular biology research. For example, discovery of DNA                                 that capture positional dependencies have been proposed
sequence motifs that are overabundant in a set of promoter
regions of co-expressed genes (determined by clustering of                                Editor: Ernest Fraenkel, Massachusetts Institute of Technology, United States of
expression data) can suggest an explanation for this co-                                  America
expression. Another example is the discovery of DNA                                       Received July 25, 2006; Accepted January 5, 2007; Published March 23, 2007
sequences that are enriched in a set of promoter regions to
                                                                                          Copyright: Ó 2007 Eden et al. This is an open-access article distributed under the
which a certain transcription factor (TF) binds strongly,                                 terms of the Creative Commons Attribution License, which permits unrestricted
inferred from chromatin immuno-precipitation on a micro-                                  use, distribution, and reproduction in any medium, provided the original author
                                                                                          and source are credited.
array (ChIP–chip) [1] measurements. The same principle may
be extended to many other applications such as discovery of                               Abbreviations: ChIP–chip, chromatin immuno-precipitation on a microarray;
                                                                                          DRIM, discovery of rank imbalanced motifs; mDIP, methyl-DNA immunoprecipita-
genomic elements enriched in a set of highly methylated CpG                               tion; mHG, minimal hypergeometric; OC, other condition; TF, transcription factor;
island sequences [2].                                                                     TFBS, transcription factor binding sites; YPD, rich media condition
   Due to its importance, this task of discovering enriched                               * To whom correspondence should be addressed. E-mail: eraneden@cs.technion.ac.
DNA subsequences and capturing their corresponding motif                                  il or eraneden@gmail.com (EE), zohar_yakhini@agilent.com (ZY)

        PLoS Computational Biology | www.ploscompbiol.org                          0508                                         March 2007 | Volume 3 | Issue 3 | e39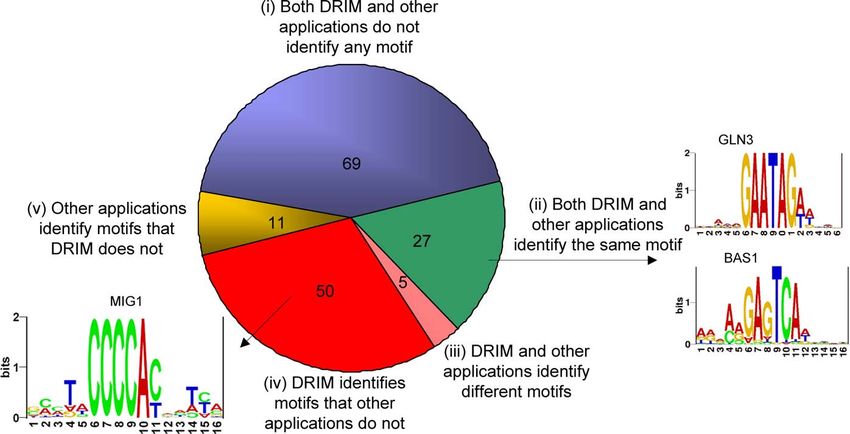
Discovering Motifs in Ranked Lists

Author Summary                                                                 and background sets. Many methods rely on the user to provide
                                                                               these two sets and search for motifs that are overabundant in
A computational problem with many applications in molecular                    the former set compared with the latter. The question of how
biology is to identify short DNA sequence patterns (motifs) that are           to partition the data into target and background sets is left to
significantly overrepresented in a target set of genomic sequences             the user. However, the boundary between the sets is often
relative to a background set of genomic sequences. One example is              unclear and the exact choice of sequences in each set
a target set that contains DNA sequences to which a specific                   arbitrary. For example, suppose that one wishes to identify
transcription factor protein was experimentally measured as bound
                                                                               motifs within promoter sequences that constitute putative
while the background set contains sequences to which the same
                                                                               TFBS. An obvious strategy would be to partition the set of
transcription factor was not bound. Overrepresented sequence
motifs in the target set may represent a subsequence that is                   promoter sequences into target and background sets accord-
molecularly recognized by the transcription factor. An inherent                ing to the TF binding signal (as measured by ChIP–chip
limitation of the above formulation of the problem lies in the fact            experiments). The two sets would contain the sequences to
that in many cases data cannot be clearly partitioned into distinct            which the TF binds ‘‘strongly’’ and ‘‘weakly,’’ respectively. A
target and background sets in a biologically justified manner. We              motif detection algorithm could then be applied to find
describe a statistical framework for discovering motifs in a list of           motifs that are overabundant in the target set compared with
genomic sequences that are ranked according to a biological                    the background set. In this scenario, the positioning of the
parameter or measurement (e.g., transcription factor to sequence               cutoff between the strong and weak binding signal is
binding measurements). Our approach circumvents the need to
                                                                               somewhat arbitrary. Obviously, the final outcome of the
partition the data into target and background sets using arbitrarily
set parameters. The framework is implemented in a software tool
                                                                               motif identification process can be highly dependent on this
called DRIM. The application of DRIM led to the identification of              choice of cutoff. A stringent cutoff will result in the exclusion
novel putative transcription factor binding sites in yeast and to the          of informative sequences from the target set while a
discovery of previously unknown motifs in CpG methylation regions              promiscuous cutoff will cause inclusion of nonrelevant
in human cancer cell lines.                                                    sequences—both extremes hinder the accuracy of motif
                                                                               prediction. This example demonstrates a fundamental diffi-
                                                                               culty in partitioning most types of data. Several methods
(e.g., HMM and Bayesian networks motif representations                         attempt to circumvent this hurdle. For example, REDUCE [3]
[13]). While these representations circumvent the position                     uses a regression model on the entire set of sequences.
independence assumption, they are more vulnerable to                           However, it is difficult to justify this model in the context of
overfitting and lack of data for determining model param-                       multiple motif occurrence (as explained below). In other
eters. The method described in this paper uses the k-mer                       work, a variant of the Kolmogorov-Smirnov test was used for
model with symbols above IUPAC.                                                motif discovery [24]. This approach successfully circumvents
   The second issue is devising a motif scoring scheme. Many                   arbitrary data partition. However, it has other limitations
strategies for scoring motifs have been suggested in the                       such as the failure to address multiple motif occurrences in a
literature. One simple yet powerful approach uses the                          single promoter, and the lack of an exact characterization of
hypergeometric distribution for identifying enriched motif                     the null distribution. Overall, the following four major
kernels in a set of sequences and then expanding these motifs                  challenges in motif discovery still require consideration: (c1)
using an EM algorithm [7]. The framework described in this                     the cutoff used to partition data into a target set and
paper is a natural extension of the approach of [7]. YMF [4,5]                 background set of sequences is often chosen arbitrarily; (c2)
is an exhaustive search algorithm which associates each motif                  lack of an exact statistical score and p-value for motif
with a z-score. AlignACE [12] uses a Gibbs sampling algorithm                  enrichment. Current methods typically use arbitrarily set
for finding global sequence alignments and produces a MAP                       thresholds or simulations, which are inherently limited in
score. This score is an internal metric used to determine the                  precision and costly in terms of running time; (c3) a need for
significance of an alignment. MEME [8] uses an expectation                      an appropriate framework that accounts for multiple motif
maximization strategy and outputs the log-likelihood and                       occurrences in a single promoter. For example, how should
relative entropy associated with each motif.                                   one quantify the significance of a single motif occurrence in a
   Once a scoring scheme is devised, a defined motif search                     promoter against two motif occurrences in a promoter?
space is scanned (either heuristically or exhaustively) and                    Linear models [3] assume that the weight of the latter is
motifs with significantly high scores are identified. To                         double that of the former. However, it is difficult to justify
determine the statistical significance of the obtained scores,                  this approach since biological systems do not necessarily
many methods resort to simulations or ad hoc thresholds.                       operate in such a linear fashion. Another issue related to
Several excellent reviews narrate the different strategies for                 motif multiplicity is low complexity or repetitive regions.
motif detection and use quantitative benchmarking to                           These regions often contain multiple copies of degenerate
compare their performance [14–18]. A related aspect of                         motifs (e.g., CA repeats). Since the nucleotide frequency
motif discovery, which is outside the scope of this paper,                     underlying these regions substantially deviates from the
focuses on properties of clusters and modules of TF binding                    standard background frequency, they often cause false-motif
sites (TFBS). Examples of approaches that search for                           discoveries. Consequently, most methods mask these regions
combinatorial patterns and modules underlying TF binding                       in the preprocessing stage and thereby lose vital information
and gene expression include [19–23].                                           that might reside therein; (c4) criticism has been made over
                                                                               the fact that motif discovery methods tend to report
Open Challenges in Motif Discovery                                             presumably significant motifs even when applied on ran-
  One issue of motif discovery that is often overlooked                        domly generated data [25]. These motifs are clear cases of
concerns the partition of the input set of sequences into target               false positives and should be avoided.

      PLoS Computational Biology | www.ploscompbiol.org                 0509                                 March 2007 | Volume 3 | Issue 3 | e39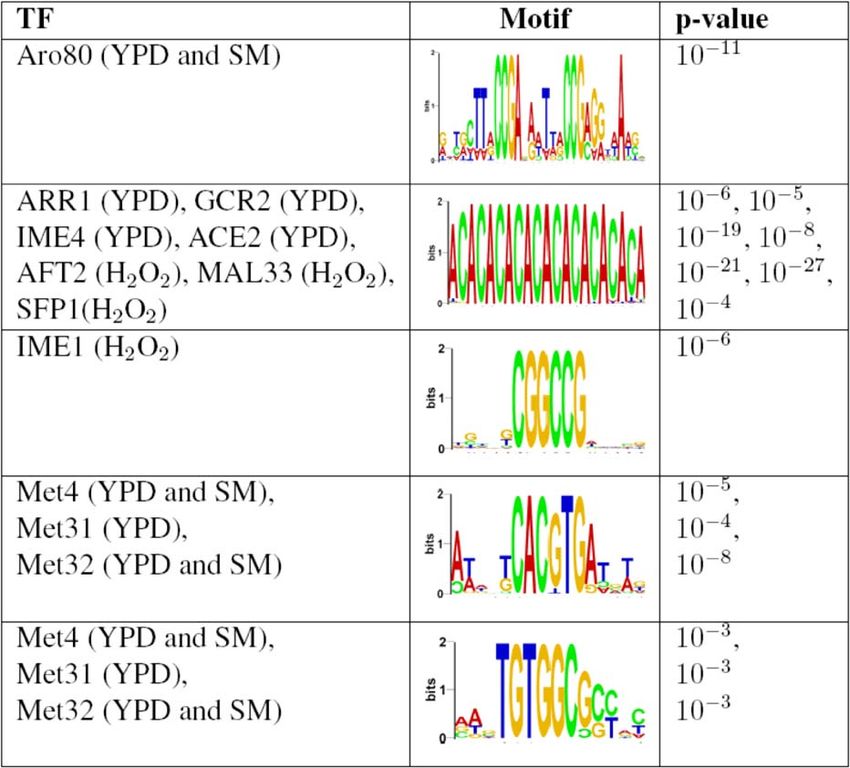
Discovering Motifs in Ranked Lists

Data Lends Itself to Ranking in a Natural Manner                               testing corrections, which diminish the score’s sensitivity, we
   In this paper we describe a novel method that attempts to                   provide a novel algorithm for computing the exact p-value of
solve the above-mentioned four challenges in a principled                      mHG scores (see Methods, Calculating the p-value of the
manner. It exploits the following observation: data often                      mHG score). This eliminates the need to resort to simulations
lends itself to ranking in a natural manner, e.g., ranking                     or exhaustively calculated tables.
sequences according to TF binding signal: ranking according                       Our method also includes a new approach to modeling
to CpG methylation signal, ranking according to distance in                    motif multiplicity by incorporating a multidimensional
expression space from a set of co-expressed genes, ranking                     hypergeometric framework (see Methods, Multidimensional
according to differential expression, etc. We exploit this                     mHG score). Unlike some models, which assume linearity
inherent ranking property of biological data in order to                       (e.g., that two binding motifs have twice the binding capacity
circumvent the need for an arbitrary and difficult-to-justify                   as one motif), our model does not make such pre-assump-
data partition. Consequently, we propose the following                         tions. Instead, the degree of surprise is adjusted for each
formulation of the motif finding task: given a list of ranked                   motif according to its own occurrence multiplicity distribu-
sequences, identify motifs that are overabundant at either end of the          tion.
list.                                                                             DRIM scans through a motif space, computes the mHG p-
   Our solution employs a statistical score termed mHG                         value of these motifs and reports the significant ones (see
(minimal hypergeometric) [26]. It is related to the concept of                 Methods, The DRIM software).
rank-imbalanced motifs, which are sequence motifs that tend to
appear at either end of a ranked sequence list. In previous
                                                                               Proof of Principle
                                                                                  We begin by testing our method on synthetically generated
work [26], the authors used mHG to identify sequence motifs
                                                                               clear-cut positive and negative control cases. We do this to
in expression data. We use this simple yet powerful approach
                                                                               verify that DRIM accurately identifies motifs in well-charac-
as the starting point for our study.
                                                                               terized and experimentally verified examples and at the same
Overview                                                                       time avoids false identification of motifs in randomly ordered
  The rest of this paper is divided into two main parts, each                  genomic sequences. The latter objective is of particular
of which is self-contained: in the Results we briefly outline                   importance since the issue of false identification has been
our method and describe new biological findings that were                       mentioned as one of the main shortcomings of motif
obtained by applying this method to biological data. We                        discovery approaches. For example, in a previous study, six
address challenge (c4) by testing the algorithm on randomly                    different motif discovery applications were used to search for
ranked real genomic sequences. In the Methods, we describe                     TFBS motifs [25]. Each of the programs attempted to measure
the mHG probabilistic and algorithmic framework and                            the significance of its results using one or more enrichment
explain how we deal with challenges (c1)–(c3).                                 scores. The authors report that the applications outputted
                                                                               high-scoring motifs even when applied to random selections
                                                                               of intergenic regions. A different paper reports clusters of
Results
                                                                               genes whose expression patterns correlate to the expression
Statistics and Algorithms in a Nutshell                                        of a particular TF [27]. These clusters were then analyzed for
   Based on the mHG framework, we developed a software                         enriched motifs. Again, the authors report that random sets,
tool termed DRIM (discovery of rank imbalanced motifs) for motif               with sizes matching those of the real clusters, contained a
identification in DNA sequences. A flow chart of DRIM is                         large number of motifs with significant scores.
provided in Figure 1. The formal introduction and details of                      To test our method’s false-prediction rate, we performed
the mHG statistics are given in Methods. However, to                           the following negative control experiment: five different
facilitate the explanation and interpretation of our biological                random permutations of ChIP–chip data were generated by
results, we begin with a brief description of the method.                      randomly selecting 400 promoters and randomly permuting
   Suppose we are given a set of DNA sequences and some                        their ranks. DRIM was then applied to these ranked lists and
measured signal associated with each sequence. We rank the                     scanned more than 100,000 different motifs in each one.
sequences according to the signal. Now, given a sequence                       None of the motifs that were scanned had a significant
motif, we wish to assess whether that motif tends to appear                    corrected mHG p-value ,103. Note that to get the corrected
more often at the ‘‘top’’ of a list compared with the                          p-values, two levels of multiple test corrections are per-
‘‘remainder’’ of the list. The mHG score captures this type                    formed: correcting for the number motifs that are tested; and
of motif significance. More precisely, the mHG score reflects                    correcting for multiple cutoffs that are tested as part of the
the surprise of seeing the observed density of motif                           mHG optimization process.
occurrences at the top of the list compared with the rest of                      How do the p-values of random motifs compare with those
the list under the null assumption that all configurations of                   of true biological motifs? To test this, we chose five TFs
motif occurrences in the list are equiprobable. A unique                       (BAS1, GAL4, CBF1, INO2, and LEU3) whose motif binding
feature of the mHG statistics is that the cutoff between the                   sites are well-characterized and experimentally verified. We
top and the rest of the list is chosen in a data-driven manner                 applied DRIM to the ChIP–chip data of these TFs as reported
so as to maximize the motif enrichment. This is done by                        in [25]. In all instances, the true motifs were identified with
computing the motif enrichment over all possible set                           corrected p-values of 106, 109, 1076, 1018, and 108,
partitions and identifying the cutoff at which maximal                         respectively. A comparison of the p-value distribution of the
statistical significance is observed.                                           motifs in the randomly ordered sequences with that of the
   The search for this optimal cutoff introduces a multiple                    verified TFBS motifs is given in Figure S3. In all instances the
testing problem. To solve this without resorting to multiple                   true TFBS motifs were predicted with p-values that were

      PLoS Computational Biology | www.ploscompbiol.org                 0510                                March 2007 | Volume 3 | Issue 3 | e39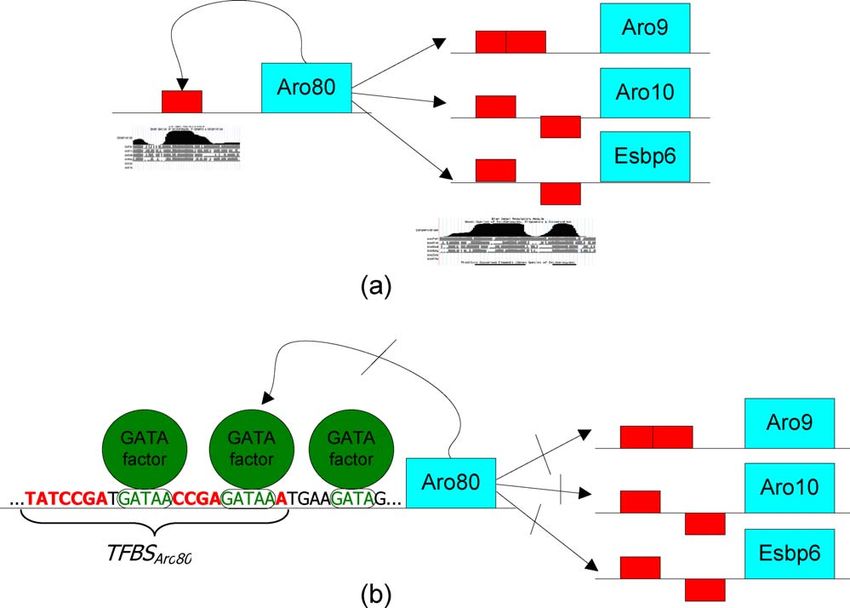
Discovering Motifs in Ranked Lists

Figure 1. DRIM Flow Chart
DRIM receives a list of DNA sequences as input and a criterion by which the sequences should be ranked, for example, TF binding signals as measured
by ChIP ChIP–chip:
(i) The sequences are ranked according to the criterion.
(ii) A ‘‘blind search’’ is performed over all the motifs that reside in the restricted motif space (in this study the restricted motif space contains ;100,000
motifs, see Methods, The DRIM software). For each motif an occurrence vector is generated. Each position in the vector is the number of motif
occurrences in the corresponding sequence, (the figure shows the vector for the motif CACGTGW).
(iii) The motif significance is computed using the mHG scheme, and the optimal partition into target and background sets in terms of motif enrichment
is identified. The promising motif seeds are passed as input to the heuristic motif search model and the rest are filtered out.
(iv,v) The motif seeds are expanded in an iterative manner (the mHG is computed in each lap), until a local optimum motif is found.
(vi) The exact mHG p-value of the motif is computed. If it has a p-value , 103, then it is predicted as a true motif (the choice of this threshold is
explained in Results, Proof of principle). The output of the system is the motif representation above IUPAC, its PSSM, mHG p-value, and optimal set
partition cutoff.
doi:10.1371/journal.pcbi.0030039.g001

several orders of magnitude more significant than the best p-                       the array). This was used as input for DRIM, which then
value of a motif in the randomly permuted data. This                               searched for motifs that tend to appear densely at the top of
indicates that the enrichment signals of true TFBS, as                             the ranked lists. If such a motif does exist, with a p-value less
captured by the mHG p-value, are clearly distinct from the                         than 103, then we hypothesize that it is biologically
signals we expect to find in random rankings of genomic                             significant and that it contributes to the TF’s binding, either
sequences.                                                                         directly or indirectly.
                                                                                      The results on the Harbison filtered dataset are summar-
TFBS Prediction Using ChIP–chip
                                                                                   ized in Table S2. A TF was assigned a motif if such was found
   To further test the effectiveness of our method, we used it
for identification of TFBS in yeast by applying it to the                           in at least one condition. We compared the DRIM predictions
Harbison and Lee–filtered ChIP–chip datasets [25,28], con-                          with previously reported TFBS discoveries in ChIP–chip that
taining measurements of 207 TF binding experiments in                              incorporated predictions of six other motif discovery
several conditions (for details regarding dataset-filtering see                     methods and conservation data [25]. The results of this
Methods). Interestingly, we observed that in many of these                         comparison are summarized in Figure 2.
datasets longer intergenic regions are biased toward stronger                         Overall, DRIM identified 50 motifs that were not picked up
TF binding. We elaborate on this sequence length bias in the                       by the six other methods as reported in [25]. We further
Methods section and in Figure S1.                                                  investigated these putative TFBS for additional evidence that
   In each of the ChIP–chip experiments, we ranked the                             they are biologically meaningful. First, we found that seven of
intergenic regions according to the TF binding signal (we use                      them (ASH1, GCR1, HAP2, MET31, MIG1, RIM101, and
the p-value of enrichment for the sequence represented on                          RTG3) are in agreement with previously published results

       PLoS Computational Biology | www.ploscompbiol.org                    0511                                     March 2007 | Volume 3 | Issue 3 | e39
Discovering Motifs in Ranked Lists
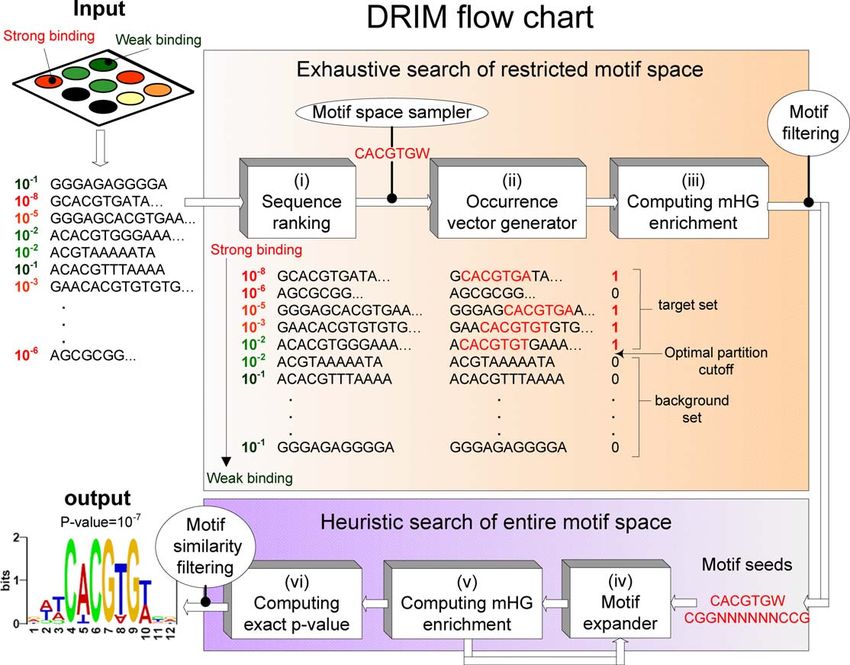
Figure 2. Comparison between Predictions of DRIM and Published Predictions of Six Other Methods and Conservation Data as Reported in [25]
Overall, out of 162 unique TFs, DRIM identified significant motifs for 82 TFs with p-value ,103. Out of the 162 TFs, DRIM and the other applications
agree on 96 TFs: 27 TFs for which a similar motif was found and 69 TFs for which no significant motifs were found. There are five TFs for which the
motifs predicted by DRIM and other applications differ; 11 for which the other applications identified motifs that DRIM did not; and 50 for which DRIM
identified a motif that the other applications did not (for details see Tables S2 and S3). Sequence logos were generated using the RNA Structure Logo
software [56].
doi:10.1371/journal.pcbi.0030039.g002
that are based on experimental techniques other than ChIP– among four promoters, three of which have two copies of
chip. Second, we compared them with a list of conserved BSAro80 each. This unusual motif distribution is combinato-
regulatory sites in yeast that was recently inferred using rially surprising and therefore suggests biological signifi-
conservation-based algorithms [29]. Ten of our putative TFBS cance. We note that BSAro8 shares some similarity with a
match these conserved sites (ARG81, ARO80, ASH1, CRZ1, previously reported Aro80 motif [29,32]. However, the
DAL81, HAP2, IME1, MET31, MIG1, and RTG3). Taken sequence of BSAro8 provides new insights into the mechanism
together, these findings provide a strong indication that at of the yeast Ehrlich pathway that cannot be explained by the
least some of the new motifs identified by DRIM are true previously described motif. (i) It was previously shown that
biological signals. In the following subsections, we focus on a Aro80 enhances the transcription of Aro9 and Aro10 [30,32].
few of these putative TFBS (see Figure 3) and present We found BSAro80 in the promoters of both genes—two
additional evidence that supports their biological role. We copies in each promoter. (ii) Interestingly, BSAro80 appears in
use these findings to discover new interactions in the yeast the promoter of the gene coding to the Aro80 protein. Since
genetic regulatory network. the BSAro8 motif appears only in four promoters in the entire
Aro80 transcription regulatory network. The Aro80 TF genome, it is highly unlikely that this occurred by chance. We
regulates the utilization of secondary nitrogen sources such as therefore hypothesize that Aro80 self-regulates its own
aromatic amino acids, as part of the Ehrlich pathway [30]. In transcription by directly binding to its own promoter. (iii)
particular, it is involved in the regulation of 2-phenylethanol, The fourth promoter (when ranking according to Aro80 rich
a compound with a rose-like odor, which is the most-used media ChIP–chip data [25]) contains two BSAro80 elements,
fragrance in the perfume and cosmetics industry [31]. Due to one on the sense and the other on the anti-sense. This
its commercial potential, the optimized production of this configuration is shared by two divergently transcribed genes,
substance has received much attention [31]. NAF1 and Esbp6. The latter gene was previously shown to
We identified the remarkably large motif, have increased transcription in the presence of phenylalanine
WWNCCGANRNWNNCCGNRRNNW, in Aro80 rich media as sole nitrogen source [30], suggesting it may play a role in
ChIP–chip data [25] with p-value , 1011 (see Figure 3). We the Ehrlich pathway. Esbp6 is a monocarboxylate permease
refer to this putative binding site as BSAro80. Furthermore, we and might be involved in the transfer of substrates of the
discovered the same motif in two other independent sources Ehrlich pathway across the plasma membrane. (iv) We
of data: Aro80 rich media experiment in the Lee filtered analyzed the conservation of BSAro8 in four yeast strains
dataset and Aro80 SM condition (amino acid starvation), both and found all seven of its copies to be conserved in the
with p-value , 106. Only seven copies of this motif occurred different strains. (v) Aro80 belongs to the Zn2Cys6 family of
in the entire yeast genome. These seven copies are distributed TFs that are known to bind CCG elements separated by a
PLoS Computational Biology | www.ploscompbiol.org 0512 March 2007 | Volume 3 | Issue 3 | e39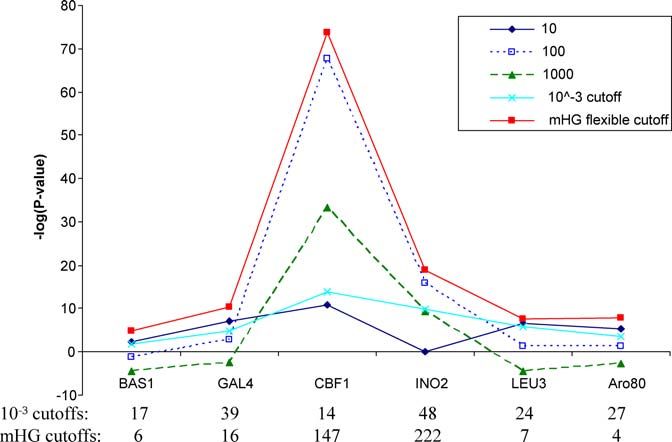
Discovering Motifs in Ranked Lists

Figure 3. Examples of TFs for Which DRIM Identifies Novel Motifs
We further investigated these motifs and show evidence of their biological function. YPD, H2O2, and SM denote the ChIP–chip experimental conditions
[25] in which the motifs were identified.
doi:10.1371/journal.pcbi.0030039.g003

spacing. Indeed, in addition to other conserved nucleotides,                  103) for partitioning the data included 16 other promoters
the motif contains CCG gapped tri-nucleotides. (vi) In a                      in the target set, in addition to the four promoters in which
previous study, in order to identify cis-acting sequences                     BSAro80 appears. Consequentially, the signal-to-noise ratio
involved in Aro9 induction, a series of deletions were                        decreases, which might explain why other methods did not
produced in the Aro9 promoter region, and the expression                      identify the BSAro80 element.
of a reporter gene was monitored [32]. The authors                               Taken together, our results suggest the predicted BSAro80
concluded that the sequence CCGN7CCGN7CCGN7CCG in                             motif is indeed an Aro80 binding site.
the Aro9 promoter is responsible for Aro80 binding. We                           CA repeats are correlated with TF binding. We identified a
note, however, that the changes in expression caused by the                   bi-nucleotide CA repeat motif with variable length ranging
mutations can be interpreted differently, and in fact they are                from six to 62 in the Harbison filtered dataset. The CA repeat
even more consistent with our BSAro80 motif. Deletions or                     motif was found to be highly enriched for seven TFs: ARR1,
mutations that simultaneously altered all motif copies in the                 GCR2, IME4, and ACE2 in rich media condition and AFT2,
promoter dramatically reduced expression, while those which                   MAL33, and SFP1 in H2O2Hi condition. Furthermore, for two
altered only some of the copies caused a more mild decrease.                  of these TFs (GCR2, IME4), we rediscovered the same CA
Other deletions that did not affect any BSAro80 motif did not                 repeat motif in the Lee filtered dataset. In other words, for
affect the expression at all. A detailed analysis of the BSAro80              the specified TFs, we identify a highly significant correlation
element with respect to these mutagenesis studies is given in                 between a sequence’s capacity to bind the TF and the
Figure S4.                                                                    presence of a CA repeat in the sequence. This type of low
   A putative transcription network of Aro80 that incorpo-                    complexity motifs are often filtered by current methods. One
rates these findings is shown in Figure 4. Note that GATA                      exception is a recent work in which a CACACACACAC
binding sites are found adjacent to the BSAro80 motif. We                     sequence was found to be enriched in Rap1 experiments [33].
further discuss the potential role of these motifs in the                        It has been previously hypothesized that CA repeats might
Discussion.                                                                   have a functional role in TF binding [34]. It was proposed that
   The predicted motif BSAro80 exemplifies the usefulness of                   CA repeats, which are often conserved in evolutionary distant
the mHG flexible cutoff. Our process partitioned the data                      organisms, are likely to impose a unique DNA tertiary
into a target set containing the top first four promoters (the                 structure that aids in the identification of other specific
only promoters in the genome in which the motif resides) and                  regulatory elements [34]. Our findings constitute concrete
a background set containing the rest of the promoters. Other                  evidence to this phenomena in seven (of 82) different TFs.
methods that used a fixed binding signal cutoff (p-value ,                     They are also in agreement with another study in which CA

      PLoS Computational Biology | www.ploscompbiol.org                0513                                  March 2007 | Volume 3 | Issue 3 | e39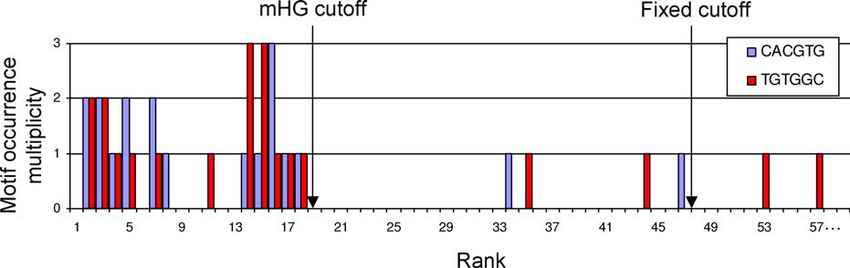
Discovering Motifs in Ranked Lists

Figure 4. The Hypothetical Regulatory Network of Aro80
Copies of the BSAro80 motif (on the sense and antisense) are shown as rectangles on the promoter regions.
(A) BSAro80 is conserved in four strains of yeast as shown using the University of California Santa Cruz browser conservation plots. Aro80 regulates the
utilization of secondary nitrogen sources such as aromatic amino acids by binding genes that participate in the catabolism of aromatic amino acids. We
hypothesize that it also binds to its own promoter region and introduces a positive feedback self loop.
(B) Part of the Aro80 promoter sequence is shown with bases of the BSAro80 motif colored in red. Interestingly, there are three GATA binding sites that
are adjacent to the BSAro80 motif (bases colored in green). These sites bind GATA factors that are known to play a role in nitrogen catabolite repression.
We hypothesize that they are also involved in the repression of Aro80 expression by physically binding to the region near BSAro80, thus making it
inaccessible to Aro80 binding. This in turn breaks the positive feedback loop and represses the expression of Aro80 itself and other Aro80 regulated
genes.
doi:10.1371/journal.pcbi.0030039.g004

repeat–containing sequences in the human gamma-globin                            motifs, M1 ¼ TGTGGCSS and M2 ¼ CACGTG, in rich media
gene promoter required for efficient transcription were                           ChIP–chip experiments of three different TFs: Met4, Met31,
identified using in vitro site-directed mutagenesis [35]. Taken                   and Met32. Furthermore, we rediscovered the same motifs in
together, our findings and other observations suggest CA                          other experimental conditions of the same TFs. Met4, Met31,
repeats play a role in the DNA binding of some TFs.                              and Met32 are three factors involved in the sulfur amino acid
   Detection of indirect TF–DNA binding using ChIP–chip.                         pathway, and the fact that the same two motifs were
IME1 is a TF that activates transcription of early meiotic                       independently predicted for each of the TFs is unlikely to
genes. We identified a motif, CGGCCG, with p-value , 1011                        occur by chance, suggesting the predictions are biologically
that is enriched in the sequences to which IME1 binds in                         meaningful. In a previous work it was shown that Met4 is
H2O2 condition. Although this motif was not identified by                         tethered to the DNA sequence AAACTGTG via two alter-
other methods as reported in [25], we found evidence that                        native complexes, Met4-Met28-Met31 and Met4-Met28-Met32
suggests it is biologically meaningful. First, we note that this
                                                                                 (the binding is thought to occur via Met31/32) [37]. This
motif is a perfect palindrome, which is often characteristic of
                                                                                 sequence partially overlaps motif M1. Furthermore, the
TF binding sites. Second, the same motif was identified as
                                                                                 complex Met4-Met28-Cbf1 was shown to bind motif M2 [38].
evolutionarily conserved in IME1-bound sequences as in-
                                                                                 Previous findings are summarized in Figure S5A. The above
ferred from ChIP–chip data [29]. Third, IME1 interacts with
Ume6, also a transcriptional regulator of early meiotic genes,                   explains why we predict M1 for Met4 and M2 for Met31/32.
which was previously shown to bind the same DNA motif,                           However, it does not explain why we also predict M2 for Met4
CGGCCG [36]. We conclude that the IME1-discovered motif                          and M1 for Met31/32. The most likely explanation for this is
is likely due to the following scenario: IME1 binds to Ume6,                     the existence of a direct interaction between the two
which binds to CGGCCG sequences on the DNA. The cross                            complexes Met4-Met28-Cbf1 and Met4-Met28-Met31/32. If
linking in the ChIP–chip protocol fixes these bindings, and                       such an interaction exists, then the cross linking would fix the
the immunoprecipitation of IME1 actually precipitates the                        two complexes and cause the immunoprecipitation of Met4,
entire complex. We therefore get enriched CGGCCG                                 Met31, and Met32 to precipitate the same set of sequences,
sequences in IME1 experiments due to indirect binding to                         thus causing the same motifs to appear in the experiments of
this DNA motif.                                                                  all three TFs, which is exactly what DRIM identifies. This
   In another example, we identified the same two distinct                        point is illustrated in Figure S5B. The idea of direct

       PLoS Computational Biology | www.ploscompbiol.org                  0514                                    March 2007 | Volume 3 | Issue 3 | e39
Discovering Motifs in Ranked Lists
Table 1. Enriched Motifs Associated with CpG Methylation in Four Human Cancer Cell Lines and Comparison to Motifs in Regions
Bound by the Polycomb Complex
Cell Line CpG Methylation Number of Average Notes Polycomb
Motif Experiments p-Value Complex Motif
Caco-2 SSCCCCANGa 4 ,1010 Novel prediction Yes [41,44]
Caco-2 CNGCTGCa 3 ,105 Novel prediction Yes [41]
Caco-2 GAGGGA 2 ,104 In agreement with [2]
Caco-2 DGAGAGV 2 ,104 Novel prediction Yes [41,43,44]
Carcinoma CA repeat 2 ,1079 Novel prediction Yes [41,42]
PC3 CA repeat 1 ,107 Novel prediction Yes [41,42]
PC3 GGGGTNCCa 1 ,106 In agreement with [2] Yes [44]
PC3 ACACNCAC 2 ,1010 In agreement with [2]
PC3 GCTGC 2 ,105 Novel prediction Yes [41]
PC3 RGCGCAA 2 ,104 Novel prediction
Polyp CA repeat 2 ,1058 Novel prediction Yes [41,42]
Polyp CNNGCGCCa 3 ,1013 Novel prediction Yes [44]
Polyp GCTGCNBB 2 ,106 Novel prediction Yes [41]
Number of Experiments corresponds to the number of replicate experiments of the same cell line in which the same motif was independently identified. The CA repeat motifs have a
variable length.
Polycomb Complex Motif denotes motifs that appear in regions bound by the Polycomb complex [41,42,44].
a
Motifs that have G-C content .66%. Their enrichments are partially attributed to the G-C content bias that is found in the CpG methylation data.
doi:10.1371/journal.pcbi.0030039.t001
interaction between the two complexes is also in agreement with hypermethylated promoters at the top. Note that
with previous results [37]. different replicates of the same cell line may yield different
Overall, the results shown in this subsection demonstrate ranking of the promoters.
that DRIM is able to identify previously ignored subtle signals DRIM identified significantly enriched motifs in each of the
in ChIP–chip data that stem from indirect bindings of factors four cancer cell lines. Table 1 shows all the motifs that were
to DNA. This type of information can be useful for inferring independently discovered in at least two different replicates
novel protein–protein interactions. of the same experiment or that are in agreement with
Condition-dependent motifs. A comparison was made previous work [2]. Overall, DRIM discovered 13 motifs: ten
between the predicted motifs of the same TF in different novel motifs and three that have been previously predicted in
experimental conditions (see Table S2). These seem to fall hypermethylated CpG island promoters in the same cancer
into two main categories: (i) motifs whose enrichment is cell lines [2]. Some of these motifs have also been independ-
condition-dependent, and (ii) motifs whose enrichment is ently identified in methylated CpG regions of other cell lines
condition-independent, suggesting the TF is bound to the [39,40].
DNA regardless of condition. In the latter, although the same Interestingly, nine of the novel ten motifs were independ-
motif was predicted in different conditions, the motif ently identified in DNA regions to which the proteins of the
enrichment varied considerably. For instance, the GAL4 Polycomb complex bind [41–43]. The Polycomb complex is
binding site CGGN11CCG, previously reported in [1] and involved in gene repression through epigenetic silencing and
other literature, was predicted in both YPD and galactose chromatin remodeling, a process that involves histone
conditions. However, the enrichment varied considerably methylation. The fact that these two distinct key epigenetic
with p-values 107 and 1011, respectively. This several-fold repression systems, namely histone methylation and CpG
difference in enrichment is consistent with what is known methylation, bind to regions that share a similar set of
about the role of GAL4 in galactose metabolism. It suggests sequence motifs suggests they are linked. To further establish
that GAL4 has a preference to bind CGGN11CCG DNA this link we applied DRIM to Polycomb complex bound
regardless of condition. However, in the presence of galactose promoters in human embryonic fibroblasts [44]. We found
and absence of glucose, this preference becomes much more four motifs that are similar to the CpG methylation motifs
significant. Another example of a condition-invariant motif (Table 1). Our findings are consistent with a recent paper that
whose binding strength is subject to experimental condition showed that the EZH2 Polycomb protein binds methyltrans-
is that of the Aro80 TF. This demonstrates that DRIM can be ferases via the Polycomb complex [45].
used not only to identify binding sites but also to distinguish Most of the motifs we found are similar across more than
between different modes of TF binding. one type of cancer cell line, e.g., variants of the GCTGCT
motif appear in Caco-2, PC3, and Polyp1 cancer cell lines.
Motif Discovery in Human Methylated CpG Islands This suggests that the same DNA binding factors are involved
To examine our method’s ability to predict sequence in CpG methylation of different types of cancers. It is also
motifs that stem from data other than TF binding, DRIM was important to note that some of the motifs we discovered are
applied to a dataset containing the human cancer cell line– G–C rich. The enrichment of these motifs may be partially
methylated CpG islands (for dataset details, see Methods) to attributed to the G–C content bias that is found in CpG
seek for motifs that are enriched in hypermethylated regions. methylation data.
The promoters were ranked according to methylation signal, The DRIM motif identification process can be used not
PLoS Computational Biology | www.ploscompbiol.org 0515 March 2007 | Volume 3 | Issue 3 | e39Discovering Motifs in Ranked Lists
Figure 6. Comparison of the Target Sets Sizes as Determined by the
Fixed versus the mHG Flexible Cutoffs
Figure 5. Comparison between HG and mHG Enrichment Each dot represents a ChIP–chip experiment where the x and y
coordinates are the number of promoters with p , 10 (standard
The mHG and HG methods were applied to ChIP–chip data of six TFs. cutoff) and the number of promoters as determined by the mHG cutoff,
The sequences were ranked according to the ChIP–chip binding signal, respectively. The dotted line is x ¼ y. TF names are given in Table S4.
and the enrichment of the correct binding motif was recorded using doi:10.1371/journal.pcbi.0030039.g006
mHG and HG with fixed target sets containing the top 10, 100, and 1,000
sequences as well as all sequences with ChIP–chip signal ,103. All
scores were corrected for multiple motif testing. The mHG score is also work [25] the authors use a cutoff of p-value , 103 on the
corrected for the multiple cutoff testing. The 103 and mHG cutoffs for ChIP–chip signal in order to define the target set for motif
each experiment are shown. It can be seen that the two cutoffs are
significantly different and that for all the tested TFs mHG produces better searching. In contrast, the mHG score uses a data-driven
results than HG in terms of enrichment of the true motif. flexible cutoff and chooses the set partition that maximizes
doi:10.1371/journal.pcbi.0030039.g005 the motif enrichment.
To more systematically investigate the advantages of using
only to identify novel motifs but also to partition the data in a a flexible cutoff, we compared mHG with fixed set partition
biologically meaningful manner. In [2] the authors used a HG [7] by disabling the flexible cutoff feature in DRIM. The
fixed threshold on the methylation signal (p-value , 0.001 ) to comparison was performed on ChIP–chip data of TFs whose
partition the dataset. Consequently, they identified 135 motif binding sites are well-characterized as well as on the
hypermethylated promoters. A data-driven partition would Aro80 binding site we identified. For each TF, we ranked the
be to use the threshold that yielded the maximal motif sequences according to the ChIP–chip binding signal,
enrichment. For example, in the Caco2 cell line, we identified generated the motif occurrence vector, and computed its
the same motif as in the previous work [2]. However, the HG enrichment using fixed target sets containing the top 10,
motif maximal enrichment was found in the top 209 100, and 1,000 sequences as well as all sequences with ChIP–
promoters (an increase of 54% in target set size). chip signal ,103. The results are summarized in Figure 5. We
note that all of the scores are corrected for multiple-motif
Motif Discovery in Human ChIP–chip Data
testing. The mHG score is also corrected for the multiple-
Human TFBS tend to be longer and ‘‘fuzzier’’ than TFBS of
cutoff testing. The mHG method yields superior results in all
lower eukaryotes, and it is important to evaluate our
six cases.
method’s performance on such motifs. To this end, we
We performed additional comparisons of the mHG versus
applied DRIM to the ChIP–chip experiments of HNF1a,
the HG methods by applying both methods to simulations of
HNF4a, HNF6 in liver and pancreas islets [46], as well as to
motif occurrence vectors (see Text S7 and Figure S6). In these
that of CREB [47]. For each of the TFs, we generated a list of
simulations mHG showed significantly better performance
sequences containing 1,000 bases upstream and 300 down-
than HG.
stream of the transcription start site (TSS). We ranked the list
To further investigate the issue of setting a cutoff, we
according to the TF ChIP–chip signal and used it as input to
DRIM. DRIM successfully detected the TFBS of these TFs that compare, for a given TF and condition in the ChIP–chip
are reported in TRANSFAC with extremely significant p- dataset, the number of promoters for which the binding
values: HNF1a liver—GTTAMWNATT (p ¼ 108), HNF4a signal ,103 (denoted #(103)) with the number of promoters
Islets—SCGGAAR (p ¼ 1053), HNF6 Liver—ATCRAT (p ¼ at which mHG was attained (denoted n*). For 82 experiments,
1057), and HNF6 Islets—ATCRAT (p ¼ 1061). In the CREB #(103) 4 and for 46 of these #(103) ¼ 0. In these cases a
experiments we identified the palindromic motif TGACGT- 103 fixed cutoff reduces the size of the target set and limits
CA (p ¼ 1016), which is known to bind CREB [47]. the usability of any discovery algorithm. In Figure 6 we
compare #(103) and n* for some of the cases at which a motif
Comparison with Other Methods was found by mHG. Note that in a significant number of cases
Three properties of the mHG enrichment score embodied the mHG score identified a significantly enriched motif even
in DRIM offer advantages over other motif discovery when #(103) was very low. One extreme case is the TF SOK2
methods: the dynamic cutoff, the rigorous control over false in YPD condition for which#(103) ¼ 0, yet mHG found a
positives, and the motif multiplicity model. significantly enriched motif.
Dynamic versus rigid cutoffs. Most methods use an Controlling false positives. The second advantageous
arbitrary cutoff for set partition. For example, in previous property of the mHG score is its ability to rigorously control
PLoS Computational Biology | www.ploscompbiol.org 0516 March 2007 | Volume 3 | Issue 3 | e39Discovering Motifs in Ranked Lists
Figure 7. Motif Occurrences in the Top 59 (of ;6,000) Promoters That Were Ranked According to Met32 Binding Signal
A comparison is made between the data-driven mHG cutoff and the arbitrary fixed cutoff. It can be seen that the motifs are significantly more enriched
when the list is partitioned using the mHG cutoff.
doi:10.1371/journal.pcbi.0030039.g007
false positives, due to calculation of an exact p-value. This solve challenges (c1)–(c4) (see Introduction, Open challenges
attribute is best demonstrated by comparing the perform- in motif discovery).
ance of DRIM versus other motif-finding tools on negative To address challenge (c1), instead of choosing an arbitrary
controls, that is, datasets whose original ranking was cutoff for set partition, we search for a cutoff that partitions
randomly permuted. It is clear that in these cases we should the data in a way that maximizes the motif enrichment. We
not find significantly enriched motifs. To this end we used the present evidence that shows that the flexible mHG cutoff
same benchmark on which DRIM was tested (see Results, outperforms the rigid cutoff. One example of this is shown in
Proof of principle). Using the same five random permutations Figure 5, where the flexible cutoff yields better results for all
of ChIP–chip data, we applied the algorithms AlignACE [12], the tested TFs. Another example of the advantage of a flexible
MEME [8], and MDscan [33] on each of the random sets. Both cutoff is the two motifs detected in three TFs involved in the
AlignACE and MEME reported significant motifs with many sulfur amino acid pathway (Met4, Met31, and Met32). Figure 7
A’s, probably due to the existence of polyA tails in the shows the number of motif occurrences in each of the top 59
intergenic regions. MDscan was used with a precompiled promoters that were ranked according to Met32 binding
background from yeast intergenic regions, and therefore it signal (data from [25]). The motifs are highly frequent in the
did not report the polyA motifs, yet it did report motifs top 18 promoters, after which a strong drop in motif
including repeats of TA, probably as a result of TATA boxes. frequency is observed. DRIM identifies this, and partitions
In comparison, DRIM did not identify any significant motifs the set accordingly. In comparison, relying on the standard
in any of the random sets. cutoff of 103 results in a target set of the top 48 promoters,
Binary versus multidimensional enrichment. The third most of which do not contain this motif. The signal-to-noise
advantageous property is the extension of the binary enrich- ratio is thus diminished, which may explain why these motifs
ment analysis to the multidimensional enrichment analysis were previously overlooked.
(see Methods, Multidimensional mHG score). The latter forms While the flexible cutoff is advantageous in many instances,
the basis for dealing with motif multiplicity in a data-driven it also introduces a multiple testing problem. To circumvent
manner. To test this property, we compared DRIM, which this (without resorting to strict multiple testing corrections
uses the multi-mHG framework, with a restricted version of that may mask the biological signal), we developed an
DRIM, which uses the standard binary enrichment frame- efficient algorithm for computing the exact p-value of a
work. Out of 31 binding motifs identified by DRIM that were given mHG score. This addresses challenge (c2). Another
also identified in other literature, the restricted version was advantage of this exact statistical score is its straightforward
able to identify only 23. Furthermore, in some instances, both biological interpretation: the mHG p-value reflects the
methods were able to identify the correct motif site; however, probability of seeing the observed density of motif occur-
the motif significance using the multi-mHG framework was rences at the top of the ranked list under the null assumption
several fold more significant without incurring additional that all configurations of motif occurrences are equiprobable.
false predictions. Motif multiplicity is often indicative of biological function.
It is therefore paramount to incorporate this type of
information into the motif prediction model. We do so in a
Discussion
data-driven manner by developing the multi-mHG frame-
In this paper we examine the problem of discovering work, thus addressing challenge (c3). The advantages of the
‘‘interesting’’ motif sequences in biological sequence data. multi-mHG model over the binary model are presented in
While this problem has often been regarded as tantamount to Results, Binary versus multidimensional enrichment.
discovering enriched motifs in a target set versus a back- False prediction of motifs in randomly generated data is
ground set, we point out an inherent limitation to this often mentioned as one of the drawbacks of computational
formulation of the problem. Specifically, in most cases, motif discovery [25]. We report the testing of DRIM on
biological measurement data does not lend itself to a single, random permutations of ranked sequences. When tested on
well-substantiated partition into target and background sets. more than 100,000 motifs, DRIM did not identify any
It does, however, lend itself to ranking in a natural manner. significant motifs, thus addressing challenge (c4). The low
Our approach exploits this natural ranking and attempts to false-positive prediction of our method is mainly attributed
PLoS Computational Biology | www.ploscompbiol.org 0517 March 2007 | Volume 3 | Issue 3 | e39Discovering Motifs in Ranked Lists
to the fact that it is based on rigorous statistics and relies on We also applied DRIM to high-throughput measurements of
an exact p-value. methylated CpG islands [2] in human cancer cells, in order to try
Another important issue that still requires consideration is to identify motifs that are enriched in hypermethylated regions.
the characterization of the motif search space. In this study Interestingly, we identified GA and CA repeat elements as highly
we performed an exhaustive scanning of a restricted motif enriched in methylated CpG regions of four different cancer cell
space (containing ;105 motifs) followed by a heuristic search lines. This is in agreement with previous studies of CpG
for larger motifs. However, the motif search space can be methylated regions in other cell lines [39,40]. It is interesting
further extended to include motifs that are longer, ‘‘fuzzier,’’ to ask whether these repeat elements play some active role in
or more complex. Additional considerations such as the CpG methylation. In [40] the authors give statistical argumenta-
distance of the motif from the transcription start site may be tion against such a hypothesis. Instead, they hypothesize that CA
taken into account as well as logical relations between (or TG) repeats are caused by an increased mutation rate of
different motifs (e.g., ‘‘OR,’’ ‘‘AND’’ operations). It is clear methylated CpGs that are deaminated into TpGs. Even if true,
that many of these features are required to correctly model this still does not explain the enrichment of the GA repeats.
complex regulation patterns that are observed in higher Further experimental and bioinformatic interrogation of this
eukaryotes. Two inherent limitations need to be considered point is therefore called upon.
when extending the search space: first, as the size of the motif Overall, DRIM discovered ten novel motifs in methylated
search space increases, the problem of efficiently searching CpG regions. Strikingly, nine of them are similar to DNA
the defined space becomes more acute in terms of running sequence elements that bind the Polycomb complex in
time. Second, since the size of the search space is virtually Drosophila and/or human [41,42, 44]. The Polycomb complex
endless, the problem of multiple testing rapidly erodes the is involved in epigenetic silencing via histone methylation.
signal-to-noise ratio, requiring an appropriate refinement of The suggested link between histone methylation and CpG
the statistical models. methylation is in agreement with recent work that demon-
To test our method, we constructed a dataset containing strated the EZH2 protein interacts with DNA methyltrans-
ChIP–chip experiments of 203 putative TFs in Saccharomyces ferases via the Polycomb complex [45]. We also note that the
cerevisiae [25,28]. Surprisingly, we discovered a significant DNA sequence motifs of the two pathways were conserved in
length bias in roughly one-third of these experiments. One Drosophila and human, which is complementary to the
possible explanation for this phenomenon is nonspecific observation that the Polycomb proteins are evolutionarily
binding between TFs and DNA, which causes longer conserved [44,49]. Many of the motifs we found in the CpG
sequences to bind more TFs. This explanation is also methylation data are similar across different types of cancer
consistent with the ‘‘TF sliding hypothesis’’ [48]. Why only cell lines. This may suggest that the CpG methylation
some TFs exhibit this length bias binding tendency remains mechanism is orchestrated by DNA binding factors that are
an open question. To avoid false positives due to this similar in different types of cancer cell lines.
phenomenon, we opted to filter out all ChIP–chip experi- Perhaps the most important conclusion that can be drawn
ments that had significant length bias. Future work should from this study is that looking at biological sequence data in a
address this point and focus on developing statistics that are ranked manner rather than using an arbitrary fixed cutoff to
insensitive to this type of bias.
partition the data enables the detection of biological signals
We analyzed the filtered dataset using DRIM and report
that are otherwise overlooked. This suggests that other motif
novel putative TFBS motifs. Additional evidence that
detection methods that rely on fixed cutoffs may benefit from
indicates the newly discovered motifs are biologically func-
dynamic partitioning. While the effectiveness of our approach
tional was also presented. One interesting finding is that the
was demonstrated on ChIP–chip and methylation data, it can
Aro80 motif we identified, which exists only in seven copies
also be applied to a wide range of other data types such as
throughout the entire yeast genome, resides in Aro809s own
expression data or GO analysis. The DRIM application is
promoter. This finding suggests that Aro80 regulates its own
publicly available at http://bioinfo.cs.technion.ac.il/drim.
transcription by binding to its own promoter. Additionally,
three GATA binding sites that reside in the Aro80 promoter
adjacent to the motif occurrence lead us to speculate that Materials and Methods
Aro809s putative self binding is inhibited by competing The minimum hypergeometric score. In this subsection we
GATA binding factors (for details see Figure 4B). introduce the basics of the mHG statistics, and demonstrate how it can
Another interesting observation is the CA repeat motifs, be applied in a straightforward manner to eliminate the need for an
arbitrary choice of threshold. To explain the biological motivation of
which we identified in seven different yeast TFs as well as in mHG, consider the following scenario: suppose we have a set of promoter
human DNA methylation. This type of low complexity motifs regions each associated with a measurement, e.g., a TF binding signal as
have so far been mostly ignored or filtered out by other measured by ChIP–chip [1]. We wish to determine whether a particular
motif specified in IUPAC notation, say CASGTGW, is likely to be a TFBS
computational methods. By contrast there is no need to motif. We rank the promoters according to their binding signals—strong
resort to this type of artificial filtering when using the mHG binding at the top of the list and the weak at the bottom (Figure 1i). Next,
statistics. Our findings in yeast suggest that for certain TFs we generate a binary occurrence vector with one or zero entries
there is a significant correlation between a sequence’s dependent on whether or not the respective promoter contains a copy of
the motif (Figure 1ii). For simplicity we ignore cases where a promoter
capacity to bind a TF and the presence of a CA repeat in contains multiple copies of the motif (a refined model, which takes motif
the sequence. This supports a previous hypothesis that CA multiplicity into account, will be discussed later). Motifs that yield binary
repeats alter the structure of DNA and thus contribute to TF vectors with a high density of 19s at the top of the list are good candidates
binding [34]. Our findings constitute concrete evidence of for being TFBS.
Let us assume for the moment that we know the correct physical-
this phenomenon and suggest it may be more frequent than based cutoff on the TF binding signal. The data could then be
previously appreciated. separated into ‘‘strong binding promoters’’ (i.e., the target set) and
PLoS Computational Biology | www.ploscompbiol.org 0518 March 2007 | Volume 3 | Issue 3 | e39You can also read