Evaporation from Lake Mead and Lake Mohave, Nevada and Arizona, 2010-2019 - Open-File Report 2021-1022
←
→
Page content transcription
If your browser does not render page correctly, please read the page content below
Water Availability and Use Science Program

Prepared in cooperation with the Bureau of Reclamation

Evaporation from Lake Mead and Lake Mohave, Nevada and
Arizona, 2010–2019

Open-File Report 2021–1022

U.S. Department of the Interior
U.S. Geological Survey
Cover photo: Looking south at Boulder Basin in Lake Mead. Photograph taken by Michael Rosen, April 5, 2015.
Evaporation from Lake Mead and Lake
Mohave, Nevada and Arizona, 2010–2019
By Katherine J. Earp and Michael T. Moreo

Water Availability and Use Science Program
Prepared in cooperation with the Bureau of Reclamation

Open-File Report 2021–1022

U.S. Department of the Interior
U.S. Geological Survey
U.S. Geological Survey, Reston, Virginia: 2021 For more information on the USGS—the Federal source for science about the Earth, its natural and living resources, natural hazards, and the environment—visit https://www.usgs.gov or call 1–888–ASK–USGS. For an overview of USGS information products, including maps, imagery, and publications, visit https://store.usgs.gov/. Any use of trade, firm, or product names is for descriptive purposes only and does not imply endorsement by the U.S. Government. Although this information product, for the most part, is in the public domain, it also may contain copyrighted materials as noted in the text. Permission to reproduce copyrighted items must be secured from the copyright owner. Suggested citation: Earp, K.J., and Moreo, M.T., 2021, Evaporation from Lake Mead and Lake Mohave, Nevada and Arizona, 2010–2019: U.S. Geological Survey Open-File Report 2021–1022, 36 p., https://doi.org/10.3133/ofr20211022. ISSN 2331-1258 (online)
iii

Contents
Abstract�����������������������������������������������������������������������������������������������������������������������������������������������������������1
Introduction����������������������������������������������������������������������������������������������������������������������������������������������������1
     Purpose and Scope������������������������������������������������������������������������������������������������������������������������������3
     Previous Studies�����������������������������������������������������������������������������������������������������������������������������������3
     24-Month Study�������������������������������������������������������������������������������������������������������������������������������������4
     Description of Study Area�������������������������������������������������������������������������������������������������������������������4
           Lake Mead������������������������������������������������������������������������������������������������������������������������������������5
           Lake Mohave��������������������������������������������������������������������������������������������������������������������������������6
Methods of Study�������������������������������������������������������������������������������������������������������������������������������������������6
     Energy Balance�������������������������������������������������������������������������������������������������������������������������������������6
     Eddy Covariance Turbulent Flux Measurements�����������������������������������������������������������������������������7
           Latent-Heat Flux (Qe)�������������������������������������������������������������������������������������������������������������������7
           Sensible-Heat Flux (Qh)���������������������������������������������������������������������������������������������������������������8
     Energy Balance Closure����������������������������������������������������������������������������������������������������������������������8
     Available Energy Measurements�������������������������������������������������������������������������������������������������������9
           Net Radiation (Qn)������������������������������������������������������������������������������������������������������������������������9
           Change in Stored Heat (Qx)��������������������������������������������������������������������������������������������������������9
           Advected Heat (Qv)��������������������������������������������������������������������������������������������������������������������12
     Vapor Pressure Difference����������������������������������������������������������������������������������������������������������������12
     Sites������������������������������������������������������������������������������������������������������������������������������������������������������12
           Instrumentation for Turbulent Flux Measurements�������������������������������������������������������������13
           Instrumentation for Available Energy Measurements���������������������������������������������������������14
     Data Collection and Reduction Procedures�����������������������������������������������������������������������������������15
           Gap Filling Missing or Bad Turbulent-Flux Data�������������������������������������������������������������������16
Evaporation from Lake Mead and Lake Mohave������������������������������������������������������������������������������������16
     Monthly Estimates������������������������������������������������������������������������������������������������������������������������������17
           Available Energy������������������������������������������������������������������������������������������������������������������������17
                    Water-Temperature Profiles�������������������������������������������������������������������������������������������19
                    Inflow and Outflow Water Temperatures���������������������������������������������������������������������19
           Turbulent Fluxes�������������������������������������������������������������������������������������������������������������������������25
           Annual Available Energy�����������������������������������������������������������������������������������������������������������25
           Annual Turbulent Fluxes�����������������������������������������������������������������������������������������������������������25
     Uncertainty Analysis and Limitations����������������������������������������������������������������������������������������������25
     Annual Estimates��������������������������������������������������������������������������������������������������������������������������������29
     Comparison to Existing Rate Coefficients���������������������������������������������������������������������������������������30
References Cited�����������������������������������������������������������������������������������������������������������������������������������������33
iv
Figures
1. Map showing overview of Lake Mead and Lake Mohave in Lake Mead National
Recreation Area in Nevada and Arizona����������������������������������������������������������������������������������2
2. Diagram showing major energy-budget components diagram��������������������������������������������7
3. Map showing overview showing eddy covariance and floating platform sites in
Boulder Basin, Lake Mead, Nevada and Arizona�����������������������������������������������������������������10
4. Map showing overview showing eddy covariance and floating platform sites,
Lake Mohave, Nevada and Arizona�����������������������������������������������������������������������������������������11
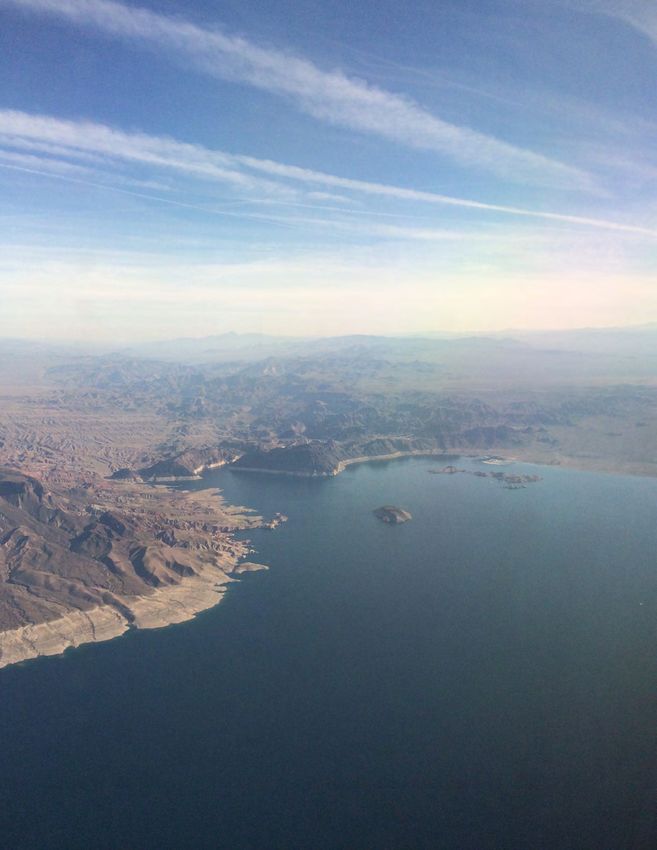
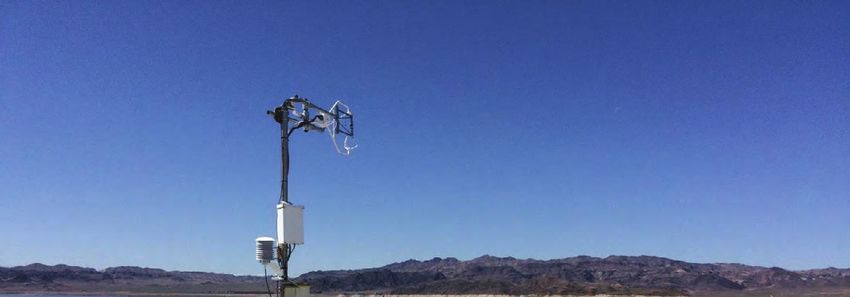
5. Photograph showing eddy covariance station showing turbulent flux sensors
position, Lake Mead, Nevada and Arizona�����������������������������������������������������������������������������14
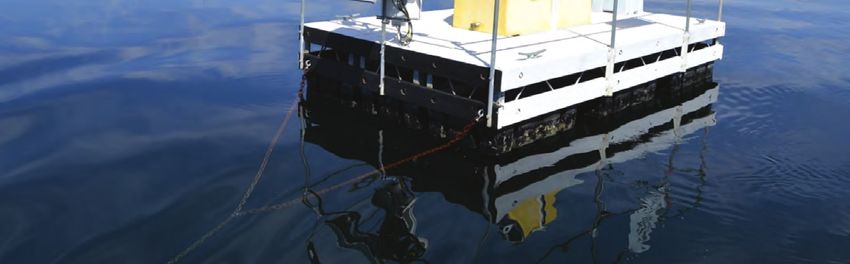
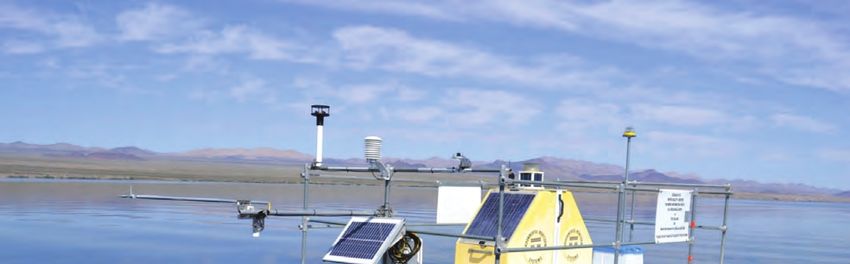
6. Photograph showing floating platform showing available energy sensor
positioning, Lake Mohave, Nevada and Arizona�������������������������������������������������������������������15
7. Graphs showing monthly minimum, mean, and maximum evaporation at
Lake Mead, Nevada and Arizona, March 2010 through April 2019 and Lake
Mohave, Nevada and Arizona, May 2013 through April 2019; and monthly mean
evaporation at Lake Mead and Lake Mohave, Nevada and Arizona, May 2013
through April 2019�����������������������������������������������������������������������������������������������������������������������20
8. Graphs showing mean monthly, available energy, net radiation, change in
stored heat, and advected heat, Lake Mead and Lake Mohave, Nevada and
Arizona, May 2013 through April 2019�������������������������������������������������������������������������������������21
9. Graph showing mean monthly inflow and outflow water temperatures at Lake
Mead and Lake Mohave, Nevada and Arizona, May 2013 through April 2019�����������������22
10. Graphs showing mean water-temperature profiles by depth at Lake Mead,
Nevada and Arizona, March 2010 through October 2016; and at Lake Mohave,
Nevada and Arizona, May 2013 through October 2016��������������������������������������������������������23
11. Graph showing monthly mean inflow and outflow water temperatures at Lake
Mead, Nevada and Arizona, March 2010 through April 2019, and Lake Mohave,
Nevada and Arizona, May 2013 through April 2019��������������������������������������������������������������24
12. Graphs showing mean monthly turbulent flux, latent-heat flux, sensible-heat
flux, and Bowen ratio, Lake Mead and Lake Mohave, Nevada and Arizona, May
2013 through April 2019��������������������������������������������������������������������������������������������������������������26
13. Graphs showing annual available energy, net radiation, change in stored heat,
and advected heat, Lake Mead and Lake Mohave, Nevada and Arizona, May
2010 through April 2019��������������������������������������������������������������������������������������������������������������27
14. Graphs showing annual turbulent flux, latent-heat flux, sensible-heat flux, and
energy balance ratio, Lake Mead and Lake Mohave, Nevada and Arizona, May
2010 through April 2019��������������������������������������������������������������������������������������������������������������28
15. Graph showing mean monthly vapor pressure difference at Lake Mead and
Lake Mohave, Nevada and Arizona, May 2013 through April 2019������������������������������������29
16. Graphs showing probable minimum, most probable, and probable maximum
annual evaporation at Lake Mead and Lake Mohave; and most probable annual
evaporation at Lake Mead and Lake Mohave, Nevada and Arizona, May 2010
through April 2019�����������������������������������������������������������������������������������������������������������������������31
17. Graphs showing Lake Mead and Lake Mohave, Nevada and Arizona, mean
monthly evaporation estimates for this study compared to 24-month study
evaporation coefficients, March 2013 through April 2019���������������������������������������������������32v
Tables
1. Monthly evaporation coefficients used in the Bureau of Reclamation's
24-Month Study on projected hydrologic conditions and water use of Lake
Mead and Lake Mohave, Nevada and Arizona�����������������������������������������������������������������������5
2. Location and general description of measurement sites, Lake Mead and Lake
Mohave, Nevada and Arizona��������������������������������������������������������������������������������������������������13
3. Turbulent flux and available energy data gaps at Lake Mead and Lake Mohave,
Nevada and Arizona, 2015–18���������������������������������������������������������������������������������������������������16
4. Annual energy balance and summary statistics, Lake Mead, Nevada and
Arizona, January 2011 through December 2018��������������������������������������������������������������������17
5. Annual energy balance and summary statistics, Lake Mohave, Nevada and
Arizona, January 2014 through December 2018��������������������������������������������������������������������18
6. Monthly evaporation and summary statistics, Lake Mead, Nevada and Arizona,
March 2010 through April 2019�������������������������������������������������������������������������������������������������18
7. Monthly evaporation and summary statistics, Lake Mohave, Nevada and
Arizona, May 2013 through April 2019�������������������������������������������������������������������������������������19
8. Annual evaporation and summary statistics, Lake Mead, Nevada and Arizona,
January 2011 through December 2018������������������������������������������������������������������������������������30
9. Annual evaporation and summary statistics, Lake Mohave, Nevada and
Arizona, January 2014 through December 2018��������������������������������������������������������������������30
Conversion Factors
International System of Units to U.S. customary units
Multiply By To obtain
Length
centimeter (cm) 0.3937 inch (in.)
millimeter (mm) 0.03937 inch (in.)
meter (m) 3.281 foot (ft)
kilometer (km) 0.6214 mile (mi)
meter (m) 1.094 yard (yd)
Area
square meter (m2) 0.0002471 acre
hectare (ha) 2.471 acre
square kilometer (km2) 247.1 acre
2
square meter (m ) 10.76 square foot (ft2)
hectare (ha) 0.003861 square mile (mi2)
square kilometer (km2) 0.3861 square mile (mi2)
Volume
cubic meter (m3) 0.0002642 million gallons (Mgal)
3
cubic centimeter (cm ) 0.06102 cubic inch (in3)
3
cubic meter (m ) 35.31 cubic foot (ft3)
cubic meter (m3) 0.0008107 acre-foot (acre-ft)
3
million cubic meter (Mm ) 0.8107132 kilo acre-foot (Kaf)vi
Multiply By To obtain
Flow rate
cubic meter per second (m3/s) 70.07 acre-foot per day (acre-ft/d)
3
cubic meter per year (m /yr) 0.000811 acre-foot per year (acre-ft/yr)
meter per second (m/s) 3.281 foot per second (ft/s)
cubic meter per second (m3/s) 35.31 cubic foot per second (ft3/s)
cubic meter per day (m3/d) 264.2 gallon per day (gal/d)
cubic meter per second (m3/s) 22.83 million gallons per day (Mgal/d)
millimeter per year (mm/yr) 0.03937 inch per year (in/yr)
kilometer per hour (km/h) 0.6214 mile per hour (mi/h)
Mass
gram (g) 0.03527 ounce, avoirdupois (oz)
kilogram (kg) 2.205 pound avoirdupois (lb)
Pressure
kilopascal (kPa) 0.009869 atmosphere, standard (atm)
kilopascal (kPa) 0.01 bar
kilopascal (kPa) 0.1450 pound per square inch (lb/ft2)
Density
3
kilogram per cubic meter (kg/m ) 0.06242 pound per cubic foot (lb/ft3)
gram per cubic centimeter (g/cm3) 62.4220 pound per cubic foot (lb/ft3)
Energy
joule (J) 0.0000002 kilowatthour (kWh)
3
joule per cubic meter (J/m ) 0.00000738 watthour per cubic foot (Wh/ft3)
2
watt per square meter (W/m ) 0.0222 calorie per second per square foot
(cal/s/ft2)
Frequency
hertz (Hz) 1 cycle per second
Temperature in degrees Celsius (°C) may be converted to degrees Fahrenheit (°F) as follows: °F
= (1.8 × °C) + 32.
Datum
Vertical coordinate information is referenced to the North American Vertical Datum of 1988
(NAVD 88).
Horizontal coordinate information is referenced to the North American Datum of 1983 (NAD 83).
Altitude, as used in this report, refers to distance above the vertical datum.
Lake Mead elevation, as used in this report, is referenced to the U.S. Geological Survey datum,
adjustment of 1912, locally known as “Power House Datum.”vii Abbreviations 24MS 24-Month Study AOP Annual Operating Plan BREB Bowen ratio energy budget CSAT3 Sonic anemometer EBR Energy balance ratio EC Eddy covariance KH2O Krypton hygrometer LMNRA Lake Mead National Recreation Area MDV Mean diurnal variation Qe Latent-heat flux Qh Sensible-heat flux Qn Net radiation Qs Solar radiation Qv Advected heat Qx Change in stored heat Reclamation Bureau of Reclamation RM River mile SNWP Southern Nevada Water Project USGS U.S. Geological Survey
Evaporation from Lake Mead and Lake Mohave, Nevada
and Arizona, 2010–2019
By Katherine J. Earp and Michael T. Moreo
Abstract Introduction
Evaporation-rate estimates at Lake Mead and Lake Lake Mead is part of a system of dams and reservoirs that
Mohave, Nevada and Arizona, were based on eddy covariance control the Colorado River and enable its efficient use (fig. 1).
and available energy measurements from March 2010 through Water demand has steadily increased since the implementa-
April 2019 at Lake Mead and May 2013 through April 2019 tion of the Colorado River Compact of 1922 as the upper- and
at Lake Mohave. The continuous data needed to compute lower-basin states have built the infrastructure needed to cap-
monthly evaporation were collected from floating-platform ture their full apportionment. From 2000 to 2010, the stage of
and land-based measurement stations located at each reser- Lake Mead fell approximately 40 meters (m; 131 feet, ft), rais-
voir. Collected data include latent- and sensible-heat fluxes, ing concerns among water managers about future water short-
net radiation, air temperature, wind speed, humidity, and ages. Future water shortages in the Colorado River system
water-temperature profiles. Data collection, analysis meth- could result from decreased runoff caused by continuing short-
ods, and monthly evaporation results for Lake Mead through term drought and long-term climate change. Accordingly,
February 2012 were documented in a U.S. Geological Survey imbalances between the water supply and demand may con-
(USGS) Scientific-Investigations Report, 2013–5229. Monthly tinue. Increasingly scarce water resources have underscored a
evaporation and associated datasets for both reservoirs need to improve water accounting and projection accuracy.
through April 2015 were published in a USGS Data Release The Bureau of Reclamation (Reclamation) Lower
(https://doi.org/10.5066/F79C6VG3). Average annual evapora- Colorado Region is responsible for delivering water from the
tion at Lake Mead was 1,896 millimeters (mm), which is a 10 lower Colorado River to Arizona, California, Nevada, and
percent difference from the 1,718 mm average annual evapo- Mexico. These responsibilities include (1) accounting for
ration at Lake Mohave; this was primarily due to differences diversions, consumptive use, and return flows; and (2) project-
in available energy. Average annual available energy at Lake ing Lower Basin water availability. Reclamation operates a
Mead was 139 watts per square meter (W/m2), which is an 18 model called the 24-Month Study (24MS) that projects future
percent difference from the 116 W/m2 average annual avail- Colorado River reservoir volumes and potential dam opera-
able energy at Lake Mohave. Differences in available energy tions based on hydrologic conditions at the time of this study,
are driven by differences in advected heat between Lake Mead projected hydrologic conditions, and operational policies and
and Lake Mohave; advected heat at Lake Mohave is lower due guidelines (https://www.usbr.gov/lc/region/g4000/24mo.pdf).
to colder inflows and warmer outflows. Lake Mead monthly Each month, the 24MS simulates water budgets and projects
evaporation estimates for this study compare reasonably well future reservoir conditions and potential dam operations for
to the Bureau of Reclamation’s 24-Month Study (24MS) the next 24-month period. Increasing the accuracy of the
evaporation coefficients, which are based on pioneering stud- 24MS model and improving projected hydrologic conditions
ies from the 1950s. Temporal trends in this study indicate that are high priorities for Reclamation.
the effects of heat storage at Lake Mead were underestimated In cooperation with Reclamation, the U.S. Geological
in the 24MS, particularly during the fall months when energy Survey (USGS) conducted a study to improve 24MS model
was released from the lake. Mean monthly evaporation rates at projections by improving monthly estimates of evaporation
Lake Mead were greater than Lake Mohave from June through from Lake Mead and Lake Mohave. Reservoir evaporation
November during the study period. The seasonal pattern of is a water-budget term used in the model that is based on
evaporation at Lake Mohave in this study indicates that the poorly documented modifications to original USGS estimates
effects of available energy were underestimated in the 24MS (Harbeck and others, 1958). In this study, the continuous data
coefficients for this reservoir, and that evaporation was sub- needed to compute monthly evaporation were collected from
stantially overestimated from spring through summer during floating-platform and land-based measurement stations located
the study period of 2013 through 2019. at each reservoir. Collected data include latent- and sensible-
heat fluxes (Qe and Qh), net radiation (Qn), air temperature,2 Evaporation from Lake Mead and Lake Mohave, Nevada and Arizona, 2010–2019
115°30' 115° 114°30'
Muddy River Virgin River
93 15
36°30' 95
Overton
Arm
Lake Mead National
Recreation Area
Las Las Vegas
Vegas Wash Area of
Lake Mead
figure 3
215
Virgin
Basin Temple
Boulder Basin
Basin
Hoover Dam
36°
Temple
Bar
y
Willow
e
ll
Beach
a
M o h a v e C ounty
V
C l a r k C ounty A R I Z ONA
15
N E VADA
o
d
ra
Colorado
o
ld
River
E
95
Lake
UTAH Powell
NEVADA Glen Cottonwood
Map area
Canyon Cove
35°30' er Dam
Lake o Riv Area of
rad
Las RM 280
Mead l o Lake figure 4
Vegas
Co 11
Mohave
Hoover Dam
93
RM 246 RM 226
Lake ARIZONA
Mohave
Davis Dam
Davis Dam
CALIFORNIA
Note: RM, River Mile
Base from The National Map, U.S. Geological Survey, 2020. 0 10 20 30 MILES
Universal Transverse Mercator projection, zone 11N,
World Geodetic System of 1984.
0 10 20 30 KILOMETERS
Figure 1. Overview of Lake Mead and Lake Mohave in Lake Mead National Recreation Area in Nevada and Arizona.Introduction 3
wind speed, humidity, and water-temperature profiles. accurately (Harbeck and others, 1958). The BREB method
Measurements began in March 2010 at Lake Mead and May was chosen as the control to test mass-transfer equations, even
2013 at Lake Mohave and ended in May 2019 for both lakes. though the method was not expected to be as accurate as the
There were three prior publications released for this study: (1) water-budget control at Lake Hefner. The annual evapora-
data collection, analysis methods, and monthly evaporation tion estimates for the BREB and mass-transfer methods were
results for Lake Mead through February 2012 were docu- in such close agreement, partly because these methods were
mented in a USGS Scientific-Investigations Report (Moreo not completely independent as applied, that the investigators
and Swancar, 2013; https://pubs.usgs.gov/sir/2013/5229/pdf/ combined them for an average annual evaporation rate of
sir2013-5229.pdf); (2) monthly evaporation and associated 2,172 mm (86 in.) for Lake Mead (Harbeck and others, 1958).
datasets for both reservoirs through April 2015 were published The resulting average evaporation volume of 1,079 million
in a USGS Data Release (Moreo, 2015; https://www.scienc cubic meters (Mm3); 875 kilo acre feet, Kaf) is nearly three
ebase.gov/catalog/item/55f6fba8e4b0477df11bff2b); and (3) times Nevada’s annual allocation from the Colorado River
meteorological data from both lakes following the removal of of 370 Mm3 (300 Kaf). As a more practical way to estimate
the floating platforms in September 2016 at Lake Mohave and monthly evaporation than these large-scale study efforts, a
in April 2017 at Lake Mead were published in a USGS Data mass-transfer equation was devised whereby monthly evapo-
Release (Moreo, 2018; https://www.sciencebase.gov/catalog/ ration could be estimated with a combination of variables
item/5a74e8c1e4b00f54eb1c82df). Some of the text in this measured at Lake Mead and at the Las Vegas airport (Harbeck
report is drawn from Moreo and Swancar (2013). and others, 1958). This equation was used by Reclamation to
estimate evaporation until 1994. The mean annual evaporation
rate for the period 1953–94 was 1,930 mm (76 in.), but the
Purpose and Scope mean for 1953–73 was 2,032 mm (80 in.), and the mean for
1974–94 was 1,829 mm (72 in.; Westenburg and others, 2006).
The purpose of this report is to present updated monthly
The lower annual evaporation rates during the latter period
evaporation estimates for Lake Mead and Lake Mohave
also were more variable, which may have resulted either from
using the eddy covariance (EC) and energy balance methods.
a series of programmatic modifications or faulty equipment.
This report enhances the 2013 Moreo and Swancar report by
Westenburg and others (2006) established four floating plat-
providing additional years of data. Monthly evaporation-rate
forms in different basins in Lake Mead for varying lengths of
estimates are based on EC and available energy measurements
time between 1997 and 1999. Using the BREB method, they
from March 2010 through April 2019 at Lake Mead and May
estimated an annual evaporation rate of 2,286 mm (90 in.).
2013 through April 2019 at Lake Mohave. The results are
Harbeck and others (1958) concluded that, for cost
expected to improve water-budget and projection accuracy of
effectiveness, operational estimates of evaporation from Lake
Reclamation’s 24MS model (Moreo and Swancar, 2013).
Mead are obtainable with data collected in Boulder Basin
(fig. 1). The areal variation in water temperature is mini-
Previous Studies mal based on observations of water-temperature profiles in
Boulder Basin, Virgin Basin, Overton Arm, and Temple Bar
The earliest attempt to estimate evaporation from Lake (fig. 1; Harbeck and others, 1958). Similarly, Anderson and
Mead based on meteorological and limnological data was Pritchard (1951) concluded that a single water-temperature
by Anderson and Pritchard (1951). Their work was part of profile measurement in Boulder Basin reasonably represents
a series of comprehensive surveys conducted by the USGS, the entire lake. These conclusions are supported by analyses
Reclamation, the U.S. Navy Electronics Laboratory, and oth- of water-temperature profiles contained within this report and
ers to evaluate sedimentation and salinity in 1948–49 (Smith additional data reported in Veley and Moran (2012). Based
and others, 1960). Lake temperature profiles were measured on a less than 2-percent difference in net incoming radiation
monthly at more than 60 locations. The Bowen ratio energy from the four stations in the Lake Mead area used by Harbeck
budget (BREB) method was used to estimate an annual evapo- and others (1958), there is “no basis to conclude that there is a
ration rate of 1,626 millimeters (mm; 64 inches, in.). Their significant areal variation in radiation.” A maximum deviation
study highlighted the need to more fully develop the BREB in the Bowen ratio of 0.079 between these four sites indicated
method at a lake where evaporation was known. These same a maximum variation in evaporation of 8 percent.
agencies then participated in a landmark study of lake evapo- Westenburg and others (2006) evaluated the spatial
ration at Lake Hefner, Oklahoma in 1950–51 (U.S. Geological variation in monthly evaporation at three open-water sites and
Survey, 1954). This location was chosen because, in contrast one partially wind-sheltered site using the BREB method and
to Lake Mead, the water budget could be determined with suf- concluded that the spatial variation in evaporation was mini-
ficient accuracy (plus or minus 5 percent) to serve as a control mal for open-water areas of Lake Mead. The spatial variations
for testing evaporation methods including energy budget and in evaporation reported by both Westenburg and others (2006)
mass transfer. The study group subsequently moved back and Harbeck and others (1958) are within the 5–10 percent
to Lake Mead in 1952–53 to conduct further research into uncertainty range for the EC method reported by Foken
methods and the equipment needed to measure evaporation (2008, p. 122).4 Evaporation from Lake Mead and Lake Mohave, Nevada and Arizona, 2010–2019
Anderson and Pritchard (1951) determined that a single evaporation was 6 and 8 percent greater than EC evaporation
temperature profile was representative of all of Lake Mead for the 2 study years, and both methods indicated that there
for the purpose of quantifying change in stored heat (Qx) was a similar decrease in evaporation from the first to the sec-
based on 12 surveys over a year at 60 locations distributed ond year. Both methods produced negative Qh during the same
throughout the lake. They found that differences between months, and there was a strong correlation between monthly
temperature profiles in shallow and deep parts of the lake were Bowen ratios (R2 = 0.94). The correlation between monthly
not significant and that “energy storage for any standard layer evaporation rates (R2 = 0.65), however, was not as strong.
and the monthly change in this storage are essentially uniform Monthly differences in evaporation were attributed primarily
regardless of the depth of the water.” Similarly, a Wilcoxon to heat storage estimate uncertainty.
signed-rank statistical test of monthly Qx was calculated, using
temperature data from floating platforms at Sentinel Island,
Temple Basin, and Virgin Basin (Veley and Moran, 2012), and 24-Month Study
found no significant difference between the median monthly
The 24MS projects monthly hydrologic conditions and
Qx for paired values from any two of these locations (p=0.64
operations for Colorado River System reservoirs for the
to 0.93).
next 2 years. The 24MS is pursuant to the December 2007
Moreo and Swancar (2013) measured evaporation from
Record of Decision on Colorado River Interim Guidelines
Lake Mead using the EC and BREB methods for the 2-year
for Lower Basin Shortages and the Coordinated Operations
period beginning in March 2010. When corrected for energy
of Lake Powell and Lake Mead (https://www.usbr.gov/lc/
imbalances, annual EC evaporation was 2,070 and 1,880
region/programs/strategies/RecordofDecision.pdf; Bureau
mm (81.5 and 74.0 in.) for 2010 and 2011, within the range
of Reclamation, 2007) and is used to develop the Annual
of previous estimates. There was a 9-percent decrease in the
Operating Plan (AOP). The AOP is the cooperative working
evaporation rate and a 10-percent increase in the lake surface
document among Colorado River users that contains the plan
area during the second year of the study compared to the first.
of dam and reservoir operations for this year. The 24MS com-
These offsetting factors resulted in a nearly identical 720
puter model projects future reservoir conditions and potential
million cubic meters (m3; 584,000 acre-feet, acre-ft) evapora-
dam operations for the system of reservoirs given existing
tion volume for both years. Monthly evaporation rates were
reservoir conditions, inflow forecasts and projections, and a
best correlated with wind speed, vapor pressure difference,
variety of operational policies and guidelines.
and atmospheric stability. Differences between monthly mean
Monthly evaporation from Lake Mead is a water-budget
evaporation and mean monthly evaporation were as much as
term used in the model that is based on poorly documented
20 percent. Net radiation provided most of the energy avail-
modifications to early estimates of lake evaporation (Harbeck
able for evaporative processes; however, advected heat (Qv)
and others, 1958). Evaporation estimates in the 24MS are
from the Colorado River was an important energy source
developed by applying monthly evaporation coefficients to
during the second year of the study (Moreo and Swancar,
monthly lake volumes. The 24MS evaporation coefficients
2013). Peak evaporation lagged peak Qn by 2 months because
change month to month to reflect seasonal variation but do not
a greater proportion of the Qn that reaches the lake goes to
change on an annual basis (table 1). Evaporation estimates in
heating up the water column during the spring and sum-
this study represent monthly evaporation for each year of the
mer months. As most of this stored energy is released in the
period of record, 2010–19 for Lake Mead and 2013–19 for
later summer and fall months, higher evaporation rates are
Lake Mohave and can be used to refine the 24MS model for
sustained during fall months even though Qn declines. The
future evaporation projections.
release of stored heat also fueled nighttime evaporation, which
accounted for 37 percent of total evaporation. The annual
energy balance ratio (EBR) was 0.90 on average and varied Description of Study Area
only 0.01 between the 2 years, thus implying that 90 percent
of estimated available energy was accounted for by turbulent The Colorado River runs nearly 1,450 miles (mi) from
energy measured using the EC method. More than 90 percent its headwaters in Colorado and Wyoming to a historical
of the turbulent-flux source area represented the open-water terminus in the Gulf of California. The Colorado River Basin
surface, and 94 percent of 30-minute turbulent-flux measure- is over 637,000 square kilometers (km2; 246,000 square
ments originated from wind directions where the fetch ranged miles, mi2) and includes parts of seven states in the United
from 2,000 to 16,000 m. Evaporation uncertainties were esti- States—Wyoming, Colorado, Utah, New Mexico, Arizona,
mated to be 5–7 percent. Nevada, and California; and two Mexican states, Sonora and
Moreo and Swancar (2013) also employed the BREB Baja California. Several dams impound and control the river,
method to measure evaporation from Lake Mead primarily as with the two largest being Glen Canyon Dam (forming Lake
a validation of EC evaporation measurements at annual tim- Powell) and Hoover Dam (forming Lake Mead; fig. 1). The
escales. There was good agreement between annual corrected Colorado River is unregulated between Lake Powell and Lake
EC and BREB evaporation estimates, providing strong valida- Mead, with most of that distance occurring through the Grand
tion of these two largely independent methods. Annual BREB Canyon. Downstream of Lake Mead, a series of reservoirsIntroduction 5
Table 1. Monthly evaporation coefficients used in the Bureau of of temperature and precipitation amounts. The average of
Reclamation's 24-Month Study on projected hydrologic conditions the mean daily maximum temperature for the sites is about
and water use of Lake Mead and Lake Mohave, Nevada and 43 degrees Celsius (°C; 110 degrees Fahrenheit, °F) in July
Arizona. and 17 °C (62 °F) in December, and the average of the mean
daily minimum temperature for the sites is about 27 °C (80
[ft, foot]
°F) in July and 4 °C (39 °F) in December. Period of record
annual precipitation was 13.87 centimeters (cm; 5.46 in.) at
Months Lake Mead (ft) Lake Mohave (ft)
Callville Bay, 14.12 cm (5.56 in.) at Willow Beach, 14.27 cm
January 0.36 0.36 (5.62 in.) at Temple Bar, and 13.66 cm (5.38 in) at Laughlin.
February 0.33 0.36 From January 2014 to December 2018, the annual mean wind
March 0.37 0.48 speed measured at the Lake Mead EC station was 4.4 meters
April 0.46 0.61 per second (m/s; 9.8 mi/hr) and was 4.1 m/s (9.2 mi/hr) at the
Lake Mohave EC station. These measured wind speeds are
May 0.53 0.81
similar to the mean annual wind speed of 3.9 m/s recorded at
June 0.64 0.93 the Las Vegas airport from 1984 to 2010 (National Weather
July 0.80 0.93 Service, 2013).
August 0.85 0.84
September 0.70 0.68
Lake Mead
October 0.51 0.56
November 0.51 0.40 Lake Mead is the largest reservoir by volume in the
nation, and provides drinking water, irrigation, and hydro-
December 0.44 0.35
power to more than 25 million people in three states (Nevada,
California, and Arizona; Holdren and Turner, 2010; h
were built to further regulate the river for hydropower and ttps://www.usbr.gov/projects/index.php?id=540). Lake Mead
delivery to downstream users, including Lake Mohave (Davis was formed following the 1935 completion of Hoover Dam
Dam), and Lake Havasu (Parker Dam; Lake Havasu is out- and it took 6 years for the Colorado River to fill the reservoir.
side of the Lake Mead Recreation Area and is not included The Colorado River accounts for approximately 97 percent of
in fig. 1). inflows to Lake Mead (Westenburg and others, 2006; Turner
The Lake Mead National Recreation Area (LMNRA) and others, 2012). The remaining 3 percent of inflows are
consists of Lake Mead and Lake Mohave (fig. 1). The cli- from the Las Vegas Wash, Muddy River, Virgin River, and
mate in the LMNRA is hot, arid, and windy. This warm, ephemeral streams (Westenburg and others, 2006; Turner and
arid environment is conducive to high rates of evaporation. others, 2012). From 1935 through 2001 the computed average
Sparsely vegetated, gentle to moderately sloping alluvial fans combined inflow was 13,400 Mm3 per year (yr; 10,860 Kaf/yr;
and steep, barren, rocky cliffs surround Lake Mead. Generally, Ferrari, 2008). During the 1999–2010 drought period, average
the adjacent hills rise to low or moderate height above the inflows were reduced to 10,100 Mm3/yr (8,190 Kaf/yr; Turner
lake surface. Lake Mohave is surrounded by sparsely veg- and others, 2012). Average inflows for the period of this study,
3
etated, steep, and narrow canyon walls, and adjacent hills rise 2010 through 2019, were 12,008 Mm /yr (9,735 Kaf/yr).
to low or moderate height above the lake surface. Both lakes The watershed area draining to Lake Mead is approxi-
are exposed to winds from the southwest to southeast in the mately 435,000 km2 (168,000 mi2), or 5 percent of the United
summer and west/northwest winds during the winter (U.S. States (Thomas, 1954). The reservoir is at full capacity when
Department of Commerce, 1953). the water-level elevation is 374.6 m (1,229 ft) above mean sea
There are four historical National Weather Service level. At full capacity, the total storage is 34,069 Mm3 (27,620
cooperator sites (https://www.nws.noaa.gov/om/coop/; http Kaf) and the surface area is 659.3 km2 (162,916 acres; Tighi
://www.wrcc.dri.edu/summary/Climsmnv.html) with longer and Callejo, 2011).
periods of record in the area—Callville Bay (7 km northeast of Lake Mead consists of a series of basins separated by
Lake Mead EC2; period of record 1989–2011; http://www.wrc narrower reaches. Boulder Basin (the most downstream basin
c.dri.edu/cgi-bin/cliMAIN.pl?nv1371), Willow Beach (27 nearest to Hoover Dam) and Virgin Basin (the next upstream
km south-southeast of Lake Mead EC2 and 57 miles north basin) account for approximately 60 percent of the total stor-
of Lake Mohave EC1; period of record 1967–2008; http age in the lake (Thomas, 1954). Lake depths are up to approxi-
://www.wrcc.dri.edu/cgi-bin/cliMAIN.pl?az9376), Temple Bar mately 140 m (460 ft) and widths range from 200 m (656 ft) in
(40 km west of Lake Mead EC2; period of record 1987–2009; the narrow canyons to 16 kilometers (km; 10 mi) in the larger
http://www.wrcc.dri.edu/cgi-bin/cliMAIN.pl?az8516), and basin areas. Lake water generally is clear, and small currents
Laughlin (22 miles south of Lake Mohave EC1; period of are related to lake circulation (Thomas, 1954). The average
record 1988–2016; https://wrcc.dri.edu/cgi-bin/cliMAIN.pl? residence time of water moving through Lake Mead has been
nv4480). There is little variation between these sites in terms estimated as 3.9 years (Westenburg and others, 2006) and 2.6
years (Turner and others, 2012).6 Evaporation from Lake Mead and Lake Mohave, Nevada and Arizona, 2010–2019
Flow through Hoover Dam is through the four intake
towers located above the dam. Water supply for the power-
Methods of Study
plant turbines is drawn through the intake towers by a com- The following is an abbreviated discussion of the meth-
bination of upper gates at an elevation of 1,050 ft and lower ods, which are fully provided in Moreo and Swancar (2013)
gates at an elevation of 895 ft. Water flows from the intake and continued for this study. Methods to estimate lake evapo-
towers through a series of penstocks where flow is measured, ration generally fall into three categories: (1) aerodynamic
then the water flows out through the tailrace where water qual- methods, (2) energy balance methods, and (3) methods that
ity and temperature are measured. combine these two approaches (Allen and others, 1998; Finch
and Hall, 2005; Rosenberry and others, 2007). Eddy covari-
Lake Mohave ance is a micrometeorological method that also falls into the
first category; when EC is corrected for energy balance closure
Lake Mohave extends approximately 67 mi along a series it falls within the third category. The BREB method is in the
of narrow canyons from Hoover Dam to Davis Dam, strad- second category.
dling the southern Nevada and northwestern Arizona border The selection of a method or methods to estimate
(fig. 1). Davis Dam was completed in 1953 as one of the last evaporation, each with its own strengths and weaknesses, is
dams on the Colorado River and was built with a primary pur- typically dictated by study objectives, the size and complex-
pose to regulate Hoover Dam releases for delivery to Mexico ity of the study area, and costs. The primary objective of this
(Ohmart and others, 1988). The lake follows the original river study was to provide accurate monthly evaporation rates,
channel and has a maximum width of 6.4 km (4 mi) and a which are expected to improve 24MS water budget and model
maximum depth of 36.5 m (120 ft). Although water level is output accuracy. The EC method was chosen as the primary
largely controlled by releases from Davis Dam, the reservoir method because it provides the most direct and least uncer-
is primarily riverine from below Hoover Dam through Black tain measure of monthly evaporation (Moreo and Swancar,
Canyon, before transitioning to true reservoir conditions in 2013). Furthermore, even though the focus of this report is
Eldorado Canyon (National Park Service, 2020). South of on monthly estimates, one significant advantage of the EC
Eldorado Canyon, Lake Mohave gradually widens to its wid- method over other methods is the ability to accurately mea-
est point in Cottonwood Cove. sure daily and sub-daily evaporation. Processes that control
Inflow to Lake Mohave is provided by releases from open-water evaporation become more evident at these shorter
Hoover Dam and averaged 11,250 Mm3/yr (9,120 Kaf/yr) for time steps (Blanken and others, 2003; Liu and others, 2009;
the period of record of this study, May 2013–May 2019 (h Granger and Hedstrom, 2011).
ttps://www.usbr.gov/lc/region/g4000/24mo/index.html). The In this study, evaporation is calculated from latent heat
reservoir is at full capacity when the water-level elevation is following the Stull equation (Stull, 1988). The evaporation
197.2 m (647 ft) above mean sea level. At full capacity, the rate, E, in m/s is shown in the equation below:
total storage is 2,242 Mm3 (1,818 Kaf), and the surface area
is 113.3 km2 (28,000 acres; https://www.usbr.gov/projects/ Qe * 1.8
_____________
index.php?id=47). Monthly mean lake elevations ranged from
E = (1)
2501 − 2.37 * Ta
634.8 to 644.7 ft for the period of record for this study. The
average residence time has been estimated at 60 days (Rosen
where
and others, 2012).
Qe is the latent-heat flux, or the energy used for
The crest of Davis Dam is at an elevation of 655 ft,
evaporation, in watts per square meter
just above the high-water elevation of 647 ft (Bureau of
(W/m2), and
Reclamation, 1955). The height of the dam is 200 ft, with
Ta is the air temperature in °C.
a dead storage pool elevation of 533 ft. The powerplant on
Davis Dam is supplied with water through spillways and Although latent heat is the primary component in
an outlet structure. Outflow water temperature is measured evaporation calculations using the EC method, other energy
downstream of the spillway and represents surface-water gains and losses are used to refine evaporation results. Final
temperature of the lake. Temperatures entering Lake Mohave evaporation results were adjusted using energy balance closure
from Hoover Dam are cold throughout the year (averaging 14 procedures.
°C) and stay cold throughout Black Canyon because shade
from the steep walls of the canyon help maintain the tempera-
ture. Temperatures in the downstream Cottonwood Cove can Energy Balance
be much warmer in the summer, which leads to a convergence
zone in Eldorado Canyon as cold, nutrient-rich upstream water Excluding the energy fluxes considered negligible for the
flows under the warmer lake water (National Park Service, previous study, the energy balance of Lake Mead and Lake
2020). The two waters are considered to have thoroughly Mohave can be explained by the following equation (fig. 2;
mixed by the point at which water temperature is measured at Moreo and Swancar, 2013):
the Davis Dam outflow.Methods of Study 7
Q n − Qx + Q v = Q e + Q h (2) measure of turbulent exchange available (Baldocchi, 2003;
Foken, 2008; Stannard and others, 2013). Fluxes of water
where vapor and heat can be measured directly without the applica-
Qn is the net radiation, tion of empirical constants by finding the covariance between
Qx is the change in stored heat, these scalars and vertical wind speed (Foken, 2008; Campbell
Qv is the net heat advected into the lake, Scientific, Inc., 2010b). Evaporation (positive Qe) occurs
Qe is the latent-heat flux, or the energy used for when water vapor in upward moving eddies is greater than in
evaporation, and downward moving eddies. Likewise, Qh is positive (from the
Qh is the sensible-heat flux, or the energy surface to the atmosphere) when upward moving eddies are
conducted between the lake and the warmer than downward moving eddies.
atmosphere.
All Q terms are expressed in W/m2. The left side of the Latent-Heat Flux (Qe)
equation represents available energy, and the right side repre- Latent-heat flux (Qe), as defined for this study, is the
sents turbulent energy. Each of the energy fluxes in equation 2 energy removed from the lakes during the liquid-to-vapor
is measured independently for the EC method. phase change of water and is the product of the latent heat of
vaporization of water (λ) and water-vapor flux density. The
Eddy Covariance Turbulent Flux Measurements latent heat of vaporization, although slightly temperature
dependent, is nearly constant. Water-vapor flux density is
Eddies are turbulent airflow caused by wind, surface calculated as the covariance of instantaneous deviations from
roughness, and convective heat flow in the atmospheric the time-averaged product of water-vapor density and verti-
surface layer (Swinbank, 1951; Brutsaert, 1982; Kaimal and cal wind speed. Eddy covariance derived Qe can be expressed
Finnigan, 1994). Eddies transfer energy and mass between mathematically as the equation below:
land and water surfaces and the atmosphere (Brutsaert, 1982).
The sum of Qe and Qh is referred to as turbulent flux, or turbu- Q e = λ ¯
w′ ρv ' (3)
lent energy, in W/m2. The EC method provides the most direct
h)
(Q
e)
n)
(Q
x
(Q
flu
x
n
lu
tio
at
f
e
ia
at
-h
ad
e
le
-h
tr
b
nt
si
Ne
te
n
Se
La
River inflow
Advected-heat flux (+Q v)
Heat storage (Qx)
Advected-heat flux (-Q v)
Outflow Modified from Saur and Anderson, 1956
Figure 2. Major energy-budget components diagram.8 Evaporation from Lake Mead and Lake Mohave, Nevada and Arizona, 2010–2019
where Qe + Q h
w is the vertical component of wind EBR = ___________
(5)
Qn − Qx + Q v
speed, in m/s,
ρv is the water vapor density, in grams (g)
where
per m3, and
Qe is the latent-heat flux, or the energy used for
′ are the primes that are deviations from
evaporation,
mean values, and the overbar denotes
Qh is the sensible-heat flux, or the energy
mean value.
conducted between the lake and the
Deviations from mean values were measured at 10 hertz atmosphere,
(Hz; 10 times per second), and mean values were computed Qn is the net radiation,
over a 30-minute period. The Qe is converted to evaporation Qx is the change in stored heat, and
using equation 1. Qv is the net heat advected into the lake.
If all known energy fluxes appear in the energy budget
Sensible-Heat Flux (Qh) equation and all energy fluxes are measured accurately, then
the EBR would equal unity; this concept is commonly called
Sensible-heat flux (Qh) is the movement of heat energy energy balance closure. In reality, the sum of EC turbulent
that results from a temperature difference between the surface energy is consistently less than the sum of available energy,
of the lake and the atmosphere. The EC method computes Qh with various explanations given for the source of the dis-
from air temperature and vertical wind speed as the equa- crepancy (Wilson and others, 2002; Foken, 2008; Foken and
tion below: others, 2012; Leuning and others, 2012). Wilson and others
(2002) studied the results of other investigators and reported
Q h = ρ a Cp ¯
′ Ta '
w (4) annual EBR values ranging from 0.39 to 1.69 for 50 site-
years of data at 22 EC sites, with an average value of 0.8, thus
implying that on average 80 percent of available energy is
where
accounted for by turbulent energy measurements. This lack of
ρa is the air density, in kilogram (kg) per m3,
energy balance closure is quantifiable because the EC system
Cp is the specific heat of air, in joules (J)
measures latent- and sensible-heat energy independently.
per kg °C,
Foken and others (2012) suggest that the lack of closure
w is the vertical component of wind
at many EC sites is not related to errors in the EC method
speed, in m/s,
but instead is related to atmospheric conditions that cannot
Ta is air temperature, in °C, and
be measured using the EC method. When airflow contacts
′ are the primes that are deviations from
significant landscape heterogeneities, large eddies are formed
mean values, and the overbar denotes
and a secondary atmospheric circulation pattern is developed;
mean value.
therefore, these secondary circulation patterns are not uni-
formly distributed over an area. Furthermore, these secondary
circulation patterns are characterized by the transfer of energy
Energy Balance Closure from small to very large (greater than 1 km) eddies. The time
of passage of these very large eddies likely is too long for the
Eddy covariance evaporation estimates in this study were typical 30-minute to 1-hour averaging periods to capture; how-
adjusted for energy balance closure. Forced closure of the ever, longer averaging periods begin to violate the principles
energy balance equation involves balancing the latent- and of stationarity. The resulting advective flux divergence is dif-
sensible-heat energy against independently measured available ficult to detect.
energy, as described in Moreo and Swancar (2013). Foken and In this study, energy balance closure is achieved by
others (2012) suggest that a first-order approximation for clos- dividing evaporation estimates by the annual EBRs. When the
ing the energy balance can be achieved by applying the Bowen EBR is less than 1, measured evaporation is adjusted upwards
ratio to calculated evaporation. The Bowen ratio, the ratio for closure, and the corrected results represent maximum
of Qh to Qe, has been traditionally important in determining evaporation. When the EBR is greater than 1, turbulent fluxes
energy balance in evapotranspiration studies (Bowen, 1926). are overestimated compared to available energy so measured
In this study, the EBR or the ratio of turbulent fluxes to evaporation must be adjusted downwards for closure, and the
available energy, is used to quantify energy balance closure adjusted results represent minimum evaporation. In this study,
(Moreo and Swancar, 2013). The EBR is computed as follows reported evaporation is the average of the measured and cor-
in the equation below: rected evaporation.Methods of Study 9
Available Energy Measurements equation (modified from Anderson and Pritchard, 1951, p. 101,
equation 93, and from Dave Stannard, U.S. Geological Survey,
Available energy is comprised of net radiation (Qn), written commun., 2010):
change in stored heat (Qx), and advected heat (Qv). Two of
the available energy parameters (Qn and Qx) were measured
directly by the USGS using instrumentation installed on float-
n C n(C
1
TTi t b
) TAbi T AH ( wTc −
Tc T
b T)b Ac A T
_ t t
ing platforms for this study. Advected heat was calculated
1∑ Ti tw −
t t
Q x + C
=
t t tt
Hc −c
[∑ i−1t Cw Hctc
1 ]
i−1 w i TH i i wtC cTH
using temperature and inflow and outflow data collected by Q
x n i
1
t−1 (6)
(
Tn i t−1
Ti t
b 1)
ATi t−1
(
)
t−1 t
1 t−1
Reclamation and USGS. Cw − T b A T itH
1
i + C
TH
C
T T − T
T A
A t
1
T
TH
i
1 i w wc c b b cc
where
Net Radiation (Qn) Qx is the change in heat stored per unit surface
Net radiation (Qn) was measured either directly using area of a water body, in W/m2,
net radiometers or indirectly using solar radiometers and 1 refers to the first (top) layer,
an established relationship between measured Qn and solar t is the length of measurement period,
radiation (Qs). Net radiation was measured from the floating in seconds,
platforms and Qs was measured from the land-based EC sta- n refers to the second from the bottom layer
tions. At Lake Mead, Qn was measured using net radiometers (constant thickness layer),
from the Sentinel Island floating platform (May 21, 2010, to i (subscript) is the ith layer,
April 22, 2013; Moreo and Swancar, 2013) and the Boulder Cw is the volumetric specific heat of water, equal
Basin floating platform (April 22, 2013, to April 25, 2017; to 4.187 x 10⁶ J/m3 °C,
Moreo, 2018). At Lake Mohave, Qn was measured using a net T is the average temperature of a layer, in °C,
radiometer from the Lake Mohave floating platform (April 11, t (superscript) is the end of the
2013, to September 30, 2016; Moreo, 2018). Solar radiation measurement period,
was measured at the Lake Mead EC station from March 28, Tb is the base temperature (assumed zero), in °C,
2015, to April 30, 2019, and at the Lake Mohave EC station t-1 (superscript) is the beginning of the
from March 20, 2015, to April 30, 2019. measurement period,
After the floating platforms were removed in 2016 for A is the surface area of the lake, in m2,
Lake Mohave and in 2017 for Lake Mead, Qn was estimated TH is the thickness of layer in which temperature
from a period of paired Qn /Qs measurements at each lake. change is measured in m, and
At Lake Mead, this estimation is based on the strong relation c (subscript) is the bottom layer (variable
between Qn measured at the Boulder Basin platform and Qs thickness layer).
measured at the EC2 site (y=1.01x–86.24, r2=0.97, n=17,519
Temperature profiles measured just after midnight
half-hourly measurements) and was applied from April 19,
(0000–0060 hour) on the first day of the month were used to
2017, to April 30, 2019 (fig. 3). At Lake Mohave, this esti-
quantify the monthly Qx. Layer thickness (TH) was 5 m at
mation is based on a strong relation between Qn measured
Lake Mead and 2.5 m at Lake Mohave except for the top and
at the floating platform and Qs measured at the EC1 site
bottom layers; the top layer was 1-m thick and the bottom
(y=0.94x–78.31, r2=0.92, n=17,567 half-hourly measurements;
layer thickness varied based on the lake level. The average
fig. 4).
temperature of each layer (T) was computed as the average
of the temperatures measured at the top and the bottom of the
Change in Stored Heat (Qx) layer. Surface area (A) for each layer was the average of the
top and bottom layer areas, determined from lake stage and
Change in stored heat (Qx) was calculated from water- storage relationship (Tighi and Callejo, 2011). The total stored
temperature profiles at the floating platforms. Temperatures heat for the lake at the beginning of each month was the sum
to 76 m (250 ft) depth (or the maximum depth measured if of the heat contents of all the layers. Change in stored heat
greater than 76 m) at Lake Mead and temperatures to 26 m (85 was then calculated as the difference between the total stored
ft or maximum depth) at Lake Mohave were used to calculate heat from one month to the next. Following the end of the
Qx. Below 76 m depth, water temperature at Lake Mead var- water-quality program in 2016 and the removal of the float-
ies little (Veley and Moran, 2012). The temperature data, as ing platforms, Qx was estimated based on an average of the 3
measured at various depths as layers, were combined with lake previous years of data.
stage and bathymetric data to obtain Qx using the followingYou can also read