WATERSHED BASED PLAN LAKE THUNDERBIRD WATERSHED - FOR THE - Oklahoma Conservation Commission Water Quality Division 2800 N. Lincoln Blvd., Suite ...
←
→
Page content transcription
If your browser does not render page correctly, please read the page content below
WATERSHED BASED PLAN
FOR THE
LAKE THUNDERBIRD WATERSHED
Photo courtesy of OTRD
Prepared By:
Oklahoma Conservation Commission
Water Quality Division
2800 N. Lincoln Blvd., Suite 160
Oklahoma City, OK 73105
(405) 5224500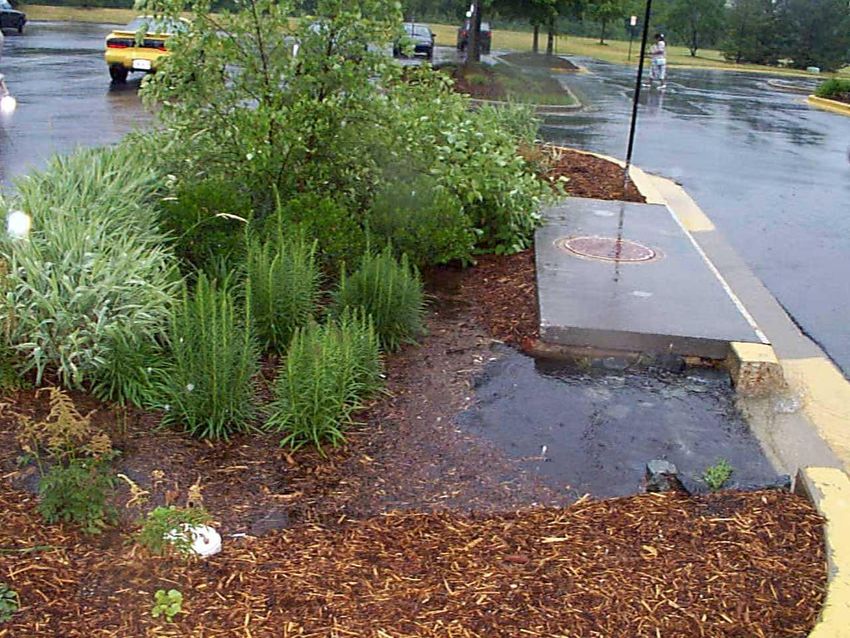
Lake Thunderbird WBP June 2010
Table of Contents
LIST OF TABLES 3
LIST OF FIGURES 3
PREFACE 4
INTRODUCTION 6
CAUSES and SOURCES 7
LOAD REDUCTIONS 17
NPS MANAGEMENT MEASURES 18
PUBLIC OUTREACH 24
CRITERIA 26
IMPLEMENTATION SCHEDULE and INTERIM MILESTONES 28
MONITORING PLAN 31
TECHNICAL and FINANCIAL ASSISTANCE NEEDED 37
REFERENCES 38
2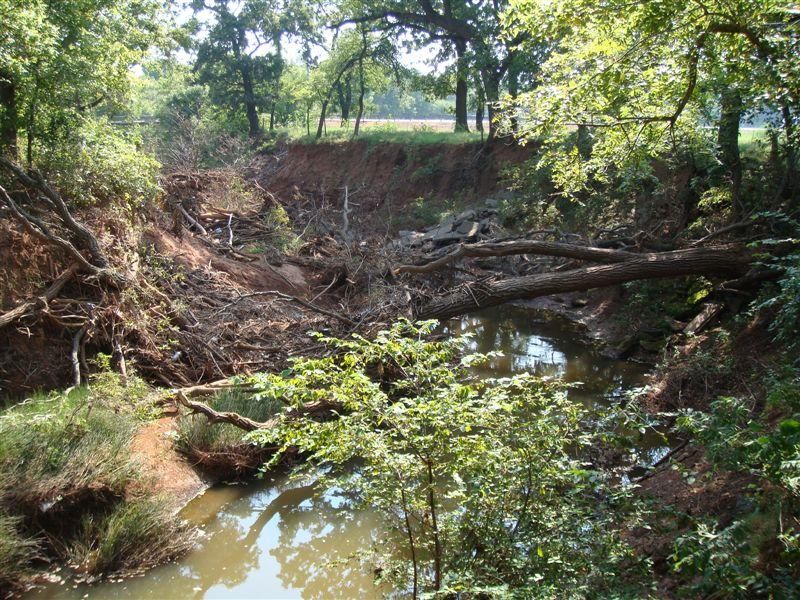
Lake Thunderbird WBP June 2010
LIST OF TABLES
Table 1. Population growth in Cleveland and Oklahoma Counties 10
Table 2. Landuse in the Lake Thunderbird watershed 10
Table 3. Waterbodies in the Lake Thunderbird watershed 12
Table 4. Livestock in Oklahoma and Cleveland Counties 16
Table 5. Possible management practices for urban areas 20
Table 6. Impact of targeted BMPs on phosphorus and chlorophylla 23
Table 7. Schedule and load reduction goals 29
Table 8. Interim milestones for Trailwoods project 30
Table 9. Autosampler locations in the Lake Thunderbird Watershed 34
Table 10. OCC analytical parameters and sampling frequency 34
Table 11. Funding for specific projects/efforts 37
LIST OF FIGURES
Figure 1. Lake Thunderbird watershed 7
Figure 2. Municipalities in the Lake Thunderbird watershed 9
Figure 3. Landuse in the Lake Thunderbird watershed 11
Figure 4. Location of highest total phosphorus yields 13
Figure 5. Location of highest sediment yields 14
Figure 6. Percent change in percent impervious area from baseline to buildout 14
Figure 7. Location of permitted total retention lagoons and oil/gas wells …..15
Figure 8. Street design of Trailwoods project and location in watershed 18
Figure 9. Potential wetland development sites 22
Figure 10. Timeline for Trailwoods LID Demonstration Project 31
Figure 11. Location of autosamplers in the Lake Thunderbird watershed 35
3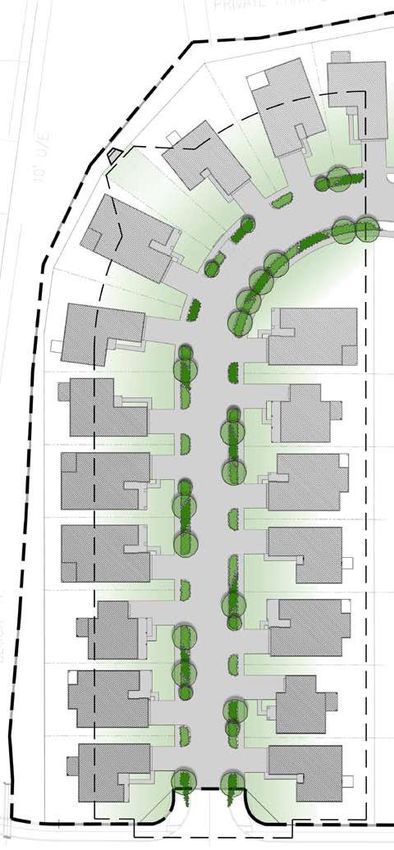
Lake Thunderbird WBP June 2010
PREFACE
Lake Thunderbird, located in central Oklahoma, is a popular recreational lake as well as
a water supply reservoir for the cities of Norman, Del City, and Midwest City, which
have a combined population of approximately 178,000. Significant taste and odor
problems, linked to eutrophication in the lake, have led to complaints from water users.
According to the Oklahoma Department of Environmental Quality (ODEQ) 2008
Integrated Report, Lake Thunderbird is not supporting its Fish and Wildlife Propagation
(Warm Water Aquatic Community) designated use due to turbidity and low dissolved
oxygen (DO), its Aesthetics use due to color, or its Public Water Supply use due to
chlorophylla. The chlorophylla concentration is approximately three times the water
quality standard required for a sensitive water supply. Other impaired waterbodies in
the watershed include 1) Hog Creek, impaired by turbidity and low DO, 2) West Branch
of Hog Creek, impaired by low DO, 3) Moore Creek, impaired by total dissolved solids
(TDS), 4) Elm Creek, impaired by E. coli, turbidity, and TDS, and 5) East Elm Creek,
impaired by low DO.
Excessive nutrient loading in the watershed, primarily from urban development, has
caused the observed eutrophication in the lake. The Central Oklahoma Master
Conservancy District (COMCD), in cooperation with the Oklahoma Water Resources
Board (OWRB), has been monitoring chlorophylla and nutrient concentrations in the
lake since 2000 and has implemented several management alternatives that have
improved the lake’s algae and chlorophyll problems. However, further action is
necessary to achieve full attainment of designated beneficial uses in the watershed.
The Lake Thunderbird watershed covers 256 square miles (163,840 acres) in
Oklahoma and Cleveland Counties, with the major tributary being the Little River. The
watershed is approximately 60 percent agricultural (mostly pasture) and 40 percent
residential development. Significant, consistent population growth has occurred over
the past 30 years and is expected to continue in the area, with a great deal of pasture
being converted to urban areas. Without a proactive plan to address the potential
impact of this urban expansion, water quality in the area is expected to continue to
decline rapidly.
Based on SWAT model results by Vieux (2007), it is estimated that approximately
18,000 kg of phosphorus enters Lake Thunderbird each year. Nonpoint source (NPS)
pollution associated primarily with increased impervious surfaces due to urban growth
appears to be the primary source of the water quality problems in the Lake Thunderbird
watershed. Modeling of the watershed has resulted in a recommendation of a 58%
percent reduction (about 10,000 kg/yr) of total phosphorus to Lake Thunderbird in order
to produce acceptable water quality conditions (chlorophylla concentration of 10 mg/L or
less) (OWRB 2006). A TMDL is currently being developed by the ODEQ for the lake to
address sediment and dissolved oxygen impairments. Load reduction estimates
resulting from this effort will be added to the watershed plan when the TMDL is
released.
4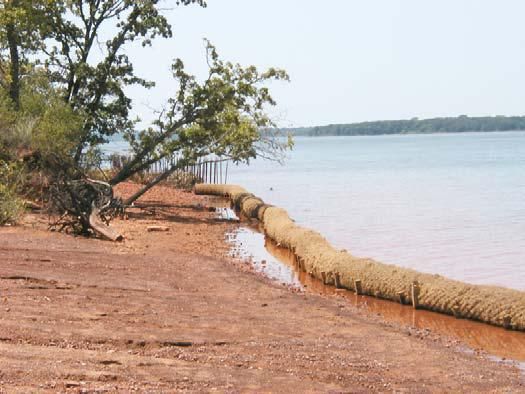
Lake Thunderbird WBP June 2010
It is projected that various low impact development (LID) practices could dramatically
improve the nutrient and sediment loading in the watershed in a relatively short time
frame. The Lake Thunderbird Watershed Based Plan (WBP) refers to the initial
implementation of actions focused on LID, which are necessary to restore beneficial use
support to Lake Thunderbird and its tributaries.
5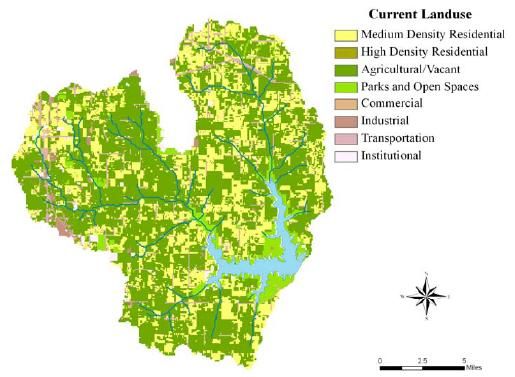
Lake Thunderbird WBP June 2010
INTRODUCTION
The Nonpoint Source Program and Grants Guidelines for States and Territories for FY
2004 and Beyond requires a Watershed Based Plan (WBP) to be completed prior to any
implementation efforts using incremental funds. The guidance describes nine key
components to be addressed in a watershedbased plan, much of which builds from the
strategies outlined in the Watershed Restoration Action Strategy (WRAS). These
components include: 1) identification of causes and sources that will need to be
controlled to achieve load reductions, 2) estimate of load reductions expected from the
management measures described, 3) a description of the management measures that
will need to be implemented to achieve load reductions, 4) an estimate of the amounts
of technical and financial assistance needed, associated costs, and/or the sources or
authorities who will bear responsibility, 5) an information/education component that will
be used to enhance public understanding of the project and encourage early
participation in the overall program, 6) a schedule for implementing the NPS
management measures identified in this plan that is reasonably expeditious, 7) a
description of interim, measurable milestones for determining whether control actions
are being implemented, 8) a set of criteria that can be used to determine whether
loading reductions are being achieved over time and substantial progress is being made
or whether the Watershed Plan or Total Maximum Daily Load (TMDL) needs to be
revised, and 9) a monitoring component to evaluate the effectiveness of the
implementation efforts over time.
In order for the WBP to become an integral part of the entire watershed restoration
program, it must be amenable to revision and update. The Lake Thunderbird WBP has
been developed as a dynamic document that will be revised to incorporate the latest
information, address new strategies, and define new partnerships between watershed
stakeholders. It is anticipated that at least biannual revisions may be necessary and
that the responsibility for such revisions will rest primarily with the Oklahoma
Conservation Commission (OCC), with support from the Oklahoma Department of
Environmental Quality (ODEQ), Office of the Secretary of the Environment (OSE) and
the NPS Working Group. It is understood that the water quality goals and the technical
approach set forth in this WBP may not be comprehensive, so they may be expanded in
the future, especially as ODEQ’s work with the TMDL/WMP is completed. Federal and
state funding allocations for future water quality projects designed to address the Lake
Thunderbird Watershed problems should not be based solely upon their inclusion in this
WBP; rather, the WBP should be considered a focal point for initial planning and
strategy development.
6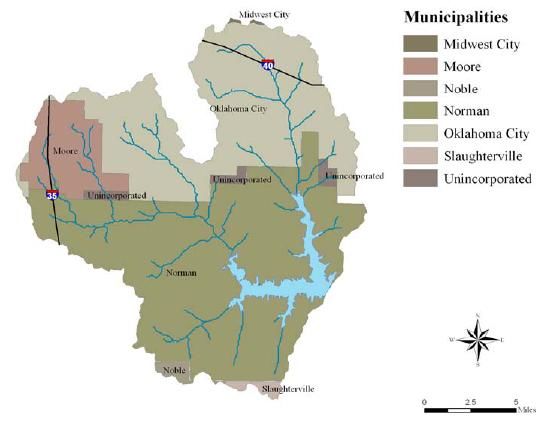
Lake Thunderbird WBP June 2010
CAUSES and SOURCES (element a)
Watershed Characterization
The Lake Thunderbird watershed (HUC 111090203010) covers a 163,840 acre area in
Cleveland and Oklahoma Counties. The principal tributary to Lake Thunderbird is the
Little River, which was impounded by the Bureau of Reclamation to form the lake in
1965. Other tributaries are shown in Figure 1. Designated uses of the dam and the
impounded water are flood control, municipal water supply, recreation, and fish and
wildlife propagation. Designated uses of streams in the watershed include aesthetics,
agriculture, warm water aquatic community (WWAC), industrial and municipal process
and cooling water (I & M), primary body contact recreation (PBCR), public and private
water supply (PPWS), fish consumption, and sensitive water supply (SWS).
CIM ARRO N
TEXAS
BEAVER HARPE R
W AS HIN GTO N
WO ODS
AL FAL FA GRAN T KAY
OSAG E NOW ATA CRAIG OTT AW A
DELAW ARE
EL L IS
WO ODW AR D
GARFI EL D NOBL E RO
G ERS
MAYES
MAJ OR
PAW NEE
TUL SA
DEW EY
BL AIN E
KING FIS HER O GAN
L PAYNE CREEK CHER OKEE ADAI R
WAG ON ER
I NC OL N
L
ROG ER MIL L S
CUSTE R OKM ULGEE
MUSK OGE E
CANAD IAN
West Hog C
OKL AH OMA
Hog
OKFUS KEE SEQU OYAH
Oklahoma Co.
CADD O
MCI NTOS H
WAS HIT A
BECKH AM
POTT AW ATO MIE
CLEVEL AN D SEMI NOL E
GRAD Y
HUGH ES E F L O RE
L
HASKE L
GREE R KIO WA
PITT S BURG
A TIM ER
L
HARM ON
Cr.
L.
MCC L AIN
Cleveland Co.
COM ANCH E
GARV IN PONTO T OC
A CKSO N
J
COAL
We
STEPHE NS PUSHM ATAH A
MUR RAY
TIL L M AN
St
O HNS TON
J MCC URTAI N
CARTE R
COTT O N
ATOKA
Kitc
an
E FF ERSO N
J
st E
MARS HAL L
CHOC TAW
BRYAN
O VE
L
No
le
y Drap er
he n
lm
rt h F
C
Cr
r
o
M
.
rk L
oo
re
C
it tle
r.
E lm C r
.
iv e
Litt le R r
.
Cr
o ck
R
Lake Th unde rbird
Cr .
ue C r.
Da l ue
veB
Cl ear Cr.
J i m Bl
0 5 10 15 Miles
Figure 1. Lake Thunderbird watershed.
As a municipal water supply, Lake Thunderbird furnishes raw water for Del City,
Midwest City, and the City of Norman under the authority of the Central Oklahoma
Master Conservancy District (COMCD).
7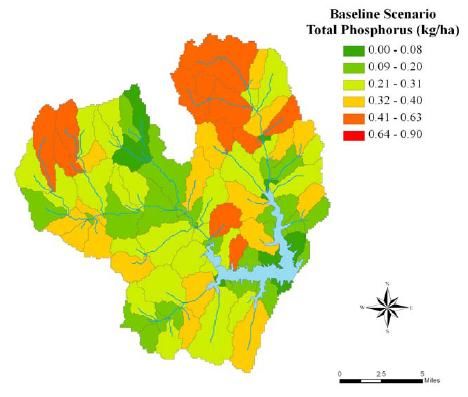
Lake Thunderbird WBP June 2010
The morphologic features of Lake Thunderbird are (OWRB 2002):
Area 5,439 acres
Volume 105,838 acrefeet
Shoreline 96 km
Mean Depth 4.7 m (15.4 ft)
Maximum Depth 17.7 m (58 ft)
Water Supply Yield 21,700 acrefeet/yr (19.4 mgd)
Mean Monthly Discharge/Outflow 74.5 cfs
All of these values represent a reduction since impoundment in 1966 due to
sedimentation. The overall sedimentation rate was estimated as 393 acrefeet per year
with a total loss of 13,762 acrefeet, about 12% higher than originally planned. Most of
the sediment accumulation has occurred in the upper portion of the conservation pool.
The decrease of surface area is mostly due to inflow of largegrained solids from
tributaries (OWRB 2002).
Although the Lake Thunderbird watershed contains Lake Stanley Draper and its
watershed (Figure 1), this area was removed from modeling analyses since discharges
are not allowed over the spillway. This means that seepage under the dam is the only
way that water from the Lake Stanley Draper watershed could enter Lake Thunderbird.
Since any seepage is minimal, Lake Stanley Draper is not considered a source of
nutrient loading to Lake Thunderbird and will not be shown in any of the other figures.
The Lake Thunderbird watershed is located in the Central Great Plains and Cross
Timbers ecoregions (Woods et al. 2005). The Central Great Plains ecoregion is a
transition area between mixed grass prairie in the west, now primarily a winter wheat
growing region, and forested low mountains in eastern Oklahoma. “Gently sloping
narrow ridgetops are separated by steep slopes bordering drainage ways. Some
stream valleys with nearly level flood plains and large stream terraces exist. Dissected
plains with broad rolling ridgetops and moderately steep valley sides occur. Valleys are
usually narrow with broad flood plains and terraces and hilly dissected plains. There
are rivers with wide flood plains and terraces and small streams with narrow
bottomlands. Rolling plains have a deep mantle of windblown sand and sandy outwash.
Elevation ranges from 1,310 to 2,950 ft (400 to 900 m). Soils include Mollisols and
Alfisols” (McNab and Avers 1994). Predominant vegetation includes bluestemgrama
prairie, sandsagebluestem prairie, northern flood plain forests, and buffalo grass.
Precipitation ranges from 20 to 35 inches (500 to 900 mm), and temperature averages
50 to 61 degrees F (10 to 16 degrees C). “Groundwater is abundant in areas
associated with sand and gravel deposits; however, it is scarce and may be mineralized
in areas where shale, sandstone, clay, and limestone are near the surface” (McNab and
Avers 1994).
The Cross Timbers ecoregion “is a region of rolling hills and narrow valleys. The terrain
generally is more complex than other parts of central Oklahoma. Elevation ranges from
330 to 1,300 ft (100 to 400 m). Soils in the Cross Timbers ecoregion are mainly Ustalfs.
8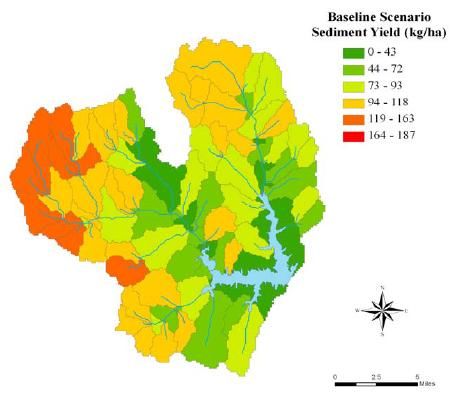
Lake Thunderbird WBP June 2010
Soils are deep, well drained, and fine to moderate textured; moisture is limited for use
by vegetation during part of the growing season” (McNab and Avers 1994). Oakhickory
and oakhickorypine forest and extensive areas of tall grassland with a tree layer
comprise the ecoregion. Forest cover consists of post, live, and blackjack oaks, and
pignut and mockernut hickories. Grasses consist of big and little bluestems, Indian
grass, and sunflower. Precipitation averages 35 to 40 inches (900 to 1,050 mm), and
temperature averages 55 to 63 degrees F (13 to 17 degrees C) (McNab and Avers
1994).
Human Population:
The population in Cleveland County, where the majority of the Lake Thunderbird
watershed is located, is 224,898 (2005 Census). The city of Norman, which comprises
about half of the watershed area (Figure 2), is the largest city in the county, with
approximately 102,000 residents (86% urban). The city of Moore makes up about 8
percent of the watershed area and has a population of nearly 45,000. There has been a
steady increase in Cleveland County’s population since 1960, especially in urban areas
(Table 1).
Figure 2. Municipalities in the Lake Thunderbird watershed (Vieux 2007).
About 38% of the Lake Thunderbird watershed area is located within the Oklahoma City
municipal boundary. In Oklahoma County, the population is 691,266, with 523,303
9
Lake Thunderbird WBP June 2010
located within Oklahoma City (2005 Census). The population in Oklahoma County has
also shown consistent growth (Table 1).
Table 1. Population growth in Cleveland and Oklahoma Counties.
County Parameter 1960 1970 1980 1990 2000
Total population 47,600 81,839 133,173 174,253 208,016
Cleveland
Percent change 71.93% 62.73% 30.85% 19.38%
Total population 439,506 527,717 568,933 599,611 660,448
Oklahoma
Percent change 20.07% 7.81% 5.39% 10.15%
Landuse:
As shown in Table 2 and Figure 3, approximately 60 percent of the watershed is
agricultural, with pasture comprising the majority of the agriculture land. Most of the
remainder of the watershed is developed, primarily residential.
Table 2. Landuse in the Lake Thunderbird watershed.
Landuse Percent of Watershed Area
Residential Medium Density 26.00
Residential High Density 0.07
Agricultural – Pasture 53.84
AgriculturalGeneric (parks and open spaces) 7.62
Commercial 0.68
Industrial 1.39
Transportation 4.18
Institutional 1.17
Open Water 5.05
10 Lake Thunderbird WBP June 2010
Figure 3. Landuse in the Lake Thunderbird watershed (Vieux 2007).
Causes
The designated beneficial uses for Lake Thunderbird and its tributaries include
Aesthetics, Agriculture, Warm Water Aquatic Community, Primary Body Contact
Recreation, Public and Private Water Supply, Fish Consumption, Industrial and
Municipal Process and Cooling Water, and, for the lake itself, Sensitive Water Supply.
The impaired designated uses and the causes of nonattainment of designated uses are
shown in Table 3. Lake Thunderbird is listed in Oklahoma’s Integrated Report as a
Category 5 waterbody with impairment of the fish and wildlife propagation beneficial use
due to excess turbidity and low dissolved oxygen as well as nonattainment of the public
and private water supply beneficial use due to high chlorophylla. The three streams in
the Thunderbird watershed with enough monitoring data to assess designated beneficial
uses (Hog Creek, Elm Creek, and Moore Creek) are listed as impaired for one or more
assigned uses. It is likely that other streams in the watershed are impaired as well, but
not enough data has existed to make an assessment; for the next reporting cycle, the
OCC will have enough data to assess five additional streams in the watershed (Table
9). The WBP will be updated with the results of that assessment when it is performed.
11 Lake Thunderbird WBP June 2010
Table 3. Waterbodies in the Lake Thunderbird watershed (ODEQ 2008).
Waterbody ID Site Name Impaired Designated Uses Causes of Impairment
Warm Water Aquatic Community turbidity, low DO
OK520810000020_00 Thunderbird Lake
Public and Private Water Supply chlorophylla
OK520810000030_00 Hog Creek Warm Water Aquatic Community turbidity, low DO
OK520810000040_00 West Hog Creek Warm Water Aquatic Community low DO
OK520810000050_00 Clear Creek *
OK520810000060_00 Dave Blue Creek *
OK520810000070_00 Jim Blue Creek *
OK520810000080_00 Little River *
OK520810000090_00 Rock Creek *
Primary Body Contact Recreation E. coli
OK520810000100_00 Elm Creek Warm Water Aquatic Community turbidity
Agriculture total dissolved solids
OK520810000110_00 East Elm Creek Warm Water Aquatic Community low DO
OK520810000120_00 East Elm Creek *
OK520810000140_00 West Elm Creek *
OK520810000150_00 Kitchen Creek *
OK520810000160_00 Kitchen Lake *
OK520810000170_00 North Fork Little River *
OK520810000175_00 Moore Creek Agriculture total dissolved solids
OK520810000180_00 Mussel Shoals Lake Creek *
OK520810000190_00 Mussel Shoals Lake *
*insufficient information or not assessed
Oklahoma Water Resources Board (OWRB) studies on Lake Thunderbird have shown
that chlorophylla levels are high, thus indicative of the excessive algae growth causing
taste and odor problems for the City of Norman water supply. In 2000, over onehalf of
the water samples collected by the OWRB had chlorophylla concentrations greater
than 20 μg/L (OWRB 2003). The chlorophylla concentration was reduced in 2002, after
aeration of the lake ceased, but the lake still had chlorophylla levels high enough to
cause eutrophication. BUMP data collected from 20012003 showed an average
chlorophylla concentration of 30.8 μg/L.
Algae species which are known to cause taste and odor problems in drinking water are
present in the lake, and two potentially toxic algae have been noted in Lake Thunderbird
as well. The concentrations of these algae in the lake corresponded to a low to
moderate risk from direct exposure or accidental ingestion in 2001 and low risk in 2002.
This risk was for recreational exposure, with no evidence of risk noted for water supply
(OWRB 2003). Reducing the amount of nutrients entering the lake is necessary to
decrease the algal concentrations.
Sources
There are no point sources in the Lake Thunderbird watershed; hence, nonpoint
sources are the primary contributors to the pollution problems in this watershed.
Nonpoint sources are those which supply pollutants to surface water diffusely, rather
than as a definite, measurable quantity at a single location. These sources typically
12 Lake Thunderbird WBP June 2010
involve land activities that contribute bacteria, sediment, and/or nutrients to surface
water as a result of runoff during and following rainfall.
Urban Land Use:
The primary sources of pollution in the Lake Thunderbird watershed are associated with
urban expansion and the accompanying development. As urbanization progresses,
runoff from impermeable surfaces and from construction areas (both housing
developments and road construction) are increasingly contributing to nutrient and
sediment loading from the watershed. Water quality is being severely impacted by
increasing runoff volume and velocities, which cause increased erosion of streambanks,
destruction of instream and riparian habitat, and siltation, as well as increased nutrient
loads. Improper use of fertilizers or overfertilization may increase with the expected
population growth in the watershed and contribute to the pollution of lakes and
groundwater through loading of soluble and particulate phosphorus as well as nitrogen.
Bacteria and nutrients from domestic pets will be expected to increase as well with the
expected increase in population growth. According to Vieux (2007), urban runoff should
be considered as an increasing, highly significant nonpoint source of pollution in this
watershed.
Vieux and associates performed a study in the Rock Creek watershed, a tributary to
Lake Thunderbird (COMCD 2006). Based on monitoring and analysis of water quality
data in Rock Creek, it was determined that a higher level of nutrients was found in
runoff from developed versus undeveloped land. Vieux’s modeling efforts of the entire
Lake Thunderbird watershed in 2007 supported this finding, indicating that the areas of
the watershed contributing the greatest phosphorus (the limiting nutrient of the lake)
load per unit area were the highly urbanized areas of Moore and Oklahoma City, as well
as a small portion of Norman immediately north of the lake (Figure 4).
Figure 4. Location of total phosphorus sources and yields (kg/hectare) in the
Lake Thunderbird Watershed as determined from SWAT modeling (Vieux 2007).
13 Lake Thunderbird WBP June 2010
Similarly, the greatest sediment load is coming from Moore and the west side of
Norman, followed by the Oklahoma City area (Figure 5).
Figure 5. Location of sediment sources and yields (kg/hectare) in the
Lake Thunderbird Watershed as determined from SWAT modeling (Vieux 2007).
The Rock Creek study (COMCD 2006) indicated that the greater loading of nutrients
from developed areas was due to increased impervious surface and increased
fertilization in urban areas. Vieux’s 2007 SWAT modeling also suggested that
imperviousness was a key factor affecting loading rates in the watershed. It is expected
that continued conversion of agricultural land to residential land will more than double
the phosphorus load to the lake, increasing from an average of 25 kg/ha currently to 54
kg/ha in the future (assuming a buildout scenario with conversion of 50% of agricultural
areas to residential). Figure 6 shows the areas which are expected to experience the
greatest increases in impervious surface under a buildout scenario.
Figure 6. Percent change in impervious area from baseline (current levels) to buildout (projected
conversion of 50% of agricultural lands to residential) (Vieux 2007).
14 Lake Thunderbird WBP June 2010
Based on Vieux’s SWAT model calculations, the total average phosphorus load to Lake
Thunderbird is between 18,000 kg/yr and 23,000 kg/yr. According to Figure 4, the
highest phosphorus loading is occurring in the watersheds of the North Fork of the Little
River and Moore Creek on the west side of the lake, as well as Hog Creek on the east
side of the Thunderbird watershed. The Moore and Norman areas on the west side of
the watershed are contributing the highest sediment load, especially in the headwaters
of Little River, the North Fork of the Little River, Moore Creek, and Rock Creek (Figure
5).
While there are no point source discharges in the Lake Thunderbird watershed,
“bypassdischarges” from municipalities may occur due to overflows or sewer main
breaks. Several of these events have occurred within the watershed. For example,
from June 2004 to August 2006, the sum of these discharges was:
City of Moore 59,930 gallons discharged to Little River
City of Norman 44,483 gallons discharged to Little River
According to Vieux (2007), raw sewage contains approximately 415 mg/L of water
soluble phosphorus, equating to 25 kg of phosphorus over that two year period. This is
not considered a significant amount relative to the overall phosphorus entering the
watershed. The City of Norman completed a wastewater treatment plant (WWTP)
upgrade in March 2010, which should reduce the number of failures in the future. The
hydraulic capacity of the plant has increased from 45,000m³ a day to nearly 100,000m³
a day.
Permitted Sources:
Nonpoint source permitted
$ $ $ $ activities within the watershed
$ $ $ $ $ $ $
$#$ $ $ $ $ $ $ $
include 12 total retention lagoons
$ $ $ $ $ $ (Figure 7). Total retention lagoons
$ $# $ $
$ $ $ $ $ $
hold solid and liquid wastes prior to
$ $ $ $ $ $ $ $ $
#
$ $ $ land application and may leak or
$ $ $ $ $ $ $ $ $ $ $ $ $ $
$ $ $ $ $ $ $ $ $ $ $ $ $ $ $ $
overflow, thus affecting water
$ $ $ $ $ $ $ $ $ $ $ $
#
$ $ $ $ $ $ $ $ $ $ $ $
$ $ $ $ $ quality.
$ $ $ $ $
$ $ $ $ $ $ $ $ $ $ $ $ $ $ $ $ $ $ $ $
$ $ $ $ $ $ $ $ $ $ $ $ $ $
$ $ $ $ $ $ $ $#$ $ $ $ $ $
$ $ $ $ $ In addition, there are over 300 oil
$ $ $ $ $ $ $ $
$ $#$ $ $ $ $ $ #
$ $ $ $ $ $ $ $ $ and gas permits in the watershed,
#
$ $ $ $ $ $ $ $ $ $ $ $ $ $
$ $ $ $
$ $ $ $ $ $ $
$#$ $ $ $ $ $ $ $ $ $ $ $ $ $ $ $ $
$ $ located on approximately every
$ $ $ $ $ $
$ #
$ $ $ $ $ $ $ $ $ $ $ $ $ section in the watershed. Not all of
$ $ $ $
$ $ $ $ $ $ $ $ $ $ $ $ $
$ $ $ $ $ $ $ $ $ $ $
$ $ $ $
$ $ $ $
$ the permitted wells are active;
$ $
# $ $ $ $ $ $ however, oil and gas operations
$ $ $ $
$ $ $ $ $ $ $ $ $ $ $
# could be a potential source of high
$ $ $ $ $ $ $ $
$ $ $ $ $ $ $ $ $ $ $ $ TDS values as well as turbidity
$ $ $ $ $ $ $ $ $ $ $ $ $ $
$ $ $ $ $ $ $ $ $ $ $ $ $ $
sources.
$ $ $ $ $ $ $ $ $ $ $ $ $
$ $ $ $ $ $ $ $ $ $
$ $ $ $ $ $ $ $ $ $
$ $ $
Figure 7. Location of permitted total
retention lagoons and oil/gas wells.
$ Oil and Gas Wells
# Total Retention Lagoons
15 Lake Thunderbird WBP June 2010
Rural Land Use:
Pasture/forage land is the prevalent rural land use in the watershed. Cattle are the
dominant animal industry in Oklahoma and Cleveland Counties (Table 4). Livestock
grazing in pastures deposit manure, making it possible for the nutrients and bacteria to
enter surface water with runoff. In addition, livestock often have direct access to
waterbodies providing a concentrated source of loading directly into streams. Animals
loafing in the stream also contribute to turbidity problems by stirring up sediment, and
their travels to and from the stream erode banks and carve trails which serve as direct
conduits for NPS contribution during runoff events.
Table 4. Livestock in Oklahoma and Cleveland Counties (USDA Census 2002).
Livestock County Number of animals
Cleveland 26,522
Cattle and calves
Oklahoma 21,985
Cleveland 3,380
Horses and ponies
Oklahoma 4,040
Cleveland 2,478
Layers 20 weeks old and older
Oklahoma 1,724
Hogs and pigs Cleveland 2,267
Goats Oklahoma 1,696
Sheep and lambs Oklahoma 1,402
Despite the large number of animals, particularly cattle, in these counties, agriculture in
the Lake Thunderbird watershed is largely in the form of small, urban ranchettes, where
landowners have 520 acres to keep a few horses or a small herd of cattle. Preliminary
results from Vieux (2007) suggest that, although these areas contribute to overall
loading, urban sources dominate.
Septic Systems:
Failing septic systems can contribute to pathogen and nutrient problems in both
groundwater and surface waters if leakage or illicit discharge occurs. Any loading of
bacteria into the groundwater can enter surface water through seeps or springs. Failing
septic systems were not likely to be a significant factor in this watershed due to the low
density of septic systems.
Wildlife:
Wild animals which produce fecal bacteria and have direct access to streams include
deer, raccoons, other small mammals, and avian species. Wildlife is considered to be a
minor contributor of pollution in this watershed.
Shoreline / Streambank Erosion:
Lake Thunderbird is experiencing considerable shoreline erosion with cut banks
exceeding 20 feet in height in some locations (OWRB 2001a). Wave action and runoff
on these bare areas are contributing significantly to the turbidity impairment of the lake.
A shoreline erosion control demonstration project was intiated by the OWRB in order to
reduce the amount of suspended sediment in Lake Thunderbird. During 2003, the
OWRB staff installed hundreds of feet of breakwater structures and more than 1,000
aquatic plants along a 450foot area of the southern shoreline. It is expected that the
16 Lake Thunderbird WBP June 2010
breakwaters will help settle out sediments and
promote the establishment of beneficial
shoreline vegetation. In addition, the OCC in
partnership with the City of Norman is currently
implementing a project to restore a riparian
buffer along the North Fork of the Little River.
Unstable streambanks could also contribute
significantly to phosphorus loading in the
watershed, especially since streambank soils
are often high in phosphorus.
Lake Thunderbird shoreline erosion control
LOAD REDUCTIONS (element b)
Because of Lake Thunderbird’s impaired status, Total Maximum Daily Load (TMDL)
allocations are required for dissolved oxygen and turbidity. The Oklahoma Department
of Environmental Quality Water Quality Division (ODEQ) is currently working on a
detailed Hydrological Simulation Program Fortran (HSPF) model for the watershed and
has contracted to have an EFDC inlake model developed. These two models will be
used to develop a comprehensive TMDL for the lake. Until the release of the TMDL, the
focus of this WBP will be on reducing phosphorus, since data collected and analyzed by
the OWRB indicates that phosphorus is the limiting nutrient in Lake Thunderbird. The
subwatersheds in red in Figure 4 will be the primary targets for implementation projects
since these are the areas supplying the highest phosphorus loads and, thus, should
provide the largest load reductions.
Using a SWAT model, Vieux (2007) calculated that the total average phosphorus load
to Lake Thunderbird is between 18,000 kg/yr and 23,000 kg/yr. This correlates with a
measured average total phosphorus concentration of 0.057 mg/L and chlorophylla
concentration of 30.8 mg/L. The primary source of phosphorus loading in the watershed
is urbanization, as shown in Figure 4 and discussed in the previous section. Runoff
from impervious surfaces in urban areas has the highest potential for contributing
pollutants to waterbodies in these areas.
The goal of this WBP is to reduce the nutrient loading to Lake Thunderbird so that the
chlorophylla concentration is 10 mg/L, a 32% reduction. This corresponds to a
reduction of approximately 10,000 kg/yr total phosphorus (58% overall) (Vieux 2007).
This reduction in phosphorus should increase the dissolved oxygen concentration of the
lake, decrease the turbidity, and allow restoration of the WWAC designated use. In
addition, it is expected that measures implemented through this watershed project to
address phosphorus will concomitantly reduce the bacteria loading in Elm Creek and
sediment loading in Moore Creek. However, urbanization is expected to continue in this
watershed, so it is vital to examine the required load reductions in light of future
development plans.
17 Lake Thunderbird WBP June 2010
Vieux (2007) modeled the loads expected if 50% of the agricultural or vacant land was
converted to residential property over the next 30 years. The findings indicate that the
total phosphorus load would be 24,907 kg/yr under these conditions, so a reduction of
approximately 68% (approximately 16,937 kg/yr) would be necessary to achieve the
chlorophylla goal of 10 mg/L in the future. This reduction will be the longterm goal for
the project.
The following section of the WBP addresses the management measures necessary to
achieve these present (shortterm) and future (buildout) load reductions. After the
release of the TMDL for Lake Thunderbird, most likely in 2011, management measures
and load reduction goals described in this WBP will be updated based on the
recommendations of the TMDL.
NPS MANAGEMENT MEASURES (element c)
SWAT modeling has allowed for estimation of nutrient load reductions expected from
certain management measures (Vieux 2007). The results of this modeling effort show
that Best Management Practices (BMPs) should focus on reduction of nutrient loading
from urban nonpoint sources. Implementation of such practices is expected to achieve
an initial NPS phosphorus load reduction goal of 58% and is likely to significantly
improve the turbidity, bacteria, and dissolved oxygen issues in the lake and streams.
It is recognized that not any one activity could realistically result in the required
reduction; instead, numerous strategies will have to work together to achieve the
desired result. With this in mind, this document is not intended as a final, static plan,
but rather one that will be updated as needed to reflect new information, resources, and
necessary adjustments in implementation strategy.
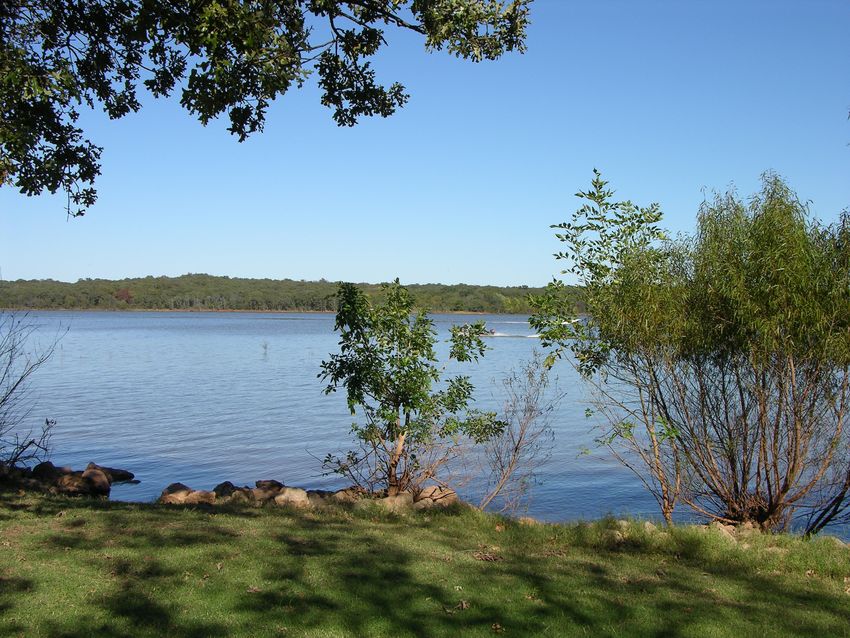
The initial watershed implementation program will focus on
facilitating Low Impact Development (LID) techniques in the
watershed. A local developer has partnered with OCC to
implement and assess LID practices in a new residential
development, titled the Trailwoods Project. For this project, 18
houses will be built along a street with rain gardens to filter
stormwater runoff from the street (dark green in Figure 8) while 18
houses will be built
on an adjoining
street with
conventional curbs
and street gutters to
convey stormwater.
The OCC will install
autosamplers for
continual monitoring
and assessment of
Figure 8. Street design (LID side) of Trailwoods project (left), and
location of the neighborhood in the watershed (right).
18 Lake Thunderbird WBP June 2010
the runoff of both streets. This project will be primarily a demonstration and research
project. Results will be presented to City of Norman officials in the hope that more
projects like this will be approved.
Before more broadreaching projects can be tackled, a significant portion of the
implementation strategy will be to work with cities in the watershed to revise their
building codes as needed to allow for construction of LID systems. Special approval
was granted for the Trailwoods project from the City of Norman. OCC will compile and
review examples of existing codes from nearby communities that support LID and
provide for water quality friendly construction techniques. These examples will be
presented to the watershed cities for possible incorporation into their municipal codes.
In addition, OCC will send city planners from the area to LID workshops and related
training such as the one offered by the Water Conservation Resource Center in
Fayetteville, Arkansas. OCC will also organize and facilitate tours of LID
implementation in nearby areas to demonstrate possibilities for the city planners and
relevant personnel. Since most of the project area is incorporated and zoned, the OCC
will also work with municipalities to achieve pollution control through zoning and
ordinance regulations.
Vieux’s modeling results clearly indicate the subwatersheds contributing the greatest
loads currently, as well as those where the greatest future load is expected (Figures 4,
5, and 6). These urban areas of the watershed will be targeted for the initial
demonstration of lowimpact development (LID) so that the most efficient load
reductions can be accomplished. Examples of urban practices that will be suggested
are given in Table 5. The efficiency of each of these practices in removing phosphorus
is included in the table, as well as the practical application and constraints associated
with each practice. Combining certain types of practices and implementing them
throughout the watershed could result in reductions in total phosphorus load beyond the
required reduction to meet the chlorophylla goal of 10 mg/L (Vieux 2007). Initial
implementation will be focused in the subwatersheds with the highest phosphorus
loading (Figure 4). As mentioned previously, these areas are the most developed and
actively developing areas in the watershed, so it will be vital to work with officials from
Norman, Moore, and Oklahoma City to get approval for LID implementation.
An additional strategy for inlake reduction in
sediment and nutrient loads would be to work with
management authorities to institute new/amended
boat traffic limitations. Because of its proximity to
the urban community, Lake Thunderbird
experiences particularly heavy powered boat traffic,
which is thought to contribute significantly to
shoreline erosion and thus nonpoint delivery of
sediment and nutrients. Lakewide limitations on Urban raingarden
engine size and/or speed restrictions could aid in
reducing this problem.
19 Lake Thunderbird WBP June 2010
Table 5. Possible management practices for urban areas. Highlighted rows are practices recommended for this project by Vieux (2007).
Best Phosphorus
Applicable Landuse
Management Removal Maintenance Required Other Benefits Problems
Conditions
Practice Efficiency
Required to
achieve Sediment should be removed every 35 years or when 6 Improves phosphorus and sediment removal Required to improve efficiency and life span
Phosphorous removal efficiencies are
Sediment Phosphorus 12 inches have accumulated, whichever occurs first. To efficiency of primary MPs. Facilitates
based on the inclusion of sediment forbays
of most other management practices. Also
Forbay removal efficiency reduce maintenance costs, an onsite sediment disposal maintenance of MPs and extends the "life facilitates maintenance of other
in the project design.
for structural area should be included in the design. expectancy" of primary management practice. management practices.
practices.
Requires regular maintenance. This management
For Overland Sheet Flow!!! Max
practice usually has short life span due to lack of
contributing area 5 acres. From Center for
maintenance, improper location, and poor vegetative
Watershed Protection (1996), runoff
cover. Maintenance includes inspections, fertilizing, Residential (1621%) impervious or as a
Vegetated May also result in reduction of nitrogen in changes from sheet flow to concentrated
10% watering, and replanting. Also repair from gully erosion,
storm water. flow after traveling 75 feet on impervious
pretreatment component to structural
Filter Strip traffic, and concentrated flow. After established (several management practices.
surfaces and 150 on pervious surfaces.
years), maintenance requires removal of accumulated
Requires soils with infiltration rate of 0.52
sediment, reestablishing vegetations, weeding invasive
in/hr (sand and sandy loams).
weeds, pruning woody growth.
Excellent for residential areas. Requires
Landowners are likely to mow the grass in
matenance agreements included in land titles. Residential 1621% impervious cover. If
Grassed the swale too short reducing pollutant
Maintain thick vegetation at 36 inches. Remove debris, Maintenance responsibility of each land owner. water quality swales are incorporated, will
15% and sediment, and reestablish vegetation if needed. (Monograph 14, pg 400) Cost effective
removal efficiency. Requires soils with
work with higher density development up to
Swale infiltration rates of 0.27 in/hr (silty loams) or
compared to concrete gutters and efficient 37% impervious area.
better.
sediment removal.
Urban nutrient management involves the reduction of
10% with fertilizer (especially phosphorus) to grass lawns and other
May be difficult to obtain "buyin" from the
Urban voluntary reduction community. Requires annual soil testing.
urban areas. Implementation of urban nutrient May also result in reduction of nitrogen in
Nutrient management is based on public education and storm water. Requires implementing an ordinance such
Percent impervious cover 1621%.
Management Up to 22% with as the Minnesota Phosphorus Lawn
awareness, with emphasis on reducing excessive fertilizer
statutory reduction use. Fertilizer Law.
Second season reinforcement plantings are often
Percent impervious cover 2237%. Basin
needed. Mow biannually to reduce woody growth on outer
requires minimum drainage of 10 acres and
boundary. Maintain sediment forbay. Pretreatment Permeable soils are not suited for
High removal rate of particulate and soluble may not be located near (within 100 feet) of
management practices will reduce the cost of wetlands construction. Requires large land
Constructed 30% maintenance and the effective life expectancy of the
pollutants (nutrients) and sediment. Wildlife
areas (2% of the size of the contributing
septic systems. Permeable soils are not
preservation. Bird watching. suited for constructed wetlands. May not be
Wetlands constructed wetland. Remove sediment from forbay every watershed).
suited for highly visible sites or adjacent to
35 years or when 612 inches of sediment has
highly manicured sites.
accumulated.
Extended Not aesthetically pleasing. Requires 20
Mow 2x's per year; remove debris from spill way and Excellent option for watershed approach. foot vegetative buffer. Drainage areas over Percent impervious cover 2237%. Low
Detention
35% trash rack at control structure; and maintain sediment Function as designed for long periods without 5075 acres require provisions for base visibility sites. Appropriate for regional or
Basin forbay. routine maintenance. flow. Not suitable for highly permeable watershed approach.
(2xWQ Vol) soils.
The enhanced extended detention basin has a
shallow marsh which provides additional Not aesthetically pleasing. Requires a 20
Extended Mow two times per year; remove debris from spill way pollutant removal and reduces resuspension of foot vegetative buffer. Drainage areas over
Detention 50% and trash rack at control structure; and maintain sediment settled pollutants. To increase the phosphorus 5075 acres require provisions for base Percent impervious cover 3866%.
forbay. removal of the extended detention basin one flow. Not suitable for highly permeable
Enhanced must increase the volume of the marsh. Wildlife soils.
habitat and associated recreation.
20 Lake Thunderbird WBP June 2010
Best Phosphorus
Applicable Landuse
Management Removal Maintenance Required Other Benefits Problems
Conditions
Practice Efficiency
Increase water table. Needs to be part of
High nutrient, sediment and phosphorous "watershed management plan" as too many Percent impervious cover 2237%. Basin
Retention Mow two times per year; remove debris from spill way removal efficiencies. Can help with flood control detention/retention basins in a basin can requires minimum drainage of 10 acres and
Basin I 40% and trash rack at control structure; maintain sediment and downstream channel erosion when severely alter the natural flow conditions not located near (within 100 feet) of septic
forbay. Aeration may be needed in Oklahoma. coordinated within a Watershed Management with combined peak flows and increased systems. Permeable soils are not suited for
(3XWQ Vol) Plan. flow durations, resulting in downstream retention basins.
flooding and stream channel degradation.
Increase water table. Needs to be part of
High nutrient, sediment and phosphorous "watershed management plan" as too many Percent impervious cover 2237%. Basin
Retention Mow two times per year; remove debris from spill way removal efficiencies. Can help with flood control detention/retention basins in a basin can requires minimum drainage of 10 acres and
Basin II 50% and trash rack at control structure; maintain sediment and downstream channel erosion when severely alter the natural flow conditions not located near (within 100 feet) of septic
forbay. Aeration may be needed in Oklahoma. coordinated within a Watershed Management with combined peak flows and increased systems. Permeable soils are not suited for
(4xWQ Vol) Plan. flow durations, resulting in downstream retention basins.
flooding and stream channel degradation.
Retention Increase water table. Needs to be part of
High nutrient, sediment and phosphorous "watershed management plan" as too many Percent impervious cover 2237%. Basin
Basin III Mow two times per year; remove debris from spill way removal efficiencies. Can help with flood control detention/retention basins in a basin can requires minimum drainage of 10 acres and
(4xWQ Vol 65% and trash rack at control structure; maintain sediment and downstream channel erosion when severely alter the natural flow conditions not located near (within 100 feet) of septic
forbay. Aeration may be needed in Oklahoma. coordinated within a Watershed Management with combined peak flows and increased systems. Permeable soils are not suited for
with aquatic Plan. retention basins.
flow durations, resulting in downstream
bench) flooding and stream channel degradation.
Degradation of oily pollutants, clay absorbs
Bioretention Annual soil pH testing and application of lime to adjust
heavy metals, nutrients and hydrocarbons. Requires permeable soil! Life expectancy Percent impervious cover 3866%. Highly
pH; routine mulching and maintenance of plant material.
basin or 50% Removal of hazardous and toxic soil/plant material
Reduce peak discharge and provides as little as 5 years. May require removal of visible development. Residential to fairly
groundwater recharge. Accumulation of toxins infiltration media and plant material. high density commercial projects.
Rain required when the system "dies".
and heavy metals within 5 years.
Gardens
Requires permeable soil. Life expectancy
Annual soil pH testing and application of lime to adjust as little as 5 years. May require removal of
Filter is connected to storm sewer which can
pH; routine mulching and maintenance of plant material. infiltration media and plant material when
Bioretention 50% Removal of hazardous and toxic soil/plant material
lead to structural or other primary management
the system dies. This material may be
Percent impervious cover 3866%.
practices.
filter required when the system "dies". classified as hazardous or toxic upon
removal.
Does not control large volumes of runoff,
Inspection monthly and after large storm events until Percent impervious cover 3866%. Not
Infiltration works for 2year design storm. Requires
operations are stable. After the system is stable, inspect Reduce peak discharge and provide suitable for roadways, parking lots and car
50% semiannually and after large storm events. Control groundwater recharge
permeable soil and lower water table. Does
service facilities unless a settling basin or
(1 x WQ Vol) not work for oily sites due to clogging from
sediment and maintain vegetation. "cell" is used for pretreatment.
sediment, oil, and grease.
Does not control large volumes of runoff,
Inspection monthly and after large storm events until Percent impervious cover 3866%. Not
Infiltration works for 2year design storm. Requires
operations are stable. After the system is stable, inspect Reduce peak discharge and provide suitable for roadways, parking lots and car
65% semiannually and after large storm events. Control groundwater recharge
permeable soil and lower water table. Does
service facilities unless a settling basin or
(2xWQ Vol) not work for oily sites due to clogging from
sediment and maintain vegetation. "cell" is used for pretreatment.
sediment, oil, and grease.
Subject to failure by clogging by sediment
and heavy hydrocarbon loads. Ultraurban settings with percent impervious
Properly sized filters have a life span of up to 20 years. Removal of heavy metals, BOD, nutrients, and
Underground vaults are classified by OSHA cover 67100%. Suited for high pollutant
However, the top few inches of sand needs to be replaced hydrocarbons. Aerobic filters enriched with iron
Sand Filter 65% every 35 years. Requires accessibility (manholes) for may attain nearly complete removal of
confined spaces. Will not function properly removal on medium to high density
if subjected to continuous or frequent flows. development. Not suitable for basins with
vacuum trucks. phosphorus. Can be placed underground.
Essential to exclude flow containing high sediment loads due to clogging.
chlorine (such as pool water).
21 Lake Thunderbird WBP June 2010
Vieux (2007) found that the Little River Arm of
Lake Thunderbird reduced the phosphorus load
to the main body of the lake by 36% by allowing West Hog C
Ho g
Oklahoma Co.
Cr.
L.
Cleveland Co.
We
St
sediment and the phosphorus bound to it to
K i tc
Proposed wetland
an
st E
No
le
y D r ap er
he n
lm
r th F
development
Cr
settle as the water velocity decreases upon
Cr
o
M
.
sites
rk
oo
re
Lit tl e
C
r.
entering this area. It is possible that increasing
E lm C r
.
the residence time of sediment in shallow arms iv e
Littl e R r
.
of the lake such as this may significantly Ro
ck
Cr
improve water quality. One of the tasks in the L ake Thun de r b ird
current OCC project will be to create a wetland Cr
.
ue C r.
Da l ue
v eB
development plan for the Upper Little River
Clear Cr.
J im B l
(above the bridge) and Hog Creek arms to 0 5
promote more extensive settling of sediment
and associated nutrients before entering the lake Figure 9. Potential wetland development
(Figure 8). sites.
The City of Norman has recently completed a 682 page, comprehensive “Storm Water
Master Plan” (SWMP) which considers issues such as water quality, creek corridor
environmental features, creek erosion / stabilization, and greenbelt / open space
expansion opportunities at a very detailed subwatershed level. One of the goals of the
plan is “to protect natural creek riparian environments, as well as comprehensively
managing floodplains to include recreational opportunities, trails and open spaces”
(Cole 2007). This document describes 12 subwatersheds in great detail, including
proposed BMPs to address problems causing flooding and stream erosion. The
establishment and expansion of riparian buffers is one of the top recommendations for
improving water quality and addressing flooding in the city. The City of Norman realizes
that the restoration of the bottomland
hardwood forest and riparian wetlands that
once were widespread along the Little River
and its tributaries could improve overall
quality of the lake. In addition, streambank
stabilization projects and LID are to be
encouraged. The OCC is currently
cooperating with the City in a streambank
stabilization project and hopes to participate
in the development of different aspects of the
larger SWMP. The entire SWMP may be
Little River in Norman
viewed at this link:
http://www.ci.norman.ok.us/sites/default/files/WebFM/Norman/Public%20Works/Storm
WaterMasterPlanFinalDraft.pdf
Oversight of OCC project activities will be the responsibility of the Project Coordinator
with assistance from the City of Norman, the Cleveland County Conservation District,
and additional OCC staff. This WBP will be presented to cities, developers, and other
appropriate groups in the watershed in an attempt to further the adoption of these
practices. Activities in the watershed will be designed to complement projects that the
22 Lake Thunderbird WBP June 2010
cities have planned, for example, those detailed in the City of Norman SWMP.
Soil tests may be offered as part of this project in order to reduce nutrients in runoff from
lawns, gardens, parks, and golf courses in the watershed. The average soil test
phosphorus (STP) level of lawn and garden soils in Oklahoma is several times higher
than that required by plants. This suggests that too much fertilizer and/or incorrect
fertilizer formulas are being used for those areas. Studies have shown that dissolved
reactive phosphorus (which is linked to algae blooms directly) in the runoff from lawn
and golf courses increases as STP and fertilizer rates increase. Education efforts will
be tied to soil test results so that proper fertilizer application is emphasized.
Vieux modeled several combinations of BMPs that would result in the necessary
reduction in total phosphorus (TP) loading to achieve a chlorophylla concentration
below 10mg/L. As shown in Table 6, below, constructing wetlands and installing some
structural controls would reduce TP loading by 66%, and if coupled with fertilizer
reductions, these BMPs are expected to result in the appropriate decrease in TP and,
subsequently, chlorophylla.
Table 6. Impact of targeted BMPs on percent reduction of total phosphorus (TP), TP loads, TP
concentration, and chlorophylla concentration.
The small acreage size managed by the typical agricultural producer, coupled with the
respectively large number of small landowners, adds to the difficulty of significantly
reducing loads from agricultural areas in this watershed. In the future projects,
agricultural BMPs may be funded, including: (1) riparian area establishment to include
fencing, vegetative establishment, offsite watering, livestock shelters and incentive
payments; (2) streambank stabilization to include fencing and vegetative plantings; (3)
animal waste storage facilities / heavy use areas; and (4) pasture management /
pasture establishment. Cooperation with NRCS in Cleveland and Oklahoma Counties
may allow expansion of EQIP and CSP programs (CSP began in 2005 in this area as
part of the Little River priority watershed) which include practices to reduce soil erosion
and improve livestock watering facilities.
The OWRB conducted a shoreline erosion control demonstration project at Lake
Thunderbird through EPA’s §319 NPS program. Depending on the success of this
project, other similar projects may be implemented in the lake to reduce lake margin
23 Lake Thunderbird WBP June 2010
sediment contributions. Through this project, the OWRB seeks to educate lake
managers on the benefits of establishing aquatic plants to improve the health of the
aquatic community and reduce erosion.
In addition, the OWRB and COMCD have partnered to install an aeration system in the
lake to increase the dissolved oxygen and improve overall water quality. The project
will withdraw water from the lake bottom, oxygenate it to 300% (310 mg/l), and return
the supersaturated water back into the lower lake layer, restoring the dissolved oxygen
to levels that will allow attainment of the designated uses and reduce summer
chlorophylla levels. Funding ($692,773) for this effort was derived from the Oklahoma
Water Resources Board’s Clean Water State Revolving Fund obtained through the
American Recovery and Reinvestment Act of 2009. The aerator is scheduled to begin
operating in the summer of 2010.
BMPs, planned and implemented, will be tracked for future watershed modeling and for
reporting project performance. Project staff will make regular site visits to assess
progress in implementing planned BMPs. Details will be summarized in the project final
report.
PUBLIC OUTREACH (element e)
Much of the initial focus of the WBP will involve educating personnel and changing city
ordinances. This section identifies agencies, organizations, and services that are
already active in the watershed or that will be collaborators in the Lake Thunderbird
watershed. These groups will help develop the WBP and assist in other planning efforts
in the watershed to varying degrees. Cooperation and implementation by cities in the
watershed is imperative to achieve the water quality improvement goals.
The specific roles of the groups and programs which are likely to contribute to the public
outreach efforts in the Lake Thunderbird Watershed are summarized in no particular
order below:
1. Local Conservation District Offices
The Cleveland County Conservation District will provide substantial support for
the implementation of this project. The Oklahoma County Conservation District
will also provide support for the project, but to a lesser degree than Cleveland
County due to difference in district area in the watershed. The Districts may
participate in educational activities such as seminars, training sessions, and
meetings to interact with local people and provide technical assistance and
information.
2. Municipalities
Cities in the watershed maintain active, welldeveloped education programs.
However, education programs are rarely funded to a level that meets existing
needs and can always use additional technical support and other resources. The
24 You can also read