THE NEXT GENERATION OF RENEWABLE ELECTRICITY POLICY
←
→
Page content transcription
If your browser does not render page correctly, please read the page content below
ASSISTING COUNTRIES WITH CLEAN ENERGY POLICY

                 THE NEXT GENERATION
                 OF RENEWABLE
                 ELECTRICITY POLICY
                  HOW RAPID CHANGE IS BREAKING DOWN
                  CONVENTIONAL POLICY CATEGORIES

                  Toby D. Couture, E3 Analytics
                  David Jacobs, IET – International Energy Transition
                  Wilson Rickerson, Meister Consultants Group
                  Victoria Healey, National Renewable Energy Laboratory (NREL)

                 February 2015
                 NREL/TP-7A40-63149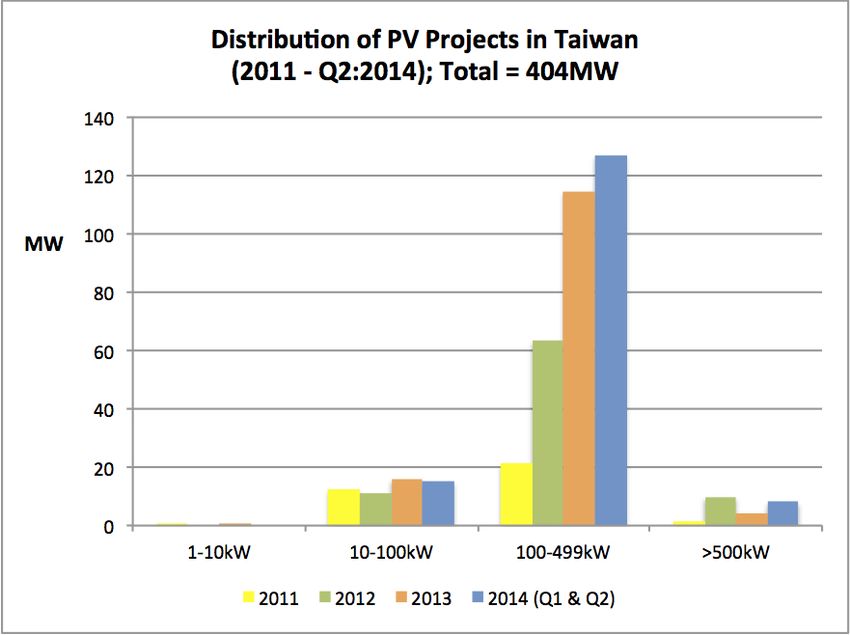
Table of Contents
Acknowledgments ...................................................................................................................................... iv
Abstract ........................................................................................................................................................ v
1 Introduction ........................................................................................................................................... 1
2 Ensuring Investor and Project Size Diversity .................................................................................... 5
2.1 FITs and Auctions in Taiwan ........................................................................................................ 6
2.2 FITs and Auctions in France.......................................................................................................... 8
2.3 Lessons Learned .......................................................................................................................... 11
3 Socket Parity and Beyond.................................................................................................................. 13
3.1 Policy Approaches in Europe ...................................................................................................... 13
3.2 Policy Approaches on Islands ...................................................................................................... 15
3.3 Lessons Learned .......................................................................................................................... 18
4 Integrating Renewable Electricity into Wholesale Markets ............................................................ 20
4.1 Policy Conflict in the European Union: FITs versus TGCs ........................................................ 20
4.2 Financing RE Projects via Spot Market Sales? ........................................................................... 21
4.3 Designing Premium FITs in the EU ............................................................................................ 22
4.4 Lessons Learned .......................................................................................................................... 24
5 Conclusion........................................................................................................................................... 25
References ................................................................................................................................................. 27
List of Figures
Figure 1. Distribution of PV project sizes in Taiwan (2011 – Q2:2014) ........................................................ 7
Figure 2. Breakdown of installed solar PV capacity in mainland France from 2011 to 2014 (MW) .............. 9
Figure 3. Breakdown of installed solar PV capacity in mainland France by project size (%) (Sept 30,
2014) ..................................................................................................................................................... 10
Figure 4. Development of FIT payment levels and retail electricity rates in Germany ................................ 14
Figure 5. Share of fixed versus variable costs of selected power generation technologies ....................... 22
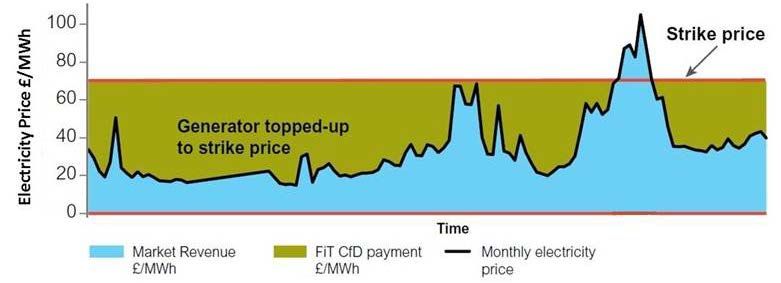
Figure 6. Functioning of planned contracts for differences in the UK ......................................................... 23
List of Tables
Table 1. Traditional Renewable Electricity Policy Categories ....................................................................... 2
Table 2. Taiwan’s FIT Rates and Tariff Ceilings (H2:2014) .......................................................................... 7
Table 3. Project Size and Applicable Policy in France .................................................................................. 8
Table 4. Purchase Prices under FITs and Tendering in France (Q3:2013) ................................................ 10
Table 5. Summary of On-site Generation Policies in the Cayman Islands, Grenada, and the Seychelles. 16
ii
This report is available at no cost from the National Renewable Energy Laboratory (NREL) at www.nrel.gov/publications.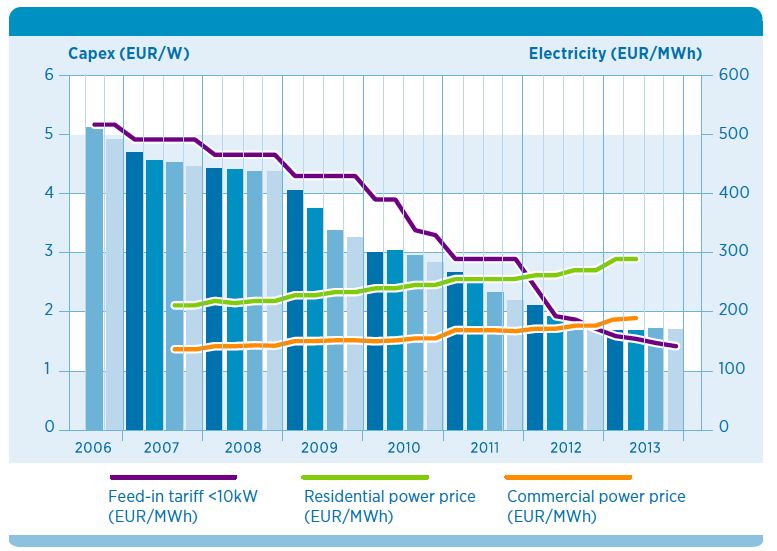
List of Abbreviations and Acronyms
        BRICS           Brazil, Russia, India, Chinas, South Africa
        CORE            customer-owned renewable energy
        CRE             French Energy Regulatory Commission
        DSIRE           Database of State Incentives for Renewables and Efficiency
        EIA             Energy Information Agency
        ERDF            Électricité Réseau Distribution France
        EU              European Commission
        FIT             feed-in tariff
        GDP             Gross Domestic Product
        GRENLEC         Grenada Electricity Services Ltd
        GW              gigawatt
        IEA-RETD        International Energy Agency Renewable Energy Technology Deployment
        IRENA           International Renewable Energy Agency
        kW              kilowatt
        kWh             kilowatt-hour
        LCOE            levelized cost of electricity
        MW              megawatt
        MWh             megawatt-hour
        PV              photovoltaic
        REDA            Renewable Energy Development Act
        REN21           Renewable Energy Policy Network for the 21st Century
        RET             renewable energy targets
        RPS             renewable portfolio standard
        TGC             tradable green certificate
        USD             United States dollar

                                                         iii
This report is available at no cost from the National Renewable Energy Laboratory (NREL) at www.nrel.gov/publications.
Acknowledgments
This report was prepared for the Clean Energy Solutions Center (Solutions Center). The
Solutions Center is an initiative of the Clean Energy Ministerial (CEM), a global forum to
share best practices and promote policies and programs that encourage and facilitate the
transition to a global clean energy economy. As the operating agency of the Solutions Center,
the National Renewable Energy Laboratory (NREL) is responsible for publications of the
Solutions Center. The authors acknowledge Dr. Ian Lloyd of the United States Department of
Energy; Ron Benioff, Terri Walters, and Dr. Jaquelin Cochran of the National Renewable
Energy Laboratory; and William Becker of the Center for the New Energy Economy for their
reviews.
iv
This report is available at no cost from the National Renewable Energy Laboratory (NREL) at www.nrel.gov/publications.Abstract
A number of policies have been used historically in order to stimulate the growth of the
renewable electricity sector. This paper examines four of these policy instruments:
competitive tendering (sometimes called renewable electricity auctions), feed-in tariffs, net
metering and net billing, and tradable renewable energy certificates. 1 In recent years,
however, a number of changes to both market circumstances and to policy priorities have
resulted in numerous policy innovations, including the emergence of policy hybrids. With no
common language for these evolving policy mechanisms, policymakers have generally
continued to use the same traditional policy labels, occasionally generating confusion as many
of these new policies no longer look, or act, like their traditional predecessors. In reviewing
these changes, this paper makes two separate but related claims: first, policy labels themselves
are breaking down and evolving. As a result, policy comparisons that rely on the conventional
labels may no longer be appropriate, or advisable. Second, as policymakers continue to adapt,
we are in effect witnessing the emergence of the next generation of renewable electricity
policies, a change that could have significant impacts on investment, as well as on market
growth in both developed and developing countries.
1
A number of additional policies have been used in order to stimulate the growth of the renewable energy sector,
including incentives, rebates and the streamlining of administrative and grid connection procedures. However,
this paper focuses on these four policy instruments, as it is here where the changes in definitions are most
notable.
v
This report is available at no cost from the National Renewable Energy Laboratory (NREL) at www.nrel.gov/publications.1 Introduction
Renewable sources of electricity have grown significantly within the global power sector
during the past decade. Total installed renewable electricity capacity increased from 800
Gigawatts (GW) in 2004 to 1,560 GW by the end of 2013, and renewable energy sources now
supply 22.1% of global electricity demand of which 5.8% is from sources other than large
hydro (REN21 2014).
Renewable energy market growth has been driven by a combination of factors, including
government policy, rising energy prices, and rapidly declining renewable energy costs. By
2013, 144 countries around the world had adopted specific targets for renewable energy
development, up from only 48 countries in 2004. The growth in renewable energy targets
(RETs) has been accompanied by a far-reaching international debate as to which
mechanism(s) should be used to help achieve these targets. In the United States, many state-
level renewables portfolio standard (RPS) policies are due to expire in the years ahead, a fact
that is likely to spur further debate about the best policy pathways forward.
While the majority of renewable energy market growth to date has occurred in Europe and
North America, a greater share of renewable electricity investment is moving toward
developing countries (REN21 2014):
• China now leads the world in terms of installed renewable electricity capacity, and the
BRICS nations (Brazil, Russia, India, China, and South Africa) collectively account
for 29% of global non-hydropower renewable electricity capacity.
• Approximately 43% of global renewable electricity investment (i.e., USD $93 billion)
occurred in developing countries in 2013.
• Top countries in terms of new renewable electricity investment relative to annual
gross domestic product (GDP) in 2013 included Uruguay, Mauritius, Costa Rica,
South Africa, and Nicaragua.
As developing countries craft renewable electricity policies, they should consider whether
traditional policies make sense in their own market or whether new policy innovations may
better meet their needs or better respond to their policy priorities.
Policy Best Practices?
Europe and North America have had vigorous debates about the comparative merits of
specific policies, and many experts elsewhere in the world have looked to these debates for
policy guidance. In the United States in the 1990s, for example, policymakers puzzled over
whether to adopt RPSs (i.e., mandatory targets for renewable electricity) or public benefits
funds (i.e., surcharges on electricity bills used to support grants, rebates, and other incentives)
(Wiser et al. 1996). In the 1990s and 2000s in Europe, policymakers debated whether to use
feed-in tariffs (FITs) or tradable credits (Butler & Neuhoff 2008) or whether to move to
auction mechanisms instead. In the United States, there are now several ongoing debates
between net metering and FIT regimes (Trabish 2014), as well as about how to combine
elements of different policies in new ways (Krasko and Doris 2012, Kreycik et al. 2011).
Although these best practice debates have been well documented, policy definitions are
increasingly fluid, the competitive environment is continually evolving, and policymakers are
increasingly required to innovate in order to reconcile different policy objectives. As a result,
“best practice” may be less about adopting policy ‘A’ or policy ‘B’, but rather about
combining a wide range of policy design elements into a flexible and well-adapted policy
1
This report is available at no cost from the National Renewable Energy Laboratory (NREL) at www.nrel.gov/publications.framework. In some cases, this may involve abandoning the traditional policy categories
altogether, and pushing out in new directions.
Policy Definitions Are Increasingly Fluid
Table 1 summarizes a number of widely used renewable electricity policies and provides
simplified traditional definitions. The table focuses specifically on how the remuneration that
power producers receive is determined and structured. 2
Table 1. Traditional Renewable Electricity Policy Categories
Policy Instrument How Prices Are Typically How Compensation Is Typically Structured
Determined
Tendering or Competition among Long-term fixed price contracts
Reverse Auctions generators
Feed-in Tariffs Set administratively Long-term fixed price contracts
Net Metering Pegged to the retail System output offsets retail electricity purchases
electricity rate Excess generation can be applied as a credit to
future electricity purchases
Tradable Short-term fluctuations in Variable pricing, depending on supply and
Certificates credit and spot market demand conditions, and ability of generators to
prices secure short-term contracts
It is important to note that the “traditional” policy toolkit described above in Table 1 was
largely developed when the cost of renewable energy technologies was significantly higher
than both conventional electricity prices and utilities’ avoided generation costs. As renewable
technology costs continue to fall and conventional fuel prices continue to rise, these policies
are being adapted to these new power sector economics. In Germany, for example, the
levelized cost of solar energy is now significantly below the retail price of electricity
(Ferroukhi et al. 2014). In other regions such as in the Caribbean and the Pacific Islands,
renewable electricity sources are increasingly competitive at the wholesale level as well,
undercutting the avoided cost of generation from diesel or heavy fuel oil (Rickerson et al.
2012). Partly in response to these changing cost dynamics, policymakers in certain
jurisdictions are beginning to introduce policies that do not fit neatly into the “traditional”
policy categories.
The conversation has been further complicated by the fact that the traditional policy labels are
no longer applied in a standard or uniform manner. As renewable energy policies have spread
internationally during the past decade, the labels have been applied and interpreted in a wide
variety of different ways. For example:
• In the United States in 2009 and 2010, for example, California was debating whether
to adopt a FIT or an auction, while in the neighboring state of Nevada some
commentators were arguing that auctions were in fact a type of FIT (Carmichael 2010,
Nimmons 2009).
• In Australia, many states used the term “feed-in tariffs” to refer to policies that paid a
fixed tariff only for excess generation (e.g., Tasmanian Government 2013) in contrast
to traditional FITs, which compensate producers for their full output. These Australian
2
Note that each involves a wide range of other design considerations beyond remuneration structure. See: Barnes
et al. 2013, Couture et al. 2010, Maurer & Barroso 2011, Rader & Hempling 2001, Rickerson et al. 2012.
2
This report is available at no cost from the National Renewable Energy Laboratory (NREL) at www.nrel.gov/publications.policies are arguably closer in design to traditional net metering policies than to
European FITs.
• Grenada’s “Renewable Standard Offer” policy (which is also referred to as “net
billing”) more closely resembles a traditional FIT because all of the generated power
is purchased under a long-term agreement, and none of it can be used to offset on-site
load (GRENLEC 2011).
• In Kenya, the national FIT law establishes a price ceiling under which contracts must
be negotiated on a case-by-case basis (Ministry of Energy 2010). Kenya’s FIT
represents a departure from European FITs, under which a minimum price is typically
guaranteed on a standard offer basis.
As these examples and many other examples illustrate, the same policy labels are frequently
used to mean different things. These inconsistent definitions can make it difficult for
policymakers to compare the experiences of one jurisdiction with those of another. For
instance, it may be challenging to compare the impact of FITs in Australia to the impact of
FITs in Germany because the two policies are designed quite differently. In some cases,
different policies sharing one common label differ from one another so fundamentally that
using the same labels is no longer appropriate, or advisable. Instead, this paper argues that
policymakers should focus on the underlying policy design elements, rather than comparing
policies using the traditional labels. A focus on policy structure is also helpful as it can help
highlight new ways in which policymakers can combine the various elements of different
policies together to better meet their objectives.
The “Next Generation” of Renewable Electricity Policy
There have been a number of recent studies that attempt to characterize what the “next
generation” of renewable electricity policy will look like (Miller et al. 2013; Kreycik et al.
2011). This paper seeks to build on this literature by exploring specific examples of recent
policy innovation. 3
The following three sections of the paper focus on three emerging policy trends,
including the:
• Desire to support a diversity of investors and project sizes
• Need to design new policy approaches to deal with markets that have reached (or
surpassed) socket parity 4
• Push to integrate non-hydro renewable electricity technologies into wholesale spot
markets.
3
The focus here is specifically on renewable electricity policies, but the authors acknowledge that the future of
policymaking will require approaches that take into account issues such as grid integration, electricity market
reform, and the ongoing evolution of utility business models.
4
Socket parity is defined as the point at which the cost of generation from on-site renewable energy systems is
lower than the cost to purchase retail electricity from the grid, including taxes and fixed charges.
3
This report is available at no cost from the National Renewable Energy Laboratory (NREL) at www.nrel.gov/publications.It is in response to these and other related trends that the distinctions between the traditional
policy categories are beginning to break down. The following sections examine each of these
three trends in greater detail. Section 2 takes a closer look at efforts to combine FITs and
auctions together in Taiwan and France in order to improve cost-efficiency, while maintaining
access to a wider range of market participants than typically possible under auctions alone.
Section 3 examines how policymakers in both Europe and in a number of island regions
around the world are attempting to regulate the development of distributed RETs in markets
beyond socket parity. And, Section 4 analyzes efforts in Germany to integrate variable
renewable electricity technologies into wholesale spot markets as the share of renewable
electricity in the market grows.
4
This report is available at no cost from the National Renewable Energy Laboratory (NREL) at www.nrel.gov/publications.2 Ensuring Investor and Project Size Diversity
In recent years, policymakers have been attempting to strike the right balance between a
number of different, and some would argue competing, policy priorities.
On one hand, policymakers have been seeking (or have been required by statute) to obtain the
lowest possible price for electricity from renewable electricity projects. This is reflected in the
design of many RPS policies in both the U.S. and Canada and in the growing interest in
competitive tendering (e.g., reverse auctions) globally (Cozzi 2012). The number of
developing countries that utilize auction mechanisms has increased significantly during the
past several years. Auctions have the advantage of encouraging price competition. However,
they also “tend to favour large players that are able to afford the associated administrative
and transaction costs (Lucas et al. 2013)” and may only favor certain types of renewables
over others (e.g., large wind plants will likely beat out small biogas projects if the two
compete against one another). 5
On the other hand, policymakers have realized that focusing on price alone can leave other
priorities or values insufficiently reflected. One such priority is the desire to encourage a
wider diversity of investors to participate in renewable energy investment, including citizens,
farmers, communities, small businesses and local governments.
In order to balance the objective of price competition with the objective of investor diversity,
policymakers have attempted to combine policies in a range of different ways, including using
policies such as auctions and FITs in parallel to encourage projects of different sizes. 6 Under
this approach, auctions are typically used to procure larger systems (e.g., >1 MW) while FITs
are used to procure smaller projects (e.g.,2.1 FITs and Auctions in Taiwan
In 2009, the Taiwanese government enacted a national Renewable Energy Development Act
(REDA). At the time, Taiwan anticipated achieving a target of 75 MW of new solar
photovoltaic (PV) projects. Since then, however, Taiwan had significantly expanded its PV
target to procure a total of 6.2 GW of solar PV by 2030. 8 Due primarily to constraints over
access to land, Taiwan had chosen to place a higher priority on rooftop solar PV systems. By
the end of 2014, Taiwan is likely to have a total installed solar PV capacity of over 600 MW. 9
In order to achieve its target, Taiwan is using both a FIT policy and a competitive tendering
scheme. 10 Under the competitive tendering scheme, bidders must submit their project
proposals with their bid price. Winning bidders are then allowed to sell electricity to Tai-
Power at the same rate for twenty years under fixed price contracts (Ming-Zhi Gao 2014).
However, Taiwan allows certain project categories to be formally exempted from the
tendering process, offering a twenty-year FIT contract instead. FITs are currently offered, at
different tariffs, in the following cases: 11 1) projects between 1 kW and 10 kW that are owned
by individual residents; 2) projects smaller than 30 kW; 3) projects up to 5 MW in size that
are owned directly by local governments, or by state-owned enterprises, and 4) projects on
government buildings that are rented to private owners and receive formal approval from local
governments (Ming-Zhi Gao 2014). 12 This means that PV projects of less than 30 kW in
Taiwan can technically apply to participate in the tendering scheme, or apply to participate in
the FIT, provided they qualify. More flexibility is also given to particular project types, such
as those owned by local governments. This increases investor choice, while lowering the
barriers to entry for certain project types.
It is important to note that in Taiwan the administratively set rates offered under the FIT
policy act as “tariff ceilings.” In order words, bid prices under its tendering policy are
implicitly capped: bids higher than the current FIT rates will not be accepted. This means that
the projects that qualify for exemptions from the tendering scheme are effectively given
preferential treatment: they benefit from higher tariff values, and a less burdensome
administrative process to obtain a contract. They also face a lower risk that their project
proposal will fail to result in a contract to build. In this way, Taiwan has attempted to make it
both easier, and more attractive, for certain project types, most notably small projects under
30 kW and those owned by local governments, to participate.
8
See: http://web3.moeaboe.gov.tw/ECW/english/news/News.aspx?kind=6&menu_id=958&news_id=3769
9
Ibid.
10
Projects can also be supported directly via grants or cash incentives by local or national governments.
11
Note that the number and scope of the exemptions have been growing since the combined policy was
introduced in March 2011.
12
Ming-Zhi Gao 2014b. See also http://web3.moeaboe.gov.tw/ECW/english/news/
News.aspx?kind=6&menu_id=958&news_id=3769 .
6
This report is available at no cost from the National Renewable Energy Laboratory (NREL) at www.nrel.gov/publications.Table 2 provides a snapshot of the tariff ceilings offered as part of Taiwan’s FIT policy
in 2014.
Table 2. Taiwan’s FIT Rates and Tariff Ceilings (H2:2014)
System Capacity H2:2014 Tariff Rates
≥1 –The data from Taiwan suggest that while the combined FIT and tendering scheme has proved
quite successful at encouraging both new investment, and a diversity of project sizes, the
overall policy framework has not been as successful as hoped at fostering projects 12 MW). France’s national strategy
included a number of technology-specific program-size caps. The technology-specific caps
were related to national targets, as determined by the multi-year investment plans for the
French electricity system. If the technology-specific targets specified within the investment
plans were not reached, the government retained the option of tendering out the remaining
capacity (J.O. 2000, J.O. 2003).
In March 2011, France expanded the use of tenders to smaller projects and introduced a
tender for rooftop solar PV projects between 100 kW and 250 kW in size (the “simplified”
tendering approach), and a tender for rooftop projects between 250 kW and 12 MW in size
(the more “complex” tendering approach). 15 Systems below 100 kW remain eligible for fixed
FIT rates.
Table 3. Project Size and Applicable Policy in France
Solar PV Project Size Applicable Policy
0 to 100 kW Feed-in Tariff
100 to 250 kW Simplified Tendering
>250 kW Complex Tendering
As seen above, France demonstrates a highly layered policy approach, where different
policies are combined together to target different project size segments. Beyond providing
better control over market growth, such a layered approach also enables policymakers to
ensure that project development is occurring across all project size categories. Moreover, it
also enables policymakers to choose the policy deemed most appropriate to encourage
development in that particular size segment.
What is also noteworthy about France is that a number of additional levers are used to
encourage actor diversity or to facilitate the process for smaller participants. First, in order to
13
Yueh-Hsun Tsai 2014. Personal communication with Professor Yueh-Hsun Tsai, Associate Professor of Law
at National Yunlin University of Science and Technology in Taiwan (September 9 2014). Note that this report
has not evaluated whether the FIT level is sufficient to fully recover project development costs.
14
This includes a target of “at least seven (7) billion Taiwan Dollars (TND) (USD $230 Million) in loans” to the
sector. See: http://web3.moeaboe.gov.tw/ECW/english/news/News.aspx?kind=6&menu_id=958&news_id=3769.
15
Note that the scheme was modified in 2013, but the basic distinction between projects from 100 kW to 250 kW
and those above remains. Moreover, the effort to simplify the process for smaller projects is also present in both.
8
This report is available at no cost from the National Renewable Energy Laboratory (NREL) at www.nrel.gov/publications.ensure that individual actors do not string several 250 kW projects together on the same roof,
the policy includes a limit of 250 kW per legal entity. Second, in order to prevent one
developer from developing many projects in the same region, the policy includes a minimum
distance of 500 meters (approximately 1,650 feet) between projects owned by the same legal
entity. This prevents one developer, or legal entity, from owning several smaller systems in
one cluster, or geographic area. Third, the simplified tendering approach significantly reduces
the overall pre-qualification requirements imposed on project proponents, as well as the
amount of documentation that they must provide. This makes the simplified tendering scheme
closer to a feed-in tariff in certain key respects, as a far greater number of contract design
elements are standardized at the outset for all project proponents. The primary functions of the
simplified tendering process are therefore mostly limited to price discovery, and contract
allocation. In contrast, the process for larger projects requires a significantly greater and more
onerous set of application forms, including a much more detailed description of the project
(manufacturer, location where the components were manufactured, etc.), as well as a thorough
independent environmental assessment.
Outcomes
As seen below, France has managed to encourage a wide range of both project sizes as well as
investor types to participate in its RE policy. It has accomplished this in part by retaining a
simple FIT for small projects (under 100 kW), with differentiated rates for a wide range of
project size categories, and by introducing size-differentiated tenders for projects between 100
and 250 kW and between 250 kW and 12 MW in size (see Figure 2).
2,500
MW 2,000
1,500
1,000
500
0
≤3kW 3 to ≤9kW 9 to ≤36kW 36 to ≤100kW 100 to >250kW
≤250kW
Sept 30 2011 Sept 30 2012 Sept 30 2013 Sept 30 2014
Figure 2. Breakdown of installed solar PV capacity in mainland France from 2011 to 2014 (MW)
Sources: Commissariat général du développement durable 2011, 2012, 2013, 2014
9
This report is available at no cost from the National Renewable Energy Laboratory (NREL) at www.nrel.gov/publications.Figure 3 shows the breakdown of project development in each category as a share of total
installed capacity as of September 30 2014.
≤3kW 3 to ≤9kW
14% 5%
9 to ≤36kW
>250kW 7%
45%
36 to
100 to ≤100kW
≤250kW 12%
17%
Figure 3. Breakdown of installed solar PV capacity in mainland France by project size (%)
(Sept 30, 2014)
Source: Commissariat général du développement durable 2014
As can be seen above, the installed capacity under France’s FIT policy represents
approximately 38% of the total, while the various tendering schemes implemented by France
over the years represent the remaining 62%. While the share of the total installed capacity
represented by the largest projects (greater than 250 kW) remains the largest, there continues
to be significant development across all project sizes.
With regard to price efficiency, the results in France are also instructive.
Table 4. Purchase Prices under FITs and Tendering in France (Q3:2013)
Solar PV System Type 16 Applicable Applicable Tariff in Q3: 2013
System Size Policy
Fully building-integrated (where
the PV system physically EUR 296,9/MWh
0–9 kW Feed-in Tariff
constitutes the roofing (USD $378/MWh)
structure)
EUR 152,1/MWh
0–36 kW Roof-mounted systems (where Feed-in Tariff
the PV system can be mounted (USD $193/MWh)
on either the roof or wall EUR 144,5/MWh
36–100 kW structure) Feed-in Tariff
(USD $184/MWh)
Roof-mounted solar PV EUR 168/MWh
Simplified
100–250 kW systems, as stipulated in the (USD $214/MWh)
Tendering
tender documents (July – September 2013)
Source: Photovoltaique Info 2014b and CRE 2014
16
For a more detailed description of the difference between simplified and fully building-integrated PV systems,
see http://www.photovoltaique.info/Aujourd-hui-arrete-du-4-mars-2011 (in French) and Rickerson et al. 2014.
10
This report is available at no cost from the National Renewable Energy Laboratory (NREL) at www.nrel.gov/publications.There are a number of points to highlight here. First, the current purchase prices (in
EUR/MWh) offered to fully building-integrated solar PV projects between 0 kW and 9 kW is
approximately two times higher than the tariff offered to roof or wall-mounted projects up to
100 kW. This price differential represents a significant premium for fully building-integrated
projects, and a clear incentive for smaller project sizes. 17 Partly as a result of this significant
price incentive, France has been successful in attracting considerable investment in smaller
project categories – in fact, by far the single largest number of projects in France (over
246,000 individual installations) have been installed in the 1-kW to 3-kW project size
category (ERDF 2013).
Based on the concurrent tendering results (Q3:2013), the average weighted purchase price of
tendered projects between 100 and 250 kW (namely, EUR 168/MWh) is significantly higher
than the tariffs offered to smaller projects (0–100 kW) under the FIT policy (EUR
144.5/MWh to EUR 152,1/MWh). This value is also higher than average retail prices in
France, which are currently EUR 0.147/kWh (~USD $0.19/kWh) when all taxes are included
(Rickerson et al. 2014). This result suggests that a significant premium is being paid for
projects developed under tendering versus projects developed under the FIT in the same
project size category. These results, which have been corroborated by independent analyses
conducted elsewhere in Europe (Hauser et al. 2014, Frontier Economics 2014), run counter to
conventional arguments that competition between developers under tendering should result in
lower prices.
Recent evidence from France therefore does not support the argument that tendering
necessarily results in lower procurement prices: the outcomes ultimately depend on the
specific design of the policy as well as on the overall implications for investment risk, and
transaction costs.
2.3 Lessons Learned
FITs and tendering policies are beginning to be used in combination with one another in order
to meet different objectives.
The case of Taiwan suggests that even though an FIT (at over USD $0.28/kWh) is offered to
small solar PV projects (In addition, it is noteworthy that the more standardized the tendering requirements
become, the closer auction schemes become in certain respects to traditional feed-in
tariffs: bidders are effectively bidding to obtain the rights to a long-term power purchase
agreement, the same kind of standard contract commonly allocated on a first-come-first-serve
basis under FIT policies. In such cases, the primary functions of an auction become twofold:
price discovery, and contract allocation.
Finally, the cases of Taiwan and France both demonstrate that policy outcomes are not always
as expected. For instance, in the case of France the move to auctions resulted in higher
per kWh payments for generators, rather than lower prices. Further analysis and policy
experimentation is recommended in order to better understand the reasons for this result. In
this process, such analysis may yield new insights into how FITs and auctions can be
combined in a more effective and impactful way in the future.
12
This report is available at no cost from the National Renewable Energy Laboratory (NREL) at www.nrel.gov/publications.3 Socket Parity and Beyond
Historically, renewable electricity policy has been motivated in part by the need to “close the
gap” between the costs of renewable electricity and the costs of conventional generation. As
the cost of renewable energy technologies has continued to decline and the cost of fossil and
nuclear energy has continued to rise, however, important questions have emerged about how
current policy frameworks might need to be adjusted or reimagined (IEA 2014; Wirth 2014).
In particular, the attainment of “socket parity” – the point at which the levelized cost of
electricity generation (LCOE) from on-site renewable systems is equal to, or less than, the
price of purchasing electricity from the wall socket – is challenging conventional policy
models for on-site generation.
This section first reviews current experience in the European and then explores how island
jurisdictions are providing a laboratory for policy innovation in this area. Both Europe and
island regions have been chosen primarily due to the fact that retail electricity prices in both
tend to be significantly higher than the LCOE of distributed renewable electricity
technologies such as solar. In some cases, customer-sited generation is more cost-effective
than power generation from larger, centralized units. This makes both islands and certain
European countries valuable testing grounds, as they demonstrate some of the ways in which
both utilities and regulators are adapting to a world where the cost of customer-sited
generation is lower than the cost of power from the grid. As the section shows, one of the
consequences of this trend is that policymakers are moving beyond traditional FITs and net
metering policies, and beginning to develop innovative policies that are strictly neither FITs
nor net metering.
3.1 Policy Approaches in Europe
During the 2000s, much of Europe enacted FITs that guaranteed long-term fixed prices for
electricity generation, with pricing based on each technology’s generation cost (Couture et al.
2010, Jacobs 2012). Generators would typically sell 100% of their power into the electricity
grid – even if their systems were located on-site (e.g., a PV system mounted on the roof). FIT
payments for on-site generation, and for PV in particular, were historically higher than retail
electricity prices in most countries. However, decreases in the cost of renewable electricity
have led to decreased rates. Using Germany as an example, Figure 3 illustrates, the FIT
payment levels for new, small-scale PV in Germany (purple line) are now less than half the
current residential retail rate (green line). The levelized cost of energy for solar PV in
Germany is projected to continue to decline from ~$0.12-$0.18/kWh and to ~$0.08-
$0.13/kWh by 2030 (Kost et al. 2013). These declines will continue to move Germany
significantly beyond the point of “socket parity,” leading a greater number of households and
businesses to begin installing behind-the-meter solar systems to reduce the amount of power
they consume from the network. This change is likely to require further policy innovation in
the years ahead to better accommodate the rise of these so-called “prosumers” 18 (Rickerson
et al. 2014).
18
Prosumers are consumers who also produce their own power from a range of different on-site generators,
including PV systems.
13
This report is available at no cost from the National Renewable Energy Laboratory (NREL) at www.nrel.gov/publications.Figure 4. Development of FIT payment levels and retail electricity rates in Germany
Source: Ferroukhi et al. 2014
Germany is currently debating how to appropriately govern on-site renewable energy
consumption in response to these changing dynamics. In 2009, Germany actively encouraged
on-site consumption by paying generators a bonus to utilize their own electricity. 19 In
response to this policy – and to rising retail prices – an increasing number of on-site
generators now consume their own power, rather than exporting 100% of their output to the
grid, as under the FIT. While the government does not currently monitor how much solar PV
generation is consumed directly on-site, estimates suggest that most new projects being
installed in Germany are being configured to maximize their on-site consumption, due in
large part to the growing disparity between the LCOE of on-site PV and retail prices. These
estimates in turn suggest a self-consumption ratio in the range of 30% for residential projects
(see Rickerson et al. 2014).
19
Note that this bonus payment is no longer offered.
14
This report is available at no cost from the National Renewable Energy Laboratory (NREL) at www.nrel.gov/publications.On-site generation is beginning to cause national policy challenges, however. The above-
market cost of historical FIT payments is currently recovered through a surcharge that is
included in retail electricity rates. This surcharge is currently USD $0.08/kWh
(EUR0.0624/kWh). By consuming their own output, on-site generators purchase less power
from the grid and therefore avoid paying this surcharge. In response, the latest amendment to
Germany’s national FIT law requires on-site generators to pay 30% of this surcharge (rising
to 40% as of 2017) for each kilowatt-hour of electricity they consume on-site. Installations
below 10 kW are exempt from the regulation. 20 Other European countries are exploring how
to balance support for on-site energy consumption with decreased retail electricity purchases
in their markets. An increasing number of U.S. states are also grappling with similar questions
since most U.S. states allow on-site generators to engage in some form of net metering
(Barnes et al. 2013).
The issues related to supporting and managing on-site energy consumption are highly
complex, and raise questions such as how to value the benefits that on-site generation creates
for other stakeholders, how to recover or allocate the costs that on-site generators avoid
paying for (such as grid costs), and how to amend existing regulatory frameworks as on-site
generators scale up in the future (Bird et al. 2013; Hansen et al. 2013; Rickerson et al. 2014).
3.2 Policy Approaches on Islands
This section looks specifically at island jurisdictions. Most islands depend primarily on liquid
fuels such as diesel for electricity generation and have some of the highest retail electricity
prices in the world as a result (Rickerson et al. 2012). With increasing demand from their
citizens for renewable electricity generators, island policymakers are evaluating whether to
adopt traditional feed-in tariffs or net metering, or whether to introduce innovations that are
more adapted to their specific contexts. In the absence of appropriate, off-the-shelf terms to
describe their new policies, they have often simply adopted the policy labels from the existing
toolkit, occasionally generating confusion as the new policies no longer resemble their
traditional predecessors.
When island jurisdictions face high retail electricity costs, which can exceed USD $0.50/kWh,
the cost to produce on-site renewable electricity can be lower than the retail rate of electricity
and even below the utility’s cost of generation. In such environments, offering to purchase (or
credit) on-site generation at the full retail rate, or even at the full avoided generation cost, may
result in on-site producers being over-compensated. At the same time, renewable electricity
that is below utility avoided cost may create opportunities for ratepayer savings rather than
incurring additional ratepayer costs.
In reaction to these challenges and opportunities, island jurisdictions have been developing
policies that combine elements of FITs and net metering in innovative ways. This section
briefly reviews current practice in four island jurisdictions to highlight the different
approaches that policymakers are taking. These jurisdictions include the Cayman Islands,
Grenada, and the Seychelles. These islands were chosen in order to reflect a diversity of
current policy approaches, although there are currently many other innovations taking place
around the world.
Table 5 provides a summary of the key policy elements, and more detailed descriptions of
each policy follow the table.
20
Even though the effects of this new regulation are not yet entirely clear, it can be expected that investment into
new solar PV systems will remain financially attractive due to the large gap between the retail electricity price
and the LCOE of solar PV. However, this depends on the self-consumption ratio and the size of the PV system.
15
This report is available at no cost from the National Renewable Energy Laboratory (NREL) at www.nrel.gov/publications.Table 5. Summary of On-site Generation Policies in the Cayman Islands, Grenada, and the Seychelles
Country Policy On-site System size cap Program Cap Compensation Compensation amount (USD)
mechanism Consumption? structure
Cayman CORE Tariff Yes* Residential: 20 kW, or 2 MW Cash payment for ~USD $0.47/kWh for 20 years
Islands peak load metered output of
Commercial: 100 kW, or PV system
peak load
Grenada Renewable No 100 kW 2.5% of annual Cash payment for $USD 0.17/kWh for 10 years, or
Standard electricity demand 100% of power Average avoided cost of fuel for
Offer previous 12 months
Seychelles Net-Metering Yes Commercial: 50% of on- None Cash payment for 88% of the avoided fuel cost
Program site energy consumption excess generation
for
* Power can be consumed on-site but does not offset retail electricity purchases.
16
This report is available at no cost from the National Renewable Energy Laboratory (NREL) at www.nrel.gov/publications.Cayman Islands. The Cayman Islands have adopted a unique on-site generation policy with
the Customer-Owned Renewable Energy (CORE) tariff program. Generators can choose
whether to connect in front of the meter (as under a traditional FIT) or behind the meter (as is
typically done with net metering). Under both configurations, however, generators are billed
at the retail rate for 100% of the power that is consumed on-site. This arrangement applies
whether that electricity is purchased from the grid or generated by the on-site PV system.
Electricity generated by the PV system is then compensated at a rate of ~$0.47/kWh for
residential systems for a 20-year period, whether or not that power is consumed on-site or
exported directly into the grid. For comparison, the residential retail rate was USD $0.44/kWh
in the first quarter of 2014. This arrangement provides generators with the flexibility to use
their PV system to charge a battery for back-up power (i.e., in the behind-the-meter
configuration), while also ensuring that on-site generators pay the retail rate for all the power
they consume. At the same time, the policy creates an incentive for customer-sited renewable
energy since the CORE tariff is higher than the retail electricity rate. System size is limited
either by a size cap or by on-site peak load, whichever is less, and the total amount of capacity
installed that can utilize the CORE tariff is limited to 2 MW. At the end of 2013, there were
27 systems totaling 234 kW installed, with an additional 15 projects totaling 373 kW under
design or construction (Caribbean Utilities Company 2014).
Grenada. Grenada instituted a net metering policy in 2007, which allowed generators to
receive credit for excess generation at the full retail rate of electricity. The retail rate in
Grenada was USD $0.37/kWh, and it was determined that generators were likely capturing
excess profits while the utility lost an estimated $500,000 in revenue each year. In order to
limit excess profits and reduce utility revenue loss, the utility switched to a net billing policy
under which generators must purchase 100% of their power at the full retail rate and export
100% of their power to the grid. 21 The program is currently limited to 2.5% of annual
electricity demand. Generators can choose to export at either a fixed rate of USD $0.17/kWh
(XCD.45/kWh) for ten years or at the utility’s average avoided cost (which is adjusted
annually) (GRENLEC 2011). Of note, the switch to avoided cost has slowed market growth at
the residential level significantly.
While island policymakers and much of the literature often refer to Grenada’s policy as net
billing, it should be noted that in this instance, the term “net billing” is used differently than it
is in the United States (where the term originated). In the United States, net billing policies
allow on-site generators to offset retail electricity purchases – the key difference between net
metering and net billing being that under net billing, the rate at which generators are
compensated, or credited, differs from the retail rate they pay. The policy in Grenada, by
contrast, does not allow any on-site consumption. In addition, the requirement that 100% of
power be exported also distinguishes Grenada’s policies from feed-in tariffs in countries such
as Australia (where generators can choose to consume some of their power on-site).
Seychelles. The Seychelles introduced a “Net-Metering Program” for on-site generators in
January 2014. Under the program, generators can offset their retail electricity purchases from
the grid. Excess power, however, is then sold at a “net feed-in tariff” rate equal to 88% of the
utility’s cost of fuel. Excess power is not compensated at 100% of the avoided fuel cost in
order to account for electricity grid losses (Ministry of Environment and Energy 2014). At
present, the avoided fuel cost equates to approximately $0.19/kWh. System sizes are capped
at 50% of on-site energy consumption for commercial systems larger than 10 kW. Systems
smaller than 10 kW are not capped. The Seychelles is currently exploring whether to institute
21
Note that the program is officially called the Renewable Standard Offer.
17
This report is available at no cost from the National Renewable Energy Laboratory (NREL) at www.nrel.gov/publications.a policy under which 100% of power would be sold into the grid, similar to the policy
currently in place in Grenada.
3.3 Lessons Learned
There are a number of lessons that emerge from the case of Germany. In recent years, the
LCOE of solar PV has fallen far below the retail price of electricity, making it possible for
both residential and commercial customers to offset their own consumption using on-site PV.
After incentivizing on-site consumption for a few years, Germany has now reversed course,
and has started to require these prosumers to share in the costs of the EEG surcharge. This
dynamic highlights the challenges that policymakers face in the years ahead in controlling the
rate of uptake of customer-sited solar PV in an environment of decreasing PV costs, and
rising retail rates. Germany’s decision to require PV prosumers to share in the costs of the
EEG surcharge is merely the beginning, as more jurisdictions around the world design new
ways either to slow the pace of growth in this market segment, or to require prosumers to
contribute more to cover fixed electricity system costs. It is too early to say whether and to
what extent these attempts will be successful.
The emerging experience on islands, however, highlights a number of important lessons:
• No “right” or “best” policy. The islands have generally opted not to implement
traditional net metering or FIT policies. Instead, they have introduced policies that
combine elements of FITs and net metering in new ways. In some cases, such as the
Cayman Islands, these policy structures represent unique approaches globally. On the
other hand, a clear common practice, let alone a “best” practice, has not yet emerged
and additional research into the pros and cons of different policy approaches within
island contexts would be useful.
• Utilities are designing polices to address revenue loss. Grenada’s utility has shifted
from a net metering policy to a policy that requires 100% of PV output to be sold into
the grid. Part of the intent behind this shift is to require generators to pay the full retail
rate and limit the impact of reduced electricity sales on both other ratepayers and
utility shareholders. The Seychelles is considering a similar approach, while the
Cayman Islands have created a globally unique solution to this issue. Restricting the
amount of power that can be consumed on-site, however, raises legal, moral, as well
as philosophical questions as to whether utility customers have the “right” to consume
their own power on-site. This issue is contentious in Grenada and similar debates may
occur elsewhere as other countries contemplate “100% sale” requirements.
• Avoided cost is emerging as a cost benchmark. Grenada and the Seychelles have
linked generator compensation to costs that the utility avoids, such as fuel costs, when
it does not have to generate the power. The use of avoided cost in islands – and
eventually in non-island countries – could serve as an attractive payment rate as
renewable energy costs continue to fall below retail rates. At present, however there is
not sufficient evidence about the performance of these policies to draw broad
conclusions about their effectiveness. At least in the case of Grenada, the switch to
avoided cost has slowed market growth at the residential level significantly.
• Terminology is not applied in a standard manner. The policy names used within
these island jurisdictions illustrate how traditional policy labels are being used
inconsistently. As discussed above, the term net billing in Grenada has significant
design differences from net billing policies in the United States. The Net-Metering
Program in the Seychelles, meanwhile, describes its crediting arrangement a “net
excess feed-in tariff,” thus borrowing terminology from both policy traditions
18
This report is available at no cost from the National Renewable Energy Laboratory (NREL) at www.nrel.gov/publications.simultaneously. These uses of terms can make cross-comparisons using the standard
labels challenging. Policy comparisons instead require more detailed consideration of
policy structure (see Table 5) in order to be useful.
Many island jurisdictions are entering periods of transition for customer-sited renewable
electricity policy as fuel costs rise and renewable energy technology costs fall. Many
mainland jurisdictions are not far behind. As the LCOE of customer-sited renewable
electricity technologies continues to fall below retail electricity prices in jurisdictions like
Germany, the Caribbean region, the Indian Ocean, as well as the Pacific Islands region,
policymakers are beginning to respond by developing policies that lie somewhere between
traditional net metering and FITs.
19
This report is available at no cost from the National Renewable Energy Laboratory (NREL) at www.nrel.gov/publications.4 Integrating Renewable Electricity into
Wholesale Markets
Many countries around the world have started to liberalize their electricity markets over the
past decades. More recently, an increasing number of developing countries are taking steps
towards market liberalisation in order to attract foreign investment and meet increasing
electricity demand (Wamukonya 2003; Gratwick and Eberhard 2008).
With shares of renewable electricity sources increasing, several jurisdictions around the globe
have started to better integrate renewables into the existing power sector structure, i.e.,
integrating renewables into wholesale markets. Until recently, this policy challenge has
primarily concerned decision makers in Europe and in certain parts of the United States.
However, policymakers in emerging economies and developing countries will be facing
similar design issues once their share of renewable electricity rises and if, or when, wholesale
competition is more fully introduced. In this section, we focus on the European debate
because the policy innovations under consideration were first implemented in the European
Union. As highlighted above, the examples from Europe may be valuable to emerging
markets that are considering, or that are in the process of, introducing wholesale electricity
markets.
The basic rationale for exposing electricity producers to (spot) market prices is to encourage
the alignment of power generation with electricity demand. Traditional power producers can –
at least theoretically – react to price signals from wholesale power markets by increasing or
decreasing their power output and by designing their power plant in order to better align
power output with typical demand patterns. This is much more difficult with non-dispatchable
generation such as traditional solar PV and wind power. 22 In addition, spot market prices in
fully liberalized markets should indicate whether investment in new power generation
capacity is needed (based on current prices and predictions of future spot market price
evolution). Any investor will need to decide on whether the expected prices will allow the
recovery of costs over the lifetime of a power plant.
Aspects of this discussion can be seen in the debate between FITs and tradable green
certificates (TGCs) in the EU over the last decade.
4.1 Policy Conflict in the European Union: FITs versus TGCs
For many years, the policy discourse in the European Union was dominated by a
confrontation between proponents of tradable green certificates and proponents of FITs
(Lauber 2004; Ringel 2006; Fouquet and Johansson 2008; Jacobsson et al. 2009). This
confrontation was driven by the apparent trade-off between two seemingly contradictory
policy objectives:
• Creating a high degree of investment security to drive renewable electricity producers
through fixed, long-term prices
• Ensuring compatibility with a fully liberalized European electricity market and its
short-term trading requirements.
FITs were argued to be more consistent with the former objective, whereas tradable credits
were argued to be more consistent with the latter.
22
Options may include, for instance, facing solar PV systems east or west instead of south. While this could help
avoid the daytime PV supply peak, and the associated wholesale market price trough, it would also reduce
overall output from the PV system.
20
This report is available at no cost from the National Renewable Energy Laboratory (NREL) at www.nrel.gov/publications.You can also read