A complex aerosol transport event over Europe during the 2017 Storm Ophelia in CAMS forecast systems: analysis and evaluation
←
→
Page content transcription
If your browser does not render page correctly, please read the page content below
Atmos. Chem. Phys., 20, 13557–13578, 2020
https://doi.org/10.5194/acp-20-13557-2020
© Author(s) 2020. This work is distributed under
the Creative Commons Attribution 4.0 License.

A complex aerosol transport event over Europe during the 2017
Storm Ophelia in CAMS forecast systems: analysis and evaluation
Dimitris Akritidis1 , Eleni Katragkou1 , Aristeidis K. Georgoulias1 , Prodromos Zanis1 , Stergios Kartsios1 ,
Johannes Flemming2 , Antje Inness2 , John Douros3 , and Henk Eskes3
1 Department of Meteorology and Climatology, School of Geology, Aristotle University of Thessaloniki, Thessaloniki, Greece
2 European Centre for Medium-Range Weather Forecasts (ECMWF), Reading, UK
3 Royal Netherlands Meteorological Institute (KNMI), De Bilt, the Netherlands

Correspondence: Dimitris Akritidis (dakritid@geo.auth.gr)

Received: 13 May 2020 – Discussion started: 18 June 2020
Revised: 18 September 2020 – Accepted: 29 September 2020 – Published: 13 November 2020

Abstract. In mid-October 2017 Storm Ophelia crossed over          footprint on air quality, both CAMS global and regional fore-
western coastal Europe, inducing the combined transport           cast systems are generally able to reproduce the observed sig-
of Saharan dust and Iberian biomass burning aerosols over         nal of increase in surface particulate matter concentrations.
several European areas. In this study we assess the per-          The regional component performs better in terms of bias and
formance of the Copernicus Atmosphere Monitoring Ser-             temporal variability, with the correlation deteriorating over
vice (CAMS) forecast systems during this complex aerosol          forecast time. Yet, both products exhibit inconsistencies on
transport event and the potential benefits that data assimila-    the quantitative and temporal representation of the observed
tion and regional models could bring. To this end, CAMS           surface particulate matter enhancements, stressing the need
global and regional forecast data are analysed and compared       for further development of the air quality forecast systems
against observations from passive (MODIS: Moderate Res-           for even more accurate and timely support of citizens and
olution Imaging Spectroradiometer aboard Terra and Aqua)          policy-makers.
and active (CALIOP/CALIPSO: Cloud-Aerosol LIdar with
Orthogonal Polarization aboard Cloud-Aerosol Lidar and In-
frared Pathfinder Satellite Observations) satellite sensors and
ground-based measurements (EMEP: European Monitoring              1   Introduction
and Evaluation Programme). The analysis of the CAMS
global forecast indicates that dust and smoke aerosols, dis-      Atmospheric aerosols play a prominent role in atmospheric
cretely located on the warm and cold fronts of Ophelia, re-       composition, climate and human health (Pöschl, 2005; IPCC,
spectively, were affecting the aerosol atmospheric composi-       2013). Given the broad variety of their natural and anthro-
tion over Europe during the passage of the Storm. The ob-         pogenic sources, their relatively short lifetime, and their dif-
served MODIS aerosol optical depth (AOD) values are sat-          ferent formation mechanisms, aerosols exhibit highly vari-
isfactorily reproduced by the CAMS global forecast system,        able spatio-temporal distributions around the globe (Putaud
with a correlation coefficient of 0.77 and a fractional gross     et al., 2010; Boucher, 2015). Over Europe, apart from local
error (FGE) of 0.4. The comparison with a CAMS global             emissions, particulate matter quantities are also determined
control simulation not including data assimilation indicates a    by atmospheric transport through mesoscale weather systems
significant improvement in the bias due to data assimilation      (Ansmann et al., 2003; Kallos et al., 2007; Pey et al., 2013),
implementation, as the FGE decreases by 32 %. The qual-           occasionally implying significant implications for air qual-
itative evaluation of the IFS (Integrated Forecast System)        ity and public health (Stafoggia et al., 2016). Consequently,
dominant-aerosol type and location against the CALIPSO            the operational forecast of atmospheric composition is essen-
observations overall reveals a good agreement. Regarding the      tial in the direction of supporting social and health policy-
                                                                  makers.

Published by Copernicus Publications on behalf of the European Geosciences Union.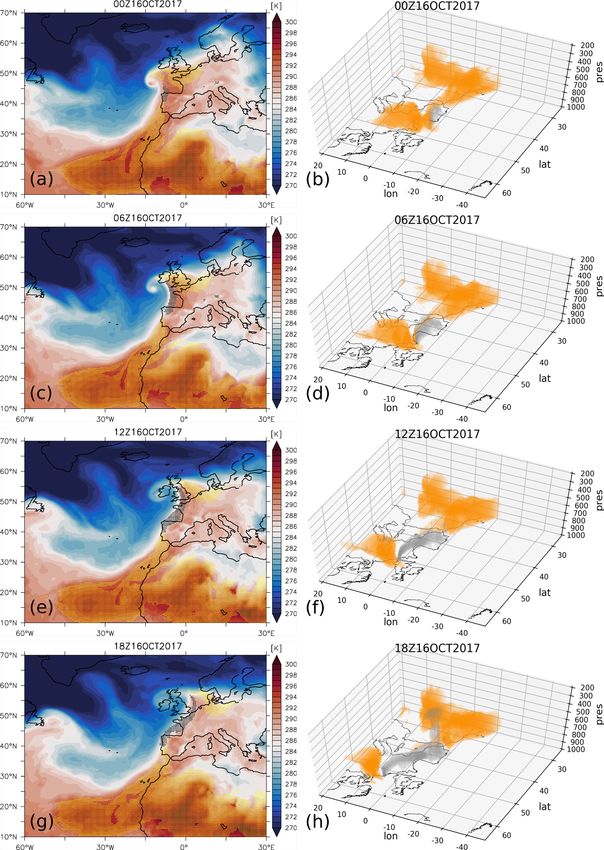
13558                                 D. Akritidis et al.: CAMS forecast of Ophelia-induced aerosol pollution over Europe

   Aerosols interact with solar radiation directly through         Europe may affect the atmospheric composition and the local
scattering and absorption (Haywood and Boucher, 2000)              air quality (Sciare et al., 2008).
and indirectly by modifying the micro- and macro-physical             During recent years various global and regional integrated
properties of clouds (Lohmann and Feichter, 2005), mod-            forecast systems incorporating online coupling between me-
ulating the energy balance in the Earth–atmosphere sys-            teorology and atmospheric composition have been developed
tem and, by extension, the climate. More specifically, they        to support research, forecast and policy activities (Baklanov
may act as cloud condensation nuclei (CCN) and ice nuclei          et al., 2014). Copernicus (Copernicus, 2020) is the Euro-
(IN), increasing the cloud albedo under constant water paths       pean system for monitoring Earth coordinated by the Euro-
(Twomey, 1974), as well as cloud lifetime and coverage,            pean Union. The Copernicus Atmosphere Monitoring Ser-
and suppressing precipitation formation (Albrecht, 1989). In       vice (CAMS) (CAMS, 2020a) is one of the six services that
addition, the presence of absorbing aerosols alters the ther-      Copernicus provides, using a comprehensive global assimi-
modynamic state of the atmosphere (semi-direct effect), af-        lation and forecasting system to assess the state and compo-
fecting clouds and precipitation in various ways (Koch and         sition of the atmosphere on a daily basis. It incorporates in-
Del Genio, 2010).                                                  formation from models and observations, providing daily 5 d
   Exposure to particulate matter air pollution is well            forecasts of atmospheric composition fields, such as chemi-
known to have significant implications for respiratory-            cally reactive gases and aerosols (Flemming et al., 2015; In-
and cardiovascular-based mortality (Russell and Brunekreef,        ness et al., 2015). The CAMS global modelling system is
2009; Lelieveld et al., 2015; Burnett et al., 2018). Fine par-     also used to provide the boundary conditions for the CAMS
ticulate matter with a diameter less than 2.5 µm (PM2.5 ) has      ensemble of regional air quality models, which produce 4 d
more profound effects on human health compared to coarse           forecasts of European air quality at higher horizontal res-
particulate matter with a diameter less than 10 µm (PM10 ),        olution. To increase confidence of operational use, unravel
as smaller particles can penetrate more efficiently into the       limitations and further improve the CAMS forecast systems,
lungs and indoor environments, and they can also be trans-         analysis and evaluation of its performance during complex
ported over greater distances given their smaller mass and         and challenging situations is deemed necessary.
therefore their longer lifetime (Pope and Dockery, 2006).             On the morning of 16 October 2017 a red sky phenomenon
Recently, Lelieveld et al. (2019) based on new hazard ratio        was reported at several sites of the United Kingdom (UK)
functions and ambient air pollution exposure data estimated        (Telegraph, 2017), as a result of the high aerosol loadings
that air pollution reduces the mean life expectancy by more        in the overlying atmosphere (Harrison et al., 2018; Osborne
than 2 years in Europe. Moreover, aerosols can pose sig-           et al., 2019), while similar reports on the morning of 17 Oc-
nificant hazards for aviation, occasionally resulting in flight    tober were given for the Netherlands as well (NLTIMES,
delays and cancellations, as intense episodic dust and sea         2017). These high aerosol loadings were the result of trans-
salt events can alter visibility (Gertisser, 2010; Tighe, 2015),   port of desert dust from northern Africa and smoke from
while the presence of dust and volcanic particles may po-          Iberian wildfires. This study aims to analyse and evaluate the
tentially cause aircraft engine damage (Gertisser, 2010). The      performance of CAMS global and regional forecast systems
impact of aerosols on photovoltaic generation is mainly due        during this challenging combined dust and biomass burning
to reduction of surface solar radiation through scattering and     transport event over western Europe induced by the passage
absorption (Li et al., 2017) and deposition of dust on solar       of Storm Ophelia in mid-October 2017. To this end, CAMS
panels, reducing their energy production potential (Beattie        global and regional day-1 forecast data are used, along with
et al., 2012).                                                     ground-based observations (EMEP: European Monitoring
   North African dust is the dominant source of mineral dust       and Evaluation Programme), and observations from passive
in the atmosphere (Ginoux et al., 2012), affecting the air         (MODIS: Moderate Resolution Imaging Spectroradiometer
quality of Europe from the Mediterranean (Querol et al.,           aboard Terra and Aqua) and active (CALIOP/CALIPSO:
2009; Georgoulias et al., 2016) up to Scandinavia (Ansmann         Cloud-Aerosol LIdar with Orthogonal Polarization/Cloud-
et al., 2003). The main transport pathways of Saharan dust to-     Aerosol Lidar and Infrared Pathfinder Satellite Observations)
wards Europe are either passing through the Mediterranean          satellite remote sensors. Furthermore, the impact of data as-
by northward flow associated with the presence of cyclones         similation on the CAMS global aerosol burden representa-
(anticyclones) westward (eastward) of a Saharan dust source        tion is also explored using a control simulation without the
or via the Atlantic route including a westward transport of        use of data assimilation. Finally, to explore the forecast capa-
Saharan dust by trade winds over the Atlantic followed by          bility over time, CAMS global and regional day-2 and day-3
northward and then eastward flow towards Europe (Israele-          forecasts of PM10 and PM2.5 concentrations are also anal-
vich et al., 2012). Over Europe, biomass burning emissions         ysed. This paper builds upon the work of Akritidis et al.
from wildfires are a present air pollution risk, likely to in-     (2018), assessing the performance of CAMS forecast prod-
crease in a changing climate (Knorr et al., 2017; Turco et al.,    ucts, the potential benefits of data assimilation in the CAMS
2017). The regional-scale (Amiridis et al., 2009) and inter-       global system and the added value that CAMS regional mod-
continental (Markowicz et al., 2016) transport of smoke over       els could bring during a complex aerosol transport event. The

Atmos. Chem. Phys., 20, 13557–13578, 2020                                          https://doi.org/10.5194/acp-20-13557-2020
D. Akritidis et al.: CAMS forecast of Ophelia-induced aerosol pollution over Europe                                        13559

structure of the paper is as follows. Section 2 presents the      where ρ is the air density, SS1 is the sea salt radius size
CAMS forecast systems and the observational data that are         bin 1 (0.03–0.5 µm), SS2 is the sea salt radius size bin 2
used to validate their performance. Section 3 shows the anal-     (0.5–5 µm), DD1 is the desert dust radius size bin 1 (0.03–
ysis and evaluation results, and Sect. 4 summarizes the key       0.55 µm), DD2 is the desert dust radius size bin 2 (0.55–
findings.                                                         0.9 µm), DD3 is the desert dust radius size bin 3 (0.9–20 µm),
                                                                  OM1 is the hydrophobic organic matter, OM2 is the hy-
                                                                  drophilic organic matter, BC1 is the hydrophobic black car-
2     CAMS forecast systems, validation data and metrics          bon, BC2 is the hydrophilic black carbon and SU1 is the
                                                                  aerosol sulfate (ECMWF, 2020a). A detailed description and
2.1    CAMS global forecast system                                evaluation of the aerosol scheme used in IFS can be found in
                                                                  Rémy et al. (2019). To unravel the impact of chemical data
One of the core CAMS products is the 5 d global chemical          assimilation on aerosol burden representation during the ex-
weather forecast, based on the European Centre for Medium-        amined event, an additional IFS control run without data as-
Range Weather Forecasts (ECMWF) Integrated Forecasting            similation (no DA) is also used for intercomparison.
System (IFS). In October 2017, the forecast data were prod-
ucts of the IFS model cycle 43r3, having a horizontal reso-       2.2   CAMS regional forecast system
lution of about 40 km and 60 vertical levels reaching up to
0.1 hPa. The IFS modelling system uses an extended ver-           The CAMS regional forecast system provides the ensem-
sion of the Carbon Bond 2005 (CB05) chemical mecha-               ble median (RegEns) and members of the European-scale
nism (Flemming et al., 2015) and the Morcrette et al. (2009)      air quality forecasts for every hour up to 4 d in advance.
aerosol parameterization. Several chemical species, includ-       The products have a 0.1◦ horizontal resolution and are based
ing ozone, nitrogen dioxide, carbon monoxide and sulfur           on state-of-the-art numerical air quality models developed in
dioxide, are assimilated using products of several satellite      Europe: CHIMERE from INERIS (National Institute for In-
missions (Inness et al., 2015, 2019b, and references therein).    dustrial Environment and Risks) (Menut et al., 2013), DEHM
Moreover, the IFS assimilates total aerosol optical depth         from Aarhus University (Christensen, 1997), EMEP from
(AOD) retrievals from the MODIS instrument on NASA’s              MET-Norway (Simpson et al., 2012), EURAD-IM from the
Aqua and Terra satellites, as well as PMAp (Polar Multi-          University of Cologne (Memmesheimer et al., 2004), GEM-
Sensor Aerosol product) aerosol retrievals over sea, a com-       AQ from IEP-NRI (Institute of Environmental Protection –
bined GOME-2/AVHRR product produced by EUMETSAT                   National Research Institute, Polish Ministry of Environment)
(EUMETSAT, 2020), and subsequently updates the individ-           (Kaminski et al., 2008), LOTOS-EUROS from KNMI (Royal
ual aerosol components based on their fractional contribution     Netherlands Meteorological Institute) and TNO (Nether-
to the total aerosol mass (Benedetti et al., 2009; Georgou-       lands Organisation for Applied Scientific Research) (Man-
lias et al., 2018). Five types of aerosols are included, namely   ders et al., 2017), MATCH from SMHI (Swedish Meteoro-
sea salt, dust, hydrophilic and hydrophobic organic matter        logical and Hydrological Institute) (Robertson et al., 1999),
and black carbon, and sulfate. The first and second aerosol       MOCAGE from Météo-France (Guth et al., 2016), and
types are provided in three radius size bins: 0.03–0.5, 0.5–      SILAM from FMI (Finnish Meteorological Institute) (Sofiev
5 and 5–20 µm and 0.03–0.55, 0.55–0.9 and 0.9–20 µm, re-          et al., 2015). More details on the regional air quality systems
spectively. The different IFS aerosol types are treated as ex-    can be found in CAMS (2020c). The global ECMWF IFS
ternally mixed (Inness et al., 2019a).                            forecasts provide the meteorological and chemical bound-
   Here we use IFS day-1 (referred here as IFS) forecasts         ary forcing to the regional model suite, and CAMS pro-
(initiated at 00:00 Z) of temperature, mean sea level pressure    vides the emissions. Several CAMS regional models assim-
(mslp), omega vertical velocity, divergence, u and v wind         ilate PM10 and PM2.5 surface observations from various
components, mass mixing ratio of 11 aerosol variables, total      stations of the EEA’s (European Environment Agency) Air
AOD at 550 nm (AOD550 or just AOD), sea salt AOD, dust            Quality e-Reporting database but not satellite aerosol prod-
AOD, organic matter AOD, black carbon AOD, sulfate AOD,           ucts. More specifically, during the period of interest (October
and carbon monoxide (CO) mass mixing ratio. Also used are         2017), CHIMERE and EURAD were assimilating both PM10
day-1 to day-3 forecast data of PM10 and PM2.5 surface con-       and PM2.5 , MOCAGE only PM10 , and (finally) SILAM and
centrations, which are derived according to the following for-    MATCH were assimilating only PM2.5 ; PM10 and PM2.5
mula:                                                             concentrations in the regional models are calculated using
                                                                  simulated aerosol fields specific to each regional model. All
PM10 = ρ · (SS1/4.3 + SS2/4.3 + DD1 + DD2 + 0.4                   models are validated operationally (CAMS, 2020b) and in an
                                                                  posteriori way (CAMS, 2020a), and operational verification
     · DD3 + OM1 + OM2 + SU1 + BC1 + BC2),                  (1)
                                                                  results are available daily for six chemical species (ozone, ni-
PM2.5 = ρ · (SS1/4.3 + 0.5 · SS2/4.3 + DD1 + DD2                  trogen dioxide, sulfur dioxide, carbon monoxide, PM10 and
        + 0.7 · OM1 + 0.7 · OM2 + 0.7 · SU1 + BC1 + BC2),   (2)   PM2.5 ). It has to be noted that for the examined period (Oc-

https://doi.org/10.5194/acp-20-13557-2020                                       Atmos. Chem. Phys., 20, 13557–13578, 2020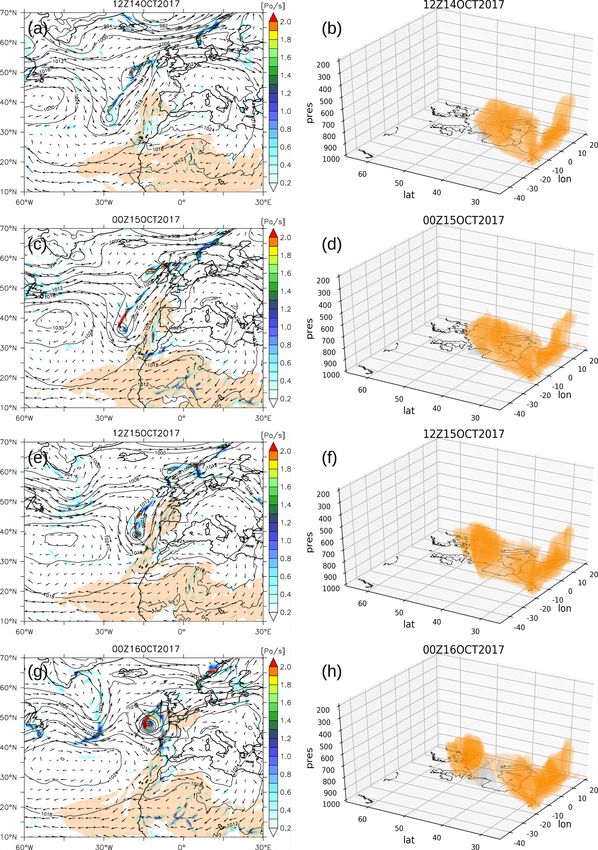
13560                                 D. Akritidis et al.: CAMS forecast of Ophelia-induced aerosol pollution over Europe

tober 2017) the DEHM and GEM-AQ models were not in-                EBAS database (EBAS, 2020) for the time period from 10 to
cluded in RegEns, as they were recently added in the CAMS          20 October 2017. The stations are located over western Eu-
regional forecast system. RegEns day-1 (referred here as Re-       rope, are away from the dust and biomass burning sources,
gEns), day-2 and day-3 forecast data (initiated at 00:00 Z) of     and lie across the plumes of high AOD loadings, exhibiting
PM10 and PM2.5 surface concentrations are used to analyse          significant increases in PM10 and PM2.5 surface concentra-
and evaluate the performance of the CAMS regional forecast         tions during the examined event. Data are provided with 1 h
system during the examined event.                                  temporal resolution, yet a 3 h resolution is used for direct
                                                                   comparison with the IFS data. It has to be noted that from the
2.3   Validation data                                              examined stations only GB0043R and GB0048R for PM10
                                                                   and GB0048R for PM2.5 are listed as assimilation stations
To evaluate the CAMS forecast systems ability to cap-              for the CAMS regional models.
ture the spatial and temporal distribution of aerosols in
the atmosphere, AOD550 data from the two MODIS sen-                2.4    Statistical metrics
sors aboard EOS (Earth Observing System) Terra (Equa-
tor crossing time of 10:30 LT, local time) and Aqua (Equa-         To evaluate the performance of CAMS forecast systems with
tor crossing time of 13:30 LT) satellites are used along           respect to observational data, the following statistical metrics
with aerosol subtype data from CALIOP/CALIPSO (Equa-               are used.
tor crossing time of ∼ 13:30 LT). MODIS is a 36-band imag-             a. The temporal correlation of CAMS models with obser-
ing radiometer with a viewing swath of 2330 km, offering                  vations is assessed with the Pearson correlation coeffi-
almost daily global coverage (Salomonson et al., 1989). In                cient (R) that measures the strength of their linear asso-
this work, level-2 data with a resolution of 10 × 10 km2 at               ciation, ranging between +1 and −1:
nadir from the MODIS Collection 6.1 combined Dark Tar-                                      P          P P
get algorithm (DT) and Deep Blue algorithm (DB) scien-                                   N Mi Oi − Mi Oi
                                                                          R= q P                      q P                      , (3)
tific dataset AOD_550_Dark_Target_Deep_Blue_Combined
                                                                                  N Mi2 − ( Mi )2 N Oi2 − ( Oi )2
                                                                                              P                      P
are processed. There are two different DT algorithms: one
for retrievals over land (Kaufman et al., 1997; Remer et al.,             where Mi and Oi are the modelled and observed values,
2005; Levy et al., 2013) and one for water surfaces (Tanré                respectively, and N is the size of the sample.
et al., 1997; Remer et al., 2005; Levy et al., 2013), while DB
currently delivers retrievals over all land types (Hsu et al.,         b. The model error is estimated using the fractional gross
2013; Sayer et al., 2013, 2014, 2015) despite the fact that it            error (FGE), which ranges between 0 and 2, and behaves
was originally developed for bright land surfaces only (Hsu               symmetrically with respect to under- and overestima-
et al., 2004). For the quantitative evaluation of the CAMS                tion:
forecasts, the MODIS Terra and Aqua data were merged and                             N
brought to the CAMS native grid.                                                   2 X Mi − Oi
                                                                          FGE =                ,                                (4)
    CALIOP is a spaceborne lidar instrument (Hunt et al.,                          N i Mi + Oi
2009) providing profiles of aerosol and cloud-related prop-
erties (Winker et al., 2009) within the first 30 km of the                where Mi and Oi are the modelled and observed values,
atmosphere by measuring the backscatter signals and the                   respectively, and N is the size of the sample.
polarization of the backscattered light. The CALIPSO al-
gorithm identifies distinct atmospheric layers (clean air,         3     Results
aerosols, clouds, surface, etc.) (Vaughan et al., 2009; Kim
et al., 2018) and attributes a specific aerosol subtype (marine,   3.1    Storm Ophelia and transport pathways
dust, polluted continental/smoke, clean continental, polluted
dust, elevated smoke, dusty marine, polar stratospheric cloud      Hurricane Ophelia occurring in October 2017 was an ex-
aerosols, volcanic ash, sulfate/other) to each of them (Omar       ceptional low-pressure system, as it had unique character-
et al., 2009). In this work, data from the CALIOP/CALIPSO          istics as an Atlantic hurricane; it caused the death of three
version 4.20 level-2 product (Kim et al., 2018) with a hor-        people and extended damages during its passage over Ire-
izontal resolution of 5 km and a vertical resolution of 60 m       land (BBC, 2017), and it indirectly affected the air quality
(for heights below ∼ 20 km) are processed.                         and the atmospheric composition over several western Euro-
    To assess the CAMS forecast system’s performance in            pean areas. Ophelia initiated as a nontropical low-pressure
reproducing the impacts on air quality during the Ophelia          system over the Atlantic at the southwest of the Azores in
passage, ground-based observations are used. Measurements          early October 2017, and it did not have the same fate as
of PM10 and PM2.5 surface concentrations from eight rural          that of common Atlantic tropical storms that head to the
background stations (see Table 1 for details) are obtained         west (Stewart, 2018). Instead, Ophelia marched northeast-
from the EMEP (Tørseth et al., 2012) network through the           wards, initially reaching coastal Portugal, and subsequently

Atmos. Chem. Phys., 20, 13557–13578, 2020                                            https://doi.org/10.5194/acp-20-13557-2020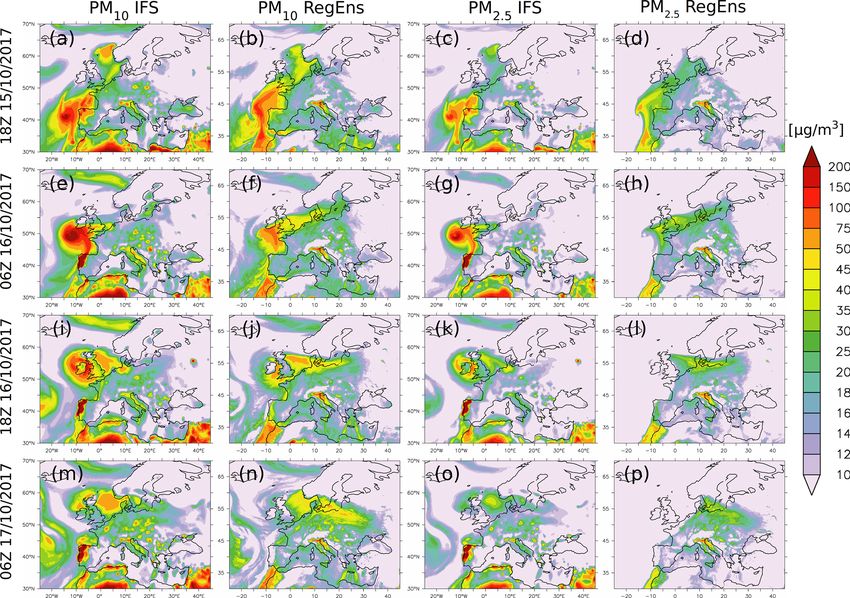
D. Akritidis et al.: CAMS forecast of Ophelia-induced aerosol pollution over Europe 13561
Table 1. Observational data used in the present study.
EMEP ground-based stations
Name Country Code Location PM10 PM2.5
La Coulonche France FR0018R 48.63◦ N, 0.45◦ W yes no
Guipry France FR0024R 47.83◦ N, 1.84◦ W yes yes
Narberth Great Britain GB0043R 51.78◦ N, 4.69◦ W yes no
Auchencorth Moss Great Britain GB0048R 55.79◦ N, 3.24◦ W yes no
Chilbolton Observatory Great Britain GB1055R 51.15◦ N, 1.44◦ W yes yes
Kollumerwaard the Netherlands NL0009R 53.33◦ N, 6.28◦ E yes yes
De Zilk the Netherlands NL0091R 52.3◦ N, 4.5◦ E yes yes
Cabauw Wielsekade the Netherlands NL0644R 51.97◦ N, 4.92◦ E yes yes
Satellite observations
Sensor/satellite Type Overpass Coverage Resolution Product
MODIS/Terra passive 10:30 LT daily 10 km × 10 km AOD550
MODIS/Aqua passive 13:30 LT daily 10 km × 10 km AOD550
CALIOP/CALIPSO active ∼ 13:30 LT 16 d repeat cycle hor.: 5 km, ver.: aerosol subtype
60 m (< 20 km)
lost its tropical characteristics, downgrading to an extratrop- at12:00 Z on 15 October), the dust particles entrained from
ical cyclone (ex-hurricane); it followed a northern path to- the meridional flow at the east of Ophelia’s periphery form
wards Great Britain, becoming the easternmost major At- an extended plume of high dust loadings reaching the south-
lantic hurricane ever recorded (Stewart, 2018). The afore- east coast of the UK (Fig. 2c, d, e and f). Throughout the
mentioned route of Ophelia resulted from the guidance of an following 12 h the plume expands to the north and east, pass-
upper-level trough located over the Atlantic (Stewart, 2018; ing over northwestern France and southern UK (Fig. 2g and
Rantanen et al., 2020). Figure 1 presents the prevailing syn- h). At 00:00 Z on 16 October the Ophelia storm merges
optic conditions in the middle troposphere (500 hPa), as seen with the frontal system as can be seen in Figs. 2g and 3a,
from IFS, during the period from 12:00 Z on 14 October 2017 while smoke from wildfires that have been burning across the
to 00:00 Z on 16 October 2017. A mid-latitude trough domi- Iberian Peninsula is evident at 850 hPa, with high CO volume
nates over the central Atlantic, with the surface low-pressure mixing ratio (> 200 ppbv), which was uplifted through the
system located ahead of the trough and to the east of it, be- warm conveyor belt (Osborne et al., 2019) on the southeast-
ing driven from the northeasterly-oriented wind flow (Fig. 1a ern part of Ophelia where upward motion dominates (Fig. 2g
and b). At 12:00 Z on 15 October and as the trough axis turns and Fig. S1 in the Supplement). From this moment and until
negatively tilted the flow becomes mostly southerly (Fig. 1c) 18:00 Z on 16 October, dust and smoke particles gather on
dragging Ophelia towards Ireland (Fig. 1d). Although after the warm and cold fronts of Ophelia’s warm sector, respec-
12:00 Z on 14 October Ophelia moved over sea surface tem- tively, transported over western Europe through the frontal
peratures (SSTs) of about 25 ◦ C, which in general do not system (Fig. 3c, e and g). This distinct discretization of dust
support hurricane intensification (Stewart, 2018); the alter- and biomass burning within the warm sector of Ophelia is
native fuel for Ophelia to maintain its strength was found in well illustrated by the 3-D fields of dust and CO mixing ratio
the enhanced upper-level divergence on the eastern flank of exceeding 80 µg/kg and 200 ppbv, respectively, resembling
the trough (not shown). This resulted in convection reinforce- the shape of the warm and cold fronts (Fig. 3d, f and h).
ment, as revealed from the enhanced upward vertical velocity Noteworthy is the uplift of smoke over the northwest Iberian
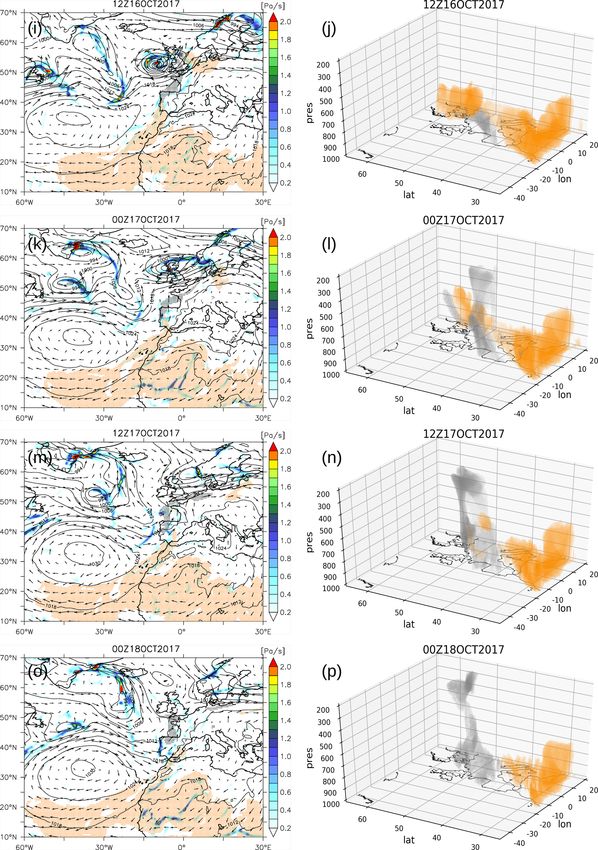
values at 500 hPa exceeding 2 Pa/s (Fig. 1). Peninsula from 18:00 Z on 16 October to 06:00 Z on 17 Octo-
From 00:00 Z on 13 October and onwards, Saharan dust, ber (Fig. 2l), due to the profound upward motions induced by
being transported through the trade winds over the west coast strong lower convergence and upper divergence (Fig. S1 in
of Africa, is exposed to the southerlies on the east side of the Supplement) at the eastern flank of the upper-level trough
the Ophelia system, setting up a dust outbreak that gradually (not show). This elevated smoke plume is drifted during the
moves to the north. At 12:00 Z on 14 October a plume of high next 24 h from the northeasterly flow towards the UK (Fig. 2n
IFS dust mass mixing ratio exceeding 80 µg/kg is found west and p). The Ophelia storm starts dissipating from 00:00 Z on
of the Iberian Peninsula up to approximately 700 hPa, as de- 17 October onwards, fading away over Norway at 00:00 Z
picted in Fig. 2a and b. During the next 24 h and as the surface on 18 October. A graphical representation of the IFS dust
low-pressure system is travelling further north (at ∼ 40◦ N and CO transport along with the synoptic evolution during
https://doi.org/10.5194/acp-20-13557-2020 Atmos. Chem. Phys., 20, 13557–13578, 2020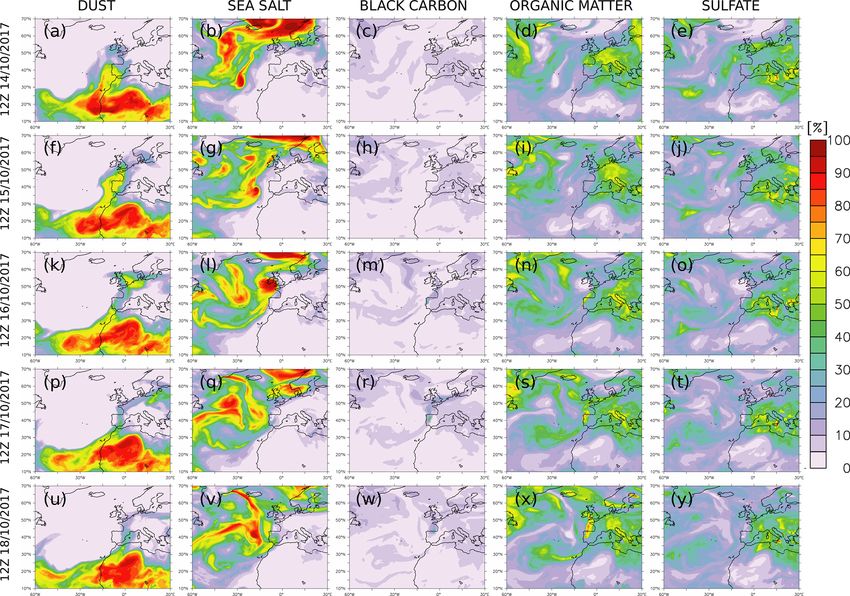
13562 D. Akritidis et al.: CAMS forecast of Ophelia-induced aerosol pollution over Europe
Figure 1. IFS geopotential height (in gpm; red contours; 1 gpm is the distance of 1 m in geopotential height), negative of omega vertical
velocity (−dp/dt) (in Pa/s, colour shaded) and wind direction (black vectors) at 500 hPa, during the period from 12:00 Z on 14 October
2017 to 00:00 Z on 16 October 2017 (12 h interval) (a, b, c, d). Also shown is the location of the surface low-pressure system denoted with
the capital letter L.
the passage of Ophelia (from 00:00 Z on 12 October 2017 to the Ophelia storm and the associated transport pathways. To
21:00 Z on 20 October 2017) is provided as an animation in evaluate the CAMS global AOD550 forecast product during
the Supplement. this period, the respective AOD550 fields are also shown in
Fig. 4 (middle column). Overall, there is a good agreement
3.2 Aerosol atmospheric composition between the CAMS global forecast product and the satellite
observations, at least in qualitative terms, as the forecasted
Here we explore the impact of Ophelia’s passage on the high AOD loadings resemble that of observations. To assess
aerosol atmospheric composition over the broader European the impact of AOD data assimilation on IFS AOD forecast,
region, using CAMS global forecast data and satellite obser- the differences of AOD550 with and without the use of data
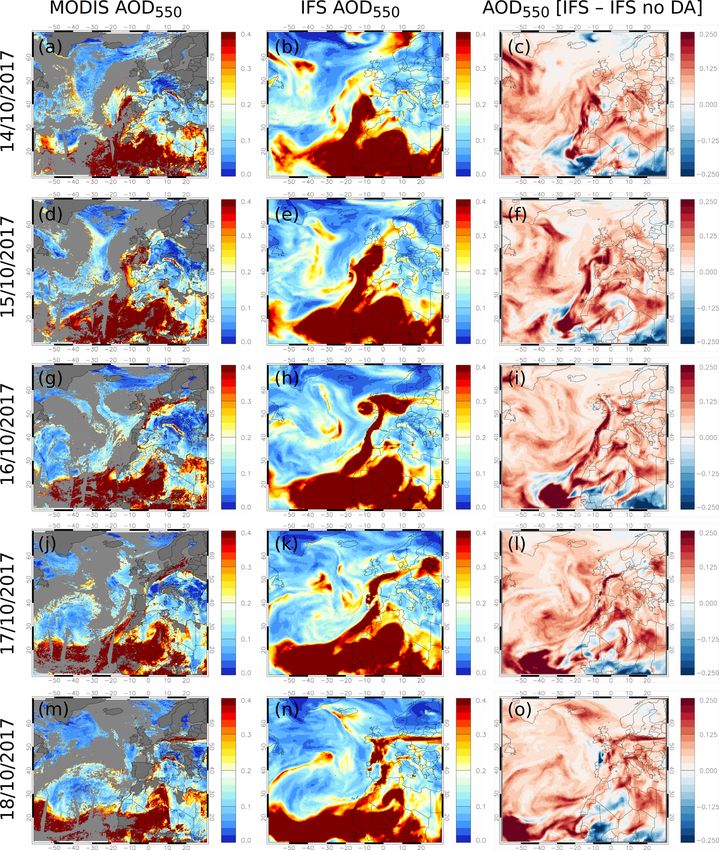
vations. The MODIS Terra and Aqua AOD550 spatial distri- assimilation are also shown in Fig. 4 (right column), reveal-
bution for the time period from 14 to 18 October 2017 is pre- ing that data assimilation boosts AOD values near the exam-
sented in Fig. 4 (left column). It should be noted that these ined AOD plumes, while near the dust sources over Africa
data do not give an independent validation as they are also it mostly suppresses them. In addition, to quantitatively val-
assimilated in the IFS. High aerosol loadings (> 0.4) are ob- idate the CAMS global AOD forecast, a comparison of spa-
served to the west of the Iberian Peninsula on 14 October tially and temporally co-located AOD550 data between IFS
(Fig. 4a), while 1 d later the aerosol plume is extended fur- (with and without the use of data assimilation) and MODIS
ther north and east over France, the English Channel and the Terra and Aqua is performed for two box regions: the whole
Celtic Sea (Fig. 4d). On 16 and 17 October, high AOD550 domain shown in Fig. 4 and a smaller domain in northwestern
values are seen over the North Sea, Baltic Sea, France, Bel- Europe shown in Fig. 9d. As depicted from the scatter plots
gium, the Netherlands and Germany (Fig. 4g and j), while of Figs. 5a and b for the large domain, the use of data as-
on 18 October the plume is found over Germany and Poland similation improves the CAMS global forecast performance,
(Fig. 4m). The observed buildup of high AOD loadings over increasing the correlation (from 0.72 to 0.77) and reducing
Europe is in line with the aforementioned description of the error (FGE from 0.59 to 0.4) with respect to the con-
Atmos. Chem. Phys., 20, 13557–13578, 2020 https://doi.org/10.5194/acp-20-13557-2020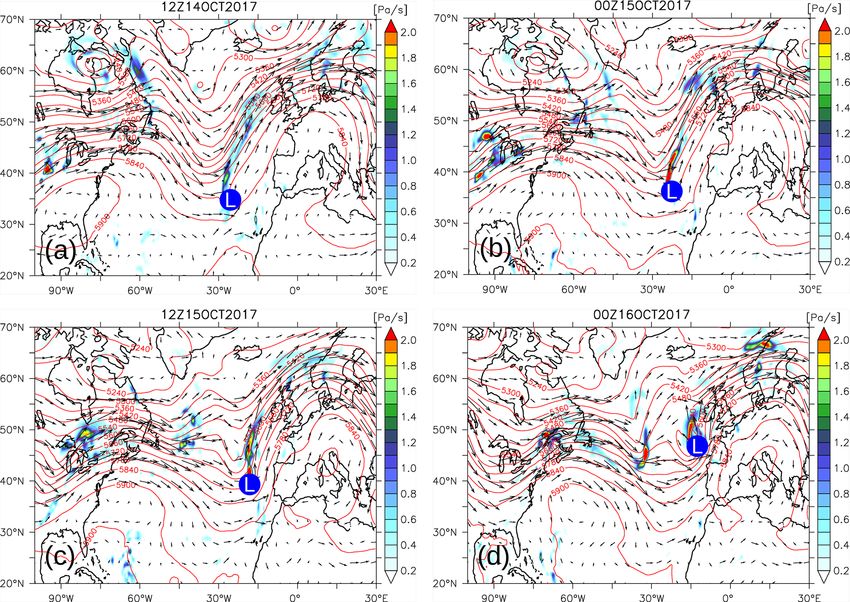
D. Akritidis et al.: CAMS forecast of Ophelia-induced aerosol pollution over Europe                         13563

Figure 2.

https://doi.org/10.5194/acp-20-13557-2020                                Atmos. Chem. Phys., 20, 13557–13578, 2020
13564                                   D. Akritidis et al.: CAMS forecast of Ophelia-induced aerosol pollution over Europe

Figure 2. IFS mslp (in hPa; black contours), negative of omega vertical velocity (−dp/dt) (in Pa/s, colour shaded), wind direction (black
vectors), dust with mass mixing ratio exceeding 80 µg/kg (orange shaded) and CO with volume mixing ratio exceeding 200 ppbv (grey
shaded) at 850 hPa during the period from 12:00 Z on 14 October 2017 to 00:00 Z on 18 October 2017 (12 h interval) (a, c, e, g, i, k, m, o).
Three-dimensional (longitude, latitude, pressure (hPa)) spatial distribution of IFS dust with mass mixing ratio exceeding 80 µg/kg (orange
shaded) and IFS carbon monoxide (CO) with volume mixing ratio exceeding 200 ppbv (grey shaded) during the same period (b, d, f, h, j, l,
n, p).

Atmos. Chem. Phys., 20, 13557–13578, 2020                                                 https://doi.org/10.5194/acp-20-13557-2020
D. Akritidis et al.: CAMS forecast of Ophelia-induced aerosol pollution over Europe                                                      13565

Figure 3. IFS temperature (in K; colour shaded), dust with mass mixing ratio exceeding 80 µg/kg (orange shaded) and CO with volume
mixing ratio exceeding 200 ppbv (grey shaded) at 850 hPa during the period from 00:00 Z on 16 October 2017 to 18:00 Z on 16 October
2017 (6 h interval) (a, c, e, g). Three-dimensional (longitude, latitude, pressure (hPa)) spatial distribution of IFS dust with mass mixing ratio
exceeding 80 µg/kg (orange shaded) and IFS CO with volume mixing ratio exceeding 200 ppbv (grey shaded) during the same period (b, d,
f, h).

https://doi.org/10.5194/acp-20-13557-2020                                                  Atmos. Chem. Phys., 20, 13557–13578, 2020
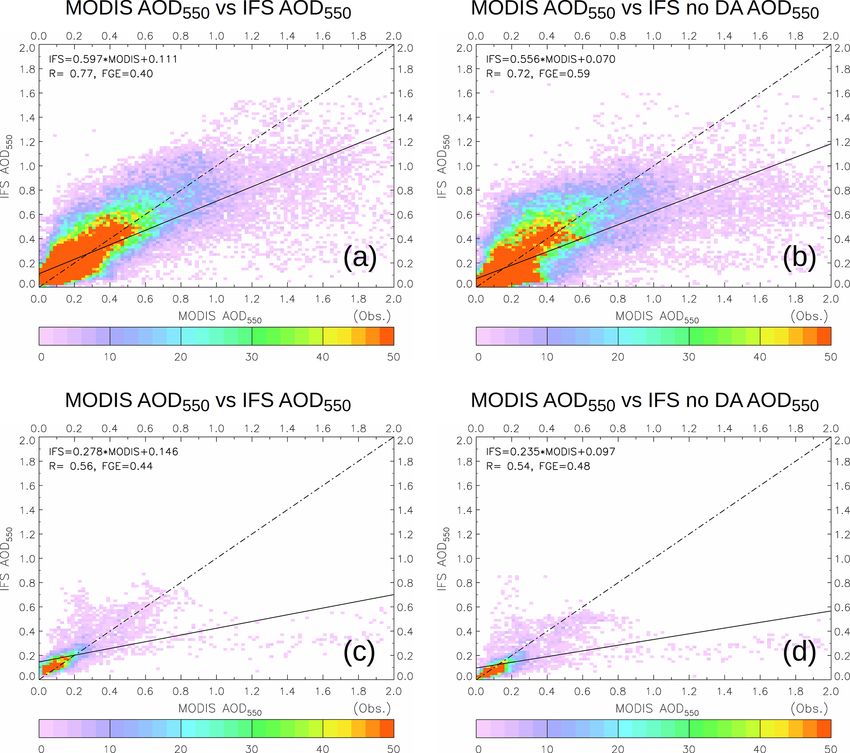
13566                                 D. Akritidis et al.: CAMS forecast of Ophelia-induced aerosol pollution over Europe

Figure 4. MODIS Terra and Aqua Collection 6.1 AOD550 during the period from 14 to 18 October 2017 (a, d, g, j, m). IFS AOD550 (b, e,
h, k, n) and differences between IFS and IFS no DA AOD550 (c, f, i, l, o) at 12:00 Z of the respective day.

trol simulation (no DA). For a more “event-based” evalua-           uct tends to overestimate for low observed AOD values and
tion of the CAMS global AOD forecast, the respective scat-          vice versa, which is a behaviour that was also observed in a
ter plots for a small domain in northwestern Europe where           previous version of the ECMWF global atmospheric compo-
the AOD plume is found are shown in Fig. 5c and d, indicat-         sition reanalysis dataset (MACC: Monitoring Atmospheric
ing less agreement with the satellite observations and a slight     Composition and Climate; see Georgoulias et al. (2018) for
improvement due to data assimilation implementation (cor-           details).
relation increase from 0.54 to 0.56, and FGE decreases from            To identify the dominant IFS aerosol types within the high
0.48 to 0.44). Overall, the CAMS global AOD forecast prod-          AOD plume, the modelled percentage (%) contribution of

Atmos. Chem. Phys., 20, 13557–13578, 2020                                            https://doi.org/10.5194/acp-20-13557-2020
D. Akritidis et al.: CAMS forecast of Ophelia-induced aerosol pollution over Europe                                                 13567

Figure 5. Comparison of spatially and temporally co-located IFS and MODIS Terra and Aqua Collection 6.1 AOD550 data for the whole
domain of Fig. 4, with IFS including data assimilation (a) and IFS without data assimilation (b), and the box region shown in Fig. 9d, with
IFS including data assimilation (c) and IFS without data assimilation (d). The examined dates are those shown in Fig. 4. The colour scale
corresponds to the number of IFS-MODIS co-location points that fall within 0.02 × 0.02 AOD550 bins. The solid line is the regression line
of the IFS-MODIS data, and the dashed-dotted line is the 1 : 1 line. Also shown are the slope and the intercept of the regression line, the
correlation coefficient (R) and the fractional gross error (FGE).

each aerosol type to the total AOD, as shown in Fig. 4, is              spectively (Fig. 6m and n). Such black carbon contributions
presented in Fig. 6 for the same period. At 12:00 Z on 14 Oc-           are considered high, being similar to climatological contri-
tober, the dominant source of the AOD loading found to the              butions over global fire hot spots (e.g. summertime central
west of the Iberian Peninsula is mineral dust by 60 %–70 %,             southern Africa; Penning de Vries et al., 2015). The elon-
while the dust contribution over the UK is up to 20 %, as de-           gated plume of high AOD values at 12:00 Z on 17 October
picted in Fig. 6a. A day later and as the AOD plume moves               as seen from both the satellite observations and the CAMS
to the north and east, dust continues to dominate with per-             global forecast (Fig. 4j and k) consists of up to ∼ 50 % of or-
centage contribution of up to 45 % over the UK (Fig. 6f). At            ganic matter aerosols (Fig. 6s), up to ∼ 25 % of black carbon
12:00 Z on 16 October, the dust AOD contribution over the               aerosols (Fig. 6r) and up to ∼ 20 % of dust aerosols (Fig. 6p),
UK ranges with a percentage between 20 % and 35 %, while                while over the Baltic states the major contributor is mineral
over the North Sea and the Netherlands it reaches values up             dust with ∼ 50 %. This is consistent with the transport path-
to 65 % (Fig. 6k). The biomass burning emission trails orig-            ways of dust and biomass burning aerosols shown in Fig. 2,
inating from the northwest Iberian Peninsula are also a sig-            indicating that fire-originated aerosols dominate over north-
nificant input for AOD, with black carbon and organic matter            ern coastal Europe, while dust aerosol remnants from Ophe-
aerosols contributing up to 20 % and 40 % over the UK, re-              lia’s warm-front passage prevail over the Baltic states. A sim-

https://doi.org/10.5194/acp-20-13557-2020                                              Atmos. Chem. Phys., 20, 13557–13578, 2020
13568                                      D. Akritidis et al.: CAMS forecast of Ophelia-induced aerosol pollution over Europe

Figure 6. Percentage contribution of dust (a, f, k, p, u), sea salt (b, g, l, q, v), black carbon (c, h, m, r, w), organic matter (d, i, n, s, x) and
sulfate (e, j, o, t, y) aerosols to the IFS total AOD550 values shown in Fig. 4.

ilar situation also occurs a day later as depicted in Fig. 6u, w             ing ratio from the four subtypes exceeded 1 µg/kg. Figure 7
and x. It is worth noting that during the examined period sea                presents the vertical cross sections of CALIOP/CALIPSO
salt aerosols are dominating over the Atlantic Ocean, follow-                aerosol subtypes and IFS dominant-aerosol type along the
ing the evolution of Storm Ophelia, as they are produced and                 two selected CALIPSO tracks. At 12:00 Z on 15 October,
transported due to the intense winds near Ophelia (Fig. 6b, g,               a distinct presence of dust and polluted dust aerosols is
l, q and v).                                                                 observed between 44 and 57◦ N, with polluted dust being
   To assess the performance of the CAMS global forecast in                  confined within the first ∼ 2 km. Moreover, polluted con-
representing the vertical distribution of aerosol types during               tinental/smoke aerosols are also detected over the UK (>
the passage of Ophelia, CALIPSO aerosol subtype satellite                    50◦ N) up to approximately 1 km. Further south and over
data were also utilized. Two CALIPSO tracks that crossed                     the Mediterranean Sea (36–43◦ N), sea salt and dusty marine
the aerosol plume during the examined period were selected                   aerosols are mostly dominating indicating dust crossing over
for 15 and 17 October 2017 with an overpass time around                      the Mediterranean, while further south of 36◦ N over north-
13:00 and 12:45 Z, respectively (tracks are shown on the top                 ern Africa, polluted dust is observed (Fig. 7a). The respec-
left of Fig. 7a and c). For the selected CALIPSO tracks,                     tive vertical cross section of the IFS dominant-aerosol type
spatially (horizontally and vertically) and temporally (at                   indicates the dominance of dust over the latitudinal bands
12:00 Z) co-located IFS aerosol mass mixing ratio data were                  of 40–55 and 30–35◦ N and of carbonaceous aerosols near
extracted. Subsequently, the dominant (in terms of mass mix-                 the surface between 43 and 55◦ N, while primarily carbona-
ing ratio) aerosol type was identified, namely sea salt, dust,               ceous aerosols and secondarily sea salt aerosols are identified
carbonaceous aerosols (organic matter and black carbon)                      over the Mediterranean Sea (Fig. 7b), being in a satisfactory
and sulfates, following Georgoulias et al. (2020). A domi-                   agreement with the CALIOP/CALIPSO observations. For
nant aerosol type was set only when the highest mass mix-                    the second selected CALIPSO track at 12:00 Z on 17 Octo-

Atmos. Chem. Phys., 20, 13557–13578, 2020                                                       https://doi.org/10.5194/acp-20-13557-2020
D. Akritidis et al.: CAMS forecast of Ophelia-induced aerosol pollution over Europe 13569
Figure 7. Vertical cross sections of CALIOP/CALIPSO aerosol subtypes and IFS dominant-aerosol type at 12:00 Z on 15 October 2017 (a,
b) and at 12:00 Z on 17 October 2017 (c, d). The embedded maps in (a) and (c) depict the respective CALIOP/CALIPSO tracks.
ber, dust and polluted dust are detected at 45–52◦ N and 30– tion; (c) the enhanced PM10 and PM2.5 concentrations over
35◦ N up to 3 km, with dust also observed in the upper tropo- Portugal in IFS due to assimilated fire emissions (GFAS:
sphere (∼ 10 km) over France, while elevated smoke is iden- Global Fire Assimilation System) are not seen in RegEns;
tified over the North Sea at ∼ 4 km (Fig. 7c). The latitudinal and (d) RegEns exhibits higher concentrations in both PM10
bands of IFS dust dominance is consistent with CALIPSO, as and PM2.5 over the Black Sea and the Baltic states com-
well as the fire-originated aerosols (carbonaceous aerosols) pared to IFS. The aforementioned inconsistencies are likely
which are found over the North Sea above 2 km (Fig. 7d). due to the different definition of PM10 and PM2.5 in IFS and
Yet, over the Mediterranean, carbonaceous aerosols prevail each CAMS regional air quality model, the different aerosol
in IFS, while marine and dusty marine aerosols prevail in schemes and horizontal resolution used in CAMS global and
CALIOP/CALIPSO. regional models, and the different assimilation approaches in
the CAMS regional air quality models relative to IFS.
3.3 Air quality To evaluate the CAMS forecast systems and the role of
data assimilation in reproducing the enhancements in surface
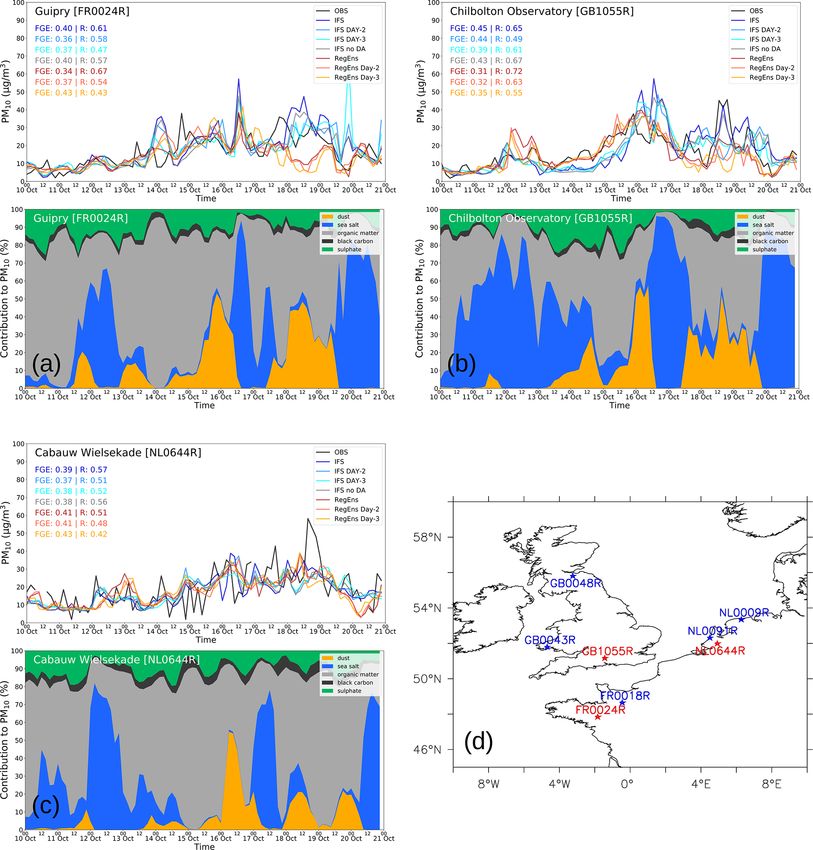
The implications of dust and biomass burning transport dur- PM10 and PM2.5 concentrations, we employ ground-based
ing Ophelia’s passage for European air quality are hereafter measurements from the EMEP network from eight rural sta-
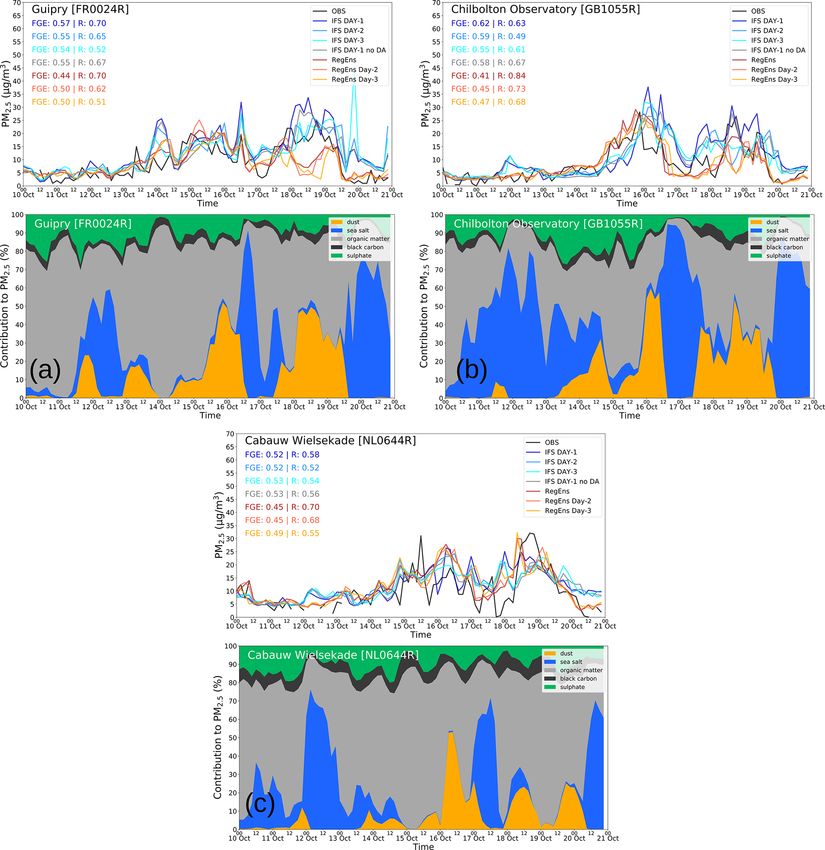
discussed. Figure 8 illustrates the CAMS global and regional tions (see Table 1 for further info and Fig. 9d for station
PM10 and PM2.5 surface concentrations over Europe for the locations) for intercomparison. For brevity, only the results
time period from 18:00 Z on 15 October 2017 to 06:00 Z from three EMEP stations are presented (Guipry FR0024R,
on 17 October 2017. Overall, the spatial patterns of particu- France; Chilbolton Observatory GB1055R, Great Britain;
late matter concentrations in the CAMS products agree well, and Cabauw Wielsekade NL0644R, the Netherlands), while
reproducing the plume of high aerosol loadings. Yet, there results for the rest of the stations are provided in the Sup-
are some differences between the global and regional fore- plement. Figure 9 presents the PM10 surface concentrations
casts, which are as follows: (a) RegEns exhibits lower con- from observations, IFS (day-1 to day-3 forecasts), IFS with-
centrations compared to IFS for both coarse and fine par- out data assimilation and RegEns (day-1 to day-3 forecasts),
ticulate matter; (b) IFS has higher concentrations near the along with the percentage (%) contribution of each aerosol
centre of Ophelia, probably due to higher sea salt contribu-
https://doi.org/10.5194/acp-20-13557-2020 Atmos. Chem. Phys., 20, 13557–13578, 202013570 D. Akritidis et al.: CAMS forecast of Ophelia-induced aerosol pollution over Europe Figure 8. PM10 surface concentrations (µg/m3 ) for IFS (a, e, i, m) and RegEns (b, f, j, n) for the period from 18:00 Z on 15 October 2017 to 06:00 Z on 17 October 2017; PM2.5 surface concentrations (µg/m3 ) for IFS (c, g, k, o) and RegEns (d, h, l, p) for the same period. type to IFS PM10 surface concentrations, during the time pe- due to dust and organic matter aerosols which are not seen riod from 10 October 2017 to 20 October 2017. At Guipry in RegEns or observations. Similar performance for CAMS (France), after 12:00 Z on 14 October and up to 16 Octo- forecast systems is obtained for PM2.5 over Guipry, except ber, an increase in PM10 surface concentrations is observed, that the peak on 18 October in IFS is also confirmed from ob- which is also seen in IFS and RegEns; however, the early servations but to a lesser extent (Fig. 10a). Further north and peak in observations is not captured by the CAMS forecast over Chilbolton Observatory (Great Britain), after 15:00 Z systems (Fig. 9a, top). The percentage contribution of each on 15 October, the observed PM10 surface concentrations IFS aerosol type to IFS PM10 concentrations indicates that increase up to 38 µg/m3 , with IFS peaking with a 6 h delay the enhancement in PM10 surface levels is initially (00:00 Z (Fig. 9b, top) mostly due to dust and organic matter aerosols on 15 October) due to organic matter aerosols (∼ 75 %), (Fig. 9b, bottom). The secondary peak seen in observations at probably related to transported smoke from fires burning over 12:00 Z on 16 October is synchronously captured by RegEns the Iberian Peninsula (visual inspection of MODIS Fires and and IFS, with IFS clearly overestimating it. A second wave of Thermal Anomalies product; source: NASA, 2020), while af- dust and biomass burning aerosols is affecting PM10 surface terwards (21:00 Z on 15 October) the transport of dust in- concentrations over the site at 15:00 Z on 18 October as re- duces a significant contribution from dust aerosols (∼ 53 %) vealed from IFS, which is in agreement with observations but as well (Fig. 9a, bottom). At 12:00 Z on 16 October a sharp not seen in RegEns. Regarding PM2.5 , there is a similar level peak is depicted in observed PM10 concentrations repro- of agreement with that of PM10 between the CAMS fore- duced from both IFS and RegEns (yet overestimated from cast systems and the observations (Fig. 10b). Finally, over IFS) which seems to result from sea salt transport from the Cabauw Wielsekade (the Netherlands), the observed PM10 west and south of Ophelia (see flow at 850 hPa in Fig. 2i). IFS surface concentrations exhibit a more noisy structure, with exhibits an increase in PM10 levels at 12:00 Z on 18 October CAMS forecast systems reproducing only the general pattern Atmos. Chem. Phys., 20, 13557–13578, 2020 https://doi.org/10.5194/acp-20-13557-2020
D. Akritidis et al.: CAMS forecast of Ophelia-induced aerosol pollution over Europe                                                13571

Figure 9. Observed (black), IFS (blue), IFS day-2 (light blue), IFS day-3 (aqua), IFS no DA (grey), RegEns (red), RegEns day-2 (light red)
and RegEns day-3 (orange) 3-hourly time series of PM10 surface concentrations (µg/m3 ) (top) and percentage (%) contribution of aerosol
type to IFS PM10 surface concentrations (bottom) for Guipry (FR0024R), France (a); Chilbolton Observatory (GB1055R), Great Britain
(b); and Cabauw Wielsekade (NL0644R), the Netherlands (c). The locations of the presented EMEP stations in the article (red) and the
Supplement (blue) are also shown (d).

of variability, missing the observed peaks at 15:00 Z on 17            depicted from the scatter plot in Fig. 11a, the correlation co-
and 18 October (Fig. 9c). Similarly for PM2.5 , where the ob-          efficient of RegEns with observations is higher compared to
served peaks are more clear, IFS and RegEns capture the big            that of IFS with observations (red points mostly lie above the
picture of PM2.5 increases (Fig. 10c). Results for the remain-         dashed line of Fig. 11a), while the FGE values for RegEns
ing five EMEP stations are provided in Figs. S2 and S3 in the          are lower with respect to that of IFS (red points lie below the
Supplement. Overall, RegEns exhibits a better performance              dashed line of Fig. 11b). Concerning the impact of data as-
in terms of temporal variability and bias compared to IFS. As          similation on IFS forecast of near-surface particulate matter,

https://doi.org/10.5194/acp-20-13557-2020                                             Atmos. Chem. Phys., 20, 13557–13578, 2020
13572                                   D. Akritidis et al.: CAMS forecast of Ophelia-induced aerosol pollution over Europe

Figure 10. Observed (black), IFS (blue), IFS day-2 (light blue), IFS day-3 (aqua), IFS no DA (grey), RegEns (red), RegEns day-2 (light red)
and RegEns day-3 (orange) 3-hourly time series of PM2.5 surface concentrations (µg/m3 ) (top) and percentage (%) contribution of aerosol
type to IFS PM2.5 surface concentrations (bottom) for Guipry (FR0024R), France (a); Chilbolton Observatory (GB1055R), Great Britain
(b); and Cabauw Wielsekade (NL0644R), the Netherlands (c).

as it is depicted in Fig. 11, there is no clear improvement in          in observed PM10 surface concentrations exhibiting similar
bias nor in the representation of the temporal variability. It          FGE values but lower correlation scores (in most of the sta-
is likely that the assimilation of total-column AOD does not            tions) compared to day-1 forecast (Fig. 11c and d). The same
have a strong impact on surface-layer concentrations, espe-             applies in the case of PM2.5 (Fig. 10), except that the corre-
cially in regions with significant surface fluxes.                      lation scores for IFS day-2 and day-3 forecasts are not sys-
   The capability of IFS and RegEns systems to forecast the             tematically lower than that of the day-1 forecast (Fig. 11c
observed PM10 and PM2.5 surface concentrations 2 and 3 d                and d). For RegEns, although it predicts the observed peaks
in advance is finally discussed. As depicted in Fig. 9, IFS             in PM10 and PM2.5 fairly well up to 3 d in advance (Fig. 9
day-2 and day-3 forecasts reproduce the distinct increases              and 10), there is a systematic deterioration of its performance

Atmos. Chem. Phys., 20, 13557–13578, 2020                                                https://doi.org/10.5194/acp-20-13557-2020
D. Akritidis et al.: CAMS forecast of Ophelia-induced aerosol pollution over Europe                                           13573

                                                                       atmospheric composition and air quality. To this end, CAMS
                                                                       forecast data were used along with satellite and ground-based
                                                                       observations. The most notable findings of this work can be
                                                                       summarized as follows:

                                                                         – African dust aerosols were transported towards north-
                                                                           western Europe on the east side of Storm Ophelia,
                                                                           forming an extended dust plume reaching the Baltic
                                                                           states. On its passage, Ophelia lifted and drifted smoke
                                                                           aerosols from fires burning over the Iberian Penin-
                                                                           sula, carrying them over several European areas such
                                                                           as France, Great Britain and the Netherlands. After
                                                                           00:00 Z on 16 October, dust/smoke aerosols are found
                                                                           on the warm/cold fronts of Ophelia, being transported
                                                                           within its warm sector.

                                                                         – The dependent evaluation against MODIS satellite ob-
                                                                           servations reveals a satisfactory agreement with the
                                                                           CAMS global AOD550 (R = 0.77 and FGE = 0.4),
                                                                           while the comparison against the IFS-no-DA simula-
                                                                           tion indicates an improvement of IFS performance in
                                                                           forecasting AOD550 (R increases from 0.72 to 0.77, and
                                                                           FGE decreases from 0.59 to 0.4), due to the application
                                                                           of data assimilation.

                                                                         – The speciation of IFS AOD550 fields indicates that
                                                                           African dust, organic matter from Iberian biomass burn-
Figure 11. (a) Comparison between the correlation coefficients             ing and sea salt sprayed in the vicinity of Ophelia are
IFS vs. OBS (observations) (RIFS ) and IFS no DA vs. OBS                   the major aerosol contributors to the plume of high
(RIFS NO DA ) (grey symbols), as well as between IFS vs. OBS
                                                                           AOD550 .
(RIFS ) and RegEns vs. OBS (RRegEns ) (red symbols) for PM10 (cir-
cles) and PM2.5 (squares). (b) Same as (a) but for FGE. (c) Com-
                                                                         – The CALIOP/CALIPSO and the spatially and tempo-
parison between the correlation coefficients IFS vs. OBS (RIFS ) and
IFS DAY-2 vs. OBS (RIFS DAY-2 ) (light blue symbols), as well as           rally co-located IFS cross sections of dominant aerosol
between IFS vs. OBS (RIFS ) and IFS DAY-3 vs. OBS (RIFS DAY-3 )            types reveal a good qualitative performance of IFS, as
(aqua symbols) for PM10 (circles) and PM2.5 (squares). (d) Same            it generally manages to reproduce the type and location
as (c) but for FGE. (e) Comparison between the correlation coef-           of aerosols during the passage of Ophelia.
ficients RegEns vs. OBS (RRegEns ) and RegEns DAY-2 vs. OBS
(RRegEns DAY-2 ) (light red symbols), as well as between RegEns vs.      – In terms of air quality, comparison with ground-based
OBS (RRegEns ) and RegEns DAY-3 vs. OBS (RRegEns DAY-3 ) (or-              measurements from EMEP stations reveals that both
ange symbols) for PM10 (circles) and PM2.5 (squares). (f) Same as          IFS and RegEns are able to reproduce the observed
(e) but for FGE. The results for PM10 (PM2.5 ) are obtained from           signal of increase in PM10 and PM2.5 surface concen-
the eight (five) EMEP stations described in Table 1.                       trations yet exhibiting several inconsistencies on the
                                                                           quantitative and temporal representation of the observed
                                                                           peaks.
in terms of temporal variability over forecast time. More
specifically, the correlation coefficient decreases from day-1           – For the examined event, the CAMS regional system
to day-2 forecast and from day-2 to day-3 forecast for almost              seems to better predict the 3 h PM10 and PM2.5 surface
all examined stations (Fig. 11e).                                          concentrations compared to the CAMS global system,
                                                                           with an increase (decrease) of the correlation coefficient
                                                                           (FGE) values in all examined stations for PM10 (except
4   Conclusions                                                            Cabauw Wielsekade) and PM2.5 , respectively.

The main objectives of this work were to analyse a com-                  – In regards to the role of data assimilation, even though
plex case study of aerosol transport over Europe driven by                 it improves the CAMS global forecast performance for
Storm Ophelia in mid-October 2017 in CAMS forecast sys-                    AOD, there is no such indication for particulate matter
tems and to assess their performance with respect to aerosol               near the surface.

https://doi.org/10.5194/acp-20-13557-2020                                            Atmos. Chem. Phys., 20, 13557–13578, 2020
13574 D. Akritidis et al.: CAMS forecast of Ophelia-induced aerosol pollution over Europe
– A deterioration of the RegEns forecast performance is Acknowledgements. This work is performed within the framework
found over forecast time for both PM10 and PM2.5 , char- of the service element “CAMS84: Global and regional a posteriori
acterized by a decrease in the correlation coefficient for evaluation and quality assurance” of the Copernicus Atmosphere
the vast majority of the examined stations, which is par- Monitoring Service (CAMS). ECMWF is the operator of CAMS
tially seen in IFS for the case of PM10 . on behalf of the European Union. The CAMS84 work is financially
supported by ECMWF via its main contractor, Royal Netherlands
To summarize, the current analysis and evaluation study Meteorological Institute (KNMI). NASA Goddard Space Flight
highlights that the CAMS global forecast system is able to Center (GSFC) Level-1 and Atmosphere Archive and Distribution
forecast the observed aerosol loadings over Europe induced System (LAADS) (LAADS, 2020) is acknowledged for making
by the transport of dust, biomass burning and sea salt aerosols available the level-2 MODIS Terra and Aqua Collection 6.1 aerosol
datasets. In addition, the Atmospheric Science Data Center (ASDC)
by the passage of Storm Ophelia in mid-October 2017. Fore-
at NASA Langley Research Center (LaRC) is acknowledged for the
casting coarse and fine particulate matter surface concentra-
data processing and distribution of the CALIPSO data used here
tions during Ophelia turns out to be more challenging, yet the (EARTHDATA, 2020). Also acknowledged is the European Moni-
CAMS global and regional systems exhibit a reasonable per- toring and Evaluation Programme (EMEP) (EMEP, 2020) for dis-
formance, which are clearly open to further improvement and tributing the near-surface PM10 and PM2.5 concentration data. We
development in the direction of supporting social, economic acknowledge the use of imagery from the NASA Worldview appli-
and health policies. cation (NASA, 2020), which is part of the NASA Earth Observing
System Data and Information System (EOSDIS). AUTH (Aristotle
University of Thessaloniki) authors acknowledge the support of the
Data availability. CAMS global (IFS) forecast: the data can be scientific computing services of the AUTH IT Center (AUTHIT,
obtained from ECMWF’s web repository https://apps.ecmwf.int/ 2020). Finally, Dimitris Akritidis would like to acknowledge the
datasets/data/cams-nrealtime/levtype=sfc/ (ECMWF, 2020b) and free use of Python (Python, 2020) and Ferret (Ferret, 2020) soft-
through the corresponding WebAPI. CAMS global (IFS) forecast ware for the analysis and graphics of the paper.
without data assimilation: the data can be requested from the
Copernicus user support (copernicus-support@ecmwf.int). CAMS
regional forecast: the data are available from Dimitris Akritidis Financial support. This research has been supported by the Royal
upon request (dakritid@geo.auth.gr). EMEP observations: the data Netherlands Meteorological Institute (KNMI).
are available from the EBAS database http://ebas.nilu.no (EBAS,
2020). Level-2 MODIS Terra and Aqua Collection 6.1: the data
are publicly available through NASA’s Goddard Space Flight Cen- Review statement. This paper was edited by Stelios Kazadzis and
ter (GSFC) Level-1 and Atmosphere Archive and Distribution Sys- reviewed by three anonymous referees.
tem (LAADS; https://ladsweb.modaps.eosdis.nasa.gov/, LAADS,
2020). Level-2 CALIPSO 5 km profile product version 4.20: the
data are publicly available from NASA’s Langley Research Center
Atmospheric Science Data Center via https://search.earthdata.nasa. References
gov/search (EARTHDATA, 2020).
Akritidis, D., Katragkou, E., Zanis, P., Pytharoulis, I., Melas, D.,
Flemming, J., Inness, A., Clark, H., Plu, M., and Eskes, H.: A
deep stratosphere-to-troposphere ozone transport event over Eu-
Supplement. The supplement related to this article is available on-
rope simulated in CAMS global and regional forecast systems:
line at: https://doi.org/10.5194/acp-20-13557-2020-supplement.
analysis and evaluation, Atmos. Chem. Phys., 18, 15515–15534,
https://doi.org/10.5194/acp-18-15515-2018, 2018.
Albrecht, B. A.: Aerosols, Cloud Microphysics, and
Author contributions. DA designed the study, performed the analy- Fractional Cloudiness, Science, 245, 1227–1230,
sis and wrote the paper. AKG provided the MODIS Terra and Aqua https://doi.org/10.1126/science.245.4923.1227, 1989.
satellite data, and the CALIOP/CALIPSO satellite data and con- Amiridis, V., Balis, D. S., Giannakaki, E., Stohl, A., Kazadzis, S.,
tributed to the analysis and writing of the paper. All authors con- Koukouli, M. E., and Zanis, P.: Optical characteristics of biomass
tributed to reviewing and editing of the article and interpretation burning aerosols over Southeastern Europe determined from UV-
of the results. JF provided the IFS control simulation without the Raman lidar measurements, Atmos. Chem. Phys., 9, 2431–2440,
use of data assimilation. HE is coordinating CAMS84 (global and https://doi.org/10.5194/acp-9-2431-2009, 2009.
regional a posteriori evaluation and quality assurance). EK is the Ansmann, A., Bösenberg, J., Chaikovsky, A., Comerón, A., Eck-
principal investigator and coordinates the contribution of Aristotle hardt, S., Eixmann, R., Freudenthaler, V., Ginoux, P., Komguem,
University of Thessaloniki in CAMS84. P., Linné, H., Ángel López Márquez, M., Matthias, V., Mat-
tis, I., Mitev, V., Müller, D., Music, S., Nickovic, S., Pelon, J.,
Sauvage, L., Sobolewsky, P., Srivastava, M. K., Stohl, A., Torres,
Competing interests. The authors declare that they have no conflict O., Vaughan, G., Wandinger, U., and Wiegner, M.: Long-range
of interest. transport of Saharan dust to northern Europe: the 11–16 October
2001 outbreak with EARLINET, J. Geophys. Res., 108, 4783,
https://doi.org/10.1029/2003JD003757, 2003.
Atmos. Chem. Phys., 20, 13557–13578, 2020 https://doi.org/10.5194/acp-20-13557-2020You can also read