Snowpack dynamics in the Lebanese mountains from quasi-dynamically downscaled ERA5 reanalysis updated by assimilating remotely sensed fractional ...
←
→
Page content transcription
If your browser does not render page correctly, please read the page content below
Hydrol. Earth Syst. Sci., 25, 4455–4471, 2021
https://doi.org/10.5194/hess-25-4455-2021
© Author(s) 2021. This work is distributed under
the Creative Commons Attribution 4.0 License.

Snowpack dynamics in the Lebanese mountains from
quasi-dynamically downscaled ERA5 reanalysis updated by
assimilating remotely sensed fractional snow-covered area
Esteban Alonso-González1 , Ethan Gutmann2 , Kristoffer Aalstad3 , Abbas Fayad4 , Marine Bouchet5 , and
Simon Gascoin5
1 InstitutoPirenaico de Ecología, Spanish Research Council (IPE-CSIC), Zaragoza, Spain
2 Research  Application Laboratory, National Center for Atmospheric Research (RAL-NCAR), Boulder, CO, USA
3 Department of Geosciences, University of Oslo, Oslo, Norway
4 Centre for Hydrology, University of Saskatchewan, Saskatoon, Saskatchewan, Canada
5 Centre d’Etudes Spatiales de la Biosphère (CESBIO), UPS/CNRS/IRD/INRA/CNES, Toulouse, France

Correspondence: Esteban Alonso-González (e.alonso@ipe.csic.es)

Received: 1 July 2020 – Discussion started: 8 July 2020
Revised: 5 March 2021 – Accepted: 17 June 2021 – Published: 19 August 2021

Abstract. The snowpack over the Mediterranean mountains       with in situ observations from automatic weather stations
constitutes a key water resource for the downstream pop-      (AWSs). The results highlight the high temporal variability
ulations. However, its dynamics have not been studied in      in the snowpack in the Lebanese mountain ranges, with the
detail yet in many areas, mostly because of the scarcity of   differences between Mount Lebanon and the Anti-Lebanon
snowpack observations. In this work, we present a charac-     Mountains that cannot only be explained by hypsography as
terization of the snowpack over the two mountain ranges       the Anti-Lebanon Mountains are in the rain shadow of Mount
of Lebanon. To obtain the necessary snowpack information,     Lebanon. The maximum fresh water stored in the snowpack
we have developed a 1 km regional-scale snow reanalysis       is in the middle elevations, approximately between 2200 and
(ICAR_assim) covering the period 2010–2017. ICAR_assim        2500 m a.s.l. (above sea level). Thus, the resilience to further
was developed by means of an ensemble-based data assim-       warming is low for the snow water resources of Lebanon due
ilation of Moderate Resolution Imaging Spectroradiometer      to the proximity of the snowpack to the zero isotherm.
(MODIS) fractional snow-covered area (fSCA) through an
energy and mass snow balance model, the Flexible Snow
Model (FSM2), using the particle batch smoother (PBS). The
meteorological forcing data were obtained by a regional at-   1   Introduction
mospheric simulation from the Intermediate Complexity At-
mospheric Research model (ICAR) nested inside a coarser       The hydrological processes related to mountain areas are es-
regional simulation from the Weather Research and Fore-       sential for the water supplies for a large part of humanity
casting model (WRF). The boundary and initial conditions      (Viviroli et al., 2007). Despite the relatively mild temper-
of WRF were provided by the ERA5 atmospheric reanaly-         ature of the Mediterranean climates, mountains there often
sis. ICAR_assim showed very good agreement with MODIS         exhibit deep and long-lasting snowpacks accumulating more
gap-filled snow products, with a spatial correlation of R =   than 3 m and an average snow season of 5 months at the
0.98 in the snow probability (P (snow)) and a temporal cor-   summit areas (Alonso-González et al., 2020b; Fayad et al.,
relation of R = 0.88 on the day of peak snow water equiv-     2017b). Thus, as most of the annual precipitations falls dur-
alent (SWE). Similarly, ICAR_assim has shown a correla-       ing the winter season (García-Ruiz et al., 2011) the moun-
tion with the seasonal mean SWE of R = 0.75 compared          tain snowpack strongly reshapes the hydrographs to sustain
                                                              high flows until the end of the spring, permitting better syn-

Published by Copernicus Publications on behalf of the European Geosciences Union.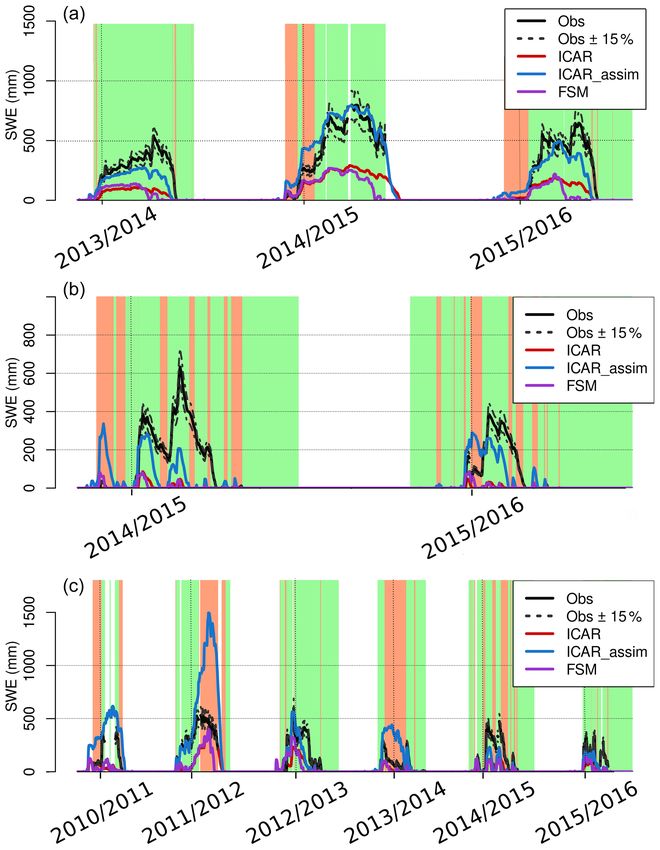
4456                                            E. Alonso-González et al.: Snowpack dynamics in the Lebanese mountains

chronization of water demand and availability during the dry      Liston and Elder, 2006). In this way, energy and mass bal-
season (García-Ruiz et al., 2011). Mediterranean snowpacks        ance snowpack models have been coupled with atmospheric
are characterized by a high interannual variability, which        models to develop multidecadal snow simulations (Alonso-
affects the amount and seasonality of river flows (López-         González et al., 2018, and van Pelt et al., 2016, among oth-
Moreno and García-Ruiz, 2004). Despite this variability, the      ers). In addition, remote sensing products have been widely
thickness and high density exhibited by the snowpack in the       used to study the duration of and variability in the snow cover
Mediterranean climate (Fayad et al., 2017b) makes them an         (Gascoin et al., 2015; Saavedra et al., 2017; Yilmaz et al.,
effective water storage system. In addition, high sublimation     2019). Assimilation of remotely sensed snow cover observa-
rates are associated with Mediterranean snowpacks (Fayad          tions has shown considerable potential for improving numer-
and Gascoin, 2020; Herrero et al., 2016; Schulz and de Jong,      ical snowpack models outputs in both distributed (e.g., Baba
2004). The fact that snowpack conditions are close to isother-    et al., 2018a; Margulis et al., 2016) and semi-distributed sim-
mal during most of the snow season makes them highly sen-         ulations (Cluzet et al., 2021; Fiddes et al., 2019). These ap-
sitive to the current climate warming (Alonso-González et         proaches are particularly promising in data-scarce regions to
al., 2020a; López-Moreno et al., 2017; Yilmaz et al., 2019).      reduce the biases in atmospheric forcing.
   The Lebanese mountains are a clear example of Mediter-            In this work, we have simulated the snowpack of the
ranean mountains where snow exerts a key control on the           Lebanese mountains, as an alternative to sparse snowpack
hydrology, and water resources are critically dependent on        observations. We have generated a 1 km resolution snowpack
the interannual fluctuations of the snowpack (El-Fadel et al.,    reanalysis, using an ensemble-based assimilation of a frac-
2000). Despite their importance, snow observations in the         tional snow-covered area (fSCA) obtained from the Moder-
region are scarce (Fayad et al., 2017a), making the study         ate Resolution Imaging Spectroradiometer (MODIS) satel-
of distributed snow dynamics challenging. Recently, Fayad         lite sensor. More specifically, the ERA5 reanalysis (Hers-
and Gascoin (2020) developed distributed snowpack simula-         bach, 2020) was dynamically downscaled using regional at-
tions over key areas of Mount Lebanon, forcing the model          mospheric models in two steps. First, a 10 km resolution at-
by interpolating observations of the few existing automatic       mospheric simulation, using the Weather Research and Fore-
weather stations (AWSs) using the SnowModel by Liston and         cast model (WRF; Skamarock et al., 2008a), was performed
Elder (2006). They showed the importance of the liquid wa-        covering the period between 2010 and 2017. Then, a finer
ter percolation scheme given the isothermal condition of the      1 km simulation, using the Intermediate Complexity Atmo-
snowpack and estimated the snow water equivalent over three       spheric Research model (ICAR; Gutmann et al., 2016a),
key catchments in the windward western divide of Mount            was nested inside the previous WRF simulation covering the
Lebanon. However, due to the lack of meteorological data          same time period. To improve the ICAR snowpack outputs,
outside this area, these simulations did not cover the whole      the simulated meteorological data were used to force an en-
mountain area of the country and were limited to three snow       ergy and mass balance snowpack model, the Flexible Snow
seasons.                                                          Model (FSM2; Essery, 2015a), while perturbing the meteo-
   Remote sensing and numerical modeling have become re-          rological fields to generate an ensemble of snowpack sim-
liable tools to generate useful meteorological information for    ulations. Then, the particle batch smoother (PBS; Margulis
mountain regions (Lundquist et al., 2019) and also to gen-        et al., 2015), a Bayesian data assimilation scheme, was ap-
erate robust snow data worldwide. Atmospheric reanalyses          plied to assimilate daily remotely sensed fSCA information.
are a valuable source of long-term (multidecadal) climato-        We tested the generated snow products in the mountains of
logical information, especially at planetary scales (e.g., Weg-   Lebanon with independent observations. Finally, the dynam-
mann et al., 2017; Wu et al., 2018). However, spatially down-     ics of the snowpack in the mountains of Lebanon are studied
scaling such products is mandatory to derive relevant snow        from the generated multi-year snow time series. The objec-
information over complex terrain (Baba et al., 2018b, and         tives of this paper are (i) to explore the potential of a method-
Mernild et al., 2017, among others). Dynamical downscaling        ology to develop a snowpack reanalysis over data-scarce re-
has been shown to outperform statistically gridded products       gions and (ii) to describe the main snowpack dynamics over
for meteorological variables in complex terrain (Gutmann et       the Lebanese mountains. This is the first use of ICAR for
al., 2012b). More specifically, high-resolution fully dynam-      generating a snow reanalysis.
ical meteorological models can reproduce the snowfall pat-
terns over complex terrain (Ikeda et al., 2010; Rasmussen
et al., 2011). However, the computational cost of full dy-        2   Study area
namical downscaling solutions becomes prohibitive for large
domains at high spatial resolutions. To reduce the compu-         Lebanon is a country located on the eastern Mediterranean
tational cost, different solutions of varying complexity have     Sea between 33◦ and 35◦ N. Its climatology is typically
been developed using statistical interpolations corrected with    Mediterranean (Peel et al., 2007) and is influenced mainly
the topography or using simplifications of the atmospheric        by its proximity to the Mediterranean Sea and its complex to-
dynamics (Fiddes and Gruber, 2014; Gutmann et al., 2016a;         pography (Fig. 1). There are two main mountain ranges that

Hydrol. Earth Syst. Sci., 25, 4455–4471, 2021                                      https://doi.org/10.5194/hess-25-4455-2021
E. Alonso-González et al.: Snowpack dynamics in the Lebanese mountains 4457
run in parallel to the Mediterranean coast from north to south. conditions of the WRF (version 3.8) model. The ERA5 data
These mountain ranges are Mount Lebanon and the Anti- set is an atmospheric reanalysis, which replaces the widely
Lebanon Mountains, reaching 3088 m a.s.l. (above sea level; used ERA-Interim reanalysis (Dee et al., 2011). It has a spa-
Qurnat as Sawdā peak) and 2814 m a.s.l. (Mount Hermon tial resolution of 30 km, with 138 vertical levels and the top
peak), respectively. The Lebanese mountains are highly kars- at 80 km. It has been shown to outperform ERA-Interim in
tified, encouraging the infiltration of rainfall and snowmelt. many climatological applications and as a forcing data set
The land cover is mostly composed of bare rocks and soils for different modeling applications (Albergel et al., 2018;
with irregularly distributed patches of shrubland, as well as Tarek et al., 2020, and Wang et al., 2019, among others).
oaks and pine forest. The parameterization schemes used in the WRF simulation
Despite Lebanon having more available water resources include the Thompson cloud microphysics scheme (Thomp-
than its neighboring countries, it is considered a water-scarce son et al., 2008), the NCAR Community Atmosphere Model
region (El-Fadel et al., 2000) where droughts are frequent (CAM) scheme for both shortwave and longwave radiations
and are expected to increase due to climate change (Farajalla (Neale et al., 2004), the Noah-MP scheme for the land sur-
et al., 2010). The particular spatial distribution of its moun- face physics (Niu et al., 2011), the Mellor–Yamada–Janjic
tain ranges constitutes an effective topographical barrier to scheme for the planetary boundary layer (Janjic, 2002) and
humidity advected from the Mediterranean Sea, enhancing the Betts–Miller–Janjic scheme (Betts and Miller, 1986; Jan-
the winter precipitation as a consequence of orographic ef- jic, 1994) for deep and shallow convection. This WRF con-
fects (Jomaa et al., 2019). In these mountain ranges, the com- figuration has shown its consistency in previous studies sim-
bined effects of the orography and Mediterranean climate ulating the seasonal snowpack over complex terrain (Ikeda
result in yearly seasonal snowpack over a large part of the et al., 2010; Rasmussen et al., 2011). In addition to the de-
country (Mhawej et al., 2014). scribed parameterization, we applied the spectral nudging
It was estimated from satellite retrievals of snow cover that technique to satisfy the large-scale atmospheric conditions
31 % of the spring discharge of Lebanon is associated with at the higher altitudes, while allowing the model to have
snowmelt (Telesca et al., 2014). In addition, the groundwater its own dynamics inside the planetary boundary layer (Von
dynamics of Lebanon are mainly controlled by the snowmelt Storch et al., 2000; Waldron et al., 1996). The spectral nudg-
as consequence of its karstic nature (Bakalowicz et al., 2008; ing technique was applied for the wind vectors, temperature
El-Fadel et al., 2000). Thus, the water resource provided by and geopotential, with a wave number of one in each di-
the snowpack is crucial for the Lebanese society, with this rection, based on the parameters recommended by Gómez
need becoming more acute during the recent drought in the and Miguez-Macho (2017), and nudging the waves above
eastern Mediterranean (Cook et al., 2016). In addition, the ∼ 1000 km wavelength.
water stress increased notably in recent years partially due Next, the ICAR model was used to obtain a finer
to the increase in domestic water demand, agricultural water 1 km × 1 km spatial grid atmospheric simulation nested in
use and the Syrian refugee crisis (Jaafar et al., 2020) but also the aforementioned WRF simulation domain. This enabled
due to the poor management of the water resources and water us to significantly reduce the high computational cost com-
pollution. pared to a long-term high-resolution WRF simulation. ICAR
is a 4D meso-atmospheric model designed for downscaling
purposes and is based on the linear mountain wave theory.
3 Data and methods The linear theory allows ICAR to compute the main dynam-
ical effect of topography on the atmosphere using an ana-
3.1 Regional atmospheric simulations configuration lytical solution, thus avoiding the need to solve the Navier–
Stokes equations and reducing the computational cost by a
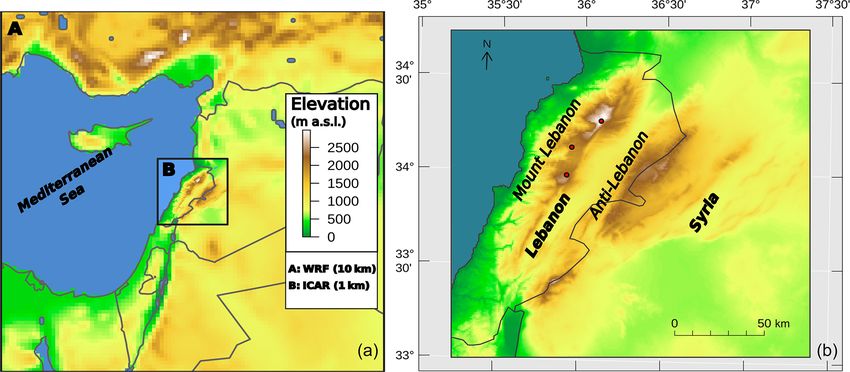
To generate the meteorological forcing, we used the ICAR factor of 100. The center of the ICAR simulation was estab-
atmospheric model nested inside a WRF simulation forced lished in the center of the WRF simulation, using 179 × 179
by the ERA5 reanalysis. The WRF model was used to gener- grid cells in both latitude and longitude directions and pre-
ate a regional atmospheric simulation on a 10 km × 10 km venting the boundaries from intersecting complex terrain.
grid, covering the eastern part of the Mediterranean Sea, The model top was situated at 4150 m above the topogra-
with 179 × 179 grid cells centered over Lebanon’s mountains phy with 12 vertical levels, using the default model level
(Fig. 1). In the vertical dimension, the domain was composed heights (Horak et al., 2019). The model configuration used
of 35 levels, with the top set to 50 hPa, similar to other studies the Thompson cloud microphysics scheme (Thompson et
over Mediterranean regions (Arasa et al., 2016). The simula- al., 2008), the Noah land surface model (Chen and Dud-
tion covers the period from 1 January 2010 to 30 June 2017, hia, 2001) and the multidimensional positive definite advec-
using the first 9 months as spin-up period allowing for phys- tion transport algorithm (MPDATA) for the advection (Smo-
ical equilibrium between the external forcings and the land larkiewicz and Margolin, 1998). Convection schemes were
model (Montavez et al., 2017). We used the ERA5 reanalysis not implemented for this simulation, and the radiative fluxes
data set at an hourly frequency as the boundary and initial at the surface were prescribed by WRF. The lack of convec-
https://doi.org/10.5194/hess-25-4455-2021 Hydrol. Earth Syst. Sci., 25, 4455–4471, 2021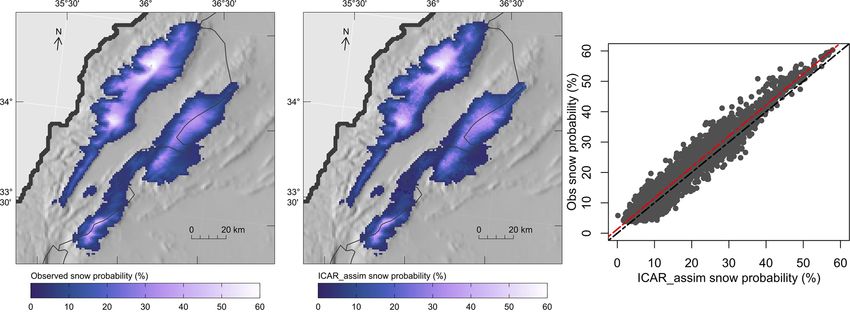
4458                                              E. Alonso-González et al.: Snowpack dynamics in the Lebanese mountains

Figure 1. Atmospheric models domain configuration (a) and a localization map of Lebanon (b). The red dots represent the automatic weather
station (AWS) positions.

tion could have some impact on the total amount of precip-             over Lebanon for every day during the same period. Theia
itation and, therefore, on the seasonal snowpack. However,             binary snow maps were resampled to 500 m fSCA in the
such deviations in the total amount of precipitation are partly        same grid as the MODIS products by averaging the con-
compensated by the PBS (as described in Sect. 3.3.2).                  tributing pixels. By comparing these fSCA Theia maps with
                                                                       the MOD10A1 products, we could find 5.84 × 10⁴ cloud-
3.2     Ensemble-based fractional snow cover assimilation              free pixels which corresponded to MOD10A1 snow-covered
                                                                       pixels on the same date. A subset of 40 % of the NDSI
3.2.1    MODIS fractional snow cover area data                         fSCA were used to fit the linear function using the least
         estimation                                                    squares method. The optimized function was tested against
                                                                       the remaining data and yielded an fSCA RMSE of 11 %
For this study, we used satellite observations of fSCA, as-            and a mean absolute error of 5.7 %. The same analysis was
similated in an ensemble of snow simulations, to improve the           done with MYD10A1 (Aqua) products, but we opted not to
snow water equivalent products (SWE) of ICAR. The daily                use them in the remainder of the analysis because they ex-
fSCA information was obtained by means of the MODIS                    hibited a lower agreement with the Theia Sentinel-2 snow
sensor, which is orbiting the Earth on board two satellites,           cover products (RMSE of 21 %). The lower agreement of
Terra and Aqua. We have chosen MODIS because of its daily              MYD10A1 is likely due to degraded sensors (Wang et al.,
revisit time combined with a spatial resolution of 500 m,              2012) but may also be related to the difference between the
which is higher than our ICAR simulation. More specifically,           overpass time of Sentinel-2 (10:30 local time – LT) and Aqua
we have used the normalized difference snow index (NDSI)               (13:30 LT), while Terra shares the same overpass time as
retrievals of collection 6 of the NASA snow-cover products             Sentinel-2.
MOD10A1 (Terra) (Hall et al., 2006) and MYD10A1 (Aqua)                    We reprojected the generated MODIS fSCA products to
(Hall and Riggs, 2016) distributed by the National Snow and            the spheroid datum (6370 km Earth radius) Lambert confor-
Ice Data Center. To estimate the fSCA from the MODIS                   mal projection used in the ICAR simulation. To avoid arti-
NDSI we have used a linear function following Salomon-                 facts as a consequence of the data gaps in MODIS imagery
son and Appel (2004). The coefficients of the function were            caused by the cloud cover, we performed the aggregation
optimized using a series of 20 m resolution snow products              when the majority of the MODIS cells used to calculate each
from Theia Snow collection (Gascoin et al., 2019). The Theia           new resampled cell was cloud free (less than 25 % cloud
Snow collection provides snow cover area maps derived from             cover); otherwise, the cell was considered empty or missing
Sentinel-2 observations. The revisit period of Sentinel-2 is, at       for the scene in question. In previous studies, the MODIS
most, 5 d since the launch of Sentinel-2B (i.e., after March           fSCA products have shown to have a good performance in
2017). It can be shorter in areas where successive swaths              retrieving fSCA information compared with field observa-
overlap laterally. We downloaded 645 Theia Sentinel-2 snow             tions – even considering its moderate resolution (Aalstad et
products acquired between 3 September 2017 and 24 De-                  al., 2020). Thus, they are a robust resource to use when de-
cember 2018 over Lebanon. For every Sentinel-2 image we                veloping regional-scale snow reanalysis.
can match a MODIS image since there is a MODIS image

Hydrol. Earth Syst. Sci., 25, 4455–4471, 2021                                           https://doi.org/10.5194/hess-25-4455-2021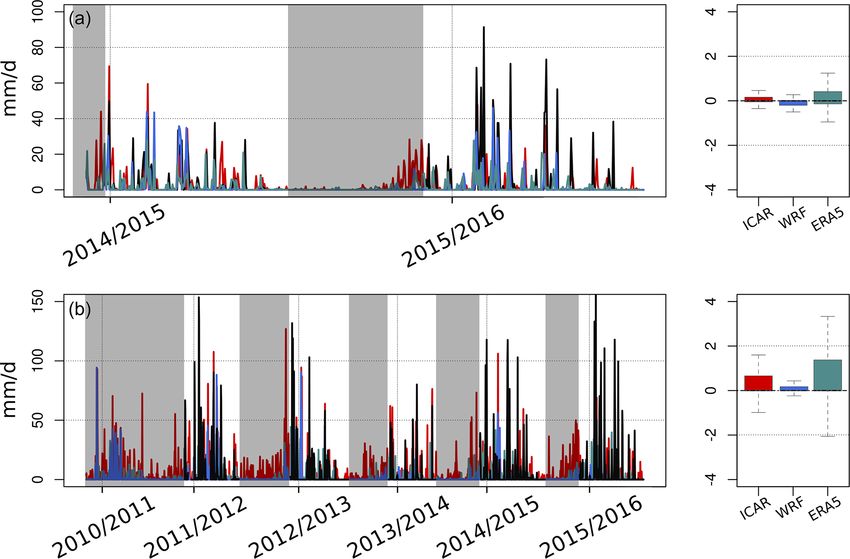
E. Alonso-González et al.: Snowpack dynamics in the Lebanese mountains                                                     4459

3.2.2   Particle batch smoother implementation

The assimilation procedure was implemented using the PBS
scheme (Margulis et al., 2015). The PBS assigns a weight
to each ensemble member according to its agreement with
the observations through Bayes’ theorem. The most obvious
advantage of this technique is its computational efficiency,
as it avoids the resampling step common in other assimila-
tion algorithms. A complete description of the PBS can be
found in Margulis et al. (2015). It is also summarized in Aal-
stad et al. (2018) and Fiddes et al. (2019). The PBS has been
shown to perform well relative to other assimilation algo-
rithms when used to assimilate fSCA information (Aalstad
et al., 2018; Margulis et al., 2015), even though it can suffer
from particle degeneracy as consequence of a highly inho-
mogeneous distribution of weights (Van Leeuwen, 2009). In
this context, the PBS has been successfully used to develop a      Figure 2. Schematic flow chart of the ICAR_assim snow product
series of snowpack reanalyses (Cortés et al., 2016; Fiddes et      development.
al., 2019; Margulis et al., 2016).
   For the prior of the PBS implementation, we generated an
ensemble of snowpack simulations, forcing the FSM2 (Es-            the falling hydrometeor calculated from the air temperature
sery, 2015a) with the ICAR predicted surface meteorology.          and relative humidity. A total of 400 ensemble members per
The configuration of the FSM2 model includes an albedo             ICAR cell were independently generated by randomly draw-
correction, as snow ages differently in time for melting and       ing multiplicative time-constant parameters from the log-
cold snow and increases with snowfall, with a maximum of           normal probability function for precipitation and additive pa-
0.9. The compaction rate was calculated based on overbur-          rameters from the normal probability function for the 2 m air
den and thermal metamorphism (Verseghy, 1991). The tur-            temperature.
bulent exchange coefficient was stability corrected based on          To estimate the fSCA of each ensemble member, we used
the bulk Richardson number. The thermal conductivity was           the probabilistic snow depletion curve proposed by Lis-
calculated based on snow density. Finally, the FSM2 config-        ton (2004). This model simulates the subgrid peak SWE
uration accounted for the retention and refreezing of water        distribution using a log-normal probability density func-
inside the snowpack. Such a configuration has been shown to        tion. Then, the fSCA is diagnosed using the accumulated
properly simulate the inter- and intra-annual variability in the   melt depth estimated from the energy balance outputs of the
snowpack dynamics over mountains with a similar Mediter-           FSM2, the peak mean SWE and the peak subgrid coefficient
ranean climate (Alonso-González et al., 2018).                     of variation (CV) in the log-normal probability density func-
   To generate the ensemble of forcing data sets, we per-          tion, assuming a constant melt over the grid cell. The CV
turbed the precipitation and the 2 m air temperature sur-          used in this model is strongly controlled by the character-
face fields of the ICAR output using log-normal and normal         istics of the terrain. We have included the CV parameter as
(Gaussian) probability density functions, respectively. We         part of the assimilation, perturbing its value inside the rec-
choose the mean of the probability functions from the aver-        ommended values in Liston (2004), using a mean of 0.4 and
aged biases of the ICAR simulation, estimated from indepen-        a variance of 0.01 (Aalstad et al., 2018). The PBS was im-
dent observations provided by three mountain AWSs at the           plemented over the fSCA ensemble over each grid cell and
locations shown in Fig. 1 (Fayad et al., 2017a). The variance      season independently, using the values of the melting season
of the probability distribution functions was calculated by        corresponding to the months of March through June. Finally,
doubling the variance of the errors to increase the spread of      the generated SWE products (hereafter ICAR_assim) were
the ensemble to cover the apparent uncertainty in the ICAR         estimated from the weighted mean of the SWE of the en-
outputs. The precipitation phase had to be recalculated for        semble members, where the weights were obtained using the
the new synthetic temperatures for each ensemble member.           PBS. A schematic description of the whole process is pre-
Due to the strong dependency of the snowpack over Lebanon          sented in Fig. 2.
on precipitation phase, simple temperature-threshold-based
precipitation-phase partitions are not recommended (Fayad          3.3   Validation procedure and analysis of the SWE
and Gascoin, 2020). Instead, we have used the psychromet-                products
ric energy balance method approach proposed by Harder
and Pomeroy (2013), where the precipitation phase is es-           The ICAR atmospheric simulation and the ICAR_assim
timated by means of the estimation of the temperature of           products were compared against independent observations.

https://doi.org/10.5194/hess-25-4455-2021                                       Hydrol. Earth Syst. Sci., 25, 4455–4471, 2021
4460 E. Alonso-González et al.: Snowpack dynamics in the Lebanese mountains
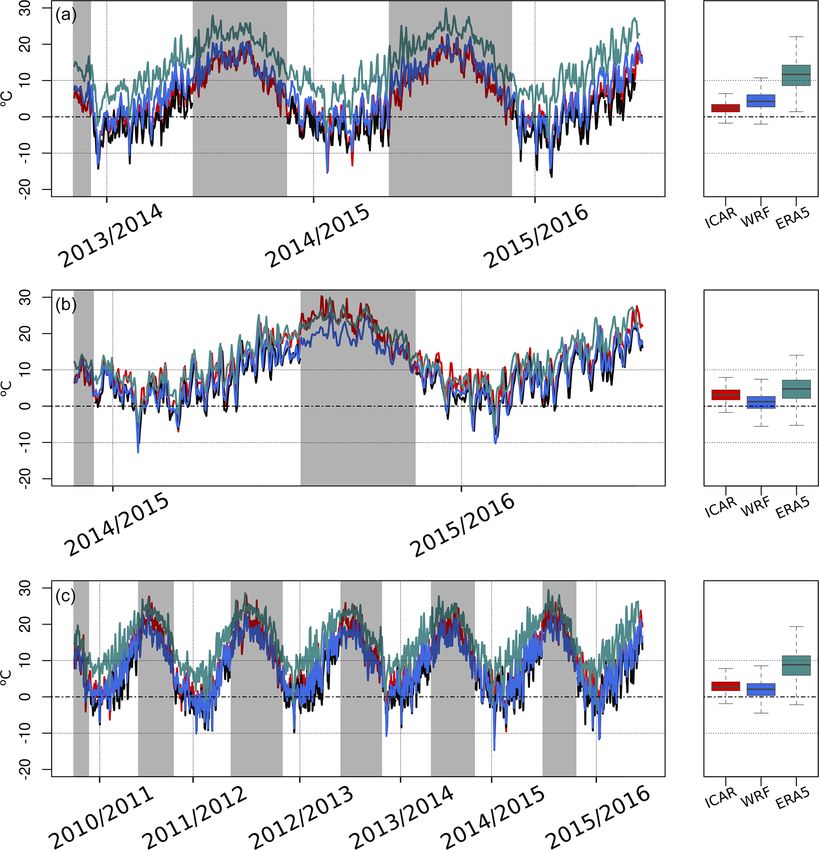
First, the ICAR atmospheric simulation was compared with 4 Results and discussion
three AWSs located in the main mountain range of the do-
main (Fayad et al., 2017a; Fig. 1). Temperature and precipita- 4.1 Atmospheric simulation results
tion measurements were aggregated to the hourly model out-
put frequency from the original 30 min time resolution. Then, The use of ICAR is justified as it is computationally inexpen-
the temperature and precipitation biases were estimated. The sive compared to similar WRF simulations, while retaining a
precipitation data were available only in two of the AWSs. physical basis to enable simulations in regions lacking ob-
The error values and its variance were used to define the servations. The speeding up factors can range from 140, in
shape of the probability density functions of the perturbation its more complex configurations (as chosen for this study),
parameters described above to generate each ensemble. to 800, in its simpler configurations (Gutmann et al., 2016a).
After the PBS implementation, we compared the ICAR However, the linear theory simplification presents some lim-
and ICAR_assim snow products with the snow depth ob- itations when predicting the motion of the atmosphere, such
served information derived from a Campbell Scientific as interactions between waves and turbulence (Nappo, 2012)
SR50A acoustic gauge at the three AWSs. The observed or the lack of explicit convection. Despite these limitations,
snow depth was transformed into SWE by assuming a con- ICAR has been shown to be a valuable tool for downscaling,
stant snow density value of 467 kg m−3 estimated from ob- showing a good consistency with observations (Horak et al.,
servations in the area (Fayad et al., 2017a). This was nec- 2019) and with fully dynamical WRF simulations (Gutmann
essary to make the AWS data comparable with the ICAR et al., 2016a). Figure 3 shows how the ICAR model was able
snow outputs as they are provided only as SWE. Even if it to improve the 2 m air temperature data, compared with the
is commonly implemented in operational atmospheric fore- ERA5 reanalysis (ICAR mean error = 2.8 ◦ C compared with
cast models, the assumption of a constant density could in- 8.5 ◦ C in ERA5), showing performances comparable to the
troduce obvious bias in the SWE estimation (Dawson et al., WRF coarser simulation (WRF mean error = 2.3 ◦ C). It was
2017). In the Mediterranean snowpacks, such biases are par- not expected that the parent WRF simulation would need to
tially reduced as consequence of the high densification rates be improved with ICAR, but the increase in resolution was
of the snowpack (Bormann et al., 2013; Fayad et al., 2017b). necessary as the snowpack simulations require higher reso-
However, we introduced a sensitivity analysis in the com- lutions. The coarser ERA5 resolution that smooths the ter-
parison, varying the density value in the range of ±15 % to rain leads to warm biases. This is particularly evident in the
illustrate such uncertainty. To compensate the big shift be- Lebanese ranges where the elevation gradient ranges from 0
tween the ICAR and ICAR_assim resolutions (1 km × 1 km) to 3000 m a.s.l. in approximately 25 km (Fig. 1). Despite the
and the point scale nature of the AWS observations, we inter- clear improvement in the temperature performance, the sim-
polated a new SWE series from the four nearest cells of the ulation is biased towards slightly higher temperatures than
simulations using the inverse distance method. the AWS data. However, the main temporal patterns and the
The spatial accuracy of the SWE products was compared magnitude of the temperature are well represented.
to satellite observations. First, we developed a daily gap- Similarly, precipitation outputs of ICAR were compared
filled snow cover time series covering the time period of with the gauges deployed in two of the AWS sites. ICAR re-
the ICAR simulation from the MODIS snow cover products duces the spread of the daily precipitation errors of ERA5,
using the methodology proposed by Gascoin et al. (2015). as shown in Fig. 4 (standard deviation of 11.5 mm in ERA5
Then, the products were aggregated to estimate the averaged compared with the 8.4 mm of ICAR), even though the ERA5
snow presence over each cell in percentage (P (snow)). The errors are already surprisingly low considering the spatial
MODIS P (snow) product was aggregated to the ICAR grid resolution and the fact that precipitation is challenging to
to make it comparable. Then, we calculated the P (snow) simulate by numerical models, especially over complex ter-
for the ICAR and ICAR_assim simulations. We chose a rain (Legates, 2014). This validation provides a range of un-
SWE MODIS detection threshold of 20 mm to calculate the certainty estimates to help generate the probability density
P (snow) from the simulated SWE series inside the range functions for the perturbations of the ensemble. The selected
recommended by Gascoin et al. (2015). All of the spatial parameters to define the shape of the normal probability den-
analysis and the data assimilation were computed over the sity function which defines the additive perturbation to the
areas that had exhibited a P (snow) >5 %, which amounts to temperature were set to a mean of −3.0 ◦ C and a variance of
a total surface of 4412 km2 . 1.8 ◦ C. Similarly, the parameters of the log-normal probabil-
ity density function used to obtain the multiplicative pertur-
bation factors for the precipitation were a mean of 2.0 and a
variance of 0.75. Even though the parameters were designed
to model the uncertainty of ICAR, they are similar to com-
parable implementations of the PBS (Cortés et al., 2016).
Through the forced increase in the variance of the probability
density functions, we ensure that the ensemble of snow simu-
Hydrol. Earth Syst. Sci., 25, 4455–4471, 2021 https://doi.org/10.5194/hess-25-4455-2021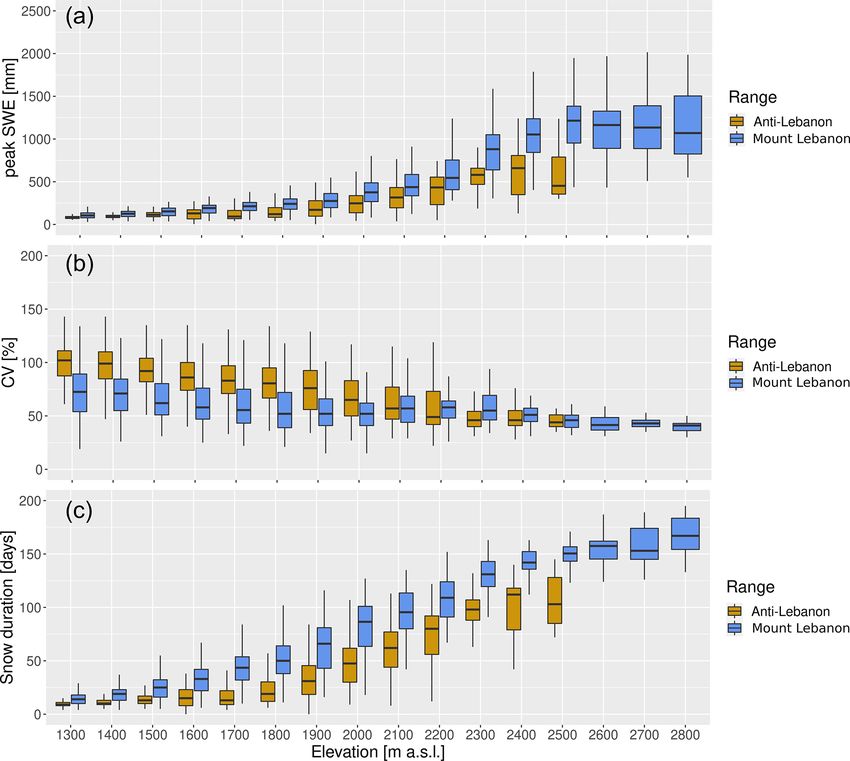
E. Alonso-González et al.: Snowpack dynamics in the Lebanese mountains                                                          4461

Table 1. AWS geographical coordinates and elevations. Elevation of the ICAR cell that contains each AWS.

                            AWS     Snow seasons     Elevation     Latitude   Longitude    ICAR elevation
                                                      (m a.s.l.)   (WGS84)    (WGS84)           (m a.s.l.)
                            A       2013 to 2016          2834     34.27◦ N   36.09◦ E               2827
                            B       2014 to 2016          1843     34.14◦ N   35.88◦ E               1746
                            C       2011 to 2016          2296     33.98◦ N   35.86◦ E               2272

Figure 3. ERA5 (green), WRF (blue), ICAR (red) and AWS (black) daily temperature data. The box plots represent the distribution of the
errors, and the gray shadows represent the data gaps in the observations.

lations covers the expected uncertainty space of ICAR, while           sulted in a larger mean absolute error (MAE; 6.2 % compared
the PBS has proved to be robust to progressive variations of           to 5.7 %) and a root mean squared error (RMSE; 12 % com-
the perturbation parameters (Cortés et al., 2016).                     pared to 11 %). The equation of the linear fit is as follows:
                                                                       fSCA = 1.23 · NDSI + 0.23.
4.2   Fractional snow cover assimilation
                                                                       The performance of ICAR_assim was compared against
The new proposed linear relationship function to derive                snow depth measurements at the AWS locations (Fig. 5) and
fSCA from NDSI has improved the MODIS fSCA products                    MODIS gap-filled products (Figs. 6 and 7). In general, ICAR
when compared with the relationship function by Salomon-               has a tendency to underestimate the SWE compared with
son and Appel (2004; Fig. S1 in the Supplement). Using the             ICAR_assim. This is likely related to the warm biases de-
relationship function by Salomonson and Appel (2004) re-               tected in the simulation, combined with the limitations in the

https://doi.org/10.5194/hess-25-4455-2021                                           Hydrol. Earth Syst. Sci., 25, 4455–4471, 2021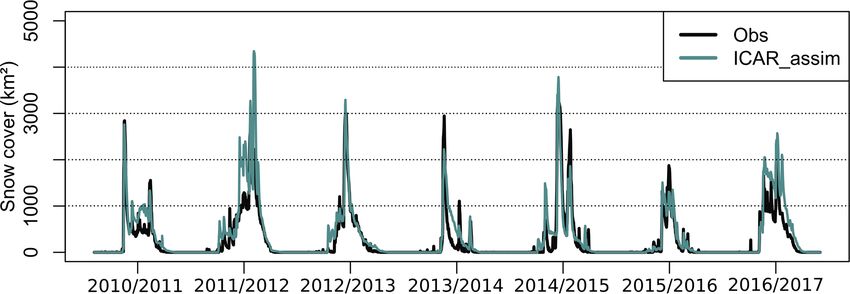
4462                                              E. Alonso-González et al.: Snowpack dynamics in the Lebanese mountains

Figure 4. ERA5 (green), WRF (blue), ICAR (red) and AWS (black) daily precipitation data. The box plots represent the distribution of the
errors, and the gray shadows represent the data gaps in the observations.

snow model implemented in the Noah land surface model                 crepancies are greatly minimized in ICAR_assim by the as-
used by ICAR (Barlage et al., 2010). Thus, future versions            similation of the fSCA retrievals.
of ICAR with better representations of the snow processes                The results of the validation of ICAR_assim show a good
through the implementation of more complex land surface               agreement with the observations. For the estimated SWE, the
parameterizations like Noah-MP (Niu et al., 2011), as used            RMSE and the MAE relative to the AWSs were 189.2 and
in the parent WRF simulation, could potentially improve               104.52 mm, respectively, after removing the summer from
the accuracy of ICAR’s SWE outputs (Suzuki and Zupan-                 the analyses, with a correlation coefficient (R) of 0.75 for the
ski, 2018). This effect could be particularly enhanced in the         annual mean SWE accumulation. Even though ICAR_assim
mild climatic conditions of Lebanon, as larger disagreements          generally shows a good agreement with the observations (es-
in the SWE outputs between Noah and Noah-MP occur un-                 pecially considering the scale mismatch between the stations
der warm conditions (Kuribayashi et al., 2013). However, the          and ICAR_assim), some clear differences were found. Fig-
improvement of the snow representations of ICAR is clear              ure 5 exhibits a surprisingly high difference in the magni-
when compared with ERA5 reanalysis, which was not able                tude of the observed SWE and the ICAR_assim output for
to reproduce the snowpack at all due to its coarse resolution.        the 2011–2012 winter season in the third AWS. However, in-
   The use of FSM to generate the ensemble of simulations             dependent observations in the area have described an excep-
introduced some uncertainty in the snow simulations. Some             tional snowpack in this season, with snow depths of more
water years showed earlier snowmelt. As the uncertainty of            than 6 m and even reaching up to 10 m locally (Koeniger
the snow models associated to the forcing is higher than the          et al., 2017). Such disagreements between the AWS infor-
uncertainty associated by the use of different model param-           mation and the independent observations can be explained
eterizations and model structures (Günther et al., 2019), we          by the high spatial heterogeneity of the snow depth at point
hypothesize that such differences were caused by the differ-          scales (López-Moreno et al., 2011). This effect was studied
ences in the precipitation phase partitioning that is challeng-       in the Atlas Mountains, where the agreement of the snow
ing to simulate in the areas that remain close to 0 ◦ C dur-          simulations rapidly drops when using resolutions over 250 m
ing the snow season (Fayad and Gascoin, 2020). The lack of            (Baba et al., 2019). Such spatial heterogeneity has been
spring snowfalls in some years may have deep implications             shown to be particularly high over Mount Lebanon due to the
in the snowpack simulation that are not limited to its effect in      important role of the wind redistribution as a consequence of
the mass balance and the releasing of latent heat by refreez-         the geomorphology (Fayad and Gascoin, 2020). For exam-
ing the liquid precipitation. It leads to lower albedos which,        ple, Fayad and Gascoin (2020) reported large differences in
combined with the high shortwave radiation of Lebanon due             the AWS data from in situ measurements on 15 January 2016
to its latitude, causes earlier snowmelt. However, such dis-          when they measured snow depths up to 258 cm in the sur-

Hydrol. Earth Syst. Sci., 25, 4455–4471, 2021                                           https://doi.org/10.5194/hess-25-4455-2021
E. Alonso-González et al.: Snowpack dynamics in the Lebanese mountains                                                   4463

                                                                 general tendency by ICAR_assim to slightly underestimate
                                                                 the P (snow) values, especially at the lower elevations. We
                                                                 hypothesize that this effect could be caused by the selec-
                                                                 tion of a constant SWE depth to calculate the snow cover
                                                                 from the ICAR_assim product. Thus, the shallow snowpacks
                                                                 for which the SWE values are under the selected thresh-
                                                                 old are not recorded as snow presence in the ICAR_assim,
                                                                 even though they could potentially be detected as snow by
                                                                 the MODIS sensor. In addition, the MODIS snow cover
                                                                 products should be considered less accurate over areas of
                                                                 rapid melt (Gascoin et al., 2015). Such a mismatch between
                                                                 ICAR_assim and MODIS, combined with the fact that the
                                                                 2011–2012 snow season showed persistent cloud cover re-
                                                                 lated to its exceptional snowpack, could explain the biases
                                                                 in Fig. 6. During the 2011–2012 snow season, the gap-
                                                                 filling algorithm had less information to fill the MODIS snow
                                                                 cover time series, while the PBS had propagated the fSCA
                                                                 information through the whole season from the few avail-
                                                                 able observations. In summary, our results have shown how
                                                                 ICAR_assim can accurately reproduce the interannual and
                                                                 intra-annual spatiotemporal patterns of the snow cover, with
                                                                 a SWE magnitude comparable with independent observa-
                                                                 tions that agree well in terms of temporal patterns.

                                                                 5   Snowpack dynamics over the Lebanese mountains

Figure 5. Comparison between observed, ICAR, FSM and             ICAR_assim exhibits some limitations that should be con-
ICAR_assim SWE products. The green background indicates the      sidered. First, despite the high resolution of the reanalysis,
time steps when ICAR_assim improves the performance of ICAR.     the regional nature of the simulations prevent the represen-
                                                                 tation of some processes like wind or avalanche snow redis-
                                                                 tribution. In addition, there are some other sources of un-
roundings of the third AWS location (Fig. 5; bottom panel),      certainty involved in the development of the reanalysis, like
while the AWS sensor itself detected 7.5 cm. However, the        the depletion curve, the fSCA derived from MODIS or the
comparison between the temporal patterns of the snow cover       structural uncertainty associated with each model. However,
over Lebanon from MODIS gap-filled daily products and            ICAR_assim has been shown to be consistent with the lim-
ICAR_assim have shown good levels of agreement with a            ited observations, providing a valuable resource in the data-
RMSE equal to 270.2 km2 , a MAE equal to 124.1 km2 over          scarce context of the Lebanese mountains.
a total surface of 4412 km2 (Fig. 6) and a Pearson correlation      Figure 8 shows the spatial distribution of the mean peak
value of R = 0.88 in the annual maximum of the snow cover        SWE values and its temporal coefficient of variation for the
extent (Fig. 6). The larger spatial support of the MODIS         2010–2017 time period. Such values can be influenced by
products permits a more representative and extensive vali-       the fact that the study period is relatively humid compared
dation of ICAR_assim. Thus, the good agreement between           with the previous years (Cook et al., 2016), showing slightly
both snow cover products and the general SWE magnitudes          higher values than a long-term climatology. However, the
with the AWS observations shows the temporal consistency         length of the reanalyses constitutes a reasonably representa-
of the ICAR_assim reanalysis.                                    tive sample of the main snowpack dynamics over the region.
   The spatial patterns of ICAR_assim were also compared         The snowpack over Lebanon has exhibited the high temporal
with the MODIS gap-filled products (Fig. 7). The spatial         variability that is characteristic of the Mediterranean snow-
comparison of the P (snow) showed a very good level of           packs (Fayad et al., 2017b), with similar values of the coef-
agreement, demonstrating the potential of fSCA assimila-         ficient of variation to those observed in other Mediterranean
tion through the PBS in improving the ICAR SWE prod-             mountain ranges (Alonso-González et al., 2020b). The maxi-
ucts. The comparison showed a correlation value of R =           mum accumulations reach 2000 mm of SWE and are located
0.98, a RMSE of = 3.0 % and a MAE of = 2.3 %, improv-            at the higher elevations of Mount Lebanon where there is a
ing the ICAR simulation that exhibited values of R = 0.79,       plateau over the elevation of the winter zero isotherm (Fayad
RMSE of = 14.3 % and MAE of = 12.3 %. There was a                and Gascoin, 2020). The temporal coefficient of variation

https://doi.org/10.5194/hess-25-4455-2021                                     Hydrol. Earth Syst. Sci., 25, 4455–4471, 2021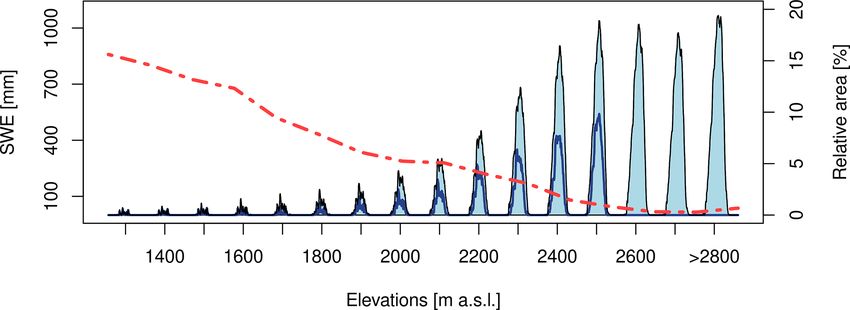
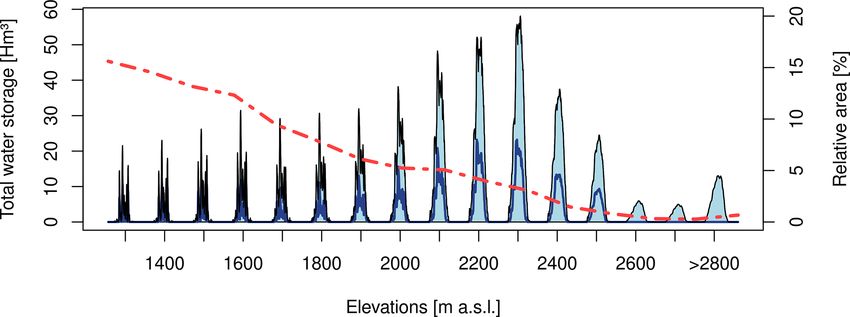
4464                                             E. Alonso-González et al.: Snowpack dynamics in the Lebanese mountains

Figure 6. Daily snow cover extent comparison between MODIS gap-filled products and ICAR_assim.

Figure 7. Snow probability spatial comparison between observed MODIS products and ICAR_assim.

of the annual peak SWE follows unequal spatial patterns. It        tains show lower peak accumulations than Mount Lebanon,
tends to exhibit higher values over the areas sheltered from       with the Anti-Lebanon Mountains in the rain shadow, lead-
direct interaction with the warm and moist Mediterranean           ing to lower precipitation and snow accumulation. However,
air. In addition, it exhibits a decreasing trend with elevation    despite the differences in the coefficient of variation values,
(Fig. 9), as found in other Mediterranean ranges (Alonso-          they tend to become similar at the higher elevations. The
González et al., 2020), reaching a minimum of 15 %.                same coefficient of variation occurs in the elevations where
   There are clear differences between Mount Lebanon and           the precipitation leads the snow accumulation, while they dif-
the Anti-Lebanon Mountains that can be just partially ex-          fer at the lower elevations, where the accumulation is condi-
plained by their different orography. Despite the closeness of     tioned by the temperature. This effect suggests warmer con-
both Mount Lebanon and the Anti-Lebanon Mountains, they            ditions on the Anti-Lebanon Mountains as a consequence
exhibit different relationships between the values of the mean     of lee-side wind effects (Foëhn-type effect) and confirms
peak SWE (Fig. 9; top panel) and snow duration (Fig. 9; bot-       the sensitivity of the snow simulation to the chosen parti-
tom panel) and with the elevation, showing that the differ-        tion phase method over Mediterranean mountains (Fayad and
ences are not just related to the particular orography of each     Gascoin, 2020).
range but also with its climatological characteristics. Thus, at      Figure 10 shows the averaged seasonal SWE accumula-
comparable elevations, Mount Lebanon tends to show higher          tion at different elevations over both Mount Lebanon and the
values of P (snow) and mean peak SWE, with lower values            Anti-Lebanon Mountains. Each elevation represents the ag-
of the coefficient of variation, suggesting a thicker, longer-     gregated pixels of the elevation, with a range of ±50 m a.s.l.
lasting and seasonally stable snowpack. The orographic pre-        For reference, they show on average a peak SWE of 306 mm
cipitation caused by the uplift of the Mediterranean mois-         at the elevation band of 2000 m a.s.l., which is compara-
ture is a major source of precipitation in the area (Jomaa et      ble to those found in the Iberian Peninsula mountain ranges
al., 2019). That is probably why the Anti-Lebanon Moun-            (Alonso-González et al., 2020b). More specifically, the peak

Hydrol. Earth Syst. Sci., 25, 4455–4471, 2021                                       https://doi.org/10.5194/hess-25-4455-2021
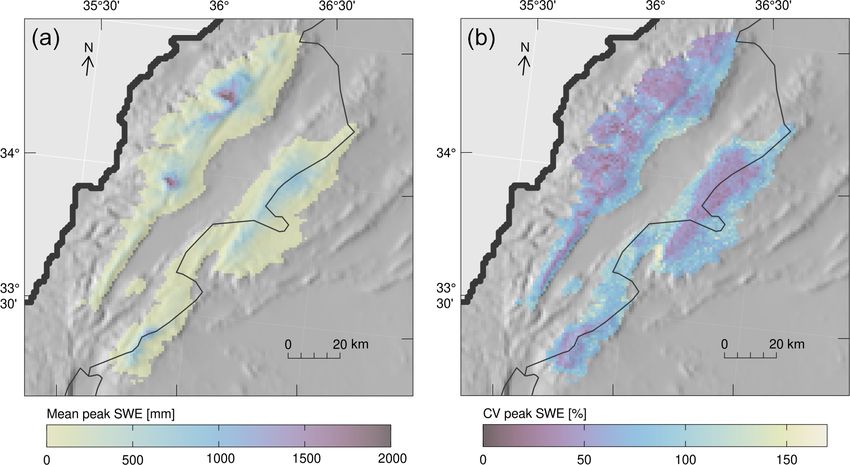
E. Alonso-González et al.: Snowpack dynamics in the Lebanese mountains                                                                4465

Figure 8. Averaged annual peak SWE (a) and annual coefficient of variation (b).

Figure 9. Relationship between annual peak SWE and elevation (a), coefficient of variation and elevation (b) and snow duration and elevation
(c).

https://doi.org/10.5194/hess-25-4455-2021                                             Hydrol. Earth Syst. Sci., 25, 4455–4471, 2021
4466                                              E. Alonso-González et al.: Snowpack dynamics in the Lebanese mountains

Figure 10. Mean annual evolution of SWE at different elevation bands. The dark blue line represents the Anti-Lebanon Mountains, the black
line the Mount Lebanon range and the red line the relative areal coverage of each elevation above 1300 m a.s.l.

Figure 11. Averaged annual water stored in the snowpack at different elevation bands. The dark blue line represents the Anti-Lebanon
Mountains, the black line the Mount Lebanon range and the red line the relative areal coverage of each elevation above 1300 m a.s.l.

SWE and duration values show intermediate values between               from 1300 to 2300 m a.s.l.) when compared to the higher ar-
the central Iberian and Pyrenees ranges at 2000 m a.s.l but            eas (average maximum up to 189 Hm3 at 2400 m a.s.l. and
with a peak SWE coefficient of variation of 53 % that is               onward). This is an important part of the yearly water bud-
greater than the highest values of Iberia located at Sierra            get, as mean annual precipitation was estimated in to be
Nevada with 34 %. The relative area lying at each elevation            7200 Hm3 for the period (2010–2016; Jaafar et al., 2020).
compared to the total elevation over 1300 m a.s.l. is repre-           Note that this in contrast to the fact that the orography of
sented to highlight the importance of the hypsography from             Lebanon encourages the storage of snow in the upper areas
the hydrological point of view. Thus, Lebanon exhibits a               because of the existence of a high-elevation plateau (Fayad et
deep and long-lasting snowpack, with up to 1000 mm of peak             al., 2017a; Fayad and Gascoin, 2020). These results suggest
SWE on average particularly over 2500 m a.s.l., but the rela-          new challenges for the water management of Lebanon in the
tive areal coverage of such elevations is very low. This sug-          future as a consequence of warming climate. The snowpack
gests that the mean peak SWE series at lower elevations                at low-elevation areas is more sensitive to warming (Jeffer-
could hide a large variation in mass due to the wider areas            son, 2011; Marty et al., 2017; Sproles et al., 2013), partic-
at lower elevations where many different peak SWE values               ularly over areas with mild winter conditions, as has been
can coexist, as Alonso-González et al. (2020) found in the             shown in other Mediterranean regions (Alonso-González et
Iberian mountain ranges.                                               al., 2020a).
   The thick snowpacks found at the higher elevations are not
necessarily the biggest freshwater resources available due to
the hypsometry of the mountain area. Figure 11 shows the av-           6   Conclusions
erage amount of freshwater stored in the snowpack per eleva-
tions band. It is obvious that the maximum amount of fresh-            The assimilation of MODIS fSCA through the use of the PBS
water is stored between 2100 to 2500 m a.s.l., despite the fact        has proven to be a cost-effective way to use remote sens-
that thicker snowpacks are at higher elevations. The cumula-           ing data in snow simulations and is particularly appropriate
tive water storage in the snowpack is more than double in the          for simulating snow in data-scarce regions. Thus, the gener-
medium elevation zone (average maximum up to 552 Hm3                   ated SWE products show good agreement with MODIS snow

Hydrol. Earth Syst. Sci., 25, 4455–4471, 2021                                           https://doi.org/10.5194/hess-25-4455-2021
E. Alonso-González et al.: Snowpack dynamics in the Lebanese mountains                                                              4467

cover gap-filled data, with R = 0.98, RMSE equal to 3.0 %             Special issue statement. This article is part of the special issue
and MAE equal to 2.3 % for the spatial map of the probability         “Changes in the Mediterranean hydrology: observation and mod-
of snow. The time series of snow cover showed a R = 0.88,             eling”. It is not associated with a conference.
RMSE equal to 270.2 km2 , and MAE equal to 124.1 km2
over a total surface of 4412 km2 . The performances, in terms
of SWE magnitude with the few available point-scale obser-            Acknowledgements. Kristoffer Aalstad has been funded by the Sat-
vations, was R = 0.75, RMSE equal to 189.2 mm and MAE                 Perm project (grant no. 239918; Research Council of Norway), a
                                                                      personal overseas research grant (Research Council of Norway),
equal to 104.5 mm after removing the summer from the anal-
                                                                      and the European Space Agency Permafrost CCI ECV project (http:
yses.                                                                 //cci.esa.int/Permafrost, last access: 14 July 2021) and acknowl-
   The snowpack over Lebanon is characterized by a high               edges support from the Land–ATmosphere Interactions in Cold En-
temporal variability. Some differences exist between its two          vironments (LATICE) strategic research area at the University of
main mountain ranges. Mount Lebanon exhibits thicker,                 Oslo.
longer and more regular snowpacks compared to the Anti-
Lebanon Mountains. Such differences cannot only be ex-
plained by the elevation difference but also reflect the drier        Financial support. This research has been supported by the
conditions on the lee side of the Mount Lebanon range due             Spanish Ministry of Economy and Competitiveness (grant no.
the rain shadow effect. The hypsometry of Lebanon results             BES-2015-071466), the Spanish Ministry of Economy and Com-
in the most important snow freshwater reservoir being in the          petitiveness (grant no. CGL2014-52599-P10), and the Spanish
middle elevations (2200–2500 m a.s.l.). Snowpacks at these            Ministry of Economy and Competitiveness (grant no. CGL2017-
elevations close to the 0 ◦ C isotherm are highly vulnerable          82216-R).
to climate warming. As such, our findings suggest big chal-
                                                                      The publication fee for this work has been covered by the
lenges for the future management of water resources over the
                                                                      CSIC Open Access Publication Support Initiative through its Unit
Lebanon region.                                                       of Information Resources for Research (URICI).

Code and data availability. WRF code can be downloaded from           Review statement. This paper was edited by María José Polo and
https://github.com/wrf-model/WRF (Skamarock et al., 2008b).           reviewed by three anonymous referees.
ICAR code can be found at https://github.com/NCAR/icar (Gut-
mann et al., 2016b). FSM2 is archived at https://github.com/
RichardEssery/FSM2 (Essery, 2015b). The meteorological data can
be found at https://doi.org/10.5281/zenodo.583733 (Fayad et al.,
2017).                                                                References

                                                                      Aalstad, K., Westermann, S., Schuler, T. V., Boike, J., and Bertino,
                                                                        L.: Ensemble-based assimilation of fractional snow-covered area
Supplement. The supplement related to this article is available on-
                                                                        satellite retrievals to estimate the snow distribution at Arctic
line at: https://doi.org/10.5194/hess-25-4455-2021-supplement.
                                                                        sites, The Cryosphere, 12, 247–270, https://doi.org/10.5194/tc-
                                                                        12-247-2018, 2018.
                                                                      Aalstad, K., Westermann, S., and Bertino, L.: Evaluating satellite
Author contributions. EAG led the conceptualization, developed          retrieved fractional snow-covered area at a high-Arctic site us-
the methodology, wrote the original draft, developed the software,      ing terrestrial photography, Remote Sens. Environ, 239, 111618,
curated and validated the data and visualized the project. EG and       https://doi.org/10.1016/j.rse.2019.111618, 2020.
SG supervised, and EG, KA, AF and SG assisted with the method-        Albergel, C., Dutra, E., Munier, S., Calvet, J.-C., Munoz-Sabater,
ology, supervised and reviewed and edited the paper. EG and MB          J., de Rosnay, P., and Balsamo, G.: ERA-5 and ERA-Interim
developed the software, and MB curated the data and also super-         driven ISBA land surface model simulations: which one
vised.                                                                  performs better?, Hydrol. Earth Syst. Sci., 22, 3515–3532,
                                                                        https://doi.org/10.5194/hess-22-3515-2018, 2018.
                                                                      Alonso-González, E., López-Moreno, J. I., Gascoin, S., García-
Competing interests. The authors declare that they have no conflict     Valdecasas Ojeda, M., Sanmiguel-Vallelado, A., Navarro-
of interest.                                                            Serrano, F., Revuelto, J., Ceballos, A., Esteban-Parra, M. J., and
                                                                        Essery, R.: Daily gridded datasets of snow depth and snow water
                                                                        equivalent for the Iberian Peninsula from 1980 to 2014, Earth
Disclaimer. Publisher’s note: Copernicus Publications remains           Syst. Sci. Data, 10, 303–315, https://doi.org/10.5194/essd-10-
neutral with regard to jurisdictional claims in published maps and      303-2018, 2018.
institutional affiliations.                                           Alonso-González, E., López-Moreno, J. I., Navarro-Serrano, F.,
                                                                        Sanmiguel-Vallelado, A., Aznárez-Balta, M., Revuelto, J., and
                                                                        Ceballos, A.: Snowpack sensitivity to temperature, precipita-
                                                                        tion, and solar radiation variability over an elevational gra-

https://doi.org/10.5194/hess-25-4455-2021                                           Hydrol. Earth Syst. Sci., 25, 4455–4471, 2021
4468 E. Alonso-González et al.: Snowpack dynamics in the Lebanese mountains
dient in the Iberian mountains, Atmos. Res., 243, 104973, Cortés, G., Girotto, M., and Margulis, S.: Snow process estimation
https://doi.org/10.1016/j.atmosres.2020.104973, 2020a. over the extratropical Andes using a data assimilation framework
Alonso-González, E., López-Moreno, J. I., Navarro-Serrano, F., integrating MERRA data and Landsat imagery, Water Resour.
Sanmiguel-Vallelado, A., Revuelto, J., Domínguez-Castro, F., Res., 52, 2582–2600, https://doi.org/10.1002/2015WR018376,
and Ceballos, A.: Snow climatology for the mountains in the 2016.
Iberian Peninsula using satellite imagery and simulations with Dee, D. P., Uppala, S. M., Simmons, A. J., Berrisford, P., Poli,
dynamically downscaled reanalysis data, Int. J. Climatol., 40, P., Kobayashi, S., Andrae, U., Balmaseda, M. A., Balsamo, G.,
477–491, https://doi.org/10.1002/joc.6223, 2020b. Bauer, P., Bechtold, P., Beljaars, A. C. M., van de Berg, L., Bid-
Arasa, R., Porras, I., Domingo-Dalmau, A., Picanyol, M., Co- lot, J., Bormann, N., Delsol, C., Dragani, R., Fuentes, M., Geer,
dina, B., González, M. Á., and Piñón, J.: Defining a Stan- A. J., Haimberger, L., Healy, S. B., Hersbach, H., Hólm, E. V.,
dard Methodology to Obtain Optimum WRF Configura- Isaksen, L., Kållberg, P., Köhler, M., Matricardi, M., McNally,
tion for Operational Forecast: Application over the Port of A. P., Monge-Sanz, B. M., Morcrette, J.-J., Park, B.-K., Peubey,
Huelva (Southern Spain), Atmos. Clim. Sci., 6, 329–350, C., de Rosnay, P., Tavolato, C., Thépaut, J.-N., and Vitart, F.: The
https://doi.org/10.4236/acs.2016.62028, 2016. ERA-Interim reanalysis: configuration and performance of the
Baba, M. W., Gascoin, S., and Hanich, L.: Assimilation of Sentinel- data assimilation system, Q. J. Roy. Meteor. Soc., 137, 553–597,
2 data into a snowpack model in the High Atlas of Morocco, https://doi.org/10.1002/qj.828, 2011.
Remote Sens., 10, 1982, https://doi.org/10.3390/rs10121982, Dawson, N., Broxton, P., and Zeng, X.: A new snow density pa-
2018a. rameterization for land data initialization, J. Hydrometeorol., 18,
Baba, M. W., Gascoin, S., Jarlan, L., Simonneaux, V., and Hanich, 197–207, https://doi.org/10.1175/JHM-D-16-0166.1, 2017.
L.: Variations of the snow water equivalent in the ourika catch- El-Fadel, M., Zeinati, M., and Jamali, D.: Water re-
ment (Morocco) over 2000–2018 using downscaled MERRA- sources in Lebanon: Characterization, water balance and
2 data, Water, 10, 1120, https://doi.org/10.3390/w10091120, constraints, Int. J. Water Resour. Dev., 16, 615–638,
2018b. https://doi.org/10.1080/713672540, 2000.
Baba, M. W., Gascoin, S., Kinnard, C., Marchane, A., and Essery, R.: A factorial snowpack model (FSM 1.0), Geosci. Model
Hanich, L.: Effect of Digital Elevation Model Resolu- Dev., 8, 3867–3876, https://doi.org/10.5194/gmd-8-3867-2015,
tion on the Simulation of the Snow Cover Evolution 2015a.
in the High Atlas, Water Resour. Res., 55, 5360–5378, Essery, R.: Flexible Snow Model – a multi-physics energy balance
https://doi.org/10.1029/2018WR023789, 2019. model of accumulation and melt of snow on the ground and in
Bakalowicz, M., El Hakim, M., and El-Hajj, A.: Karst ground- forest canopies, available at: https://github.com/RichardEssery/
water resources in the countries of eastern Mediterranean: FSM2 (last access: 14 July 2021), 2015b.
The example of Lebanon, Environ. Geol., 54, 597–604, Farajalla, N. and Ziade, R.: Drought frequency under a chang-
https://doi.org/10.1007/s00254-007-0854-z, 2008. ing climate in the Eastern Mediterranean: the Beka’a Val-
Barlage, M., Chen, F., Tewari, M., Ikeda, K., Gochis, D., Dudhia, J., ley, Lebanon, in: EGU General Assembly Conference Ab-
Rasmussen, R., Livneh, B., Ek, M., and Mitchell, K.: Noah land stracts, p. 11653, available at: https://ui.adsabs.harvard.edu/abs/
surface model modifications to improve snowpack prediction in 2010EGUGA..1211653F/abstract (last access: 14 July 2021),
the Colorado Rocky Mountains, J. Geophys. Res.-Atmos., 115, 2010.
https://doi.org/10.1029/2009JD013470, 2010. Fayad, A. and Gascoin, S.: The role of liquid water percolation rep-
Betts, A. K. and Miller, M. J.: A new convective adjustment scheme. resentation in estimating snow water equivalent in a Mediter-
Part II: Single column tests using GATE wave, BOMEX, ATEX ranean mountain region (Mount Lebanon), Hydrol. Earth Syst.
and arctic air-mass data sets, Q. J. Roy. Meteor. Soc., 112, 693– Sci., 24, 1527–1542, https://doi.org/10.5194/hess-24-1527-2020,
709, https://doi.org/10.1002/qj.49711247308, 1986. 2020.
Bormann, K. J., Westra, S., Evans, J. P., and McCabe, M. F.: Spa- Fayad, A., Gascoin, S., Faour, G., Fanise, P., Drapeau, L., Somma,
tial and temporal variability in seasonal snow density, J. Hydrol., J., Fadel, A., Al Bitar, A., and Escadafal, R.: Snow observations
484, 63–73, https://doi.org/10.1016/j.jhydrol.2013.01.032, 2013. in Mount Lebanon (2011–2016), Earth Syst. Sci. Data, 9, 573–
Chen, F. and Dudhia, J.: Coupling an advanced land surface- 587, https://doi.org/10.5194/essd-9-573-2017, 2017a.
hydrology model with the Penn-State-NCAR MM5 mod- Fayad, A., Gascoin, S., Faour, G., López-Moreno, J. I., Drapeau,
eling system. Part II: Preliminary model validation, Mon. L., Page, M. L., and Escadafal, R.: Snow hydrology in Mediter-
Weather Rev., 129, 587–604, https://doi.org/10.1175/1520- ranean mountain regions: A review, J. Hydrol. 551, 374–396,
0493(2001)1292.0.CO;2, 2001. https://doi.org/10.1016/j.jhydrol.2017.05.063, 2017b.
Cluzet, B., Lafaysse, M., Cosme, E., Albergel, C., Meunier, L.- Fayad, A., Gascoin, S., Faour, G., Fanise, P., and Dra-
F., and Dumont, M.: CrocO_v1.0: a particle filter to assimi- peau, L.: Snow dataset for Mount-Lebanon (2011–2016),
late snowpack observations in a spatialised framework, Geosci. https://doi.org/10.5281/zenodo.583733, 2017.
Model Dev., 14, 1595–1614, https://doi.org/10.5194/gmd-14- Fiddes, J. and Gruber, S.: TopoSCALE v.1.0: downscaling gridded
1595-2021, 2021. climate data in complex terrain, Geosci. Model Dev., 7, 387–405,
Cook, B. I., Anchukaitis, K. J., Touchan, R., Meko, D. M., and https://doi.org/10.5194/gmd-7-387-2014, 2014.
Cook, E. R.: Spatiotemporal drought variability in the mediter- Fiddes, J., Aalstad, K., and Westermann, S.: Hyper-resolution
ranean over the last 900 years, J. Geophys. Res., 121, 2060–2074, ensemble-based snow reanalysis in mountain regions us-
https://doi.org/10.1002/2015JD023929, 2016. ing clustering, Hydrol. Earth Syst. Sci., 23, 4717–4736,
https://doi.org/10.5194/hess-23-4717-2019, 2019.
Hydrol. Earth Syst. Sci., 25, 4455–4471, 2021 https://doi.org/10.5194/hess-25-4455-2021You can also read


