Partitioning soil organic carbon into its centennially stable and active fractions with machine-learning models based on Rock-Eval thermal ...
←
→
Page content transcription
If your browser does not render page correctly, please read the page content below
Geosci. Model Dev., 14, 3879–3898, 2021
https://doi.org/10.5194/gmd-14-3879-2021
© Author(s) 2021. This work is distributed under
the Creative Commons Attribution 4.0 License.

Partitioning soil organic carbon into its centennially stable and
active fractions with machine-learning models based on
Rock-Eval® thermal analysis (PARTYSOCv2.0 and
PARTYSOCv2.0EU)
Lauric Cécillon1,2 , François Baudin3 , Claire Chenu4 , Bent T. Christensen5 , Uwe Franko6 , Sabine Houot4 ,
Eva Kanari2,3 , Thomas Kätterer7 , Ines Merbach8 , Folkert van Oort4 , Christopher Poeplau9 ,
Juan Carlos Quezada10,11,12 , Florence Savignac3 , Laure N. Soucémarianadin13 , and Pierre Barré2
1 Normandie    Univ., UNIROUEN, INRAE, ECODIV, Rouen, France
2 Laboratoire  de Géologie, École normale supérieure, CNRS, PSL Univ., IPSL, Paris, France
3 Institut des Sciences de la Terre de Paris, Sorbonne Université, CNRS, 75005 Paris, France
4 UMR 1402 ECOSYS, INRAE, AgroParisTech, Univ. Paris Saclay, 78850 Thiverval-Grignon, France
5 Department of Agroecology, Aarhus University, AU Foulum, 8830 Tjele, Denmark
6 Department of soil system science, Helmholtz Centre for Environmental Research, UFZ, 06120 Halle, Germany
7 Department of Ecology, Swedish University of Agricultural Sciences, 75007 Uppsala, Sweden
8 Department Community Ecology, Helmholtz Centre for Environmental Research, UFZ, 06246 Bad Lauchstädt, Germany
9 Thünen Institute of Climate-Smart Agriculture, 38116 Braunschweig, Germany
10 Laboratory of Ecological Systems ECOS and Laboratory of Plant Ecology Research PERL, School of Architecture, Civil

and Environmental Engineering ENAC, École Polytechnique Fédérale de Lausanne EPFL, 1015 Lausanne, Switzerland
11 Swiss Federal Institute for Forest, Snow and Landscape Research WSL, 1015 Lausanne, Switzerland
12 Ecosystem Management, Institute of Terrestrial Ecosystems, Department of Environmental Systems Science,

ETHZ, 8092 Zürich, Switzerland
13 ACTA – les instituts techniques agricoles, 75595 Paris, France

Correspondence: Lauric Cécillon (lauric.cecillon@inrae.fr)

Received: 20 January 2021 – Discussion started: 16 February 2021
Revised: 17 April 2021 – Accepted: 28 May 2021 – Published: 24 June 2021

Abstract. Partitioning soil organic carbon (SOC) into two ki-       soils to partition SOC into its centennially stable and active
netically different fractions that are stable or active on a cen-   fractions. Here, we significantly extend the validity range of
tury scale is key for an improved monitoring of soil health         a previously published machine-learning model (Cécillon et
and for more accurate models of the carbon cycle. However,          al., 2018) that is built upon this strategy. The second ver-
all existing SOC fractionation methods isolate SOC fractions        sion of this model, which we propose to name PARTYSOC ,
that are mixtures of centennially stable and active SOC. If         uses six European long-term agricultural sites including a
the stable SOC fraction cannot be isolated, it has specific         bare fallow treatment and one South American vegetation
chemical and thermal characteristics that are quickly (ca. 1 h      change (C4 to C3 plants) site as reference sites. The Euro-
per sample) measurable using Rock-Eval® thermal analysis.           pean version of the model (PARTYSOC v2.0EU ) predicts the
An alternative would thus be to (1) train a machine-learning        proportion of the centennially stable SOC fraction with a root
model on the Rock-Eval® thermal analysis data for soil sam-         mean square error of 0.15 (relative root mean square error of
ples from long-term experiments for which the size of the           0.27) at six independent validation sites. More specifically,
centennially stable and active SOC fractions can be estimated       our results show that PARTYSOC v2.0EU reliably partitions
and (2) apply this model to the Rock-Eval® data for unknown         SOC kinetic fractions at its northwestern European valida-

Published by Copernicus Publications on behalf of the European Geosciences Union.
3880                                                       L. Cécillon et al.: Partitioning soil organic carbon kinetic fractions

tion sites on Cambisols and Luvisols, which are the two dom-         potential contribution of a soil to climate regulation would be
inant soil groups in this region. We plan future developments        most dependent on its stable organic matter pool size (He et
of the PARTYSOC global model using additional reference              al., 2016; Shi et al., 2020).
soils developed under diverse pedoclimates and ecosystems                A myriad of methods has been developed and tested to par-
to further expand its domain of application while reducing its       tition SOC into active and stable fractions that would match
prediction error.                                                    kinetic pools for the assessment of SOC dynamics and re-
                                                                     lated soil functions since the second half of the 20th cen-
                                                                     tury (Balesdent, 1996; Hénin and Turc, 1949; Monnier et al.,
                                                                     1962; Poeplau et al., 2018). Some of these methods based
1   Introduction                                                     on chemical or physical (size, density, or thermal) fraction-
                                                                     ation schemes can separate SOC fractions with, on average,
Soil organic carbon (SOC) is identified as a key element con-        different turnover rates (Balesdent, 1996; Plante et al., 2013;
tributing to soil functions such as primary productivity, water      Poeplau et al., 2018; Trumbore et al., 1989). Of these meth-
purification and regulation, carbon sequestration and climate        ods, only a few are reasonably reproducible and easy to im-
regulation, habitat for biodiversity, and recycling of nutrients     plement such as the ones based on rapid thermal analysis
(Keesstra et al., 2016; Koch et al., 2013; Schulte et al., 2014;     and chemical extractions (Gregorich et al., 2015; Poeplau
Wiesmeier et al., 2019). While the magnitude and the his-            et al., 2013, 2018; Soucémarianadin et al., 2018a). Other
torical dimension of the decrease in SOC at the global level         methods, such as size and density SOC fractionation, need to
are progressively being unveiled (IPBES, 2018; Sanderman             be inferred from machine-learning models or infrared spec-
et al., 2017; Stoorvogel et al., 2017), SOC stock preserva-          troscopy to be implemented for large soil sample sets (Bal-
tion and even increase is a major challenge for human so-            dock et al., 2013; Cotrufo et al., 2019; Jaconi et al., 2019;
cieties in the 21st century (Amundson et al., 2015). With            Viscarra Rossel et al., 2019; Viscarra Rossel and Hicks,
widespread beneficial effects on soil functioning at the local       2015; Vos et al., 2018; Zimmermann et al., 2007b). How-
level (Pellerin et al., 2020), increasing the size of the global     ever, all SOC fractionation methods fail to achieve a proper
SOC reservoir contributes directly to the Sustainable Devel-         separation of stable from active SOC, and the isolated SOC
opment Goal related to life on land (https://www.globalgoals.        fractions are thus mixtures of centennially stable and active
org/15-life-on-land, last access: 17 June 2020). It is also one      SOC (Fig. 1; Balesdent, 1996; Hsieh, 1992; von Lützow et
of the few land-management-based intervention options that           al., 2007; Sanderman and Grandy, 2020). This limitation is
has a broad and positive impact on food security and climate         common to all existing SOC fractionation methods and com-
change mitigation and adaptation, two other Sustainable De-          promises the results of any work using them directly to quan-
velopment Goals set by the United Nations (IPCC, 2019; Lal,          tify soil functions specifically related to SOC fractions or to
2004).                                                               parameterize SOC partitioning in multi-compartmental mod-
   There is experimental evidence showing that in all soils,         els of SOC dynamics (Luo et al., 2016). Simulations of SOC
SOC is made of carbon atoms with highly contrasting res-             stocks changes by multi-compartmental models are very sen-
idence times ranging from hours to millennia (Balesdent et           sitive to the initial proportion of the centennially stable SOC
al., 1987; Trumbore et al., 1989). This continuum in SOC             fraction, underlining the importance of its accurate estima-
persistence is often simplified by considering SOC as a mix-         tion (Clivot et al., 2019; Falloon and Smith, 2000; Jenkinson
ture formed of several fractions, also called kinetic pools by       et al., 1991; Taghizadeh-Toosi et al., 2020).
modellers (Hénin and Dupuis, 1945; Jenkinson, 1990; Niki-                If the stable SOC fraction cannot be isolated, it has spe-
foroff, 1936). The most drastic conceptual simplification of         cific chemical and thermal characteristics: stable SOC is de-
SOC persistence considers only two pools: (1) one made of            pleted in hydrogen and thermally stable (Barré et al., 2016;
young SOC with a short turnover rate (typically 3 decades            Gregorich et al., 2015). These characteristics are measur-
on average; the active SOC pool) and (2) one made of older           able quickly (ca. 1 h per sample) and at a reasonable cost
SOC that persists much longer in the soil (more than a cen-          (less than USD 60 per sample in private laboratories) using
tury; the stable, passive, or persistent SOC pool). This du-         Rock-Eval® thermal analysis, and they could be of use to
alistic representation of SOC persistence was considered “a          identify the quantitative contribution of stable SOC to total
necessary simplification, but certainly not a utopian one”           SOC. An alternative to the elusive proper separation of sta-
4 decades ago (Balesdent and Guillet, 1982) and is still con-        ble and active SOC pools could thus be to directly predict
sidered meaningful (e.g. Lavallee et al., 2020). The active          their sizes by training a machine-learning model based on
and stable soil organic matter pools contribute differently to       Rock-Eval® data to estimate the size of the stable and ac-
the various soil functions (Hsieh, 1992). The active organic         tive SOC fractions without isolating them from each other
matter pool efficiently fuels soil biological activity (with car-    (Fig. 1). This model would need a training set of soil samples
bon, nutrients, and energy) and plant growth (with nutrients)        for which SOC partitioning into its active and stable pools
through its rapid decay, and it sustains soil structure devel-       can be fairly estimated. Such soil samples are available in
opment (Abiven et al., 2009; Janzen, 2006). Conversely, the          long-term (i.e. at least longer than 3 decades) bare fallow ex-

Geosci. Model Dev., 14, 3879–3898, 2021                                              https://doi.org/10.5194/gmd-14-3879-2021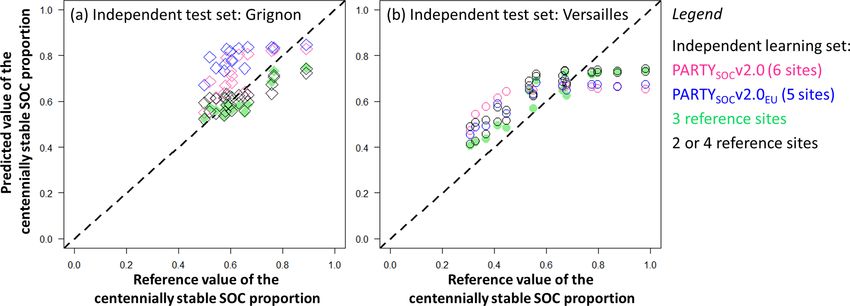
L. Cécillon et al.: Partitioning soil organic carbon kinetic fractions                                                                   3881

Figure 1. Conceptual representation of soil organic carbon fractionation methods vs. the PARTYSOC approach to quantify the size of the
centennially stable and active soil organic carbon fractions. All existing soil organic carbon fractionation methods isolate fractions that are
mixtures of centennially stable and active soil organic carbon. PARTYSOC is a machine-learning model trained on the Rock-Eval® thermal
analysis data for soil samples from long-term experiments in which the size of the centennially stable SOC fraction can be estimated. When
applied to the Rock-Eval® data for unknown topsoils, PARTYSOC partitions soil organic carbon into its active and stable fractions (i.e.
without isolating soil organic carbon fractions from each other). SOC: soil organic carbon. Credits for photos: SOC physical fractionation
methods, Mathilde Bryant; SOC thermal fractionation using Rock-Eval® , Lauric Cécillon.

periments (LTBF; soils kept free of vegetation and thus with              series of technical details. We added a new criterion based
negligible SOC inputs) and long-term vegetation change (C3                on observed SOC content to estimate of the size of the cen-
plants to C4 plants or vice versa) experiments, as described              tennially stable SOC fraction at reference sites to reduce the
by Balesdent et al. (1987, 2018), Barré et al. (2010), Cerri              risk of overestimating this site-specific parameter. We calcu-
et al. (1985), and Rühlmann (1999). Cécillon et al. (2018)                lated the proportion of the centennially stable SOC fraction
used this strategy to develop a machine-learning random for-              differently in reference topsoil samples using SOC content
est regression model for topsoil samples obtained from the                estimated by Rock-Eval® rather than by dry combustion. We
archives of four European long-term agricultural sites in-                changed some criteria regarding the selection of reference
cluding an LTBF treatment. This model, which we propose                   topsoils in the training set of the model: we removed sam-
to name PARTYSOC , related thermal analysis parameters of                 ples from agronomical treatments with compost or manure
topsoils measured with Rock-Eval® to their estimated pro-                 amendments, and preference was given to samples with good
portion of the centennially stable SOC fraction (Fig. 1). This            organic carbon yield in their Rock-Eval® thermal analysis.
previous work positioned PARTYSOC as the first operational                We better balanced the contribution of each reference site to
method quantifying the centennially stable and active SOC                 PARTYSOC v2.0. (4) We also aimed to build a regional ver-
fractions in agricultural topsoils from northwestern Europe.              sion of the model restricted to the reference sites available
However, the ability of this machine-learning model to fairly             in Europe (named PARTYSOC v2.0EU ). (5) Finally, we care-
partition the centennially stable and the active SOC frac-                fully evaluated the performance of the models on unknown
tions of soil samples from new sites in and outside north-                soils, and we further investigated the sensitivity of model per-
western Europe is largely unknown because its training set is             formance to the training and test sets. For clarity, the main
(1) rather limited with a low number of reference sites and               changes between the first version of PARTYSOC (Cécillon et
(2) based on centennially stable SOC contents that are exclu-             al., 2018) and this second version of the model are summa-
sively inferred from plant-free LTBF treatments.                          rized in Supplement Table S1.
   In this study, we aimed to improve the accuracy and
the genericity of the PARTYSOC machine-learning model
that partitions SOC into its centennially stable and active               2     Methods
fractions developed by Cécillon et al. (2018). (1) We in-
creased the range of soil groups, soil texture classes, cli-              2.1    Reference sites and estimation of the centennially
mates, and types of long-term experiments through the ad-                        stable SOC fraction content at each site
dition to the training set of topsoils from three new reference
                                                                          This second version of PARTYSOC uses seven long-term
sites (two additional European long-term agricultural sites
                                                                          study sites as reference sites (i.e. sites where the size of the
with an LTBF treatment and one South American long-term
                                                                          centennially stable SOC fraction can be estimated). The main
vegetation change site). (2) We integrated new predictor vari-
                                                                          characteristics of these seven reference sites, their respective
ables derived from Rock-Eval® thermal analysis. (3) In this
                                                                          soil group, and basic topsoil properties are presented in Sup-
second version of the model, we also changed the following
                                                                          plement Table S2 and more thoroughly in the references cited

https://doi.org/10.5194/gmd-14-3879-2021                                                      Geosci. Model Dev., 14, 3879–3898, 2021
3882 L. Cécillon et al.: Partitioning soil organic carbon kinetic fractions below. Six reference sites for PARTYSOC v2.0 are long-term had a similar shape, as shown in Barré et al. (2010), Cécillon agricultural experiments located in northwestern Europe that et al. (2018), Franko and Merbach (2017), and Quezada et include at least one LTBF treatment. (1) The long-term ex- al. (2019), and it could be modelled using a first-order expo- periment on animal manure and mineral fertilizers (B3 and nential decay with a constant term following Eq. (1): B4 fields) and its adjacent LTBF experiment started in 1956 and terminated in 1985 at the Lermarken site of Askov in γ (t) = ae−bt + c, (1) Denmark (Christensen et al., 2019; Christensen and John- ston, 1997). (2) The static fertilization experiment (V120) where γ (t) (g C kg−1 ) is the total (sites with an LTBF treat- started in 1902, and the fallow experiment (V505a) started ment) or C4 -plant-derived (La Cabaña site) SOC content at in 1988 at Bad Lauchstädt in Germany (Franko and Mer- time t, t (year) is the time under bare fallow (sites with an bach, 2017; Körschens et al., 1998; Ludwig et al., 2007). LTBF treatment) or since pasture conversion to oil palm plan- (3) The “36 parcelles” experiment started in 1959 at Grignon tation (La Cabaña site), and a, b, and c are fitting param- in France (Cardinael et al., 2015; Houot et al., 1989). (4) The eters. Parameter a (g C kg−1 ) corresponds to the content of “42 parcelles” experiment started in 1928 at Versailles in the active SOC fraction and b (yr−1 ) is the characteristic de- France (van Oort et al., 2018). (5) The Highfield bare fallow cay rate. The parameter c (g C kg−1 ) represents the content of experiment started in 1959 at Rothamsted in England (John- theoretically inert SOC. Following Barré et al. (2010), Cécil- ston et al., 2009). (6) The Ultuna continuous soil organic mat- lon et al. (2018), and Franko and Merbach (2017), we con- ter field experiment started in 1956 in Sweden (Kätterer et sidered this parameter c to be a site-specific metric of the al., 2011). These six reference sites are used in the European centennially stable SOC fraction content. As already stated version of the machine-learning model, PARTYSOC v2.0EU . in Cécillon et al. (2018), in our view, the centennially sta- One additional long-term vegetation change site completes ble SOC fraction is not biogeochemically inert; its mean age the reference site list for the PARTYSOC v2.0 global model. and mean residence time in soil are both assumed to be high This site is a 56-year chronosequence of oil palm planta- (centuries) though not precisely defined here. As a result, its tions (with C3 plants) established on former pastures (with decline with time is negligible at the timescale of the long- C4 plants) located in South America (La Cabaña in Colom- term agricultural experiments and the long-term vegetation bia) and sampled as a space-for-time substitution (Quezada change site. We thus considered the centennially stable SOC et al., 2019). fraction content at each experimental site to be constant. In For each reference site, data on total SOC content in top- this study, we used the centennially stable SOC fraction con- soil (0–10 to 0–30 cm depending on the site; Supplement tent already estimated by Franko and Merbach (2017) for the Table S2) were obtained from previously published studies site of Bad Lauchstädt (on the LTBF experiment started in (Barré et al., 2010; Cécillon et al., 2018; Franko and Mer- 1988) and by Cécillon et al. (2018) for the sites of Versailles, bach, 2017; Körschens et al., 1998; Quezada et al., 2019). Grignon, Rothamsted, and Ultuna. We estimated the content Total SOC content was measured by dry combustion with of the centennially stable SOC fraction for the Askov and La an elemental analyser (SOCEA , g C kg−1 ) according to ISO Cabaña sites using the same Bayesian curve-fitting method 10694 (1995) after the removal of soil carbonates using an described by Cécillon et al. (2018). The Bayesian inference HCl treatment for the topsoils of Grignon. For the site of method was performed using Python 2.7 and the PyMC li- La Cabaña, data on 13 C content (measured using an isotope brary (Patil et al., 2010). ratio mass spectrometer coupled to the elemental analyser, For the second version of PARTYSOC , we aimed at reduc- the results being expressed in δ 13 C abundance ratio, which is ing the potential bias towards an overestimation of the cen- ‰ relative to the international standard) were obtained from tennially stable SOC fraction content at reference sites us- Quezada et al. (2019), and the relative contributions of new ing Eq. (1) (Supplement Table S1). This overestimation is (C3 -plant-derived) and old (C4 -plant-derived) carbon to to- possible at reference sites with an LTBF treatment, as SOC tal SOC in topsoils (0–10 cm) were calculated using Eq. (3) inputs to bare fallow topsoils are low but not null (e.g. Jenk- of the paper published by Balesdent and Mariotti (1996), as inson and Coleman, 1994; Petersen et al., 2005). Similarly, done in Quezada et al. (2019). C4 -plant-derived SOC inputs are possible after conversion to Based on these published data, the content of the centen- C3 plants at the site of La Cabaña. We thus used the lowest nially stable SOC fraction (g C kg−1 ) at each reference site observed total (sites with an LTBF treatment) or C4 -plant- was estimated by modelling the decline of total SOC present derived (La Cabaña site) topsoil SOC content value as the at the onset of the experiment with time (sites with an LTBF best estimate of the centennially stable SOC fraction content treatment; SOC inputs are negligible in bare fallow systems) at reference sites where this measured value was lower than or by modelling the decline of C4 -plant-derived SOC present the fitted value of the site-specific parameter c in Eq. (1). at the time of vegetation change with time (La Cabaña site; SOC inputs from C4 plants are negligible after pasture con- version to oil palm plantation). For the seven reference sites, the decline in total SOC or C4 -plant-derived SOC over time Geosci. Model Dev., 14, 3879–3898, 2021 https://doi.org/10.5194/gmd-14-3879-2021
L. Cécillon et al.: Partitioning soil organic carbon kinetic fractions                                                    3883

2.2   Rock-Eval® thermal analysis of topsoil samples             thermogram) measured each second during the pyrolysis
      available from reference sites                             phase and to CO (CO_OX thermogram) and CO2 (CO2_OX
                                                                 thermogram) measured each second during the oxidation
Surface soil samples (0–10 to 0–30 cm depending on the site;     phase (Behar et al., 2001).
see Supplement Table S2) were obtained from the seven ref-          A series of Rock-Eval® parameters was calculated from
erence sites described in Sect. 2.1. As described in Cécil-      these five thermograms. For each thermogram, five temper-
lon et al. (2018), the first version of the PARTYSOC model       ature parameters (all in ◦ C) were retained: T10, T30, T50,
was based on a set of 118 topsoil samples corresponding          T70, and T90, which respectively represent the temperatures
to time series obtained from the soil archives of the sites      corresponding to the evolution of 10 %, 30 %, 50 %, 70 %,
of Rothamsted (12 samples from the LTBF treatment and            and 90 % of the total amount of evolved gas. The calcula-
8 samples from the adjacent long-term grassland treatment),      tion of Rock-Eval® temperature parameters was performed
Ultuna (23 samples from the LTBF treatment and 11 samples        using different intervals of integration depending on the ther-
from the associated long-term cropland treatments), Grignon      mogram. The integration omitted the first 200 s of the anal-
(12 samples from the LTBF treatment, 6 samples from the          ysis for the three thermograms of the pyrolysis phase. The
LTBF plus straw amendment treatment, and 6 samples from          integration ended at the time of analysis corresponding to
the LTBF plus composted straw amendment treatment), and          the maximum oven temperatures of 650 ◦ C (HC_PYR ther-
Versailles (20 samples from the LTBF treatment and 20 sam-       mogram), 560 ◦ C (CO_PYR and CO2_PYR thermograms),
ples from the LTBF plus manure amendment treatment). All         850 ◦ C (CO_OX thermogram), and 611 ◦ C (CO2_OX ther-
118 topsoil samples were previously analysed using Rock-         mogram). These intervals of integration prevented any in-
Eval® thermal analysis (Cécillon et al., 2018).                  terference by inorganic carbon from most soil carbonates,
   For the second version of the machine-learning model, 78      and they ensured comparability with previous studies (Barré
additional topsoil samples were provided by managers of the      et al., 2016; Cécillon et al., 2018; Poeplau et al., 2019;
three new reference sites. A total of 35 topsoil samples were    Soucémarianadin et al., 2018b). Automatic baseline correc-
obtained from the soil archives of the Askov site (19 sam-       tion (as calculated by the software of the Rock-Eval® ap-
ples corresponding to different dates of the LTBF treatment      paratus; Vinci Technologies, France) was performed for all
and 16 samples corresponding to different dates of the as-       thermograms but the CO_PYR and the CO2_PYR thermo-
sociated long-term cropland treatments). A total of 27 top-      grams. This correction can yield some negative values for the
soil samples were obtained from the soil archives of the Bad     CO_PYR and CO2_PYR thermograms of soil samples with
Lauchstädt site (8 samples from two dates of the mechanical      very low SOC content (data not shown). For the HC_PYR
LTBF treatment, 8 samples from two dates of the chemical         thermogram we also determined three parameters reflect-
LTBF treatment, and 11 samples from two dates of several         ing a proportion of thermally resistant or labile hydrocar-
long-term cropland treatments of the static fertilization ex-    bons: a parameter representing the proportion of hydrocar-
periment, with 8 of the latter coming from treatments with       bons evolved between 200 and 450 ◦ C (thermolabile hydro-
manure applications). A total of 16 topsoil samples were ob-     carbons, TLHC index, unitless; modified from Saenger et
tained from the site of La Cabaña (13 samples from different     al., 2013, 2015), as described by Cécillon et al. (2018); a
C3 -plant oil palm fields planted at different dates and three   parameter representing the preservation of thermally labile
samples from different long-term C4 -plant pastures).            hydrocarbons (I index, unitless; after Sebag et al., 2016);
   The 78 additional topsoil samples from Askov, Bad Lauch-      and a parameter representing the proportion of hydrocarbons
städt, and La Cabaña were analysed using the same Rock-          thermally stable at 400 ◦ C (R index, unitless; after Sebag
Eval® 6 Turbo device (Vinci Technologies, France; see Be-        et al., 2016). We also considered the hydrogen index (HI,
har et al., 2001, for a description of the apparatus) and the    mg HC g−1 C) and oxygen index (OIRE6 , mg O2 g−1 C) that
same setup as the one used for the sample set in the first       respectively describe the relative elemental hydrogen and
version of PARTYSOC , described by Cécillon et al. (2018).       oxygen enrichment of soil organic matter (see e.g. Barré et
Briefly, ca. 60 mg of ground (< 250 µm) topsoil samples were     al., 2016). These 30 Rock-Eval® parameters are not directly
subjected to sequential pyrolysis and oxidation phases. The      related to total SOC content and were all included in the first
Rock-Eval® pyrolysis phase was carried out in an N2 atmo-        version of the PARTYSOC model developed by Cécillon et
sphere (3 min isotherm at 200 ◦ C followed by a temperature      al. (2018).
ramp from 200 to 650 ◦ C at a heating rate of 30 ◦ C min−1 ).       In this second version of PARTYSOC , we considered
The Rock-Eval® oxidation phase was carried out in a lab-         10 additional Rock-Eval® parameters as possible predictors,
oratory air atmosphere (1 min isotherm at 300 ◦ C followed       some of these being directly linked to SOC content (Supple-
by a temperature ramp from 300 to 850 ◦ C at a heating           ment Table S1). These 10 parameters were calculated for all
rate of 20 ◦ C min−1 and a final 5 min isotherm at 850 ◦ C).     196 topsoil samples available from the seven reference sites.
Each Rock-Eval® analysis generated five thermograms cor-         They included the content of SOC as determined by Rock-
responding to volatile hydrocarbon effluent (HC_PYR ther-        Eval® (TOCRE6 , g C kg−1 ); the content of soil inorganic car-
mogram), CO (CO_PYR thermogram), and CO2 (CO2_PYR                bon as determined by Rock-Eval® (MinC, g C kg−1 ); the

https://doi.org/10.5194/gmd-14-3879-2021                                           Geosci. Model Dev., 14, 3879–3898, 2021
3884 L. Cécillon et al.: Partitioning soil organic carbon kinetic fractions
content of SOC evolved as HC, CO, or CO2 during the pyrol- yields (95 % on average, linear regression model R 2 = 0.95,
ysis phase of Rock-Eval® (PC, g C kg−1 ); the content of SOC n = 16). For these five reference sites (corresponding to 134
evolved as HC during the temperature ramp (200–650 ◦ C) of reference topsoil samples), we thus used the Rock-Eval® pa-
the pyrolysis phase of Rock-Eval® (S2, g C kg−1 ); the con- rameter TOCRE6 as a measure of the SOC content of top-
tent of SOC that evolved as HC, CO, or CO2 during the first soil samples to calculate their respective proportion of the
200 s of the pyrolysis phase (at ca. 200 ◦ C) of Rock-Eval® centennially stable SOC fraction. Conversely, Rock-Eval®
(PseudoS1, g C kg−1 ; after Khedim et al., 2021); the ratio of analyses of topsoil samples from the sites of Askov and Bad
PseudoS1 to PC (PseudoS1 / PC, unitless); the ratio of Pseu- Lauchstädt showed moderate organic carbon yields (90 % on
doS1 to TOCRE6 (PseudoS1 / TOCRE6 , unitless); the ratio of average for topsoils of Askov, with a noisy linear regres-
S2 to PC (S2 / PC, unitless; after Poeplau et al., 2019); the ra- sion model, R 2 = 0.68, n = 30; 92 % on average for topsoils
tio of PC to TOCRE6 (PC / TOCRE6 , unitless); and the ratio of of Bad Lauchstädt, yet with a very good linear regression
HI to OIRE6 (HI / OIRE6 , mg HC mg−1 O2 ). TOCRE6 , MinC, model, R 2 = 0.96, n = 11). Using the total carbon measured
PC, HI, and OIRE6 were obtained as default parameters from by Rock-Eval® (i.e. the sum of TOCRE6 plus MinC Rock-
the software of the Rock-Eval® apparatus (Vinci Technolo- Eval® parameters) as an estimate of the SOC content of top-
gies, France). All other Rock-Eval® parameters were cal- soil samples for these two sites – that are not carbonated –
culated from the integration of the five thermograms using increased the organic carbon yield of Rock-Eval® analyses
R version 4.0.0 (R Core Team, 2020; RStudio Team, 2020) (96 % on average at Askov, still with a noisy linear regression
and functions from the R packages hyperSpec (Beleites and model, R 2 = 0.66, n = 30; 101 % on average at Bad Lauch-
Sergo, 2020), pracma (Borchers, 2019), and stringr (Wick- städt, with a very good linear regression model, R 2 = 0.95,
ham, 2019). n = 11). For the two reference sites of Askov and Bad Lauch-
städt (corresponding to 62 topsoil samples), we thus used the
2.3 Determination of the centennially stable SOC sum of Rock-Eval® parameters TOCRE6 plus MinC as a mea-
fraction proportion in topsoil samples from the sure of the SOC content of topsoil samples to calculate their
reference sites proportion of the centennially stable SOC fraction.
The uncertainty in the proportion of the centennially stable
Following the first version of PARTYSOC (Cécillon et al., SOC fraction was calculated using Eq. (6) in the paper pub-
2018), the proportion of the centennially stable SOC frac- lished by Cécillon et al. (2018), propagating the uncertainties
tion in a topsoil sample of a reference site was calculated in SOC content data (using a standard error of 0.5 g C kg−1
as the ratio of the site-specific centennially stable SOC frac- following Barré et al., 2010) and in the site-specific contents
tion content (see Sect. 2.1) to the SOC content of this par- of the centennially stable SOC fraction (see above and Ta-
ticular sample. We thus assume that the centennially stable ble 1).
SOC fraction content in topsoils is the same in the various
agronomical treatments of a reference site and that it remains 2.4 Selection of the training set and of meaningful
constant within the time period studied at each site. Rock-Eval® predictor variables for PARTYSOC v2.0
While for the first version of PARTYSOC , the proportion
of the centennially stable SOC fraction in reference topsoils In machine learning, the selection of the model training and
was inferred using SOC contents determined by elemental test sets influences the performance of the model, just like
analysis (SOCEA ), in this second version, we preferred the the selection of the predictor variables: here, the Rock-Eval®
SOC content determined by Rock-Eval® (Table S1). The rea- parameters (e.g. Cécillon et al., 2008; Wehrens, 2020).
son behind this choice was to link the Rock-Eval® parame- For this second version of PARTYSOC , we changed some
ters measured in a reference topsoil sample to an inferred criteria regarding the inclusion of the available reference top-
proportion of the centennially stable SOC fraction that bet- soil samples in the training set of the model (Supplement
ter reflected the organic carbon that actually evolved during Table S1). We excluded from the training set all the topsoil
its Rock-Eval® analysis. This choice was possible for refer- samples experiencing agronomical treatments that may have
ence topsoil samples for which Rock-Eval® analyses showed changed the site-specific content of the centennially stable
a good organic carbon yield (TOCRE6 divided by SOCEA and SOC fraction, in contradiction to our hypothesis of a constant
multiplied by 100). This is generally the case for most soils, content of this fraction at each reference site (see Sect. 2.3).
with typical organic carbon yields from Rock-Eval® ranging These agronomical treatments concern the repeated applica-
from 90 to 100 % SOCEA (Disnar et al., 2003). For the top- tion of some types of exogenous organic matter such as com-
soils of the sites of Grignon, Rothamsted, Ultuna, and Ver- post or manure, which we suspect may increase the content
sailles used in the first version of PARTYSOC , the organic of the centennially stable SOC fraction after several decades.
carbon yield from Rock-Eval® was greater than 96 % (lin- Therefore, we excluded all reference topsoil samples from
ear regression model, R 2 = 0.97, n = 118; Cécillon et al., plots that experienced repeated applications of composted
2018). Similarly, Rock-Eval® analyses of topsoil samples straw (six samples from Grignon) or manure (20 samples
from the site of La Cabaña showed very good organic carbon from Versailles and 8 samples from Bad Lauchstädt) from
Geosci. Model Dev., 14, 3879–3898, 2021 https://doi.org/10.5194/gmd-14-3879-2021L. Cécillon et al.: Partitioning soil organic carbon kinetic fractions 3885
Table 1. Main statistics for soil organic carbon contents, site-specific contents of the centennially stable SOC fraction, and resulting pro-
portions of centennially stable SOC fraction in topsoils of the seven reference sites used as the training sets for PARTYSOC v2.0 and
PARTYSOC v2.0EU . More details on agronomical treatments and sampling year of reference topsoil samples are provided in Supplement
Table S3. Abbreviations are as follows. SOC: soil organic carbon; LTBF: long-term bare fallow; min: minimum; max: maximum; SD:
standard deviation.
Reference site Treatments SOC content of the ref- Centennially stable SOC Proportion of the centen-
(country) (number of samples) erence soil samples fraction content nially stable SOC fraction
(g C kg−1 ) (g C kg−1 ) (unitless)
mean (min, max, SD) mean (SD) mean (min, max, SD)
measurement method estimation method
Versailles LTBF (n = 15) 10.4 (5.6, 17.9, 3.9) 5.50 (0.50) 0.60 (0.31, 0.98, 0.20)
(France) TOCRE6 Lowest SOCEA measured
on-site
Rothamsted Grassland (n = 7) 28.3 (12.2, 41.5, 10.1) 9.72 (0.50) 0.40 (0.23, 0.80, 0.18)
(England) Lowest SOCEA measured
on-site
LTBF (n = 8) TOCRE6
Ultuna Cropland (n = 3; 15.2 (10.0, 20.3, 2.8) 6.95 (0.88) 0.47 (0.34, 0.70, 0.09)
(Sweden) + straw n = 8) Bayesian curve fitting
LTBF (n = 4) TOCRE6
Grignon LTBF (n = 12, 11.5 (8, 14.3, 1.7) 7.12 (1.00) 0.63 (0.50, 0.89, 0.10)
(France) + straw n = 3) TOCRE6 Bayesian curve fitting
Askov Cropland (n = 7) 13.8 (11.1, 16.8, 1.9) 5.10 (0.88) 0.38 (0.30, 0.46, 0.05)
(Denmark) LTBF (n = 8) TOCRE6 +MinC Bayesian curve fitting
Bad Lauchstädt Cropland (n = 1) 18.0 (16.8, 19.4, 0.6) 15.00 (0.50) 0.84 (0.77, 0.89, 0.03)
(Germany) LTBF (n = 14) TOCRE6 +MinC Lowest SOCEA measured
on-site
La Cabaña Pasture (n = 3) 17.8 (10.2, 31.8, 5.7) 4.75 (0.50) 0.29 (0.15, 0.47, 0.10)
(Colombia) Oil palm plantation TOCRE6 Lowest SOCEA measured
(n = 12) on-site
Reference soil sample set of 16.4 (5.6, 41.5, 7.3) 0.52 (0.15, 0.98, 0.21)
PARTYSOC v2.0 (n = 105)
Reference soil sample set of 16.2 (5.6, 41.5, 7.5) 0.55 (0.23, 0.98, 0.20)
PARTYSOC v2.0EU (n = 90)
the training set of the model. Yet, we kept some reference Contrary to the first version of PARTYSOC , this second
topsoil samples from Grignon and Ultuna experiencing re- version is based on a balanced contribution of each reference
peated applications of straw. site (Supplement Table S1). Each reference site contributes to
We also excluded from the training set of the model the the model with 15 samples so that the reference sample set of
reference topsoil samples for which the organic carbon yield PARTYSOC v2.0 is composed of 105 topsoil samples (90 for
from Rock-Eval® is below 86 % or above 116 %. For the site the European version of the model PARTYSOC v2.0EU ). Be-
of Askov, with a noisy relationship between SOCEA and the sides the above-mentioned exclusion criteria (that excluded
sum TOCRE6 plus MinC (see Sect. 2.3), we excluded the five 49 of the 196 topsoil samples available from the seven refer-
samples without an SOCEA measurement preventing the cal- ence sites), the 15 topsoil samples retained for each reference
culation of the organic carbon yield from their Rock-Eval® site were selected (1) to have a range of the proportion of
analysis. Conversely, for the site of Bad Lauchstädt we kept the centennially stable SOC fraction as wide as possible and
topsoil samples without available SOCEA measurements, as (2) to have the best organic carbon yield from Rock-Eval®
the linear relationship between SOCEA and the sum TOCRE6 analysis. On average, the organic carbon yield of the Rock-
plus MinC was very good for this site (see Sect. 2.3). These Eval® analyses for the retained training set of reference top-
criteria regarding the organic carbon yield from Rock-Eval® soil samples (calculated as described above) was greater than
lead to the exclusion of nine samples from the site of Askov, 98 % SOCEA (SOCDETERMINED_BY_ROCK-EVALr = 0.9924
four additional samples from the site of Versailles, and two SOCEA − 0.1051, R 2 = 0.99, n = 91 topsoil samples with
from the site of Ultuna. available SOCEA measurements). The list of the 105 ref-
https://doi.org/10.5194/gmd-14-3879-2021 Geosci. Model Dev., 14, 3879–3898, 20213886 L. Cécillon et al.: Partitioning soil organic carbon kinetic fractions
erence topsoil samples retained as the training set for Eval® parameters (see Sect. 2.4) as candidates at each split
PARTYSOC v2.0 is provided in Table S3. This list includes, of the regression tree, and it used a minimum size of terminal
for each reference topsoil sample, information on its refer- tree nodes of five topsoil samples. The relative importance
ence site, land cover, agronomical treatment, sampling year, (i.e. ranking) of each selected Rock-Eval® parameter in the
and values for the 40 Rock-Eval® parameters. regression models was computed as the unscaled permuta-
The 40 Rock-Eval® parameters calculated (see Sect. 2.2) tion accuracy (Strobl et al., 2009).
captured most of the information related to SOC thermal The performance of PARTYSOC v2.0 and
stability, elemental stoichiometry, and content that is con- PARTYSOC v2.0EU was assessed by statistical metrics
tained in the five Rock-Eval® thermograms. However, not comparing the predicted vs. the estimated values of their
all Rock-Eval® parameters necessarily carry meaningful in- reference topsoil sample set using three complementary
formation for partitioning SOC into its centennially stable validation procedures. First, the predictive ability of both
and active fractions (Cécillon et al., 2018). PARTYSOC v2.0 models was assessed by an “internal” procedure that
and its European version PARTYSOC v2.0EU incorporate as used their respective whole reference topsoil sample sets
predictor variables only the Rock-Eval® parameters show- (n = 105 samples for PARTYSOC v2.0, n = 90 samples
ing a strong relationship with the proportion of the centen- for PARTYSOC v2.0EU ). For this procedure, performance
nially stable SOC fraction (Supplement Table S1). The ab- statistics were calculated only for the “out-of-bag” topsoil
solute value of 0.50 for the Spearman’s ρ (nonparametric samples of the whole reference sets using a random seed of
and nonlinear correlation test) was used as a threshold to se- 1 to initialize the pseudorandom number generator of the
lect meaningful Rock-Eval® predictor variables (calculated R software. Out-of-bag samples are observations from the
from the reference topsoil sample set for the PARTYSOC v2.0 training set not used for a specific regression tree that can be
model, n = 105). Basic statistics of all Rock-Eval® parame- used as a “built-in” test set for calculating its prediction ac-
ters (training set for PARTYSOC v2.0) are reported in Supple- curacy (Strobl et al., 2009). Second, the predictive ability of
ment Table S4. the models was assessed by a “random splitting” procedure
that randomly split their respective reference topsoil sample
2.5 Random forest regression models to predict the sets into a test set (made of n = 30 samples) and a training
proportion of the centennially stable SOC fraction set (n = 75 samples for PARTYSOC v2.0, n = 60 samples for
from Rock-Eval® parameters, performance PARTYSOC v2.0EU ). This procedure was repeated 15 times
assessment, and error propagation in the models using random seeds from 1 to 15 in the R software. Third, a
fully independent “leave-one-site-out” procedure was used
The PARTYSOC v2.0 machine-learning model consists of a to assess the predictive ability of the models. This procedure
nonparametric and nonlinear multivariate regression model successively excludes topsoil samples of one reference site
relating the proportion of the centennially stable SOC frac- from the training set and uses them as a test set (n = 15) for
tion (response vector or dependent variable y) of the refer- the models. It used the random seed of 1 in the R software.
ence soil sample set (n = 105 topsoil samples from the seven For the second and third procedures, performance statistics
reference sites; see Sect. 2.4) to their Rock-Eval® parameters were calculated (1) for the out-of-bag topsoil samples of
summarized by a matrix of predictor variables (X) made up the training sets and (2) for the topsoil samples of the test
of the selected centred and scaled Rock-Eval® parameters. sets. The leave-one-site-out validation should be seen as
As stated above, we also built a regional (European) version the procedure giving the most accurate estimation of the
of the model based on the six European reference sites only uncertainty of both regression models for unknown topsoil
(PARTYSOC v2.0EU , using the 90 reference topsoil samples samples.
from Askov, Bad Lauchstädt, Grignon, Rothamsted, Ultuna, Finally, we assessed the sensitivity of model performance
and Versailles). to the training and the test sets. For both sensitivity analyses,
Like the first version of PARTYSOC , this second ver- only the leave-one-site-out validation procedure was used
sion uses the machine-learning algorithm of random forests– (based exclusively on independent training and test sets).
random inputs (hereafter termed random forests) proposed First, model sensitivity to the training set was assessed as its
by Breiman (2001). This algorithm aggregates a collec- sensitivity to the independent reference sites included in the
tion of random regression trees (Breiman, 2001; Genuer training set. It was performed successively using, as exam-
and Poggi, 2020). PARTYSOC v2.0 and its European version ples, two different test sets consisting of independent soils
PARTYSOC v2.0EU are based on a forest of 1000 different re- from the reference sites of Grignon and Versailles. Several
gression trees made of splits and nodes. The algorithm of ran- random forest regression models were built using, as train-
dom forests combines bootstrap resampling and random vari- ing sets, combinations of topsoil samples from a decreasing
able selection. Each of the 1000 regression trees was grown number of the remaining reference sites on the basis of their
on a bootstrapped subset of the reference topsoil sample set potential proximity to the topsoil samples of the test sets re-
(i.e. containing ca. two-thirds of “in-bag” samples). The al- garding their pedological or climatic conditions. The size of
gorithm randomly sampled one-third of the selected Rock- the various training sets ranged from n = 90 samples (six ref-
Geosci. Model Dev., 14, 3879–3898, 2021 https://doi.org/10.5194/gmd-14-3879-2021L. Cécillon et al.: Partitioning soil organic carbon kinetic fractions 3887
erence sites) to n = 30 samples (only two reference sites). 5.10 g C kg−1 at the site of Askov (SD = 0.88 g C kg−1 ) and
Second, model sensitivity to the test set was assessed as its 5.12 g C kg−1 at the site of La Cabaña (SD = 0.35 g C kg−1 ).
sensitivity to independent test samples (1) from a reference The fitted values of parameter c in Eq. (1) for all reference
soil group (FAO, 2014) not existing in the training set (i.e. sites and their standard errors are provided in Supplement Ta-
excluding Chernozem soil samples from the test set) (2) that ble S2. A total (reference sites with an LTBF treatment) or a
are unlikely to be encountered in agricultural soils (i.e. ex- C4 -plant-derived (La Cabaña site) SOC content value lower
cluding from the test set soils sampled at late dates of bare than the fitted value of the site-specific parameter c in Eq. (1)
fallow treatments more than 25 years after the experiment was measured at four of the seven reference sites for the
onset, which cannot represent soils with regular carbon in- PARTYSOC v2.0 model. At Bad Lauchstädt, an SOCEA value
put). Model sensitivity to the test set was performed only for of 15.0 g C kg−1 was reported by Körschens et al. (1998)
PARTYSOC v2.0EU to further investigate its predictive ability for topsoils of the well ring experiment (Ansorge, 1966). At
for soil samples from independent Cambisols and Luvisols Rothamsted, an SOCEA measurement of 9.72 g C kg−1 was
of northwestern Europe. reported for topsoils of the Highfield LTBF experiment by
Several statistics were used to assess the predictive ability Cécillon et al. (2018). At Versailles, an SOCEA measure-
of the regression models. The coefficient of determination, ment of 5.50 g C kg−1 was reported after 80 years of bare
2
ROOB , was calculated for the out-of-bag samples of the train- fallow by Barré et al. (2010). At La Cabaña, a C4 -plant-
ing set, and R 2 was calculated for the samples of the test set. derived SOC content of 4.75 g C kg−1 was calculated using
The root mean square error of prediction, RMSEPOOB , was data from Quezada et al. (2019). These values did not dif-
calculated for the out-of-bag samples of the training set, and fer strongly from the values of the centennially stable SOC
RMSEP was calculated for the samples of the test set. The contents calculated from the Bayesian curve-fitting method
relative RMSEP, R RMSEP, was calculated as the ratio of the (Tables 1, S2). In particular, the hierarchy in the centenni-
RMSEP to the mean value of the test set. The ratio of per- ally stable SOC content of the seven reference sites was un-
formance to interquartile range (RPIQ) was calculated as the changed whatever the calculation method. These values were
ratio of the interquartile range of the test set (Q3–Q1, which retained as the best estimates of the site-specific content of
gives the range accounting for 50 % of the test set around its the centennially stable SOC fraction in topsoils of the four
median value) to the RMSEP (Bellon-Maurel et al., 2010). sites to reduce the risk of overestimating the actual value
The bias of the random forest regression models was calcu- of the centennially stable SOC content compared to the first
lated as the mean of the model predictions for the test set mi- published version of the model (see Sect. 2.1; Tables 1 and
nus the actual mean of the test set. Additionally, site-specific S1). As these site-specific values of the centennially stable
RMSEP and R RMSEP were calculated for the leave-one-site- SOC fraction content were derived from SOCEA measure-
out procedure (with the 15 independent test samples from ments, we attributed a standard deviation of 0.50 g C kg−1 to
each site). The uncertainty in the model predictions for new each of them following Barré et al. (2010). The final esti-
topsoils was determined using a methodology that was fully mates of the content of the centennially stable SOC fraction
described by Cécillon et al. (2018). This methodology was at the seven reference sites that were used in PARTYSOC v2.0
adapted after the work of Coulston et al. (2016) to explicitly are provided in Table 1. They varied by a factor of 3 across
take into account the uncertainty in the reference values of the reference sites, ranging from 4.75 g C kg−1 at La Cabaña
the proportion of the centennially stable SOC fraction (see to 15.00 g C kg−1 at Bad Lauchstädt. The lowest value of the
Sect. 2.3) that were used to build the models (Cécillon et al., topsoil content of the centennially stable SOC fraction used
2018). in PARTYSOC v2.0EU differed only slightly from the one of
PARTYSOC v2.0 and PARTYSOC v2.0EU were programmed PARTYSOC v2.0 (5.10 g C kg−1 at the site of Askov).
as R scripts in the RStudio environment software (RStudio
Team, 2020) and were run using the R version 4.0.0 (R Core 3.2 Content and biogeochemical stability of SOC in the
Team, 2020). The R scripts use the random forest algorithm training sets and selection of meaningful
of the randomForest R package (Liaw and Wiener, 2002) Rock-Eval® parameters as predictor variables for
and the boot R package for bootstrapping (Canty and Rip- the PARTYSOC v2.0 and PARTYSOC v2.0EU models
ley, 2020; Davison and Hinkley, 1997).
The SOC content in the topsoil samples of the seven refer-
ence sites ranged from 5.6 to 41.5 g C kg−1 in the training
3 Results sets for the PARTYSOC v2.0 (n = 105) and PARTYSOC v2.0EU
(n = 90) models (Table 1). As shown in Table 1, this resulted
3.1 Content of the centennially stable SOC fraction at in proportions of the centennially stable SOC fraction rang-
the reference sites ing from 0.15 to 0.98 (PARTYSOC v2.0 training set) and from
0.23 to 0.98 (PARTYSOC v2.0EU training set). All 25 calcu-
The two newly fitted values of the centennially stable SOC lated Rock-Eval® temperature parameters showed positive
fraction content (i.e. parameter c in Eq. 1; see Sect. 2.1) were values of Spearman’s ρ coefficient with the response variable
https://doi.org/10.5194/gmd-14-3879-2021 Geosci. Model Dev., 14, 3879–3898, 20213888 L. Cécillon et al.: Partitioning soil organic carbon kinetic fractions
of the PARTYSOC v2.0 model (n = 105; with Spearman’s ρ 0.18 (0.17 at Versailles for PARTYSOC v2.0, 0.18 at Grignon
values up to 0.81 for T90HC_PYR ; Table 2). While the inor- for PARTYSOC v2.0EU ; Table 3b), with remarkably low site-
ganic carbon content was not correlated with the proportion specific RMSEPs for the sites of Askov (below 0.05 for
of the centennially stable SOC fraction, TOCRE6 was signif- both models) and Ultuna (0.06 for PARTYSOC v2.0; 0.09 for
icantly and negatively correlated with the response variable PARTYSOC v2.0EU ).
of the PARTYSOC v2.0 model (Spearman’s ρ = −0.55; The most important Rock-Eval® parameter for predict-
Table 2). Other Rock-Eval® parameters linked to soil carbon ing the proportion of the centennially stable SOC fraction
content showed a stronger relationship than TOCRE6 with is S2 for both PARTYSOC v2.0 and PARTYSOC v2.0EU (Ta-
the proportion of the centennially stable SOC fraction. ble 2). Conversely, the two models show only two Rock-
This was the case for S2 and PC that showed the highest Eval® parameters in common of their five most important
absolute Spearman’s ρ coefficients, with a highly significant ones: S2, PC, PC / TOCRE6 , T70CO2_OX , and T90HC_PYR
negative relationship (Spearman’s ρ = −0.85; Table 2). A for PARTYSOC v2.0 and S2, T50CO2_PYR , PC, S2 / PC, and
total of 18 of the 40 calculated Rock-Eval® parameters HI / OIRE6 for PARTYSOC v2.0EU (Table 2).
showed an absolute value of Spearman’s ρ above 0.5 with
the proportion of the centennially stable SOC fraction in the 3.4 Sensitivity of model performance to the training
training set of the PARTYSOC v2.0 model (n = 105; Table 2) and test sets
and were thus retained as predictor variables for the models.
The 18 Rock-Eval® parameters retained were the Rock- The sensitivity analysis to the training set showed that re-
Eval® temperature parameters T70HC_PYR , T90HC_PYR , stricting the model training set to samples from fewer refer-
T30CO2_PYR , T50CO2_PYR , T70CO2_PYR , T90CO2_PYR , ence sites with pedoclimatic conditions closer to the ones of
T70CO_OX , T50CO2_OX , T70CO2_OX , and T90CO2_OX and a fully independent test site changed its performance (Fig. 3).
the Rock-Eval® parameters PseudoS1, S2, S2 / PC, HI, Removing from the training set a reference site with a climate
HI / OIRE6 , PC, PC / TOCRE6 , and TOCRE6 . (i.e. La Cabaña) or a soil group (i.e. Bad Lauchstädt) differ-
ing strongly from the independent test sites (here, Grignon
3.3 Performance assessment of the PARTYSOC v2.0 and and Versailles used as examples) reduced the site-specific
PARTYSOC v2.0EU machine-learning models RMSEP and R RMSEP of the model (Supplement Table S5).
When Grignon or Versailles were used as independent test
Using both the internal and the random splitting performance sites, the model with the best predictive ability (i.e. the low-
assessment procedures (see Sect. 2.5), the PARTYSOC v2.0 est site-specific RMSEP and R RMSEP) used a training set
and PARTYSOC v2.0EU models showed good to very good composed of 45 topsoil samples from three European refer-
predictive ability for the proportion of the centennially sta- ence sites (including the French site with the closest climate,
ble SOC fraction (Fig. 2a; Table 3a). For most of the despite its different soil group; Supplement Tables S2 and
calculated statistics, the European version of the model S5; Fig. 3).
PARTYSOC v2.0EU showed better performance than the The sensitivity analysis to the test set showed that when
PARTYSOC v2.0 model (Table 3). Using the random splitting excluding Chernozem samples from the test set (i.e. val-
procedure, the mean R 2 of PARTYSOC v2.0EU was 0.87 (0.81 idating the model exclusively with independent samples
for PARTYSOC v2.0); its RMSEP and R RMSEP were respec- from Cambisols or Luvisols), the performance statistics of
tively 0.07 and 0.13 (0.09 and 0.17 for PARTYSOC v2.0), and PARTYSOC v2.0EU were improved (leave-one-site-out vali-
its mean RPIQ was 4.6 (3.6 for PARTYSOC v2.0). The bias dation procedure: R 2 of 0.56; RMSEP of 0.13; n = 75). The
was low for both models (Table 3a). further removal of independent test soils that are unlikely to
The predictive ability of both models decreased when as- be encountered in agricultural Cambisols and Luvisols (soils
sessed using the leave-one-site-out procedure (see Sect. 2.5; sampled at late dates of bare fallow treatments more than 25
Fig. 2b). Again, PARTYSOC v2.0EU showed better perfor- years after the experiment onset) also improved the perfor-
mance statistics than the PARTYSOC v2.0 model (Table 3; mance statistics of PARTYSOC v2.0EU (Supplement Fig. S1;
Fig. 2b), with an R 2 of 0.45, an RMSEP of 0.15, an R RMSEP leave-one-site-out validation procedure: R 2 of 0.71; RMSEP
of 0.27, and an RPIQ of 2.4. The PARTYSOC v2.0 model of 0.11; n = 58).
poorly predicted the proportion of the centennially stable
SOC fraction in topsoil samples of two sites (Table 3b;
Fig. 2b): La Cabaña (overestimation; with a site-specific RM- 4 Discussion
SEP of 0.28) and Bad Lauchstädt (underestimation; with a
site-specific RMSEP of 0.32). The proportion of the centen- The second version of the PARTYSOC machine-learning
nially stable SOC fraction in topsoil samples of Bad Lauch- model incorporates a large number of modifications and im-
städt remained underestimated by the PARTYSOC v2.0EU provements (Table S1), and its predictive ability was more
model, though with a reduced site-specific RMSEP (0.23; Ta- thoroughly assessed compared to the first version of the
ble 3b; Fig. 2b). All other site-specific RMSEPs were below model (Cécillon et al., 2018). The critical examination of the
Geosci. Model Dev., 14, 3879–3898, 2021 https://doi.org/10.5194/gmd-14-3879-2021L. Cécillon et al.: Partitioning soil organic carbon kinetic fractions 3889
Table 2. Spearman’s rank correlation coefficient test between the 40 calculated Rock-Eval® parameters and the proportion of the centennially
stable organic carbon fraction in the reference topsoil sample set of the PARTYSOC v2.0 model (n = 105), with the variable importance (rank-
ing) of the 18 selected Rock-Eval® parameters for predicting the proportion of the centennially stable SOC fraction in the PARTYSOC v2.0
and PARTYSOC v2.0EU random forest regression models. See Sect. 2.2 for a description of the units of the 40 Rock-Eval® parameters. The
18 Rock-Eval® parameters retained as predictor variables for the second version of PARTYSOC are shown in bold. SOC: soil organic carbon.
Rock-Eval® Spearman’s ρ with p value Variable importance to Variable importance to
parameter with the proportion of predict the proportion of the predict the proportion of the
the centennially stable centennially stable SOC fraction centennially stable SOC fraction
SOC fraction in the PARTYSOC v2.0 in the PARTYSOC v2.0EU
regression model (rank) regression model (rank)
T10HC_PYR 0.38 0.0001 – –
T30HC_PYR 0.47 0.0000 – –
T50HC_PYR 0.46 0.0000 – –
T70HC_PYR 0.54 0.0000 17 15
T90HC_PYR 0.81 0.0000 5 13
T10CO_PYR 0.40 0.0000 – –
T30CO_PYR 0.36 0.0001 – –
T50CO_PYR 0.33 0.0005 – –
T70CO_PYR 0.31 0.0014 – –
T90CO_PYR 0.31 0.0013 – –
T10CO2_PYR 0.35 0.0003 – –
T30CO2_PYR 0.56 0.0000 12 10
T50CO2_PYR 0.55 0.0000 8 2
T70CO2_PYR 0.55 0.0000 10 7
T90CO2_PYR 0.58 0.0000 11 11
T10CO_OX 0.31 0.0013 – –
T30CO_OX 0.41 0.0000 – –
T50CO_OX 0.49 0.0000 – –
T70CO_OX 0.58 0.0000 9 16
T90CO_OX 0.33 0.0007 – –
T10CO2_OX 0.10 0.3349 – –
T30CO2_OX 0.39 0.0000 – –
T50CO2_OX 0.63 0.0000 13 14
T70CO2_OX 0.70 0.0000 4 12
T90CO2_OX 0.60 0.0000 14 17
I index −0.40 0.0000 – –
R index 0.47 0.0000 – –
TLHC index −0.49 0.0000 – –
HI –0.72 0.0000 7 6
OIRE6 −0.09 0.3504 – –
TOCRE6 –0.55 0.0000 6 9
MinC 0.03 0.7430 – –
PC –0.85 0.0000 2 3
S2 –0.85 0.0000 1 1
PseudoS1 –0.50 0.0000 18 18
PseudoS1 / PC 0.28 0.0033 – –
PseudoS1 / TOCRE6 −0.06 0.5702 – –
S2 / PC –0.70 0.0000 16 4
PC / TOCRE6 –0.71 0.0000 3 8
HI / OIRE6 –0.68 0.0000 15 5
https://doi.org/10.5194/gmd-14-3879-2021 Geosci. Model Dev., 14, 3879–3898, 2021You can also read