Large-scale agent-based transport demand model for Singapore - Alex Erath Pieter Fourie Michael van Eggermond Sergio Ordóñez Artem Chakirov Kay ...
←
→
Page content transcription
If your browser does not render page correctly, please read the page content below
Large-scale agent-based transport demand model
for Singapore

Alex Erath
Pieter Fourie
Michael van Eggermond
Sergio Ordóñez
Artem Chakirov
Kay Axhausen

Working paper

                                       June 2012
Large-scale agent-based transport demand model for Singapore June 2012
1 Introduction
1.1 Context and Motivation
This century will, for the first time, see over half the world’s population living in cities UN (2007).
Making these urban structures environmentally, economically and socially sustainable and
liveable is one of today’s great challenges. Due to its central importance of cities’ infrastructure
and performance, one key element to meet this challenge is transportation. Embedded in the
Singapore National Research Foundation’s initiative Campus for Excellence and Technological
Enterprise CREATE, one project of the Future Cities Laboratory approaches the challenges of
urban transportation planning that stem from managing, planning and optimising the flow of
people and goods at different time scales and in its interaction with all elements of the future
city. The basis of the research framework is a full implementation of the open-source multi-
agent-based travel demand simulation MATSim 1 for the case of Singapore. The combination of
a variety of advanced transport demand policies such as time dependent road pricing, a multi-
modal public transport system and the dynamic further development of transport infrastructure
makes Singapore arguably one of the most interesting places for an implementation of agent
based transport demand model.
Open-source MATSim is one of a group of agent-based models that have recently been developed
to realise the potential of the activity-based approach into practise Bradley and Bowman (2006).
In line with the activity-based approach (Jones et al., 1983), MATSim is based on the idea of
the 24h daily activity schedule as the basic behavioural unit. In contrast to all other current
agent-based models, except TRANSIMS Beckmann et al. (2007), MATSim employs fully
integrated traffic flow simulations for both private and public transport including dynamic
road pricing to calculate the generalised costs of travel implied by the schedule. In addition,
MATSim is designed for speed and scale, which allows it to address large-scale and finely
detailed scenarios, for example, Switzerland which has 7.5 million agents, 1.0 million links and
1.0 million destinations, and, to find a steady state solution with acceptable computing efforts
(Balmer et al. (2010), Meister et al. (2009)), Toronto (Gao et al., 2010), Berlin (Rieser et al.,
2008) or Tel-Aviv (Bekhor et al., 2011).
1.2 Objectives
This paper presents the development of a large-scale the agent-based transport model for
Singapore using MATSim. Earlier papers on MATSim implementations have focused on
software architecture and simulation times (Balmer et al., 2010) and conversion of an existing
1
See http://www.matsim.org
1Large-scale agent-based transport demand model for Singapore June 2012
transport demand model to MATSim (Bekhor et al., 2011). In this paper, the design of the
demand modeling process including all necessary sub-models, its sequence and thorough
validation is central. Special attention is paid on the additional sub-models, which became
necessary due to restricted availability of key data needed for agent-based transport demand
modeling.
2 General Framework
2.1 Activity based transport demand modeling
The general aim of multi-agent simulation is a to integrate activity-based demand generation with
dynamic traffic assignment. Activity-based demand generation models generate a sequential list
of activities and trips connecting these activities for every person in the study area. Demand
generation is embedded in a concept of daily activity demand from which the need for transport
is derived (Kitamura, 1988). A major advantage of activity-based demand modeling is that both
the spatial and temporal consistency of travel behavior can be ensured. For example, mode
choice can be formulated on a subtour level, since the mode chosen for one trip may influence the
mode choice for other trips of a given subtour (Ciari et al., 2008). This is superior to traditional
demand generation where aggregate traffic quantities represent isolated trips. Furthermore, not
only temporal dynamics, but also temporal interdependency of activities and trips are inherently
modeled. For example, a delay of scheduled activities caused by increased travel time due to
congestion is propagated through the day and can either result in shortened or further postponed
activities.
Several approaches a wide variety of methods have been developed to generate daily activity
plans. On the one hand, random utility theory is used to generate daily activity plans. Examples
are SACSIM for the Sacramento Area, California, and the comprehensive econometric mi-
crosimulator for daily activity-travel patterns (CEMDAP) applied to the Dallas-Fort Worth Area
(Bradley et al., 2010; Bhat et al., 2004). On the other hand, in a rule-based approach demand
generation is based on psychological decision rules observed in travel diary or stated-adaptation
surveys. Examples include the travel activity scheduler for household agents (TASHA) for the
Greater Toronto Area, and the learning-based simulation system ALBATROSS recently applied
to the Netherlands in the context of an air-quality study (Roorda et al., 2008; Beckx et al., 2009).
Most of the above approaches to generate a regional transport model have in common that only
the first three steps of the traditional four-step model are performed on the basis of individual
travelers. For the traffic assignment step, the trips listed in the activity plans are independently
aggregated to time-dependent (typically hourly) OD matrices which are fed into a dynamic traffic
2Large-scale agent-based transport demand model for Singapore June 2012
assignment (DTA) (Watling, 1996). Examples of DTA implementations are a dynamic version
of VISUM (Vrtic and Axhausen, 2003), DynaMIT (Ben-Akiva et al., 2002) and Dynasmart
(Mahmassani et al., 1992).
Conceptually, the iterative procedure of DTA can be extended to other dimensions of travel
decisions beyond route choice. Examples are “best-reply” models for departure time choice
(de Palma and Marchal, 2002; Ettema et al., 2005) or optimal mode choice. Elements of demand
generation are thus elevated from a simple pre-process to an integrated part of demand-supply
equilibration, as mode choice, departure time choice or even the activity sequence may be
susceptible to changes in traffic patterns.
One major constraint of the DTA based approach is that information on individuals can not be
retained once demand is aggregated to matrices to compute flows. By introducing multi-agent
transport simulation, this constraint is resolved and personal attributes such as sociodemographic
properties, the activity plan, and other internal variables can be accessed during the entire
modeling process. In such an approach, software objects representing travelers (“agents”) are
retained not only in the demand generation stage, but also in the assignment step (Rieser et al.,
2007).
By including more dimensions of travel behavior, the repeated realisation of an activity based
demand generation process become computationally more expensive. To resolve this issue,
learning is introduced in the feedback cycle: An agent can hold a set of activity plans in its
“memory”, and chooses one of them for the traffic simulation (Raney and Nagel, 2006).
The open source MATSim (multi-agent transport simulation) is designed along those lines and
allows the simulation of both private and public transport modes. The simulation structure of
the underlying coevolutionary system is depicted in 1, and explained further in the following
subsections. The initial demand generation results in daily activity plans which are composed of
fixed and flexible elements. Whereas the activity chains (number, type and sequence) as well as
the location of home, work and education activities remain unchanged during the whole process,
start times and duration of activities, mode and route choice as well as activity locations for
secondary activities, i.e. shopping and leisure are optimised in the iterative learning process
until a relaxed state is reached.
2.2 Generating initial activity plans
The approach presented in this paper combines a variety of concepts used in earlier implementa-
tions of MATSim (e.g. Balmer et al. (2010), Balmer et al. (2009a) and applies it to the case of
Singapore. Given the data availability in Singapore, additional submodels became necessary to
achieve the project’s goal of a full scale implementation of an agent-based transport demand
3Large-scale agent-based transport demand model for Singapore June 2012
Figure 1: Structure of the MATSim-T simulation system
Supply data
Facilities
Initial demand Execution Scoring Analysis
Population
Demand
Replanning
Initial demand modeling Iterative process Evaluation
simulation featuring buildings as the base layer of spatial granularity.
The demand modeling process is illustrated in Figure 2. It combines diverse data on land use,
travel demand, demographics and transport supply in order to generate initial daily activity
plans. The sequential process starts with a populations synthesis. For each person in the
study area, a synthetic “agent” is generated. While single persons do not necessarily need
to be represented by a corresponding agent with the same socio-demographic attribute, the
general statistical properties and correlation structure of the synthetic population should be
representative for real population. Lacking a full census, for the case of Singapore an iterative
proportional fitting approach on a household level was employed (see Section 3). The agent
population is then spatially distributed taking into account the socio-demographic structure of
the individual households based on a random sampling approach (see Section 4.2). To this end,
a facilities data bases is established by combining information on building footprints, land use
and diverse sources (see Section 4.1). Based on results of multinominal logit models that draw
on information of the Household Interview Travel Survey (CITE), the synthetic population is
enriched by availability of driving licenses on an agent’s level and car ownership on a household
level (see 4.2. Reported activity chains and preferred activity durations in the Household
Interview Travel Survey 2008 (Choi and Toh, 2010) are then assigned to individual agents
according to the enriched synthetic population information in a segmented random sampling
approach (see Section 6). In a next step, for each agent whose activity plans features work or
education activities, fixed locations to perform such activities are assigned. The gravity model
based approach combines information on distance between the home location and potential work
locations and the likelihood that a particular work location is suitable to the agent’s occupation.
Secondary activity locations, i.e. shopping and leisure are again assigned in a random sampling
approach based on the prior activity location. Mode choice is attributed in a simple rule based
4Large-scale agent-based transport demand model for Singapore June 2012
Figure 2: Structure of the MATSim-T simulation system
Census Pop. synthesis Synthetic Pop.
M’plan/REALIS/St.Dir.
Pop. distribution Synthetic Pop. +1
Building footprints
Driving license Synthetic Pop. +2
Home facilities
Car ownership Synthetic Pop. +3
HITS
Activity assign. Initial Plan.xml
EZ Link
Work Facilities Primary location Initial Plans +1
Educ. Facilities Secondary location Initial Plans +2
Output/Input
Other Facilities
Activity duration Initial Plans +3
Input data
Models
Mode choice Initial Plans final.xml
Special Trips Special trips assign Special Plans.xml
Date type legend: Original input data
Generated data
manner as this choice dimension is subject to the subsequent iterative learning process. In
addition to the activity based demand, special plans are generated from origin destination
matrices provided by the Singapore Land Transport Authority (LTA) to cover freight trips, trips
between Singapore and the neighboring state of Johor, Malaysia and Singapore and tourists trips.
Those plans, however, are not subject of the iterative learning process but remained in terms of
start time, mode and origin/destination unchanged.
2.3 The MATSim co-evolutionary learing process
Due to the imposed constraints, i.e. capacity of roads, public transport and capcity and opening
times of facilities, the effective utility of a daily plan of one agent can only be determined by the
interaction with all other agents. In MATSim, a co-evolutionary learning loop (Holland, 1992;
Palmer et al., 1994) consisting of the plan execution, scoring and replanning, is employed to
find an equilibrium state. Such a state is reached if the utility for each agent does not noticeably
change through variation of the day plans.
The general traffic simulation approach used in MATSim is based on queues (Waraich et al.,
5Large-scale agent-based transport demand model for Singapore June 2012
2009; Charypar et al., 2007; Charypar, 2008). In this approach links are the active element,
which move around cars. Each link contains a queue which stores the entry time of each car.
Adjacent links collaborate with each other to assure that the different traffic parameters and
elements are simulated correctly. For example link capacity, free speed travel time, intersection
precedence and space available on the next link are parameters which are taken into account
by the simulation. In addition to the car simulation, MATSim features a detailed simulation of
schedule-based public transport Rieser (2010) which is integrated with the car simulation and
hence covers interaction between public transport vehicles using public roads and cars.
Each plan is then scored according to the simulation’s outcome. The basic MATSim utility
function to score plans which is also used for the MATSim model presented in this work,
was formulated in Charypar and Nagel (2005) from the Vickrey model for road congestion as
described in Vickrey (1969) and Arnott et al. (1993): a plan’s utility is computed as the sum of
all activity utilities plus the sum of all travel (dis)utilities.
In every subsequent iteration, a certain share of the agents is selected to clone the executed plan
and subsequently modify it using a replanning module. For the Singapore implementation, the
following replanning modules are included:
• Choice of activity start time and duration
• Route choice
• Mode choice
• Location choice of secondary activity locations
If an agent has obtained a new plan, as described above, then that plan is selected for execution
in the subsequent simulation. If the agent has not obtained a new plan, then the agent selects one
from the existing plans. With increasing iterations, plans with a high utility survive, while plans
with a low utility (e.g. caused by long travel times because of traffic jams) are eventually deleted.
At the same time, marginal utility gains from changing activity plan diminish and gradually a
equilibrium state is reached.
3 Population Synthesis
3.1 Sources
In absence of a full population census, the agent population is generated using iterative propor-
tional updating (IPU) and weighted random sampling of household survey records. In lieu of a
public use micro data sample with matching marginal sums, data from a national travel diary
survey (Household Interview Travel Survey, HITS (Choi and Toh, 2010)) which constitutes of a
6Large-scale agent-based transport demand model for Singapore June 2012
1% sample of Singapore’s permanent population is combined with publicly available breakdowns
of Singapore’s most recent census. Due to the inconsistency of the scope of the two data sources,
the modular framework of the population synthesis is highlighted and thorough cross-validation
with independent data is performed.
3.1.1 Controls: Census 2010
Our controls were given at two levels of geographic resolution. These are the Development
Guide Plan zones (DGP) used by the Urban Redevelopment Authority and their subdivisions
(subDGP). Because the sample is sparse for certain areas, we conducted the synthesis on a
subDGP-by-subDGP area. We grouped adjacent areas together where control numbers were
relatively small in order to minimise the number of iterations, to arrive at 30 DGP zones (from
the original 36 in census) and 92 subDGP zones (down from 259).
On a household level, we used the following controls:
• household income x DGP
• dwelling type x DGP
• household size x DGP
On the person level, controls were as follows:
• age x ethnicity x sex
• income x DGP
• occupation x DGP
• sex x subDGP
• age x subDGP
• ethnicity x DGP
3.1.2 Household Interview Travel Survey 2008
The HITS contains records for approximately 11,000 households in Singapore. The record is for
the entire household, including resident domestic workers. All the variable mentioned above
were recorded for each household and every person in the household. We stripped the household
records of domestic workers to come up with a reference sample, as the control totals from
census is for the resident population only.
7Large-scale agent-based transport demand model for Singapore June 2012
3.1.3 Non-permanent resident inhabitants
In 2010, approximately 5.1 million people were estimated to have residence in Singapore, of
which 3.6 million were citizens and permanent residents recorded in the census. The remaining
1.6 million are workers, tourists and their dependents. Approximately 870,000 persons are
lower-skilled workers and tourists, which are not included in the synthetic population. In
the transportation model, these persons’ activities and movement are derived from a set of
special trip matrices provided by the Land Transport Authority (see 6.1.6). The remainder
are employment pass holders and their dependents. Very little information is released on this
group of people, therefore we made a number of assumptions on their composition based on
regulations provided by the Ministry of Manpower, in order to come up with control totals for
their synthesis.
3.2 Method
3.2.1 Fitting
The fitting step derives a weight for each household record in each subDGP. This weight indicates
the expected frequency of a household with this composition and characteristics in the subDGP,
given the distribution of demographic attributes from census control totals. We use Iterative
Proportional Updating (Ye et al., 2009) to derive this weight, as it not only considers household
controls, but also ensures that person-level controls are matched. Therefore, the procedure will
not only produce, say, the correct number of five-person households in a subDGP, but also the
correct number of 40-year old male accountants in that same subDGP — given that the numbers
of both are provided as control totals.
3.2.2 Sampling
Once the household weights have been derived, we employ simple weighted random sampling
to add household and person records to the synthetic population until we come to a total of
approximately 4.3 million persons.
3.3 Validation
The synthesis showed very good agreement with all the joint and marginal controls used in
the fitting stage, as can be seen from Table 1. We excluded the two controls listed in the last
two rows due to the poor convergence they produced during synthesis. To investigate this
8Large-scale agent-based transport demand model for Singapore June 2012
Table 1: Validation of synthetic population against controls used in the fitting stage, as well as
two joint controls (last two rows) excluded during fitting due to poor convergence
Geographic Control Number of Avg control RMSE RMSE
resolution categories cell value as pct
DGP household income 12 3290 66.02 2.0%
DGP household dwelling 7 6623 306.78 4.6%
type (detailed)
DGP hh size 8 4935 76.71 1.6%
All pax age x ethnicity x 104 34393 645.42 1.9%
sex
DGP pax income 9 5945 196.66 3.3%
DGP pax occupation 10 6540 497.02 7.6%
DGP pax ethnicity 4 32476 1267.58 3.9%
subDGP pax sex 2 20474 698.05 3.4%
subDGP pax age 14 2924 109.02 3.7%
All pax age x sex 84 44848 5905.59 13.2%
dwell (simple)
subDGP pax age x sex x 84 487.48 229.59 47.1%
dwell (simple)
deviation, we compared the reference sample against the person age x sex x simplified dwelling
type control. Here we can see that the reference sample differs significantly in terms of its
covariation structure from the control, which might explain why convergence is hard to attain
when also controlling for other important attributes. As there is no information available on the
expatriate population, we cannot comment on the validity of the synthetic population beyond
the assumptions mentioned before.
4 Generating facility information
Facilities in MATSim are geographic location where activities can be performed by agents at
certain moments in time. For the Singapore MATSim model, the individual building was chosen
as the level of resolution for facilities. For each facility, information is required on the type of
activities (e.g. residential, education, work, leisure) that can be performed, the number of agents
that can reside in the facility simultaneously per activity type and the opening and closing times
of the facility to capture the temporal dynamics.
9Large-scale agent-based transport demand model for Singapore June 2012
6KHHW
. GZHOO
KGE
SU
LYDW
H
. RW
KHU
GZHO
O
KGE
.
SU
LYDW
H
RW
KHU
.
RW
W DO
.
U
&RQWRO
.
.
.
.
1XPEHU
RI
+,
76SHU
VRQ
UHFRU
GV
6XPRI1XPEHU
RI+,
76SHUVRQU
HFRU GVV\QWKVDPSOH YV
VXPRI
&RQWURO
W
RWDO
&RO RU
VKRZVGH
W
DLO
VDERX
Figure 3:W
GZHO
O
6KDSH
Comparison VKRZrelative
of VGHWDLO
VDERXW
GZHOO
frequencies'ofHW
DLO
V
DU
HITS H
VKRZQ
personIRU
VH[
DQG
records
DJ
vs H
census control numbers
when broken down by simplified dwelling type, age and sex.
This Section discusses the data sources used for facility and activity location generation and in
which way this supply is matched to the demand for activity locations.
4.1 Sources
Land use planning Land-use is given by the URA Masterplan 2008. On one hand, the
Masterplan provides land-use information on the type of land-use. On other, a gross-plot ratio
is provided per plot. The plot ratio of a site is defined as the ratio of the gross floor area of a
building(s) to its site area. In the Masterplan a distinction is made between over 20 land-use
types, varying from residential to agriculture. For each land-use type, the distribution of attracted
occupation types is analysed based on the georeferenced work activities recored in HITS. This
10Large-scale agent-based transport demand model for Singapore June 2012
distribution is then taken into account when assigning work activities based on the gravity model.
Online resources In addition to the URA Masterplan 2008, several governmental and com-
mercial websites have been consulted for information on land-use and activity locations. A
summary can be found in Table 2.
Building footprints Building footprints are available from a navigation network (NAVTEQ,
2011). These building footprints are reverse geocoded with address information based on the
building centroids. This makes it possible to assign information from the online resources to
building footprints. This makes it possible to compare the points of interest obtained online with
the number of building footprints.
Table 2: Data sources available
Facilities Source Number
Residential Public HDB (2011); AllProperty 10,041
(2011)
Condominiums URA (2011); AllProperty 3,008
(2011)
Landed URA landed housing plan 59,619
Work URA Masterplan
Education Ministry of Education
(2011), websites of interna-
tional schools
Secondary activities Streetdirectory (2011), Giant 14,965
(2011), NTUC (2011)
4.1.1 Facilities
Residential facilities For public housing (HDB for Housing Development Board), the number
of units per type is available for the majority of the flats. To a large extent the number of units
in the private flats (condominiums) can be found online as well. The number and type of units
serves as a basis for the assignment of households to residential units.
Work facilities Initially, work locations were based on points of interest in the categories
commercial and industrial. In addition, work locations are also added to education and residential
facilities. With the release of the URA Masterplan (URA, 2008), work facilities are generated
11Large-scale agent-based transport demand model for Singapore June 2012
based on the designation of a parcel and the gross plot ration indication given by the Masterplan.
However, in absence of a census of entreprises, apart from the gross floor space for each work
facility, no information on the number of work location was available.
Education facilities Locations of primary, secondary and tertiary education is collected from
the Ministry of Education. Additionally information on private schools has been gathered. For
private schools as well as for higher education, such as colleges and universities, the number of
students could be found. This is however not the case for primary and schools. Here the number
of students is based on the average number of pupils in Singapore per school type, multiplied by
the standard deviation multiplied by random number.
Secondary activity facilities Secondary facilities comprise of a broad set of point of interest
based on the activity locations as reported in the Household Interview Travel Survey (HITS)
2008. Points of interests for secondary activity location include supermarkets, malls, markets,
food centres, restaurants, sports facilities and parks. Also, a number of residential units is
selected as secondary activity location, as a significant part of the sample in HITS reported
visits to friends and family. For the moment, generic capacities have been assigned to different
types of secondary activity facilities. However, the data framework principally allows specifying
a dedicated capacity for every single facility, which could be the result of a shopping mall survey.
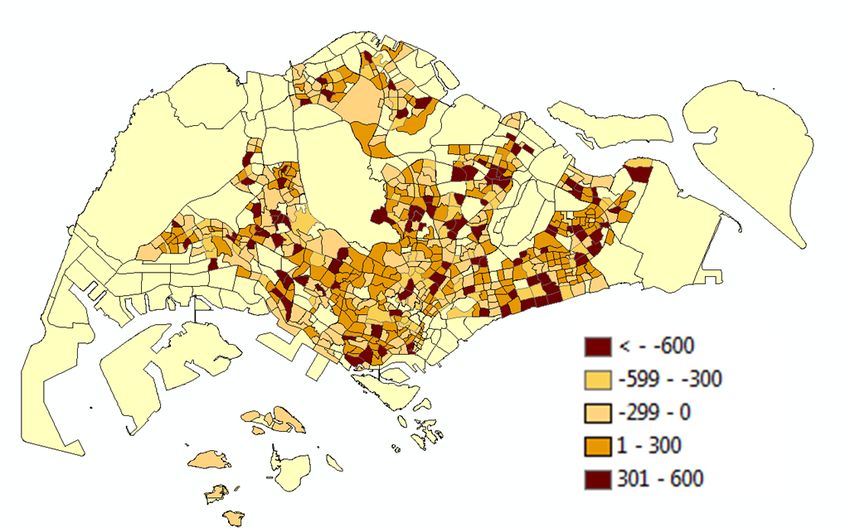
4.2 Data integration
4.2.1 Population distribution
The population synthesis described in Section 3 results in a number of households per planning
zone per dwelling type. In order to assign the population to residential facilities the following
procedure is followed:
• Number of residential units per type (7 types) are summed per planning zone (92).
• Per residential facility a probability is computed by dividing the sum of the units of type i
of a facility by the total number of units of type i in zone q.
• For each household residing in type i a residential unit of type i is drawn from the facilities
in zone q.
The result of the procedure can be seen in Figure 4, where the bars indicate the number of
households assigned per facility and type and the line represents the number of units available. A
12Large-scale agent-based transport demand model for Singapore June 2012
capacity constrained approach was not applied as the total number of units in reality is unknown.
Figure 4: Residential assignment
4.2.2 Capacity of work locations
In absence of an enterprise census or any other data source on the spatial distribution of work
locations in Singapore, a new model to estimate capacities of work locations was developed.
In a first stage, public transport smart card data (Chakirov and Erath, 2011) is used to detect
work activities with a rule based approach: all observed activities with duration longer than
seven hours are assumed to be work activities. Using an iterative proportional fitting approach
which takes the distance from stop locations to potential buildings and the buildings’ potential
gross floor area in account, the detected work activities are then linked to single buildings
(Ordóñez Medina, forthcoming ). In a next stage, capacities of work locations are increased
based on the reported number of car trips to work activities. To this end, the zoning system of
the Singapore Transport Model was modified by iteratively merging neighbourging zones so
that at least 50 observations work activities are available for each zone. Then, the the number of
work activities for each building is obtained by inflating the number of work activities detected
with the smart card data according to the reported mode share within the according zone. This
procedure, however, is currently under review since the building’s proximity to a public transport
stop affects the number of assigned car-based work activities. Therefore, in future versions of
MATSim Singapore, number of work activities will be inflated on a zone level and car based
13Large-scale agent-based transport demand model for Singapore June 2012
work activities are then distributed to individual buildings using the buildings’ gross floor area
as a weighting factor.
In addition, the model to detect work activities has been improved. Instead of the rule based
approach, (Chakirov and Erath, 2012) propose a Logit model taking into account information
on start time, activity duration and density of different land use types around stop locations.
This new model perform better in this regard and will be applied in future versions of MATSim
Singapore.
It is planned to validate the work location model with data provided by Singapore’s Urban
Redevelopment Authority. URA’s work location information is based the effective gross floor
area of buildings and assumptions on the average space required for each work place depending
the designated usage of the work facility. However, when this paper was submitted, this
information was not yet available.
5 Modeling of car license holdership and car availability
5.1 Approach
Persons generated by the synthetic population do not include a driving license; households do
not own a car. In order to add these variables, logit models have been developed to add both a
driving license and a vehicle to each person and household of the population.
Two main model approaches based on a discrete choice framework can be found in literature:
random utility models and Ordered Logit models. Whereas in the first modeling approach it
assumed that vehicle ownership is a random variable, the latter modeling approach assumes
that households have a higher utility of owning a vehicle versus not owning a vehicle or driving
license (Bhat and Pulugurta, 1998; Potoglou and Susilo, 2008). Based on initial model results
and literature, Multinomial Logit (MNL) models were estimated.
Furthermore, it is possible to estimate the probability of the number of licenses and vehicles
with separate models, or to estimate these models simultaneously by applying a nested structure,
the advantage of the latter being overcoming the correlation between number of driving licenses
and number of vehicles within a household. However, we opted to estimate separate models for
the following reasons: modularity within the initial demand process, easier to validate market
shares and the possibility to ’age’ the population in a later stage.
Vehicle ownership and household information are given by the Household Interview Travel
Survey (HITS) 2008 Choi and Toh (2010). For this survey 1% of the population is questioned on
their travel behavior on a single workday in person. The survey contains 36,978 individuals in
10,641 households. The survey is conducted once every four years and is commissioned by the
14Large-scale agent-based transport demand model for Singapore June 2012
Singaporean Land Transport Authority (LTA). HITS contains data on three levels of aggregation.
The highest level of aggregation contains household characteristics such as dwelling type, postal
code and quantity and type of vehicle available. Second, person characteristics are available such
as age, income, profession and employment type. On the lowest level of aggregation information
on trips is available such as mode, purpose, cost and time. In 1,533 of the households one or
members refused to disclose their monthly income. In total 8,846 cases remain for estimation
after controlling for availability of a driving license; several households do have a vehicle
available but not a driving license.
5.2 Models
5.2.1 License ownership model
Our final model for driving license ownership on a person level includes variables for dwelling
type, income, number of members in household, a dummy variable indicating if a person is
employed and a dummy variable indicating if the person is retired. Similar to Ciari et al. (2007)
several variables representing the utility of having a driving license at a certain age per gender
were included. Table 3 shows the parameter estimates of the driving license model. Whereas
Table 3: Parameter estimates driving license model
No driver license Driver license*
Constant -26.6 (-29.91)
HDB small -0.57 (-11.23)
HDB medium (ref) -
HDB large 0.486 (11.63)
Condominium 1.27 (17.85)
Landed property 1.82 (23.15)
#members household 0.032 (2.47)
Age -0.246 (-30.06)
Age * Male 0.037 (39.56)
Ln (age) 9.65 (29.26)
Income k -0.103 (-17.13)
Number of observations 36,492
Init log-likelihood -18533.679
Final log-likelihood -13021.053
Adjusted rho square 0.29
* License available to persons over 17 and non-domestic workers
males have the highest utility of a driving license around 45, females have the highest utility
15Large-scale agent-based transport demand model for Singapore June 2012
around the age of 35. After this age, utility declines. It is hypothesized, that is due to the
transition of Singapore from a developing country to a highly developed country in a short time
span. Based on a rho-squared of 0.29, model performance is high.
Figure 5: Age vs utility driving license
5.2.2 Car ownership model
The model currently applied in the initial demand process of MATSim Singapore is a MNL
model. It contains 18 variables regarding dwelling type, monthly household income, number
of children, number of adults, number of driving licenses. To capture the spatial structure of
Singapore, a series of parameters indicating the postal sector of the household were estimated.
Two alternatives were considered: not owning a vehicle and owning a vehicle. Other modes of
transport, such as taxis, light gooded vehicles and motorcycles were omitted because of their
small market shares. Judging by the adjusting rho-square of 0.31, model performance is good.
Households residing in landed property have the highest utility of owning a car, as do households
with a high income. On one hand, this reflects that households residing in landed property need
to travel farther to reach amenities like schools, supermarkets and sport facilities. On the other
hand, the relative high importance of income reflects the high costs of vehicle ownership and
usage in Singapore. The number of children within a household increases the probability of
16Large-scale agent-based transport demand model for Singapore June 2012
owning a vehicle.
5.3 Validation and application
Both the driving license model and car ownership model have been validated by both examining
the market shares observed in HITS. In addition, the results of the car ownership model are
compared with the car registry on an aggregated level and presented in Table 4. With the current
model, the market shares still deviate from the sample population. This first model has recently
been improved by including spatial variables (van Eggermond et al., 2012). This new model
perform better in this regard and will be applied in future versions of MATSim Singapore.
Figure 6 shows a comparison of the car ownership model applied to synthetic population
Table 4: Market shares of driver license and vehicle ownership model
Actual sample Simulated Simulated model
with spatial vari-
ables
No driver license 71.1 71.3
Driver license 28.9 28.7
No car 58.5 52.6 57.4
Car 41.5 47.3 42.6
described in Section 3. Results of the car assignment have been aggregated to the zonal used
by the Singaporean Land Transport Authority. Although there is some variation in difference
between modeled and observed varies, no systematic spatial distortion is visible. One reason of
for such a pattern might be that some cars are registered for companies and hence georeferenced
at the company’s location but used by individuals. 
6 Generating Activity Plans
6.1 Activity Plans
6.1.1 Travel decision
In the HITS, approximately one third of eligible persons did not make a motorised trip on the
survey date. This population is generally classifiable by income, age, household car availability
and car license. In order to assign a travel decision to our synthetic population, we firstly classify
17Large-scale agent-based transport demand model for Singapore June 2012
Figure 6: Car ownership: modeled vs car registration, positive value indicates more cars regis-
tered than modeled
the HITS person records based on modes of travel used during the course of a day. As we
currently model only public transport and car traffic, we add exclusive users of other transport
modes to the list of non-travelers. We then produce joint distributions of age x income x car
availability x car driver licensure versus a joint travel decision / initial mode choice outcome
variable. The variable has four possible values: 1) no travel; 2) exclusive car travel as driver;
3) exclusive public transport travel; and 4) a mixture of car driver and public transport travel.
Based on the frequency of these values for each combination of predictors, we assign the travel
decision and initial mode choice for each member of our synthetic population, using weighted
random sampling.
6.1.2 Activity chain assignment
Activity chains are assigned based on their observed frequency in HITS. We identify the 22 top
activity chain frequencies in the survey, and derive their joint distributions by sex, occupation,
age and household car availability. Then we assign an activity chain to each member of the
synthetic population using stratified weighted random sampling. As our synthetic population
includes foreign workers, the relative proportion of worker chains is higher than in HITS. Also,
we have a smaller number of chains involving educational activities, as a lot of scholars get
18Large-scale agent-based transport demand model for Singapore June 2012
dropped off at school, or take the school bus; both modes of transport that we don’t simulate.
6.1.3 Primary activity assignment
Work We classify HITS work activities by their start time and duration. The person records
are then stratified by occupation, and whether the person performed additional activities before,
during or after work. Then a kernel density estimation is performed for each stratum. Where a
stratum is too sparse, densities from marginal distributions (occupation x activity chain type)
are multiplied. The density estimates are then used in a weighted sampling of start time and
duration for each stratum in the synthetic population. The work activity type is then identified
by finding the nearest start time and duration to the assigned values.
Education We classify educational facilities in our facilities database as primary, secondary,
etc. similar to the classification used in the HITS. Pre-schools are excluded. Then, HITS records
are used to generate a joint distribution of educational activity x age x household income. An
educational activity is then assigned to each qualifying agent in the synthetic population through
weighted sampling, stratified by the agent’s age and household income.
6.1.4 Primary activity location assignment
Primary activity location assignment is done on a per-agent basis.
1. For each agent, a sample of 1000 qualifying facilities are drawn;
2. An ’attractiveness’ weight is derived for each facility, based on a gravity assignment type
strategy.
3. For work activities, weights are attenuated by multiplying each weight with the relative
probability of finding the agent’s occupation type at the facility’s URA land-use type;
4. A facility is then picked from the agent’s choice set using weighted random sampling.
Gravity parameter estimation was performed using Euclidean distance, stratified by vehicle
availability. If there is a car available in the agent’s household, the procedure uses the car
parameters for weight estimation, otherwise public transport.
6.1.5 Secondary activities
Where an agent has secondary activities in their activity chain, the procedure for primary activity
location assignment is repeated, except that weights are not attenuated before weighted random
sampling is performed. Secondary activity location choice is part of the simulation procedure,
19Large-scale agent-based transport demand model for Singapore June 2012
therefore the initial assignment is of little consequence and is likely to change during the course
of the simulation.
6.1.6 Additional activity plans for freight, cross border and tourist travel demand
Additional activity plans for freight, cross border and tourist travel demand are generated from
origin destination matrices provided by the Singapore Land Transport Authority (LTA). Those
trips cover freight traffic, traffic between Singapore and the neighboring state of Johor, Malaysia
and Singapore and tourist trips.
In order to fit the agent based nature of the mobility simulation, the provided matrices need
to be converted into single trips. Since the trip matrices have been generated for a zone-based
transport demand model the following discretisation process is applied. Firstly, the floating
numbers indicating of the origin demand matrices are transformed to integers using random
rounding. Secondly, within each zone trips are assigned to facilities a using a weighted random
sampling approach, using potential floor surfaces representing the weights. Thirdly, trip start
times are generated according to different indications of temporal dynamics: for car trips to
and from Johor and freight trips, correspondingly categorized road detector data is available
aggregated to 30 min time bins. After spatial aggregation of all count locations, the total number
of trips is distributed proportionally to the counts figures within each time bin. To generate trip
start times to the split second, uniform distribution is assumed within each time bin. Tourist trips
are temporally distributed in a similar way, but observations of visitor dynamics of major tourist
attractions are taken into account instead of loop detector data.
Since the plans representing special are not representing activity based daily plans, in the
iterative learning process only the rerouting module is employed, whereas start time, mode and
origin/destination remain unchanged throughout the process.
6.2 Validation
As the home-work-home activity chain is prevalent in Singapore, making for half of the activity
chains in HITS, a validation of work location assignment is important to our model. Figure 7
compares work location assignments with the number of work-bound attractions in HITS by
DGP. Our procedure produces more placements away from the city centre, especially in the
north and the west. As a consequence, our commuting population tends to travel further than
what was reported in the survey. In the following section, we discuss a number of changes to
the work location assignment process that should produce a better match with the survey, both
with respect to aggregate volumes of jobs assigned to each DGP, and the resulting trip distance
distribution.
20Large-scale agent-based transport demand model for Singapore June 2012
Agent work locations
HITS work-bound attractions
Legend
0.027006% - 2%
2.000001% - 4%
4.000001% - 6%
6.000001% - 8%
8.000001% - 11.237703%
Figure 7: Comparison of agent work location assignment vs. HITS work-bound attractions.
6.3 Outlook
Based on the validation, a number of possible improvements to our initial demand generation
process have been identified.
Alternative scheduling using machine learning approach Currently, scheduling is simply
done through sampling of the most prevalent schedules given an agent’s demographic attributes.
No intra-household coordination takes place with regard to maintenance and joint trips and
activities, and agent schedules don’t display the full gamut of possible activity combinations
seen in the survey. An improved scheduling process, possibly incorporating machine-learning
approaches such as those put forward by Charypar and Nagel (2006) and Arentze and Timmer-
mans (2009) will be investigated, along with further work on the intra-household scheduling
process to model the large share of joint trip-making observed in Singapore.
Work location assignment Currently our gravity model estimation is stratified only by ve-
hicle availability. It has been proposed that further stratification by occupation type would be
appropriate. A process whereby an agent is first assigned a work DGP before being assigned a
work facility, should produce a better match between our assignment and the expected distribu-
tion of workers to centres of activity across the island. Such an assignment approach should
at least produce comparable flows at the aggregate level, and thus ensure a better match of trip
distances to those recorded in HITS.
Facility capacity is an important component of the work location assignment process, with
higher capacity facilities attracting more jobs. The process of deriving facility capacities from
EZLink data and mode-shares by transportation zone could be further improved. Currently,
facility capacities close to public transport stops are inflated more than those further away. In a
21Large-scale agent-based transport demand model for Singapore June 2012
sense then, this model favours public transport accessibility in assigning capacities. The method
will be adjusted to take account of car accessibility, so that facilities further away from transit
stops, but with good accessibility by car, will have their capacities commensurately increased.
Motorized travel decision The reason for not making a motorized trip recorded in HITS are
manifold; some people are retired or unemployed or infirm, and don’t need to travel. Others
walk or cycle to work, implying that they live close enough to work for those travel options to
be viable. Others work from home. Once our scheduling and work location assignment methods
have been improved, the distance to work, demands of the activity schedule, and the agent’s
personal means and wants all figure into whether they make use of motorized transport or not.
As a result, cycling and walking should be included as mode choices in our model, and form
part of the simulation process.
7 Transport supply
7.1 Sources
7.1.1 Transport networks
To match the spatial granularity of the activity demand model, a high resolution transport
network model is required. For the Singapore implementation, a high resolution network
provided by Navteq featuring directed links is used. Being primarily designed as a network
for route guidance, some adjustment was required to make the network suitable for transport
demand modeling. First, the original network frequently features several links to represent
street shapes. Since very short links are not ideal for queue-based microsimulation because the
problematic representation of such links in terms of storage capacity, a transformation routine
was applied to simplify the network by merging such row of links together while saving original
distances. Second, information about number of lanes, capacity and free speed is included with
limited accuracy. Therefore, a methodology for matching two networks was developed to enrich
the Navteq network with information from the existing transport planning network. Thirdly, the
original Navteq network does not include any public transport information. In order to obtain
a multi-model network, a rail network was added by creating one link between each pair of
consecutive MRT and LRT stations. The resulting network contains 43’118 nodes and 79’835
links.
For planning purposes, LTA uses a simplified road network model. As conventional transport
demand models are designed to compute flows between zones, such simplified network match
22Large-scale agent-based transport demand model for Singapore June 2012
feature sufficient resolution. However, the network used in the Singapore model is quite
extensive and features 12’420 nodes and 26’972 links. Given its main purpose and gradual
development, this model provides accurate information on capacity, free speed and number of
lanes for principal and secondary streets.
7.1.2 Public transport schedule
In MATSim, the base layer of public transport systems representation is a set of stop facilities
and a set of public transport lines. For each line, one can define several routes and each route
features a sequence of stops, a path or sequence of links, and a set of departures or services.
Each service has a vehicle of a specific type assigned. For each vehicle, characteristics such as
type, capacity, size, door system and type of motorisation can be incorporated.
For Singapore the public transport systems information was provided in the General Transit
Feed Specification (GTFS) created by Google. Each service of a certain line is defined with
a sequence of stops and expected stop times. In addition, the Singapore GTFS information
includes GPS traces to indicate the route of bus services between two subsequent stops.
7.2 Supply modeling
7.2.1 Combining planning and high resolution network
To enrich the Navteq network with information from the transport planning network, a semi-
automatic map-to-map matching process is applied. In a first stage, an automatic process along
the lines proposed by (Balmer et al., 2005) matches intersections between both networks. Since
not all nodes necessarily represent intersections, an algorithm that qualified nodes according
to topological characteristics is applied: the result are matching groups of nodes that represent
one intersection both in the planning and in the high resolution network. In a second stage, the
results of the automatic processes are reviewed using an interactive graphic tool. Visualising
both network next to each other in split screen mode, it allows a user to navigate and zoom both
networks at the same time. The user can also match intersections selecting groups of nodes of
both networks, and modify or remove existing matches. Supposing that all the intersections
represented in the planning network are matched with the high resolution network, in a third
stage, another automatic process is executed. It matches paths (sequence of consecutive links)
between adjacent intersections taking into account distances and link directions. This is again
followed by a manual process using a modified version of interactive tool. Again, both networks
are in split screen, but this time, links are highlighted. To detect unmatched paths or errors
in the automatic process, link free speed is indicated by different colors and link capacity by
23Large-scale agent-based transport demand model for Singapore June 2012
line thickness. By selecting paths from both networks, one can modify or remove matchings.
After matching all paths between intersections, capacities, free speeds and number of lanes ,
information form the planning network is then automatically assigned to the high resolution
network. Finally, corrections on the enriched high resolution network are manually edited by
visual inspection using the tool’s single screen option. Video demonstrations of the tools are
accessible at (Ordóñez Medina, 2011d,c).
7.2.2 Electronic road pricing
The MATSim framework provides the functionality to simulate various types of road pricing
scheme, including dynamic cordon tolls like Singapore’s Electronic Road Pricing (ERP) scheme
which feature time and vehicle dependent road toll. Based on two data sets indicating the
location and time dependent toll levels, the links corresponding to the 69 gantries were manually
identified and specified with the prevailing tolls.
7.2.3 Traffic lights
Without specific information on traffic lights, at intersection where spillback occurs, the queue
based traffic simulation in MATSim priorises approaches probabilistically but does not specifi-
cally cover green time fractions (Cetin, 2005). Using the approach proposed by (Grether et al.,
2012), a link leading to an intersection is dissolved to several links to represent the layout of
turning lanes. Green time fractions can then be attributed to each newly generated link according
to prespecified signal plans. Whereas the location of signal controlled intersection was available,
time dependent signal plans remained inaccessible with reasonable effort due to the proprietary
format of the signal control software. Thus, so far traffic lights are not specifically included in
the presented MATSim Singapore implementation.
7.2.4 Map matching public transport routes
To facilitate interaction between buses and cars in the simulation model, scheduled bus services
available in the GTFS format need to be map matched to the navigation network. To this end, a
semi-automatic map matching procedure was developed (Ordóñez Medina and Erath, 2011). In
a first stage, the following automated steps are processed. Locations of bus stops are matched
to a set of potential links according to the perpendicular distance between the stop coordinate
and the candidate link. Then the shortest path between each pair of candidates is calculated
finally. To include also the information provided by the GPS traces, the shortest path algorithm
takes the distance between tracing points and links into account by modifying the travel cost of
each link. By selecting the shortest path between the two stops, the stop to link relationships are
24Large-scale agent-based transport demand model for Singapore June 2012
determined. In a second stage, an interactive tool displays the results of the first stage and offers
tools to modify the path and the stop-link relationships. The original network is displayed and
full navigation tools are provided as well. If according to the visual representation the relation
between bus stop and link needs to be adjusted, this has implications to all bus lines serving the
given bus stop. Since only unique relations between bus stops and links are allowed, all routes
leading over a stop whose link relation is modified are erased and have to be processed again. To
ensure the quality of the results, the tool also features verification routines that check important
properties of the solution, like connectivity, order, completeness or u-turns. Once all routes are
in ordere, the tool allows saving the edited version into MATSim public transport systems model
XML file. A video demonstration of the tool is available at (Ordóñez Medina, 2011b).
7.2.5 Bus lanes
On certain roads in Singapore, one lane is dedicated for bus use only. Two categories of bus
lanes exist: full day bus lane on which cars are only allowed between 8.00pm and 7.30am
or on Sundays and normal bus lanes which operate during weekdays from 7.30am to 9.30am
and 5.00pm to 8.00pm. To cover bus lane availability in the transport simulation, the road
network was modified to model the availability of dedicated bus lanes. New links were added
to the network with the same coordinates but different mode restrictions. For example, instead
of having one link with four lanes allowing bus and car vehicles, two links with different
characteristics are generated. On the exisiting links, now only cars are allowed and features
a three lanes capacity. On the new additional link, capacity is set to one lane and only buses
are allowed. To cover competition caused by turning vehicles, this new sequence of links is
then connected to the network to nodes that represent intersections. As the information is only
provided in a text form an interactive tool was developed. It allows to select the initial and final
nodes of the exclusive bus lane, calculates the shortest path to assure that the correct street is
selected and automatically executes the idea mentioned above. As only the name of the streets
is provided, but no coordinates, a high resolution graphical map is used as background layer. To
help finding the relevant area in the map efficiently, the map can be centered by entering the
street name. For this feature an automated query using GoogleMap API was implemented. A
video demonstration showing the functionality of this tool is accessible at (Ordóñez Medina,
2011a). With the current implementation, bus lanes are assumed to be in operation during the
whole day. Since congested condition arise during the peak hours where both full day and
normal bus lanes are in operation, such a simplified consideration only affect only off peak hours
where actual road capacity is underestimated. However, most links that feature bus lanes feature
three or more lanes, the effect of modeled traffic conditions is expected to be low.
25You can also read