Transport in London New solutions for a changing city - London First
←
→
Page content transcription
If your browser does not render page correctly, please read the page content below
1

Transport in London                 In partnership with

New solutions for a changing city

2

Contents

4                         8
Introduction              A changing London
                          Evolution of transport in the city

21                        30
The challenge             New models
Influencing and shaping   Funding approaches for the
a changing city           next era of transport in London

50
Conclusion
3

Authors and contributors

This report has been developed through a
collaboration between London First and Arup.

Authors                                        The figures and analysis in this report are
                                               deliberately high-level. The intent was not to
John Dickie, London First                      undertake detailed transport demand and
                                               financial modelling, but rather to assess the order-
Adam Tyndall, London First                     of-magnitude impact that recent trends may have
                                               on both future travel and funding requirements.
Richard de Cani, Arup
                                               Except where otherwise indicated in the text, we
Andrew Nothstine, Arup                         generally use the term ‘rail’ in this report to refer
                                               to all Transport for London-operated rail services
Daniel Philips, Arup                           in the capital: London Underground, TfL Rail
                                               (which will become the Elizabeth Line), London
Patrick Andison, Arup
                                               Overground, and Docklands Light Railway.

                                               All photos are from Andrew Nothstine unless
                                               otherwise indicated.
Contributors

Isabel Dedring, Arup

Adrien Friesen, Arup

Holly Mizser-Jones, Arup

Alexander Skill, Arup

Victor Frebault, Arup

Sam Aitkenhead, Space and Motion                                                                       Image source: Arup
4

Introduction
5

An existential crisis – and an
opportunity for transformational change
Transport for London (TfL) was established,      own transport network without being given
along with the mayoralty, at the turn of the     an adequate range of powers to pay for the
millennium. This young organisation has          services, service levels, and investments that
achieved a lot. From the Oyster Card and         the city needs.
Congestion Charge to the Overground and
                                                 Pre-pandemic, this led to an over-reliance
soon-to-open Crossrail, London’s extensive
                                                 on the farebox and particularly on the
and well utilised public transport network has
                                                 revenues generated from tube customers.
been an integral part of the city’s growth.
                                                 As a result, TfL’s finances were hit harder
Between 1997 and 2017 the city’s population
                                                 than those of other transport authorities
grew by 20%, yet the number of private
                                                 when passenger numbers plummeted in the
vehicle trips in Greater London slightly
                                                 wake of the Covid pandemic. London saw
decreased. Public transport trips have
                                                 a 65% reduction in tube demand and 44%
increased from 6m to 10m daily, supporting
                                                 reduction in bus demand between March
high value job creation and a better quality
                                                 and November 2020.
of life for Londoners. There can be no doubt
that an effective mass transit network lies at   However, the funding model for London
the heart of London’s competitiveness. TfL,      transport was already showing signs of
and all three of London’s mayors, deserve        stress before the pandemic hit. Driven by
much credit for this success.                    changing behaviours, new commuting
                                                 patterns, network congestion, and new
But there has always been a tension
                                                 technologies, London saw bus passengers
between the responsibilities granted to the
                                                 declining, rail passengers plateauing, and
Mayor and TfL for running London’s transport
                                                 use of alternative modes increasing. All of
services, and the resources available to them
                                                 which contributed to growing constraints on
under London’s limited devolution settlement.
                                                 TfL’s revenue.
In short, London has been asked to run its
6

Reinventing transport in London

In the short-term, there is no substitute for   The starting point for any new funding model for       We therefore examine a range of further
central government support, as London           London must be that a greater, though still small,     options for meeting London’s transport
government simply does not have the             share of the existing public revenues raised           needs. Some are radical, others are more
powers and resources to otherwise fund          here must be channelled into paying for the            incremental, but none are easy. Getting the
the network. However, a continuous short-       transport services which makes these revenues          balance right is for all of us to debate. Now
term cycle of funding negotiations with         possible in the first place. But while that provides   is the time to think creatively, recommit to
the Treasury is no way to run a transport       a foundation for paying for the transport the city     London’s devolved transport authority and
network. London needs greater certainty and     needs, more needs to be done.                          look to the future.
greater autonomy in matching its services
and investments to its needs.

This report is our first attempt to frame to
that debate. The first section examines
how London and its transport network
have evolved in modern times before
assessing the impact and implications of
the pandemic. Section two combines an
analysis of the current funding challenge
for TfL with an analysis of future trends and
forecasts of future travel demand. The final
section looks at how London could pay for
the network and services that the city needs,
taking into consideration the likely trends
and critical questions of efficiency, equity,
                                                                                                                                     Photo by Shutterstock
and the environment.
7
Transport doesn’t only shape our
Why does public transport matter? daily lives and determine how we
The Global City Power Index (GCPI) has ranked London get around London – it can create
as the most magnetic global city for its ability to attract new opportunities for Londoners and
people, capital, and enterprise from around the world.
London’s place at the top of the table, which it has held
shape the character of our city.
since 2012, is buoyed by top marks for accessibility. Sadiq Khan, Mayor of London,
London is considered the most accessible major urban Mayor’s Transport Strategy
centre by GCPI, thanks to its extensive and well supported
public transport and sustainable travel network.
Access to high-quality public transport and active travel
opportunities supports a better quality of life for citizens.
Research from the American Journal of Preventative
Medicine shows that each additional hour spent in a car
per day is associated with a 6% increase in the likelihood
of obesity, while each additional kilometre walked per day
was associated with a 5% reduction. And local air pollution
in London is already at illegally high levels in many car-
intensive areas – a situation that would be even worse
without high-quality public transport.
The performance of London’s transport network is also
critical for meeting our sustainability objectives. Transport
accounts for 26% of greenhouse gas emissions in London
– a figure which we must reduce, but which is significantly
lower than car-dominated cities where transport can
account for around half of emissions.
There is no ‘benefit-cost ratio’ that can tell the whole
story of the economic, environmental, and social benefits
delivered by London’s transport system. And the
consequences of poor public transport provision never fall
evenly across society. This is especially true in a city like
London where the poor are less likely to own their own car.
Just as public transport services and investments help to
level up the country, they also serve to level up the city.
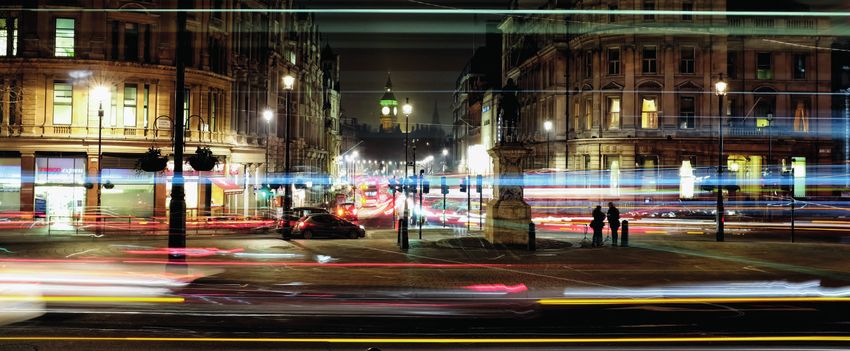
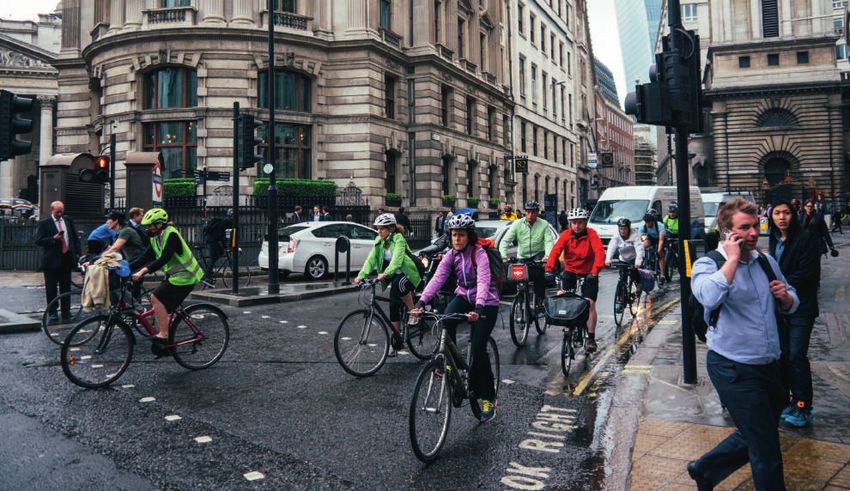
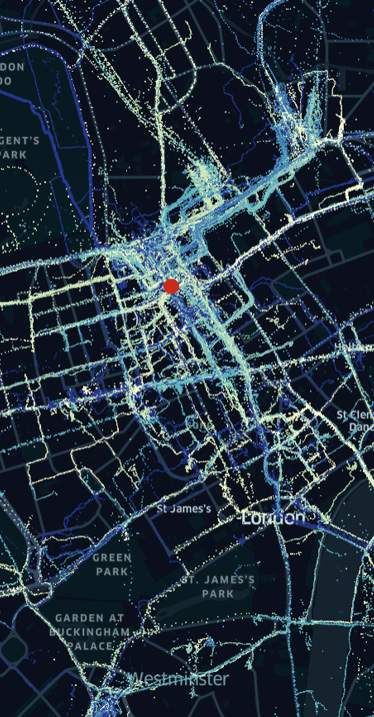
London’s tube, buses, cycles, and taxis are worldwide The dispersion of commuters that arrive into London from the Greater London Area
icons for a reason – they are a quintessential part of the and beyond. The blue sections of the arc represent the home-end of the journey,
city’s fabric and what makes London, London. with the brighter yellow end of the arc representing the work-end of the journey Image source: Arup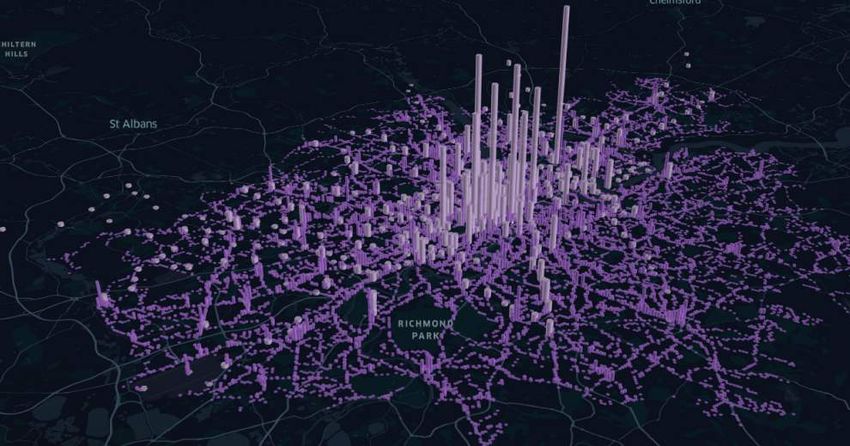
8

A changing London:
Evolution of transport
      in the city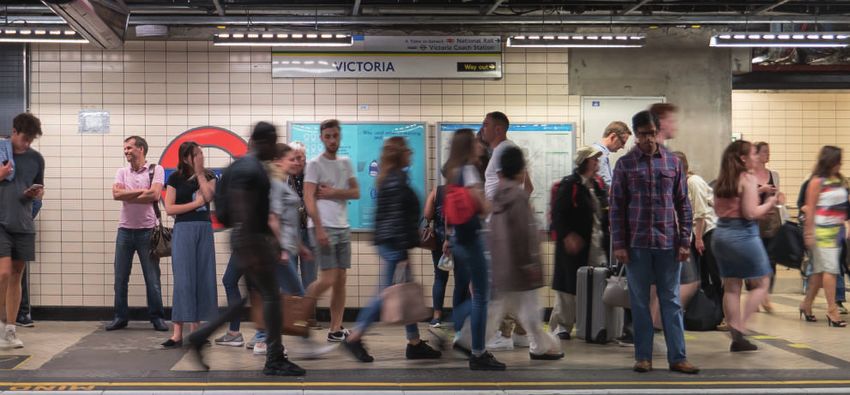
9

An ever-changing London

London has continually adapted and                become the world’s largest city in the early                         trajectory. Canary Wharf’s history provides
changed throughout history, and its transport     19th century.                                                        one illustration: from swamps to the largest
system has always played a central role           New challenges emerged in the 20th century.                          docks in the world, and then from a derelict
in this. The city’s development began as          In the post-war era, London’s population                             industrial site to a global financial hub. But of
the first bridging point on the Thames,           fell precipitously over many decades, due                            course these changes were not preordained.
and Roman roads connected Londinium’s             to poor quality of life for many, a changing                         Instead, they were the result of smart,
barracks to Roman Britain and its ports           global economy and government policies that                          sustained choices to reinvent the city in the
across the rest of the empire.                    favoured investment outside of London.                               face of severe challenges.
London emerged as the capital of a united         The city could have continued to decline,                            The following pages provide an overview of
England in the early medieval period.             but interventions and investments made                               London’s – and the London transport system’s
The city’s population grew continuously,          by forward-thinking leaders changed this                             – evolution following the long and difficult
overcoming the sometimes severe setbacks                                                                               period of 20th century decline.
of plagues. The great fire of London marked
a new era for transport in London – roads
were widened (while mostly sticking to existing
layouts) and wharves built across the Thames,
setting the stage for Britain’s growth as a
global trading nation.
London has a history of shaping its own
destiny by investing in the future, with
transport infrastructure often at the heart
of these investments – canals at the turn
of the 18th century, the London and
Greenwich railway in 1835 and the world’s
first underground railway in 1863. These and
other bold investments enabled London to          Image source: Ordnance Survey, Map of Roman Britain, Second Edition,1931.
10

Evolution of London’s transport system in modern times
                                     TfL Created                                                                    Covid Crash

Photo by sludgegulper CC-BY-SA 2.0           Photo by M Mitchell on Unsplash    Photo by Anjana Menon on Unsplash            Photo by Ivan Teece on Unsplash

Return to Growth                           Invest & Expand                     Uncertainty & Change                         New Era of Mobility
1980s-1990s                                2000-2015                           2015-2019                                    2020s and beyond
London’s population begins                 London enters a period of           London enters a period of                    London has the opportunity
growing again following post-war           rapid population and economic       uncertainty, with Brexit and rapid           to emerge as a global leader
decline and the devastating fire           growth, underpinned by              changes to lifestyles, technologies,         in providing a carbon-neutral
at Kings Cross is an impetus               transformational capital            and travel patterns. he London               and technologically-enabled
for major change in London                 investments in the city’s           Underground generated an                     transport network – aligned with
transport. There was a heavy               transport system supported          operational surplus that supported           the way people now live, work,
reliance on central Government             with a commitment to long           bus services; central Government             and play in the city.
funding during this period.                term funding.                       grant was replaced by business
                                                                               rates retention.
11
Return to Growth The devastating fire at Kings Cross is
an impetus for addressing London's
under-invested infrastructure Jubilee line extended
between 1992 and 1999
1980 London’s population
begins growing
again, following DLR established to connect
London Eye
post-war decline (1999) to Canary Wharf
London City
Airport (1987)
POP.
YR.
Millenium
Thames Eurostar from Dome (1999)
Clipper Waterloo (1994)
(1999)
Zone 1 Significant reliance
1999
on government grant
Zone 2 and limited modal
integration
Zone 3
Zone 4 Development of a
GLA Act (1999)
zonal fare structure
Zone 5 paves way for
creation of TFL12
Invest & Expand Congestion
High levels of
transport
Charge investment
(2003) geared towards
Crossrail
2015
2012 Olympics
approved and
TFL created
construction
(2000) begins
Focus on service
performance,
Introduction reliability and
of Oyster DLR ext. addressing backlog
of maintenance
Congestion charge
zone extension (2007)
and contraction (2011)
First change of
Mayor (2008)
Agreement of 10 year
funding package -
providing stability and
enabling long-term
Significant
planning (2010) Cyclehire and cycle expansion with Transformational
2000
superhighways introduction of improvements to
introduced London London
Passenger growth (5% pa) Overground Underground
and fare rises bring (2007) and capacity and
sustained income extension of DLR reliability
London terrorist
attacks (2005) London Overground13
Uncertainty & Change 2m Londoners living
in areas with illegal
air pollution
1 in 10 contactless
payments in the
UK with TFL (2017)
Office workers begin to work
more from home and leisure Legal challenges
Fares frozen trips begin to fall to London's poor
during this
2016
air quality
period
Unwinding of
Government grant;
Cycling hits a
replaced by retention of record 745,000
2019
business rates trips a day in 2019
Car and
bike-sharing
services boom;
Congestion contributes to competition from
Rail passenger Rise in LGV traffic as
decline in bus performance non-TFL providers
demand plateaus online shopping grows
and passenger demand falls significantly
E-economy Brexit (2016-20)
takes off14
The COVID Crash Working from Air quality improves as traffic
home becomes initially decreases - later
Neighbourhoods the norm for returning to pre-Covid levels
and green spaces office-based
London Underground are more workers
patronage falls to 6% intensively utilised
of normal during the in lockdown
height of lockdown
2020
Congestion Charge initially paused,
then raised to £15 and with longer
hours of operation
Two emergency grant agreements
with central Government to cover E-scooters trials are
shortfalls in fare revenue COVID-19 announced
Low traffic community
streets set up across
the city
Rise in online shopping
and deliveries as
in-person retail declines15
How has the ‘Covid Crash’ impacted TfL’s finances?
Not everyone can work from home, but ‘Paying’ (to TfL) trips ‘Non-Paying’ (to TfL) trips
in London a higher proportion of workers
can than elsewhere in the UK. During
the pandemic it was found that 57.2% of
Londoners worked from home compared to
46.6% UK wide.
This has led to substantial declines in
commuting journeys into central London (the
Central Activity Zone - CAZ). From a financial
perspective, these are the most high-yielding
journey types for TfL – peak hour commutes
that typically occur on the tube. A 10% fall
in commuters to the CAZ results in losses of
£300m for TfL, all other things being equal.
People are, however, making more local
trips near their homes. This generally means
more trips by car, walking or cycling – all of
which result in no or minimal revenue to TfL,
but which rely on longer-term investment
and support.
Photo by Roman Koester on Unsplash16
Indicative impact on TfL revenues
from different types of travellers
Example case studies
Young professional Experienced professional Key worker e.g. NHS On-site engineer
Frequently commuted into Frequently commuted into central Frequent local commuter who Travels all across London,
central London pre-pandemic, London pre-pandemic (with has been working throughout including central London.
now works from home 5 days some home working), now works the pandemic. Slight increase in Previously used public transport
per week. Has increased travel from home 5 days per week. private car use for local trips due but now uses private vehicle.
locally, with greater likelihood of Has increased travel locally, to health concerns, but generally
cycling/walking options for these occasionally by bus, but greater takes the bus for commute in
local trips. likelihood of private car usage for same pattern as pre-Covid.
these trips. Lives in outer London.
• Fare zone: Zone 3 to • Fare zone: Zone 6 to • Fare zone: n/a • Fare zone: CCZ/ULEZ
Zone 1 Zone 1 • Travel mode: bus • Travel mode: private car
• Travel mode: Tube • Travel mode: Tube
Change in TfL income per day
-£8.50 -£19.10 No change +£8 (net)
Change in TfL income since March 2020 ~180 working days
-£1,500 -£3,400 No change +£1,400 (net)17
Funding models have changed with these broader shifts in
the function of London’s transport network
In the 1980s and early 1990s, London was heavily
reliant on grants from central Government to fund
the transport system. In the 2000s, passengers £8
and revenues started to grow dramatically, due to
Billions, nominal prices
major capital investments, strong economic and
Other
£6
population growth and – importantly – the benefits
Retained Business Rates
of integration under the newly-created TfL. This led Government Grant
to a lower grant requirement. £4 Streets (Inc. CCZ and ULEZ)
Rail
For much of the past decade, the London
Bus
Underground has generated a sizable operating £2
London Underground
surplus, which contributed to TfL having one of the
highest farebox recovery ratios in the entire world. £0
Income Costs Income Costs Income Costs
The Government grant was replaced with business
rates retention during this period, but success at
Invest & Expand Uncertainty & Change Covid Crash
the farebox meant that this made up a smaller
2000-2015 2015-2019 2020
proportion of the overall funding package.
Shift to reliance on farebox London Underground Pandemic decimated
from London Underground; revenue generating, fare revenue, requiring
Note: the summary figures at right are indicative of the scale of costs and major investment and subsidising bus services; emergency Government
revenues across different parts of the transport network in these eras. They system expansion delivers business rates retention support
are intentionally an oversimplification and not intended to provide a specific major passenger growth replaces grant
or comprehensive overview of the complete financial position in these Initial estimates for FY20/21;
FY11/12 figures used to FY19/20 figures used to see notes at left
years. The graphs only include operational costs and income.
represent this era represent this era
FY2020/21 figures are rough proxy estimates developed in early Dec 2020,
prior to the announcement of London entering a ‘Tier 4’ lockdown and the
further tightening in early January. The revenue figures are thus likely to be
a significant overestimate.18
Implications for the future
The growth and improvement of London’s transport network has
been instrumental in the capital’s economic success over the
last half century, and in its move to become a more sustainable
‘public transport city’. This network has become the envy of
many other global cities for its high-quality performance and
continual adaptation in the face of change. A deterioration in the
quality of the transport network in London would impact directly
on London and the UK’s economic recovery post Covid and
significantly reduce our ability to deliver a green recovery that
meets our commitments on carbon reduction.
The underlying funding model for transport in London has
changed over the years and needs now to evolve again to meet
the city’s future needs. Seeking to return to a past model would
be wrong on two counts.
First, these previous models are ill-suited to the current way
in which decisions and investments are made in London. For
instance, they mostly preceded the welcome move towards
greater devolution of local powers and accountabilities.
Second, such a backward facing step would fail to respond to
the many drivers of change occurring pre-Covid – technological,
lifestyle, work. A new model was always going to be needed
soon. Covid simply accelerated the timetable. For the sake of the
economy, the environment, and our quality of life, a new approach
will be needed to meet the challenges of tomorrow.
Photo by Andrew Nothstine19
Shaping that future
Since the 1980s, London has re-asserted We should actively seek to remain a hub, enjoyable human interactions – and makes
itself as a leading global city. And much both domestically and internationally. We us more resilient to future shocks. We should
of what has made London attractive over should choose to be open and connected to choose to prioritise our environment, both
the last three decades will return as the the world. We should choose to support the locally and globally. We should choose to
pandemic fades. But some things will have great cultural and educational institutions that make the capital work, for everyone. And we
changed for good. London will need to give the city life. We should choose to invest should choose to believe in the city, both as
respond and adapt if it is to thrive. This in the infrastructure that enables efficient and a place and as a concept.
future is something that we will shape; not
something that will happen to us.
This latest chapter in the life of the capital
will likely involve people travelling into central
London less frequently and for different
reasons. But if people are travelling less
frequently, then they may be prepared to
travel further. And if spaces do open up –
be it on the 08:15 into Victoria, or in central
London office blocks – it is not difficult to
imagine the new, and perhaps more diverse,
people who will fill them. This could bring
fresh energy to the city and maintain, or
increase, its attractiveness as a destination.
London can take decisions to improve its
chances in the competitive environment of
global cities.
Photo by Tomek Baginski on Unsplash20
Imagining a future for London transport
Shift to net-zero transport system
Increased local activity
enhances London's 'city
of villages' reputation
New and more
dynamic uses in the
2030
Central Activity Zone
Satellite and
co-working offices
Dynamic system replaces peak travel
revive the high street
times; live updates on passenger
Green network of walking numbers and cheapest travel times
and cycling routes set up
to connect parks and
nature across the city
Investment in public
realm - creating Affordable electric
new destinations, transport and new
reasons to visit and routes connect
a safer and more suburban communities
inclusive city
2021 Electrification of black cab fleet, 'Collectivo'
initiatives, support for elderly and goods delivery
ULEZ Extension
(2021-22)21
The challenge
Influencing and shaping
the changing city22
Significant global and local trends are shaping a new era
for cities, and the transport systems that support them
Trends in major cities across the globe
Changing priorities for urban places – most cities Transport critical to decarbonisation – transport is Changing view of the role of streets – most cities
are moving towards more holistic and sustainable increasingly seen as a key enabler for decarbonisation are now adopting a view of streets as places for
approaches to enable ‘good growth’ and economic and other policy aims far beyond just moving people people, and not just cars – with implications for urban
competitiveness characterised by creating liveable, & goods including health, social and economic equity, design, placemaking, active travel, and road usage.
diverse and inclusive communities. unlocking regeneration opportunities and supporting
housing development.
Rising cost of living – many successful cities are Increasing moves towards ‘Digital Lifestyles’ Growing prevalence of shared mobility options –
facing serious affordable housing crises and other – e-commerce, e-entertainment, e-learning are all private hire vehicles, bikeshare, car share, dockless
high costs that exacerbate inequality. becoming a more common part of everyday life. bikes, electric scooters all booming.
Global trends particularly
relevant to London
A slowing of population and travel demand growth Increasing freight and servicing / delivery trips – Increasing adoption of active travel opportunities
– according to the Travel in London 13 (TIL13) report, a freight now accounts for a third of all vehicle trips in – the percentage of Londoners undertaking at least 20
summary of travel and transport trends produced annually the Central London during the peak.1 minutes of active travel per day has increased to 42
by TfL, ‘population, economic and societal change led to percent (TIL13).
slowing growth of travel demand in London in the four years
up to 2019… London’s population increased by just 0.6 per
cent in 2019, the slowest rate of growth since 2004.’23
These trends will have significant impacts on how
people travel in London – but these impacts are
highly unpredictable
Projecting future travel demand is more uncertain now than at any point in TfL’s existence.
The pandemic will have significant effects on travel patterns – many of which cannot be forecast
with certainty at this stage. These include:
Economy Lifestyle Experience Technology Political
Employment and wages One of the most influential Successful cities will New transport technology Policy and investment
have an obvious impact determinants of future travel increasingly be those that has been a key driver of choices, for example
on commuting trips – but demand will be the degree offer unique and diverse change over the last five related to fares, fuel duty,
also leisure trips, which are to which working from experiences in high-quality years, underpinned by the zero emission vehicles or
correlated to disposable home becomes the norm. urban environments. The smartphone – new ways active transport, all affect
income. During the 2008 Most analysts believe that ability to attract people back of booking transport have the choices travellers will
recession there were 1.7 businesses and their staff into urban centres will rely in unlocked private hire, cycles make. So too do wider
million fewer passenger trips will want to return to the part on the quality of these and now e-scooters in some political decisions. For
than in the previous year office for part of the week experiences, perceptions of places. Electric vehicles and – example, population growth
as London GVA declined but probably not every day. safety and well-being, and in time – autonomous vehicles in London, a key driver for
by 5.5%. The medium Where this balance lies ease of access. This places could bring environmental travel demand, has been
and long-term impact of will be critical. Additionally, greater emphasis on the benefits but also new significantly dependent on
both Covid and Brexit on changes in leisure activity quality of our public spaces challenges and uncertainties. international migration. The
the London economy are have resulted in fewer trips and how these spaces Technologies and business key point here is that we
subject to widely varying on public transport as local are managed and used to models can be expected to have agency, at least in part,
projections and forecasts. and online consumption attract new visitors. London’s continue developing rapidly, to shape trends through
increases, especially in retail success in this regard will in ways that are difficult to policy choices.
but also in hospitality. have an impact on future project 5-10 years out.
travel demand in the city.24
Scenario planning for the future
The broad range of ‘unknowns’ discussed on then undertaken some rudimentary, high-level There are, of course, dozens of other possible
the previous pages means that we need to modelling to look at the indicative scale of scenarios for London’s medium-term future.
consider various scenarios for the future. impact each could have on travel demand Some of these scenarios are far more
Transport for London set out their recovery in London, and the corresponding impact pessimistic than those assessed in this report.
planning framework in the Travel in London 13 on fare revenue. We have chosen a base To keep matters simple, maintain general
annual report. We are focused primarily on the year of 2024/25 for this modelling, as it is alignment with TfL and GLA projections for
stage characterised by TfL as ‘steady state distant enough to assume we will beyond the the mid-2020s, and fit with our vision for
recovery,’ a point in time in which restrictions pandemic but still falls within the range of TfL’s London’s success, we have elected to base
to daily life are lifted and the Covid pandemic most recent five-year business plan. this analysis on the two scenarios that follow.
is largely under control.
TfL sets out two possible scenarios for that
Potential scale of ridership decline at both
period: ‘return to nearly normal’ and ‘change
rail stations (light purple) and bus stops
to London.’ In the first, travel in London returns
(dark purple) in London, 2024/25 under
to something resembling pre-pandemic, but
Scenario 1 (see following page).
demand for public transport and economic
activity have not fully reached 2019 levels as
some shifts in preferences and behaviour
have ‘stuck.’ In the latter, the changes which
are occurring now largely continue – a
pronounced shift to working from home and
substantial rise in local area travel, putting
pressure on road space.
We have expanded on these scenarios with
our views of what this period might look
like – in the absence of major interventions
Image source: Arup
between now and the mid-2020s. We have25
Two scenarios for the ‘steady state recovery period’
Scenario 1: Redistributed London
(correlates loosely with TfL’s Change to London scenario) Major change Minor change
In this scenario, the pre-Covid
gravitational force of Central London Non-TfL
begins to decline, as the attractiveness
and purpose of cities changes. While the Radial Rail & Tube Bus Commuting Cars* Walk/bike
Trips into
wider region continues to grow, the pace Central London
is far more modest and the distribution
of this growth more dispersed. The Orbital/outer rail
population of Inner London stagnates or
Local trips
begins to decline, as residents who no Local bus +500m annual trips
longer have a need to be close to their
*
jobs move further away in search of more
space or lifestyle changes.
Working from home has a sustained
impact on how people choose to live, with
Compared to 2019** Compared to TfL business Compared to 2019** Compared to TfL business
reductions in central London commuting plan for 2024/25 plan for 2024/25
from all parts of the commuter belt, and
in particular those traveling furthest. There
is a small increase in leisure trips both
locally and into central London, as a
-7% -7% -6%
result of commuters having slightly more
free time. Travel in local neighbourhoods
increases substantially, typically by private
car, walking, or cycling. -16%
* Pay via congestion charge or ULEZ.
** Future scenario years include Elizabeth Line and Northern Line extension, making apples-to-apples impact compared to 2019 more severe than it appears.26
Two scenarios for the ‘steady state recovery period’
Scenario 2: A new equilibrium
(correlates loosely with TfL’s Return to Nearly Normal scenario) Major change Minor change
While the working from home trend
continues, Central London remains
an attractive place to live, work, and
Non-TfL
play. The reduction of “in-person” Radial Rail Bus Commuting Cars* Walk/bike
working means large companies Trips into
require a smaller footprint, opening Central London
up space and opportunities for new
businesses, including small and medium
enterprises, to locate more affordably Local trips
in Central London. So while the types Local bus Orbital/outer rail +250m annual trips
and frequencies of commuter journeys
into Central London may change, the
overall labour pool of commuters will
grow – offsetting some of the impact of
increased working from home.
Compared to 2019** Compared to TfL business Compared to 2019** Compared to TfL business
Similarly, in the residential market, while plan for 2024/25 plan for 2024/25
some may choose to relocate further
+1%
afield to areas outside of London, this
reduced demand will create opportunities
and attract aspiring Londoners who were -2% -1%
previously unable to afford the housing
costs associated with inner London living, -8%
as housing supply continues to increase
and demand softens.
* Pay via congestion charge or ULEZ.
** Future scenario years include Elizabeth Line and Northern Line extension, making apples-to-apples impact compared to 2019 more severe than it appears.27
What are the high-level conclusions from these scenarios?
On average, Londoners’ make 2.1 trips per Whilst the increase in local trips using active planning and investment. It would be harmful
day, a steady decline from around 2.5 trips per modes is welcome, the increase in local car to the ‘green economic recovery’ of London
day in 2013. The type of trips Londoners make trips is reversing a modern success story in to allow levels of car usage to start growing
has also been changing. The largest fall in trip London, unless measures are introduced significantly again, adding to congestion and
rates over the last 10 years has been in private to prevent this happening. There is real pollution in local neighbourhoods. To avoid
car trips. From 2005 to 2018, rates fell 30% as opportunity to deliver greener and more this requires a new approach to how we
inclusive neighbourhoods with a focus on think about the use of road space in London,
car ownership and availability declined.
active travel, but this will require careful including the way in which we pay to use it.
Under our indicative modelling, the increase
in home working in Scenario 1 results in 500m 18
fewer trips to work per year by 2024, reducing 2019/20 Our projections 2024/25
16 mode shares (Scenario 1) mode shares
the total number of work-related car and
public transport trips across Greater London.
Londoners ’ average t rips per week
14
As people spend more time at home, this
Active
Active
12 34% Active : 37%
could result in a corresponding increase in +9% in 2024/25
local trips, which are more likely to be made vs 2019
10 Walk
by car or walking / cycling. The scenario we
Cycle
have tested – which to reiterate assumes no
Car modes
8 Private Vehicle
Car modes
36% Car:
major interventions – suggests a 9% increase 37% Taxi/Other
6 +2% vs 2019
in active travel trips by 2024/25 (compared to Bus/tram
Underground/ DLR
2019), increasing the overall share of active 4
Other Rail
travel trips in London from 34% to 37%. This
Public Transport
Public Transport
29% Public Transport:
is set against an increase in car trips and a 2
-16% vs 2019 26%
significant reduction in public transport trips –
0
16% less in 2024/25 compared to 2019 levels. 2013/14 2014/15 2015/16 2016/17 2017/18 2018/19 2019/20 2020/21 2021/22 2022/23 2023/24 2024/2528
What does this mean for TfL’s finances?
TfL relies heavily on passenger fares to fund potential cost savings in the following section.) forecast, new approaches will be needed to
operations. The likely decline in passenger We have also assumed that TfL will not take solve the likely ongoing and sizable gap.
numbers on rail and bus services in the on any new debt to cover operating costs in
medium-term, as forecast in our two scenarios, the next few years, and instead and will need
will place a significant strain on TfL’s finances to work with central government to find a
even beyond the current crisis period. bridging solution. Capital enhancements are
not included in this assessment. Devolved
We have undertaken a high-level assessment
revenue streams like the current Business Rate
to understand what this impact might look like
Retention could come under greater pressure
in the mid-2020s, and the size of the potential
in the post-Covid era, and thus we have
funding gap it will create. Our estimates
shown this income stream as potentially being
suggest that rail revenues may be down by
lost or reduced – and thus contributing to the
c. 18-26% compared to TfL’s current five-
future gap range.
year business plan for 2024/25. Bus income
is likely to be down from 2019 but largely in Based on this analysis, we estimate that the
line with the original TfL forecast for 2024/25. 2024/25 funding gap could be between £500
This is because the business plan already million and £2 billion.
included a fall in bus passengers and revenue,
This is a very high-level and indicative analysis,
largely due to improvements to the rail network
and is oversimplifying a highly complex
(opening of the Northern Line extension
financial picture. However, our estimated
and Elizabeth Line) as well as changing
gap is within the range of conclusions
demographics and incomes in the city.
reached by the Mayor’s Independent Review
For simplicity in this analysis, we have commission, which suggests a gap of £1.5
assumed that costs and other revenue to 2 billion (although this includes key capital
sources remain broadly similar to the figures enhancements, which our assessment does Photo by Christopher Burns on Unsplash
in the business plan for 2024/25. (We discuss not). It is clear that under any scenario or29
These scenarios result in a potential projected funding gap
between £0.5 to £2 billion in FY2024/25 (operations only)
£9.5bn The Potential
£9bn Funding Gap
£0.9bn
£8.5bn
£1.3bn
£1.0bn
£7.9bn £0.5 - 2bn
£0.9bn
£0.7bn £0.9bn
£0.7bn
£1.0bn
£0.6bn
£1.0bn
£0.7bn
£1.7bn
£0.7bn TfL Controlled Expenditure and
Income Sources
£2.8bn £1.7bn Rail (TfL Rail, LU and DLR)
£1.6bn
Buses
Streets (Cycle Infra, CCZ, ULEZ)
£5.2bn Other (Property, Media, Central Costs)
Additional Expenditure Liabilities
£4.2bn
£3.6bn £3.7bn Financing & Renewals Costs
External Income Reliance
Business Rate Retention Income
Expenditure Income Scenario 2 Income Scenario 1 Income
Existing TfL Five-Year A New Equilibrium Redistributed London
Business Plan
and new local revenue generation30
New models
Funding approaches
for the next era of
transport in London31
Pathway to a new model for London
There are three principal sets of levers that By the end of the 2020s, however, transport From the perspective of central Government,
can be used to support London’s transport will be quite different than it is today, as a London’s path could provide important ideas
system over the next decade and beyond. result of the trends discussed in this report. and insights that can be adopted across
These are: TfL must start evolving into a new phase of the country. With a ban on the sale of petrol/
1. ‘Right-sizing’ the system to bring its organisational life - underpinned by a new diesel vehicles by 2030, current revenue
changing levels of demand in line with mindset, new partnerships, and critically a mechanisms such as fuel duty and vehicle
costs and revenues; new set of tools to navigate and manage this excise duty will need to be revised or replaced
change successfully. within the next decade.
2. Seeking new funding from traditional
sources, such as general taxation or A decade of transition: conceptual glide path to a new model
transport-related fares and charges
(some of which are deliverable now, and
Relative importance to the funding solution
some of which would require changes
in law or policy); and Traditional levers
Deliverable now Require change in law or policy
3. Looking at new models or ideas that • Central Government grant • Devolution of London-raised revenues
are tailored to emerging opportunities • Existing Mayoral revenue sources • New Mayoral powers
• Fares and charges
and can be introduced alongside the
traditional levers.
In practice, the appropriate solution is likely New tools
Alternative approaches
to be a blend of these categories, particularly reflecting emerging
during a near-term transition period. The opportunities
devastating financial impact of Covid will
require continued central Government
support for at least the next couple of years, Right-sizing the system
and any major new initiatives will take a Adjusting service levels to meet reduced demand
similar amount of time to be designed,
consulted on, and implemented. Today 2025 2030 and Beyond32
Cost reduction
The most direct approach to reducing costs is cutting Based on our view that the likely funding gap is in the order of £0.5-£2 billion, this
services. The Mayor’s independent panel assessed means that right sizing could ultimately contribute somewhere between c.8 and
options for reducing bus and rail frequencies, closing 40% of the solution.
the Night Tube and some stations at weekends,
and eliminating cycle hire and ferry services. They Illustrative
estimate that taken together these drastic cuts could Illustrative Action Potential Annual
have a net financial impact of up to £427m per year. Savings
The commission notes, however, that there would be
Seeking efficiencies through digitisation,
significant and unequal impacts from such a move. Organisational
Efficiencies
management processes, HR policies, and £50-60m
other actions
Aggressive service cuts also run the risk of catalysing
a spiral of decline in which poor quality services lead to 10% peak-hour frequency reduction on
lower passenger numbers and therefore lower revenues Rail Victoria, Northern, and Bakerloo Lines £40-50m
which, in turn, require further cuts. Such an approach
would not meet the vision set out in this document, the
Mayor’s Transport Strategy or central government policy Bus + Tram Reduction of 25m annual bus km (5%) £75-100m
for a thriving and sustainable London.
That does not mean that costs cannot be reduced.
Other Services Privatise cycle hire and reduce river services £5-10m
To avoid major negative impacts on the quality of
TOTAL
London’s transport network there are two primary
ways in which TfL can reduce its cost of operations: (1) £170-£220m
seeking to harness greater organisational efficiencies,
and (2) better aligning – or ‘right-sizing’ – services with Contribution to a £2bn gap
future demand.33 1. Organisational efficiencies 2. Right-sizing services with demand TfL has undertaken substantial measures to reduce More promisingly, the system could be ‘right-sized’ costs and improve organisational efficiency. On a like- to realise cost reductions. This is not about cutting for-like basis TfL has managed to reduce its annual services to save money, but instead ensuring operating costs by £200m from 2015 to 2020, through that London’s transport network is responsive to reducing management overheads, streamlining changing demand patterns. For example, in much of operations, and improving asset performance. Much of central London bus routes run in parallel to the tube the low hanging fruit has been harvested. Any further network below. This is due to the peak hour capacity actions of a scale sufficient to have a material impact – constraints on the underground and the pricing such as major changes to salaries, pensions, benefits, structure that makes the bus the most affordable and working practices – would bring significant option for many. A more efficient solution might be organisational and political challenges. practicable in the post-pandemic world. Just because these would be challenging does not Approaching the question of operational cost mean they should be dismissed, however, and other reduction from this perspective would minimise options can always be pursued, including increased impacts on customer experience and thus avoid the use of digitisation, automation, and other emerging ‘decline cycle’ where lower service quality creates technologies that are fuelling efficiency improvements further falls in demand and revenue. Our high-level in other sectors. But on balance, we believe it will assessment suggests that £120-160m per year become increasingly difficult to identify and capitalise could be saved through such right sizing measures, on further efficiencies that are capable of being whilst striking the right balance between scaling the delivered without serious impacts on London’s system to meet new demand levels, retaining vital transport operations. connectivity, and maintaining the services upon Even if a further 10% reduction in corporate/non- which London’s residents, visitors, and business rely. operational spending could be found, the c.£50-60m that would be saved annually would only fill
34

              Traditional levers:
              Options available under current laws and policies

There are three main categories of traditional     However, such an approach could be                could be raised further. This would have major
levers that are available now:                     expected to meet with public and political        equity impacts and a dampening impact on
1. A central Government grant, provided            opposition outside of London, where networks      economic activity, as well as lead to further
   out of general revenues;                        are not funded in this manner. Even if such an    declines in ridership and revenue.
                                                   agreement was struck, it is always susceptible    Other options could include expanding the
2. Local revenue-raising sources that are          to a change in government policy.
   currently within the Mayor of London’s                                                            congestion charging scheme, for instance to
   control; and                                    Sources in current Mayoral control                the North and South Circulars as proposed
                                                                                                     by DfT; reducing concessions passes that
3. Changes to existing transport-related           Currently council tax is the only tax the Mayor
                                                                                                     provide free travel, for example means-testing
   fares and charges.                              has broad flexibility to vary. For instance,
                                                                                                     the Over-60s pass; or introducing a workplace
                                                   the Mayor has recently proposed a £15
                                                                                                     parking levy (however this is currently
Government grant                                   Band D council tax precept to help support
                                                                                                     designated as borough led policy as set out in
                                                   concessionary fares for under-18s and over-
The most straightforward long-term solution –                                                        the MTS). There are also other, less ‘traditional’
                                                   60s. The Mayor has also levied a business
and the only viable short-term solution – is a                                                       sources available to TfL, but most of these are
                                                   rate supplement to fund part of the cost of
stable agreement with Government to fund the                                                         unlikely to raise significant revenue.
                                                   Crossrail. This funding stream is hypothecated
gap, in recognition of the critical contribution
                                                   for that purpose.                                 These options all have significant negative
that London makes to the wider UK economy
                                                                                                     consequences, acceptability challenges or
and Government balance sheet.                      Transport-related fares and charges               delivery risks. These could potentially be
This support could be structured similarly to      The Mayor also has power to vary a range          overcome and the negative impacts mitigated,
the five-year Periodic Review process utilised     of transport-related charges in the city. Fares   but on balance they are unlikely to provide the
by Network Rail and Highways England – a           are already increasing by RPI+1%, but they        right long-term solution for London.
‘tried and tested’ model which ensures that
investment is supporting defined outputs
agreed through a robust regulatory process.
35
Traditional levers:
Options available under current laws and policies
Scale of potential Contribution to a Medium-term
Option Assumptions
revenue £2bn gap plausibility
Central Government grant
Central Government grant to TfL (long-term In the short-term grant is the only to meet the funding gap; a
n/a
commitment) longer-term, multi-year solution is unlikely to be stable over time
Taxation sources within current Mayoral control
A new Mayoral Precept, comparable to the London
Additional council tax precept £60m Olympic & Paralympic Precept, which equates to a £20
impact on Band D properties
Transport-related fares and charges
Raise fares above current agreement £100-150m Fare rises increased to RPI+2%
Expansion of congestion charge zone £500m New £5 charge within North and South Circulars
Means-testing the over-60s free travel
discount £65m 50% of £131m lost revenue from Over-60 pass
Extrapolation based on Nottingham revenue (income shared
Workplace parking levy £200-250m with boroughs)
Private hire surcharge £75m £1 per-trip surcharge
A 50p per trip surcharge applied to all bikeshare and e-scooter
Bikeshare and e-scooter surcharge £15m trips
Station naming rights £10m £1m annual charge for 10 ‘non-landmark’ stations.36
Traditional levers:
Options requiring changes to current laws and policies
There are two main categories of traditional Two London Finance Commissions (LFC, the Two other forms of taxation currently not
levers that would require changes to first established by the Prime Minister when available to the Mayor of London, but which
current law or policy, and thus could not be Mayor; the second by the current Mayor) have been discussed historically, are a
immediately implemented: have examined these options. The LFC found hypothecated employment tax for transport,
1. Devolution of taxation revenues; and that, as well as compelling equity arguments similar to the ‘Versement Transport’ in France,
for London retaining more of its taxation to or a tourist tax. While an employment tax has
2. Devolution of further fiscal revenue meet its public spending needs (which in turn the potential to generate significant revenue,
raising powers to London. underpin the city’s tax surplus), there are also it would be difficult to implement at a regional
strong efficiency arguments for some taxes. (rather than national) scale and is an entirely
Devolution of revenues new concept in the UK context.
For example, if London retained more of its
Government could agree to devolve some
business rates over time, then the incentives Tourist taxes are simpler and adopted across
portion of taxes raised in London back to
for dense development, which would reinforce much of the world, but would make a relatively
London. For example some of the £2.7bn
economic growth, would be stronger. Further small contribution to the TfL funding gap. This
business rates tariff paid by London to central
devolution of London-raised taxes should be new revenue source would also be subject to
Government could be re-invested into London.
part of any stable TfL funding settlement. competing demands from other needs across
Alternatively a small proportion of VAT, income
the city, meaning the portion going to TfL
or corporate taxes could be devolved to Devolution of powers could be expected to be even smaller.
London – however, this is an unprecedented
measure for any region of the country. Perhaps Central government could also devolve further
more attractive to Government would be a fiscal revenue raising powers to the Mayor of
devolution agreement for VED or fuel duty, London, as recommended by the LFC. While
both of which are declining revenues and such a settlement could also be subject to
could instead be re-purposed by London into policy changes, it is likely to be more resilient
a more sustainable revenue tool (discussed than simple government grant.
later in this section).37
Traditional levers:
Options available under current laws and policies
Scale of potential Contribution to a Medium-term
Option Assumptions
revenue £2bn gap plausibility
Greater devolution of taxes generated in London
25% of current BR Tariff paid by London
Increased retention of business rates £700m to Central Government
2p per £ of rateable value, doubling the
Additional business rate supplement £200m existing supplement
Retention of London-generated general taxes 0.5% - 3% retention of estimated total
(e.g. VAT, income, corporate)
£100-1,000m VAT receipts collected in London
Estimate of total VED collected annually
Retention of VED paid by Londoners £500m from vehicles registered in London
50% retention of fuel duty paid for all
Retention of fuel duty paid by Londoners £850m vehicle kilometres driven annually in
London
New taxation raising powers provided to Mayor
1% on all London employees above a
Employment tax £1,400m base wage level
£4 per night levy on all commercial
Tourist tax £100m accommodation38
Introducing new models for a new era
While the ‘traditional levers’ above have an There are also a series of pressing challenges We have proposed four building blocks
important role to play in TfL’s future business London faces including the need for a strong for a potential new model, each of which
model, and are the only course of action and stable economic recovery, which also is intended to spark creative thinking and
available in the short term, we believe now is delivers the changes needed to meet our net debate. Each of these carries significant
the time to explore new models for funding the zero commitments. complexities, some of which are discussed
London transport network to be introduced in this report. They would require
alongside these. The impact of Covid-19 will This is a rare opportunity to re-evaluate transformational change, which is difficult and
mean there is a fundamental shift in how what we want from our transport network in can be disruptive, especially in complex cities
people use the transport network in London. London; to acknowledge and embrace the like London. But we believe these concepts
The relationship between home and work has changes that are taking place in society; and have merits worthy of further consideration,
changed for many Londoners, influencing the time to ‘think big’ about the right model for with an optimal long-term solution leveraging
their attitudes, preferences and behaviours. the next era of transport in London. elements of each.
London Vehicle Smart Road Pricing London Mobility Hub Integrated Fares
Ownership Duty Paying to drive in London – Capturing new modes Reforming the fare system
Replacing VED with a smarter and greener of transport and mobility and network
new model for accessing providers
London’s road network39
Building blocks of a potential new approach
London Vehicle Smart Road London Mobility Integrated Fares
Ownership Duty Pricing Hub
Replacing VED with a new model Paying to drive in London – Capturing new modes of Reforming the fare system and
for accessing the road network smarter & greener transport and mobility providers network
At the moment, all vehicles registered to Introducing a new charging mechanism The range of mobility choices is Simplifying and harmonising existing fare
an address in London pay Vehicle Excise for driving a vehicle in London would growing all the time, and this should be structures would allow more effective
Duty (VED) to the Government based on help discourage the potential for embraced and welcomed rather than use of existing transport capacity.
a combination of vehicle value and CO2 increasing vehicle use and create a resisted. London has the potential to This concept would integrate the flat-
emissions. Annual VED contributions source of income for investment in the be a global benchmark for embracing fare bus and zonal rail system into a
from Londoners towards investment wider transport system. Some road the best transport technology has to single network-wide approach to fares.
in the non-London road network are users already pay a flat charge to drive offer in a mature global city context. Removing the cost differential between
around £500m. This system has to be in London (via the CCZ, ULEZ, or tolls). Incorporating these new travel choices services, travellers will choose the option
reformed within the next decade to Evolution of this scheme to a more as part of the transport family requires a best suited to their journey. In central
reflect the shift to electric vehicles, and dynamic system reflecting the type different approach where TfL is more of London, this will often be the tube,
there is an opportunity for London to of vehicle, and the potential impact it a commissioning and licensing authority, allowing bus services in these congested
be a pilot for the new system, based on is having in terms of congestion and providing a platform and common areas to be reduced – saving substantial
a ‘membership fee’ approach where pollution would allow people the flexibility standards for new operators to enter the costs and freeing up road capacity.
owners of vehicles pay an annual charge to drive where and when they wanted on market, and including a new mechanism Because bus fares would increase in this
to be able to own a vehicle in London. the basis the impact of their journey was for charging. model, new subsidies for those on low-
reflected in the price they paid. incomes could be introduced.
Contribution to a £2bn gap Contribution to a £2bn gap Contribution to a £2bn gap Contribution to a £2bn gap
£300-800m £1,200-1,800m £200-250m £250-500m
Key Additional Benefits Key Additional Benefits Key Additional Benefits Key Additional Benefits
• Expedites clean vehicle transition • Less congestion and pollution • Embraces innovative services • A simpler experience
• London in control of its own taxation • Flexible to changing priorities • Future-ready for new technologies • Better modal integration
• Can link with other Mayoral strategies • Uses road space more efficiently • Multi-modal trips become easier • More space for active travelYou can also read