TAURANGA CITY'S ACCESSIBLE STREETS PROGRAMME - Tauranga City Council
←
→
Page content transcription
If your browser does not render page correctly, please read the page content below
TAURANGA CITY’S ACCESSIBLE STREETS PROGRAMME
SUPPORTING WALKING AND CYCLING IN OUR COMMUNITIES
Tauranga cycling network programme

Table of Contents
Executive Summary

     Purpose ............................................................................................................................................................. 4

     Improving transport choice in a growing city ........................................................................................... 4

     Refining the cycling investment story .......................................................................................................... 5

Part A: Strategic context ................................................................................................................................. 7

     Problems associated with cycling in Tauranga......................................................................................... 7

     Evidence for the problems ............................................................................................................................ 7

     Benefits of addressing problems associated with cycling in Tauranga ............................................. 18

     Investment objectives .................................................................................................................................. 19

Part B – Developing the Programme ........................................................................................................... 20

     Cycling network options .............................................................................................................................. 20

     Option Assessment ........................................................................................................................................ 26

     Recommended cycling network ............................................................................................................... 29

Part C: Delivering the recommended cycling network ............................................................................ 32

     Phased Delivery Plan .................................................................................................................................... 32

     Economic Case ............................................................................................................................................. 38

     Financial Case ............................................................................................................................................... 41

     Commercial Case ......................................................................................................................................... 43

     Management Case ...................................................................................................................................... 44

Appendix A: Cycle Demand Assessment ................................................................................................. 53

Appendix B – MCA results ............................................................................................................................ 54

     MCA results: Tauranga cycling network options..................................................................................... 55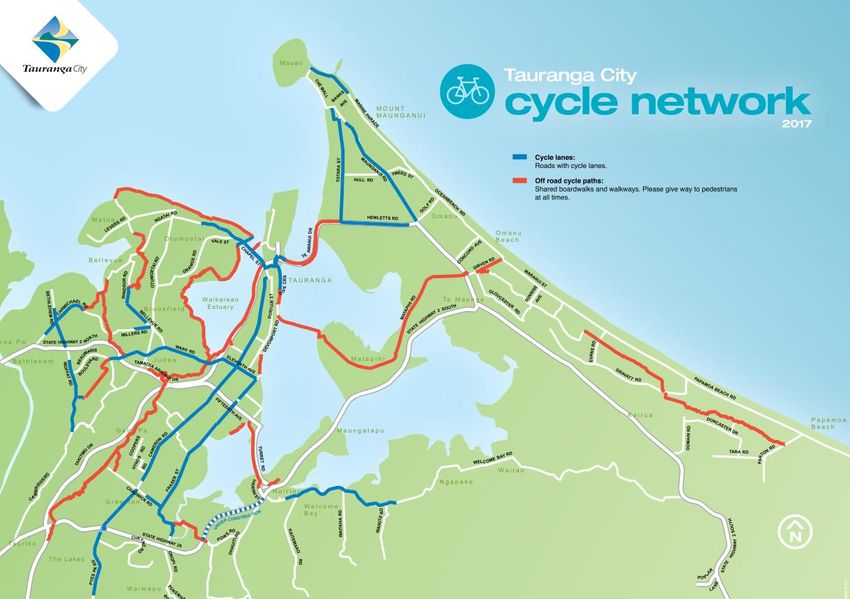
Tauranga cycling network programme

List of Figures
Figure 1: Projected 10-year growth allocations ................................................................................................................... 4
Figure 2: Overall cycle safety in New Zealand metro cities .............................................................................................. 8
Figure 3: Perceptions of cycling safety in different environments .................................................................................... 8
Figure 4: The perceived disadvantages of active transport modes ............................................................................... 9
Figure 5: BOP Region - Transport expenditure $m (NZTA and Approved Organisations) 2007/8 - 2016/17 ............ 12
Figure 6: BOP region - Forecast costs $m (submitted for NLTF investment) 2018/19 - 2023/24 .................................. 12
Figure 7: Total cycling expenditure funded by NZTA and Approved Organisations from 2007/8 - 2016/17 .......... 12
Figure 8: New Zealand household travel survey 2014-18 ................................................................................................. 13
Figure 9: Public survey on Tauranga transport choices, 2019*........................................................................................ 13
Figure 10: Tauranga City cycle network, 2017 ................................................................................................................... 15
Figure 11: Cycling and Pedestrian crashes in Tauranga, 2014 - 2018 ............................................................................ 16
Figure 12: Short car trips (potential cycle trips) 2018 (left) and 2043 (right) ................................................................. 23
Figure 13: Medium-length car trips (potential e-bike trips) 2018 (left) and 2043 (right) ............................................. 24
Figure 14: Potential major cycle routes ............................................................................................................................... 25
Figure 15: Map of recommended cycling network .......................................................................................................... 30
Figure 16: Priority areas for investigation ............................................................................................................................. 34
Figure 17: Priority areas for delivery 2029 to 2043 .............................................................................................................. 36
Figure 18: Route option and infrastructure – high level process and timeline (per area) ......................................... 37
Figure 19: Walking and cycling governance structure .................................................................................................... 44

List of Tables
Table 1: Capital expenditure for the Cycle Action Plan implementation ...................................................................... 6
Table 2: Pedestrian and Cycle Related Crashes in Tauranga City 2014-18 ................................................................. 16
Table 3: Cycling network options for Tauranga ................................................................................................................. 21
Table 4: Potential cycle and e-bike trips (morning peak hour) ...................................................................................... 24
Table 5: Criteria used in the cycling multi-criteria assessment ........................................................................................ 26
Table 6: Summarised MCA results to identify the optimal cycling network option ..................................................... 27
Table 7: Summary of forecast cycle network statistics ..................................................................................................... 38
Table 8: Discounted programme benefits .......................................................................................................................... 38
Table 9: Results alignment self-assessment ......................................................................................................................... 39
Table 10: Indicative cycling network cashflow.................................................................................................................. 41
Table 11: Proposed funding arrangements ........................................................................................................................ 42
Table 12: Cycling network monitoring regime ................................................................................................................... 47
Table 13: Key delivery risks and management actions .................................................................................................... 48

Page | ii
Tauranga cycling network programme

Document history and QA/QC
Prepared by NB Consulting, in conjunction with Flow Transportation Specialists and Tauranga City
Council staff.

 Version     Author                     Date          Reviewer                           Date
 V1.0        JS                         20-9-2019     Click or tap here to enter text.   DD-MM-YYYY

 V1.1        JS                         11-03-2020    Click or tap here to enter text.   DD-MM-YYYY

 V2.0        JS & BP                    17-04-2020    NC                                 17-04-2020

 V2.1        TCC staff, BP & JS         23-04-2020    Click or tap here to enter text.   DD-MM-YYYY

 V2.2        TCC staff, BP & JS         24-04-2020    Click or tap here to enter text.   DD-MM-YYYY

Page | iii
Tauranga cycling network programme
Executive Summary
Over the last 30 years Tauranga City has doubled in size and is now New Zealand’s fifth largest city. With
growth forecast to continue in the future, the city and wider Western Bay of Plenty sub-region have
undertaken an Urban Form and Transport Initiative programme business case to identify how best to manage
growth in terms of where people live and how they can move.
At the same time, the sub-region and city has started to change the way it is developing the transport system
and the way people use transport particularly at peak times. The changes mainly focus on and providing
viable transport alternatives (such as public transport, and personal mobility 1) to private vehicles, particularly
when travelling to work and school.
This cycling network programme is one component of a wider suite of initiatives being developed by Tauranga
City Council, in partnership with other agencies, to improve personal mobility, accessibility and travel choice in
Tauranga. Whilst this programme is focussed on cycling in the first instance, it is expected that secondary
benefits will accrue to other modes that can also utilise cycling connections and routes – such as walking and
small wheeled electric devices e.g. mobility and electric scooters.
The investment logic underpinning the programme is summarised below. It draws heavily on the investment
rationale outlined in the Tauranga Transport Strategy 2012-2042, and the Tauranga Cycling Plan 2017/18,
including the principle of enhancing cycling opportunities for all ages and abilities.
Problems:
P1: Perceptions of cycling safety risks acts as a disincentive to the uptake of people who want to bike
more or try biking
P2: Transport investment has historically focused on increasing roading capacity and less on other
transport modes, which has contributed to a high private vehicle usage when travelling to work and
education facilities
P3: The lack of protection for cyclists contributes to cycling related DSIs
Benefits:
B1: Cycling is widely accepted as a safe and attractive alternative transport choice in both existing
and newly developed urban areas
B2: Improved health, environmental, social, and place outcomes
B3: Improved access to opportunities, particularly for people with low levels of transport choice
B4: Increased safety for people using bikes
Investment objectives:
IO1: Increase of peak mode share of cycling to work trips in Tauranga from 3% to 8% by 2043
IO2: Double active travel in Tauranga from 200 annual km travelled by walking and cycling per capita
to 400km by 2043.
IO3: 25% reduction in annual walking and cycling DSIs in Tauranga from the existing 16 annual DSIs
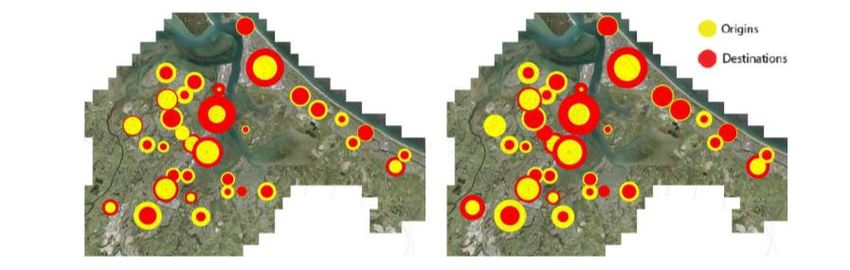
In developing the cycling network options, a cycling model developed by Flow Transportation Ltd (Flow) was
used to determine the key cycling origins and destinations model. The model was used to identify broad
1Personal mobility is used broadly to include people walking, cycling, using e-mobility devices (e-scooters etc) and other
mobility devices that are low powered, low speed, usually have two wheels, and are mainly designed to move one person
at a time.
i
Tauranga cycling network programme

areas where there is high potential demand for cycle trips across Tauranga City, and how these areas might
connect if appropriate cycle infrastructure was to be provided.

Drawing heavily on this strategic demand assessment, five different programmes were then tested to help
identify a programme that would best achieve the investment objectives identified above. The cycling
network options were assessed using a multi-criteria analysis (MCA). The assessment was based on the
quantification of benefits identified in the modelling work, together with an assessment of technical and
delivery considerations. The assessment was completed by NB Consulting and Flow.

The recommended programme, identified through the MCA, is a strategic cycling network based on the
development of key ‘Areas and Connectors’. This network focuses on key cycle arterials, including 99km of
new and improved cycle routes, together with traffic calming measures on local streets in some areas
(particularly around community facilities) to support safe and convenient access to connector routes.

A ‘hierarchy of principles’ were then applied to the strategic network to identify immediate priorities for
delivery over the next ten years. These principles included prioritising corridors / segments with a high
concentration of school trips, together with those that connect to high employment areas and facilitate travel
to the city centre. The resulting corridors in the Otumoetai/Bethlehem areas and Mount Maunganui/Bayfair
areas have been identified as focus areas for the next ten years, to progress delivery of the recommended
strategic network.

Over time, the recommended programme is expected to provide people of all ages and all abilities with a
safe and viable transport alternative to the private motor vehicle, to access key employment and education
destinations across the City. With potential to increase cycle mode share for work trips and school trips to 9.6%
and 14.7% respectively by 20432, the recommended option is predicted to result in a step-change in cycling
(including e-bikes) uptake, particularly within central Tauranga, Otumoetai and Mount Maunganui. The
quality and extent of infrastructure proposed means it will provide an integrated cycling network that will
generally resolve conflicts between modes, with the exceptions of key intersections. The forecast mode share
and average trip lengths under the recommended programme, together with the DSI savings, are closely
aligned with the stated investment objectives.

Key programme risks relate to consenting and constructability challenges, given the extent and complexity of
the physical works and public engagement that is likely to be required. It is expected that these issues, and
associated mitigation measures, will be considered in more detail during the single stage business case phase.

The provisional cost estimate of the recommended programme is $206-257m3, including pre-implementation
and property costs. The discounted economic benefits of the programme have been provisionally estimated
at $396m4, consisting mostly of walking and cycling health benefits, with smaller components of travel time,
safety, and decongestion benefits. There are benefits such as the reduction in transport emissions that have
not been included in the benefit cost ratio. Operating costs are estimated to be around 1% of the cycling
programme costs per annum or around $2.1 – 2.6m per annum, with whole of life maintenance and operating
costs estimated to be approximately $15 - 18m.

As a city-shaping infrastructure programme, the recommended cycling strategic network option has been
assessed as having a high results alignment against the Transport Agency’s Investment Assessment Framework,
for safety, access – liveable cities, environment strategic priorities. Coupled with the programme’s indicative
BCR range of 2.7-3.3, the overall priority of the programme is assessed to have an investment priority rating of
4.

2 Compared to a 2043 baseline of 5.0% and 8.8% respectively assuming no further investment
3 Based non-discounted costs, discounted the programme is estimated at $120-149m
4 Based on discounted benefits over the 30-year programme

Page | ii
Tauranga cycling network programme

TCC has sufficient confidence in the selection of the recommended network option, that it has started the
process for designing some of the key routes as per the recommended strategic network. A series of
area/corridor based single stage business cases (SSBC) will be developed over the next 6-12 months, to
identify the recommended route(s) and detailed designs. Engagement with key stakeholders and community
will occur as part of the SSBC process.

A guide to how the document responds to the relevant NZTA investment questions for the business case
approach is provided below.

 NZTA Investment Questions                                                                Document ref.

 Problems    Is it clear what the problem is that needs to be addressed (both the    Page 7
             cause and the effect)?

             Is there evidence to confirm the cause and effect of the problem?       Pages 7-16

             Does the problem need to be assessed at this time?                      Pages 7-16

             Is the problem specific to this investment (or should a broader         Pages 7-16
             perspective be taken)?
 Benefits    Have the benefits that will result from fixing the problem been         Page 17
             adequately defined?
             Are the benefits of high value to the organisation(s) (furthering its   Page 17
             (their) objectives)?
             Will the KPIs that have been specified provide reasonable evidence      Page 17
             that the benefits have been delivered?
             Are the KPIs both measurable and totally attributable to this           Page 17
             investment?
 Strategic   Have a sufficient range of strategic alternatives and options been      Pages 19-24
 response    explored (demand, productivity, and supply)?
             Is it clear what strategic alternatives and options are proposed and    See Table 3, pages 19-
             the rationale for their selection?                                      24, MCA in Appendix B

             Are the proposed alternatives and options the most effective response Page 28-30
             to the problem (comprehensive and balanced)?
             Are the proposed alternatives and options feasible?                   Pages 31-50

Page | iii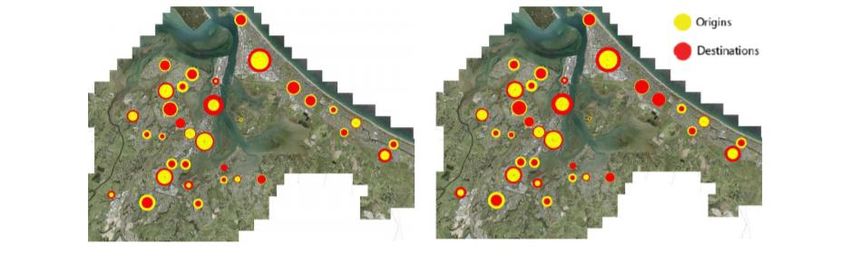
Tauranga cycling network programme

Introduction
Purpose
This cycling network programme outlines the rationale for why investment for a cycling network in Tauranga is
necessary to increase the number of people walking and cycling. The document outlines:

•   how the optimal strategic cycling network was chosen;
•   the recommended 10-year cycling investment programme; and
•   how Tauranga City Council will work with investment partners to implement the strategic cycling network
    to encourage more people to cycle and walk and use personal mobility devices when travelling to work
    and school.

The programme gives effect to the multi-modal transport system objectives that have been identified through
the Urban Form and Transport Initiative (UFTI) and the Regional Land Transport Programme, and complements
other longer term initiatives that are being progressed by Council and its partners to make walking, cycling,
personal mobility and public transport safer and more accessible and attractive to use 5.

Improving transport choice in a growing city
Tauranga City and the wider Western Bay of Plenty sub-region are growing fast – over the last 30 years the
City’s population has doubled in size, and both the City and sub-region are expected to continue to grow at
a steady pace over the next 30 plus years6.

Figure 1: Projected 10-year growth allocations7

5 Refer Part B – alternatives and options section for examples of activities delivered under wider programme
6 Tauranga Urban Strategy 2050, proposed Future Development Strategy, and UFTI Foundation Report 2019
7 SmartGrowth – Tauranga City Population and Household projection review 2017

Page | 4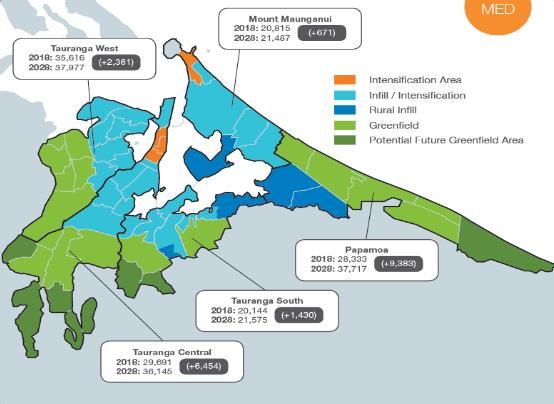
Tauranga cycling network programme

As Tauranga City grows, access to economic and social opportunities via the transport system is becoming
increasingly challenging, particularly at peak times. Private motor vehicle use dominates in Tauranga, and
there are few viable alternatives for how people can move throughout the City. Compared to other New
Zealand cities, Tauranga8 has:

•   one of the highest percentage of people who use a private motor vehicle to travel to work (91%)

•   the lowest percentage of people who travel to work via public transport (2%), or walk to work (4%)

•   one of the lowest percentages of people who cycle to work (3%).

Several multi-agency initiatives such as SmartGrowth, the Tauranga Transport Strategy and the Urban Form &
Transport Initiative (UFTI) have recognised that land use and urban form along with a well-functioning multi-
modal transport system are critical to people’s ability to live, learn, work, and play in the Western Bay of Plenty
(WBOP) sub-region. From these initiatives, the WBOP sub-region is looking to ‘grow up and out’ creating a
more compact urban form that provides greater housing and transport choices. These changes are necessary
to help maximise productivity, enable safe access to social and economic opportunities, and help achieve
better environmental and health outcomes. This is consistent with increasingly calls from the community for
greater transport choices and a transport system that does not always require the use of a car 9.

More recently, the Transport Agency’s National Mode Shift Strategy (Keep Cities Moving) has identified
Tauranga City as one of the six critical locations in NZ to grow the share of public transport, walking and
cycling, and create more vibrant and liveable cities. The Strategy recognises that Tauranga’s current
population size, together with the pace and scale of forecast growth, creates both an urgency and an
opportunity for change.

Refining the cycling investment story
The Tauranga Transport Strategy 2012-2042 (TTS) is a multi- agency strategy aimed at providing greater
transport choice and improved access. It is based on the premise that demand - particularly at peak - and
vehicle growth is outstripping the ability to additional road capacity to address the growing demand.

To better manage future demand and available capacity, the TTS emphasises the need to focus on
integrated land use and transport planning to enable greater access to where people want and need to
travel to and investing in other transport modes such as public transport and cycling. The TTS identified
(amongst other things) that opportunities exist to increase levels of cycling for the journey to work beyond
current levels and the current national average. In doing so the TTS recommended the development of a
network of cycling routes to provide safe facilities that connect to main destinations such as schools and
commercial centres; and to encourage future increases in the number of those cycling for commuter
purposes.

The Tauranga Cycling Plan 2017/18 (TCP) investigated further why investment in cycling programmes and
improvements are necessary; and examines the potential and latent demand for cycling within Tauranga.
The TCP provided a mechanism for Council to engage with local communities and stakeholders on cycling. It
identified a series of area-wide improvements across the City aimed at encouraging people of all ages and all
abilities to ride bikes for transport purposes, particularly to work, school and tertiary education.

The TCP, together with the draft 2018 Cycling Business Case, informed Tauranga City Council’s decision to
approve investment of up to $36m to accelerate delivery of the TCP, as part of the Long-Term Plan (LTP) 2018-

8Journeys to work, 2013 New Zealand Census
9Tauranga Urban Strategy Vision 2050
https://www.tauranga.govt.nz/Portals/0/data/future/strategic_planning/strategic_focus/files/tga_urban_vision.pdf

Page | 5
Tauranga cycling network programme

28, see Table 1. The total value of the Cycling Plan is estimated at $100m over ten years, and Council’s
decision to allocate funds assumes the balance of costs (51% Financial Assistance Rate) will be met by
Government from the National Land Transport Fund (NLTF) [1]. Council through its Annual Plan discussion will
look to address the potential funding shortfall to achieve its share to deliver the recommended cycling
network option.

The TCP, together with the draft 2018 Cycling Business Case, informed Tauranga City Council’s decision to
approve investment of up to $36m to accelerate delivery of the TCP, as part of the Long-Term Plan (LTP) 2018-
28, see Table 1. The total value of the Cycling Plan is estimated at $100m over ten years, and Council’s
decision to allocate funds assumes the balance of costs (51% Financial Assistance Rate) will be met by
Government from the National Land Transport Fund (NLTF) 10. Council through its Annual Plan discussion will
look to address the potential funding shortfall to achieve its share to deliver the recommended cycling
network option.

Table 1: Capital expenditure for the Cycle Action Plan implementation

The proposed Cycling Programme (this document) has been prepared to support a RLTP and NLTF funding
application to deliver the recommended cycling network. It uses relevant parts of the TTS, TCP, and draft
Cycling Business Case to bring together Tauranga cycling investment story in one place. The Cycling
Programme:

•     draws together the reasons why Council is investing in cycling initiatives and improvements

•     outlines how a cycling network has been developed for Tauranga that responds to the identified
      problems, delivers on the benefits, and supports an increase in cyclists

•     outlines a prioritisation order for implementation and delivery.

To help reinforce the multi-modal investment sought via the TTS and subsequent investment plans, the Cycling
Programme has been prepared in a way that enables it to be the cycling appendix to UFTI, the TTS, or similar
transport system planning document. This is necessary to ensure that the cycling network plan developed
remains connected to the wider transport system and that investment and improvements to improve personal
mobility and accessibility are not made in isolation of other transport modes.

[1]Refer Tauranga Long Term Plan 2018 for details
https://www.tauranga.govt.nz/Portals/0/data/council/long_term_plans/2018_2028/files/intro_key_decisions.pdf
10 Refer Tauranga Long Term Plan 2018 for details

https://www.tauranga.govt.nz/Portals/0/data/council/long_term_plans/2018_2028/files/intro_key_decisions.pdf

Page | 6
Tauranga cycling network programme
Part A: Strategic context
The strategic context outlines the problems, benefits, and investment objectives. Included is the evidence to
support the cause and effect of the identified problems. This section draws upon the work Council has
previously completed in developing the Tauranga Cycling Plan and the Tauranga Transport Strategy.
Problems associated with cycling in Tauranga
An investment logic mapping (ILM) exercise was held when developing the Tauranga Cycling Plan. From this
ILM the following problems were identified and subsequently refined further for the development of the
Tauranga cycling network.
Problem 1: Perceptions of cycling safety risks acts as a disincentive to the uptake of people who want to
bike more or try biking
Problem 2: Transport investment has historically focused on increasing roading capacity and less on other
transport modes, which has contributed to a high private vehicle usage when travelling to
work and education facilities
Problem 3: The lack of protection for cyclists contributes to cycling related DSIs
Evidence for the problems
Evidence supporting the three identified problem statements is outlined below. The evidence supports the
cause and effect of each problem.
Problem one: evidence
Problem: Perceptions of safety risk acts as a disincentive to the uptake of people who want to cycle
more or try cycling
Cause: There is a fear of biking based on the perception that Tauranga’s roads are too dangerous
due to the volume and speed of traffic
Effect: Less people are willing to cycle more or try cycling
For many people, the volume and speed of traffic on the transport network means that they have a fear of
trying cycling as a mode of transport. In a 2017 Council survey11, 59 percent of adults surveyed did not think it
was safe or easy for adults to cycle in Tauranga. Approximately 46% of young people and 80% of adults
surveyed did not think that Tauranga is safe or easy for young people (under 16-years) to ride bikes. In the
same survey, 91% of respondents though separated cycling routes were necessary. This helps indicate that the
fear of exposure to other traffic and the perceived consequences of cycling related injuries is sufficient to
reduce the number of people willing to cycle or let their children cycle.
The perception of cycling being unsafe is not uncommon or unique to Tauranga. Research conducted for the
NZ Transport Agency in 201612 shows 61% of urban New Zealanders believe it was unsafe to cycle in urban
11 The survey undertaken by Tauranga City Council in 2017 as part of developing the Tauranga Cycle Plan
https://www.tauranga.govt.nz/Portals/0/data/future/cycle_action_plan/files/cycle_plan_feedback_summary.pdf
12 Urban New Zealanders attitudes and perceptions of cycling, 2016. Available at https://www.nzta.govt.nz/assets/Walking-
Cycling-and-Public-Transport/docs/Urban-Cycling-Attitudes-Baseline-2016.pdf accessed in March 2019. It is important to
note that no participants involved in this survey live in Tauranga.
Page | 7Tauranga cycling network programme settings, and 75% said they would cycle if the roads and cycling network were safer. In a follow up survey in 201813, 52% of participants said they do not feel safe cycling because of the way people drive. In the same survey, 40% of participant said they felt safe cycling in Tauranga, see Error! Reference source not found., with 50% of Tauranga based participants noting they do not feel safe cycling because of the way people drive. Figure 2: Overall cycle safety in New Zealand metro cities In the same survey (see Error! Reference source not found.), respondents said they feel safer as the distance and separation from other modes and/or as the speed of traffic decreases. While only one in five people surveyed think it is safe to cycle on a road with no cycle lanes, the willingness to cycle increases significantly when traffic volumes are less or when there is greater separation between traffic and cyclists. Figure 3: Perceptions of cycling safety in different environments 13Understanding attitudes and perceptions of Cycling & Walking, 2018. Available at https://www.nzta.govt.nz/assets/Walking-Cycling-and-Public-Transport/docs/NZTA-Attitudes-to-cycling-and-walking-final- report-2018.pdf. This survey included participants living in Tauranga. Page | 8
Tauranga cycling network programme

More recently, a 2019 survey of travel demand in Tauranga 14 showed that walking and cycling is considered
unsafe by both users and car drivers, and is a key concern of people who are considering switching to an
alternative mode of transport (as shown in Error! Reference source not found.).

Figure 4: The perceived disadvantages of active transport modes

Perceived safety as a barrier for people to cycle has been established by several studies internationally. One
method to better understand different tolerances to perceived safety risk, is to classify people based on their
risk tolerance – known as the Geller method (2009). Based on Geller’s method the city’s population (both
existing cyclists and those that do not currently bike) can be divided into four type of people who cycle or do
not for transportation purpose. Geller’s four cohorts are1516:

14 Managing Travel Demand in Tauranga survey, Nexus 2019 (commissioned by NZTA)
15 Note that the percentage for each cohort is based on research completed by Dil and McNeil (2012) which an adaption
of Geller’s original schematic to provide approximate portions based on City of Portland, US.
16 It is important to recognise that the proportion of each group is not deter timed by the cycling provision currently

available, rather they reflect the proportion of people who are likely to cycle as conditions change. It is also useful to note
Geller’s method is based on those people who are willing to cycling for transportation purposes which makes it particularly
applicable for developing Tauranga’s cycling network plan and sub-programme.

Page | 9
Tauranga cycling network programme

1.   Strong and fearless – this will choose to cycle regardless of the road and traffic conditions. They have
     usually learnt by sustained experience how best to interact assertively with traffic and have a low level of
     risk-aversion. This cohort typically accounts for about 6% of the population.

2.   Enthused and confident – this group of cyclists will cycle on networks that provide little physical separation
     from other traffic. They prefer to have some space within the road space particularly on busy roads, either
     informally (e.g. wide kerbside lanes or shoulders) or formally (e.g. painted cycle lanes, advanced stop
     boxes. They place a higher importance on directness and will not generally divert far to choose a more
     attractive route such as an off-road path. This cohort typically accounts for about 9% of the population.

3.   Interested but concerned – this cohort are, in principle at least, willing to cycle but are wary of doing so in
     certain circumstances. A large majority in this group consider that they know how to cycle in traffic, yet
     these people often do not feel comfortable doing so. Typically, with this group the greater the separation
     from traffic, the more likely they are to cycle or try cycling. This group typically accounts for approximately
     60% of the population.

4.   No way, no how - Some people will choose not to cycle for transport, regardless of infrastructure, road
     environment, or training provided. Some of this group could have physical limitations, others simply have a
     personal dislike of cycling that cannot be influenced. Typically, this group accounts for about 25% of the
     population

New Zealand based surveys that include Tauranga and survey work undertaken by Tauranga City Council
suggest that Geller’s cohorts are applicable for Tauranga, with some adjustments. For example, the 2017
Council survey indicated17% of respondents would start riding a bike and 64% would ride their bikes more if
the right improvements were made. In the 2018, NZTA attitudes and perceptions survey, 49% of Tauranga
based respondents noted that the development of infrastructure had played a vital role in encouraging them
to cycle or cycle more. In the 2019 travel demand survey 28% of car drivers were open to changing to
another mode, with those living closer to the CBD (in Central Tauranga/Greerton) more likely to be open to
active modes.

Based on New Zealand Census data, resident surveys, school cycle counts, cycle counts, and other feedback
channels, in Tauranga it is likely the ‘strong and fearless’ and ‘enthused and confident’ cohorts are less at
approximately 10%, and the ‘interested but concerned’ and ‘no way, no how’ cohorts are larger at 70% and
30% respectively.

Given the potential size of the ‘interested but concerned’ cohort, undertaking a number of initiatives (both
educational and support, along with cycling infrastructure improvements) is likely to help reduce the
perceived safety risk and increase the number of people willing to cycling.

Problem two: evidence
Problem:          Transport investment has historically focused on increasing roading capacity and less on other
                  transport modes, which has contributed to a high private vehicle usage when travelling to
                  work and education facilities

Cause:            Investment policies in alternative modes have historically been less mature than policies for
                  investment in roading capacity

Effect:           There is high private vehicle usage in Tauranga when travelling to work and school

Page | 10
Tauranga cycling network programme Over the last 32 years from 1986 to 2018 the population of Tauranga City has more than doubled from 60,000 to 135,00017. Commercial growth, industrial activity and freight movements have also increased significantly, supported in part by the continued expansion of the Port of Tauranga. Tauranga has seen considerable investment in its transport network in response to this growth, with investment priorities historically weighted towards congestion relief, freight efficiency (access to the Port of Tauranga) and economic performance. This has resulted in significant investment in road capacity improvements with new highways, additional lanes, and grade separation e.g. Harbour Link, Tauranga Eastern Link, and Takitimu Drive (SH29) projects. Whilst initiatives such as the Urban Cycling Fund have led to increased investment in walking and cycling networks across Tauranga and the wider region over the last 3-5 years, investment in these modes remains low as a percentage of the total transport spend (see Figure 5 and Figure 6). 17 Draft Tauranga Transport Programme Business Case (Revision F), July 2018 Page | 11
Tauranga cycling network programme

Figure 5: BOP Region - Transport expenditure $m (NZTA and Approved Organisations) 2007/8 - 2016/17

           Walking and cycling

     Roads - M&O and renewals

     Roads - new and improved

                                  $0          $200              $400           $600             $800           $1,000

Figure 6: BOP region - Forecast costs $m (submitted for NLTF investment) 2018/19 - 2023/24

              Walking & cycling

     Roads - M&O and renewals

     Roads - new and improved

                                  $0       $200          $400          $600           $800        $1,000           $1,200

The investment focus on roading capacity is not unique to Tauranga or the Bay of Plenty region. However,
comparatively less has been invested in cycling in Tauranga City over the last 10 years, compared to other
main centres in New Zealand (see Error! Reference source not found.).

Figure 7: Total cycling expenditure funded by NZTA and Approved Organisations from 2007/8 - 2016/1718

     Wellington City

      Tauranga City

      Hamilton City

       Dunedin City

Christchurch City

      Auckland City

                       $0    $10,000,000 $20,000,000 $30,000,000 $40,000,000 $50,000,000 $60,000,000 $70,000,000

18   Based on NLTP work category 453

Page | 12
Tauranga cycling network programme This investment focus has done little to change Tauranga City and the wider region’s heavy reliance on private motor vehicles. New Zealand Household Travel Survey data 19 (2014-18) shows Tauranga City has one of the highest rates of private vehicle use in the country, as per Figure 8. Figure 8: New Zealand household travel survey 2014-18 A 2019 travel demand survey in Tauranga, commissioned by NZTA, indicates that the car is the primary mode of choice for the vast majority of residents (89% of respondents), with 6% of respondents identifying active modes as their primary mode of travel. The same survey showed that work was the single biggest reason for travel in Tauranga, with central Tauranga and Mount Maunganui being key destinations of travel (as the City’s largest commercial/industrial hubs). These survey results closely mirror the finding of the travel to work surveys from the 2013 Census20. Whilst the number of people who drive to work is high, a 2019 customer survey completed by NZTA, suggests there a desire to travel to work and school via a range of transport modes as shown in Figure 9. Figure 9: Public survey on Tauranga transport choices, 2019* 19Source: NZTA National Mode Shift Strategy - Keep Cities moving 20Source: Benchmarking cycling and walking in six New Zealand cities - Pilot Study 2015, NZ Centre for Sustainable Cities http://sustainablecities.org.nz/wp-content/uploads/Benchmarking-cycling-and-walking-in-six-NZ-cities.pdf. Page | 13
Tauranga cycling network programme

Latent demand was also implied in a 2017 Council survey21, which indicated that 93%-96% of people are
willing to cycle 5km (15 minutes) to work and 64%-73% of people are willing to cycle 10km (30 minutes). These
distances are likely to increase as electric bike use increases.

Currently 85% of Tauranga’s population live within 5km of an employment area, and 98% are within 10km.
These are considered distances that most able-bodied individuals are able to cycle with relative comfort. As
78% of the population are within 10km of the city centre (the City’s largest employment areas) and 70% are
within 10km of employment areas around Hewletts Road and Totara St (the City’s second biggest
employment area22), there appears to be potential to increase cycle use at peak times.

As noted in the UFTI Foundation report, whilst there is evidence to suggest there is a public appetite for
change, encouraging people out of private vehicles and offering them greater transport choice and access
via other modes, including walking and cycling, will require a concerted effort and significant improvements
across the transport system.

21   2017 survey by Tauranga City Council as part of Tauranga Cycle Plan
22   Tauranga Cycling Programme: Cycling Demand Assessment

Page | 14
Tauranga cycling network programme

Problem three: evidence
Problem:        The lack of protection for cyclists contributes to walking and cycling related DSIs

Cause:          Historically, road design guides have not adequately considered active modes leading to
                costly retrofitting or compromised levels of service

Effect:         There is an over-representation of walking and cycling related DSIs in Tauranga

Tauranga has approximately 100km of on-street cycling lanes separated by road markings rather than any
form of physical barrier see Figure 10Error! Reference source not found.. The cycle lane widths vary and are
typically less than 1 metre wide. There is approximately 10km of dedicated cycling paths which are generally
next to roads and a growing off-road cycle network through recreational parks and areas. The off-road paths
provide critical connections between areas and in particular across the harbour to join Mount Maunganui
and Papamoa with the City Centre and other areas. Currently, 10 intersections have intersection refuge
markings for cyclists, and no intersections have a dedicated cycle traffic light.

The network has been implemented over time as demand and space has allowed. This has meant that the
cycling network has grown organically rather than with a particular network plan in mind. As a result, Tauranga
is yet to implement a cycling level of service hierarchy that provides a greater degree of consistency about
what cycling and other road users might expect.

The organic growth and absence of a cycling hierarchy means some parts of Tauranga are not served by any
cycleways and, where they do exist, the design, connectivity and functionality of the cycleways can vary
widely. Furthermore, as noted in the UFTI Foundation Report, the convergence of commuters, public transport,
pedestrians, cyclists, and freight on key points in the network is resulting in a number of conflicts across
Tauranga’s transport system. These conflicts between the different modes have implications for the safe,
effective, and efficient movement of people and goods.

Figure 10: Tauranga City cycle network, 2017

Page | 15
Tauranga cycling network programme
Combined, these factors appear to be contributing to the safety risks faced by cyclists in Tauranga,
particularly when considering the location of crashes and the level of protection afforded to the cyclists by
the existing network.
Table 2 suggests cyclists are overrepresented in DSI crashes, given that bike trips account for approximately 1%
of the total transport trips in Tauranga23.
Table 2: Pedestrian and Cycle Related Crashes in Tauranga City 2014-18
Deaths and serious Mode specific DSIs as Minor and non-injury
injuries (DSI) % of total DSIs
Pedestrians 36 19% 99
Cyclists 22 12% 170
Total (pedestrians and cyclists) 58 31% 269
(11/year on average)
The map in shows the location of all pedestrian and cyclist crashes between 2014 and 2018. As noted in the
Tauranga Cycle Plan, there is significantly less reported crashes on Tauranga’s off-road cycleways and
notable hotspots in the following high volume/multi modal locations:
• Marine Parade • City Centre
• Ocean Beach Rd • Cameron Rd
• Maranui St/Papamoa Beach Road • 15th Avenue/Turret Road
• Girven Rd • Judea/ Bethlehem areas
Figure 11: Cycling and Pedestrian crashes in Tauranga, 2014 - 201824
23 Tauranga Cycle Plan – according to the Household Travel Survey
24 This map shows significant clusters by location. Where there are insufficient numbers to form a cluster the DSI is not shown.
Page | 16Tauranga cycling network programme Resolving these conflicts particularly in the City Centre on Cameron Rd and 15 th Ave/Turret Rd are not straightforward as these are the main urban arterials for all traffic. Further, the concentration of key destinations in Central Tauranga and the Mount, the harbour/peninsula geography which limit direct connections between key destinations means mode prioritisation is complex and may require rethinking what is status quo. This rethink is necessary to manage our transport system, improve safety, and prioritise modes and movements in a way that minimises the conflicts and improves safety outcomes for all road users. Page | 17
Tauranga cycling network programme

Benefits of addressing problems associated with cycling in Tauranga
The benefits from addressing the cause and effect of the identified cycling problems are:

B1:        Cycling is widely accepted as a safe and attractive alternative transport choice in both existing and
           newly developed urban areas

B2:        Improved health, environmental, social, place outcomes

B3:        Improved access to opportunities, particularly for people with low levels of transport choice

B4:        Increased safety for people using bikes

These benefits are consistent with the type of benefits outlined in other NZTA approved cycling business cases
and are aligned with NZTA cycling and investment guidance.

The key performance indicators (KPIs) to measure benefit realisation are outlined below. NZTA investment
performance measures have been used in the first instance and have been supplemented by existing Council
measures where required.

 Benefit                                   Key performance indicators (KPIs)

 B1. Cycling is widely accepted as a       •   Access – Perception: user surveys of perception of safety and
 safe and attractive alternative               ease of walking and cycling
 transport choice in both existing
                                           •   People throughput (peak hours): number of pedestrians and
 and newly developed urban areas
                                               cyclists at peak

 B2. Improved health,                      •   Traffic – mode share (journey to work): number of transport users
 environmental, social, place                  by mode, expressed as percentages
 outcomes
                                           •   Traffic – mode share (total): number of transport users by mode,
                                               expressed as percentages

 B3: Improved access to                    •   Spatial coverage – cycle lanes and paths: percentage
 opportunities, particularly for               completion of the cycle network
 people with low levels of transport
                                           •   Access to key destinations: (proportion of population living
 choice
                                               within travel threshold (15 mins, 30 mins or 45 mins) of key social
                                               and economic opportunities (including work, education, health
                                               care, supermarkets) by different modes (walking, cycling, public
                                               transport, private motor vehicle) in the morning peak (this
                                               measure is used in UFTI, and would be measured through UFTI/
                                               SmartGrowth)

 B4: Increased safety for people           •   Deaths and serious injuries (cyclists): annual number of deaths
 using bikes                                   and serious injuries

                                           •   Reported minor and non-injury crashes (cyclists): annual number
                                               of reported minor and non-injury crashes

Page | 18
Tauranga cycling network programme
Investment objectives
The evidenced problems and benefits have informed development of the following SMART (Specific,
measurable, achievable, realistic, and time-bound) investment objectives:
1. Increase of peak mode share of cycling to work trips in Tauranga from 3% to 8% by 2043
2. Double active travel in Tauranga from 200 annual km travelled by walking and cycling per capita to
400km by 2043
3. 25% reduction in annual walking and cycling DSIs in Tauranga from the existing 11 annual DSIs (5-year
annual average 2014-2018)
These investment objectives aim to establish realistic targets for assessing the strategy cycling network options.
The targets draw heavily on outputs from the Tauranga Cycle Model (TCM), which was developed by Flow
Transportation Specialists for Tauranga City Council for the purpose of informing development of this cycle
programme.
For the first investment objective, the current cycling commute mode share in Tauranga City is around 3%
(based on 2013 Census Journey to Work and findings from the 2018 Tauranga Transport Hybrid Model 25). NZTA
research26 indicates that mode share varies across the urban area with the highest use of active modes (as a
primary mode of travel) noted for trips originating in Central Tauranga/Greerton, compared with 6% of trips
originating in Pyes Pa/Tauriko.
Investment objective 1 focuses on cycling to work trips only (given data collection constraints), but it is
expected that the total mode shift will be greater given secondary benefits are predicted to accrue, namely
an increase peak mode share of cycling to education trips. The target of nearly tripling mode share is
considered ambitious, but realistic for 2043. While Tauranga is moving from a relatively low base level of
cycling, tripling cycling activity over 25 years is considered feasible given the cycling programme will be
supported by a wider behaviour change programme27 (non-infrastructure based), together with a range of
UFTI initiatives aimed at managing wider urban form and transport system challenges.
The second investment objective relates to the increases in walking and cycling forecast by the Tauranga
Cycle model back to the existing walk/cycle per capita data from the Household Travel Survey. The focus on
active travel aligns with anticipated health benefits and improved transport choices to enable better access
to schools and places of employment. Whilst the target is considered ambitious, it is considered feasible,
particularly given secondary benefits that are likely to accrue in terms of increased cycle to school mode
share.
Investment objective 3 seeks to achieve a reduction in annual walking and cycling DSIs, whilst also seeking to
increase the walking and cycling mode share over the same timeframe. This objective is consistent with
recent NZTA research report28 which concluded cyclist crash rates can fall as cyclist numbers increase.
Examples cited in the report included Hastings, where crash rates fell to about one-third of what they were two
years prior, despite an approximately 20% increase in cycling after a network of cycleways was built. This is
largely thought to be attributable to a “safety in numbers” effect, where the risk to each pedestrians and
cyclists decreases as the total number of pedestrian or cyclists increases.
25 Tauranga Transport Hybrid Model was developed in 2018 by Flow Transportation, and is the parent model to the Tauranga
Cycle Model (which was used to inform this PBC)
26 NZTA, Travel Demand Management in Tauranga – Nexus, 2019
27 Refer Part B – alternatives and options section for examples of activities delivered under wider programme
28 NZTA Research Report 289, https://www.nzta.govt.nz/resources/research/reports/289/
Page | 19Tauranga cycling network programme
Part B – Developing the Programme
Cycling network options
Several walking and cycling business cases recently endorsed by the Transport Agency29 have demonstrated
that using a wide range of supply, demand, and productivity tools are necessary when developing an
effective programme to increase cycling uptake and improving cycle safety. The tools used would typically
include network infrastructure improvements together with other initiatives such as behaviour change,
promotion, education, speed, and compliance.
Initiatives such as the Tauranga Transport Strategy, the Tauranga Cycle Plan, and more recently UFTI have
provided the strategic framework under which Tauranga City Council has commenced a broad programme
of change to enhance the uptake cycling and improve travel choice. In recent years, this programme has
included:
• Bike to school initiatives and support for school training programmes to encourage more children to cycle
and walk to school
• Encouraging and supporting schools to provide bike and scooter facilities such as parking spaces and
school cycle tracks
• Working with businesses to develop travel plans that consider multi-modal options such as walking and
cycling along with other alternatives such as public transport
• Providing biking facilities in the shopping areas such as the central business district, Mount Maunganui and
other suburban areas to enable safe and secure bike parking
• Providing safe and secure bike parking facilities in Council owned car parking buildings
• Provision of shower and change facilities, along with e-bike charging points for people biking to work in the
Harrington St Carpark building design
• A network of off-road walking and cycling connections/pathways has been developed through Council’s
reserve and parks management programme
• Inclusion of cycling facilities as part of Council’s low cost, low risk improvement programme
The Tauranga cycling network is intended to support this programme of change by identifying
complementary improvements to the transport network, to enhance the uptake of walking and cycling as an
attractive and safe mode of choice.
Cycling network option development overview
Cycling network options (i.e. programme options) were developed using the Tauranga Cycle Model (TCM)30,
which is based upon the same methodology used to develop cycling models for Christchurch and Auckland.
The model was used to identify broad areas where there is high potential demand for cycle trips, namely for
29 Examples include 2016 Wellington Cycle Network Programme Business Case and 2018 Auckland Transport Cycling
Programme Business Case
30 Details regarding the development and refinement of the TCM are provided in the following report: Cycle Demand
Assessment and Economic Evaluation, Flow Transportation Specialists, April 2020. This report is available in Appendix A.
Page | 20Tauranga cycling network programme
the purposes of accessing employment or education hubs, and how these areas might connect if appropriate
cycle infrastructure was to be provided.
In assessing demand potential, the model considers:
1. Changes in land use: the model is informed by forecast land use changes (via links to Council’s current
forecast strategic traffic model and the Tauranga Transport Strategic Model31). This means that forecast
increases in population, employment or education result in increased future cycle trips within the model.
2. Changes in cycle infrastructure: Where improvements to existing cycle infrastructure are proposed, the
model responds with increased forecast cycle trips.
3. Changes in cycle distance: Where a significant new cycle link is proposed that reduces the cycling
distance between an origin-destination pair, such as a new bridge across an estuary, the model responds
with increased forecast cycle trips between that origin-destination pair.
The principal method by which the model is able to forecast an increase in cycle trips, and the main “lever”
the Tauranga Cycle Programme pulls, is the changes to cycle infrastructure. This change is represented within
the model by assigning a “Relative Attractiveness” index (RA) to each street, cycleway, and shared path in
the model (based on 15 different levels). Where improved cycle infrastructure is proposed on a given street,
the RA score for that street is increased within the model, in turn resulting in an increase in cycle trips between
origin-destination pairs that benefit from that investment.
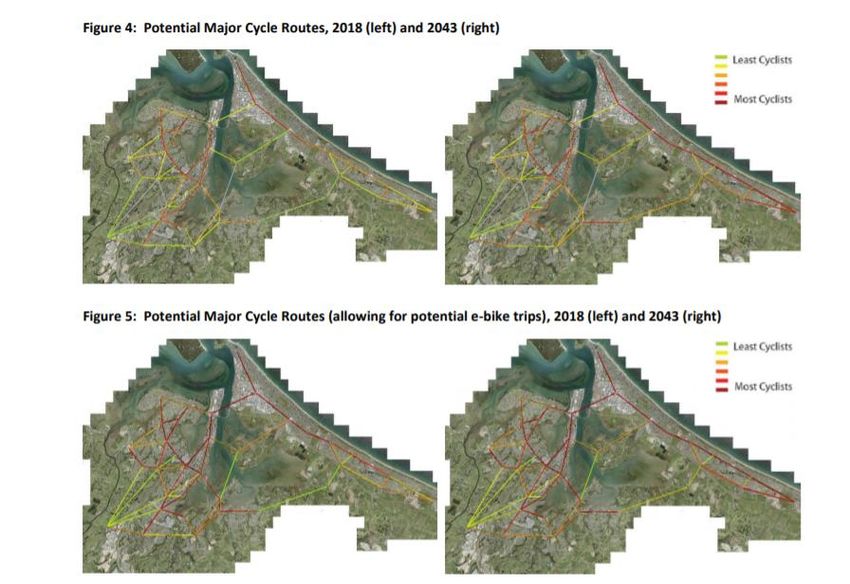
Drawing heavily on the strategic demand assessment, five high-level cycle programme options were
developed to connect key origins and destinations relating to employment and education hubs (refer Table 3
below). The options are based on different networks and the quality of those networks, rather than identifying
different routes and corridors.
The TCM was then used to assess the effectiveness of network options in facilitating mode share change, and
to refine the network options (as required). This methodology is consistent with the approach taken to
develop the Auckland and Christchurch cycling programmes, both of which have been endorsed by the NZ
Transport Agency.
Table 3: Cycling network options for Tauranga
Cycling network Summary
options
1. Business as No significant changes made to extending the existing Tauranga cycle network. New
Usual /Do greenfield development and the urbanisation of existing rural roads within
minimum development areas will enable development of new on-road and off-road cycling
facilities. These improvements would be delivered by developers and would increase
the length of the current cycling network where cycling is required (as per the
Council’s Infrastructure Development Code).
2. Painted Cycle Developing a cycle network based on painted cycle lanes. The network is based on
Lanes providing painted cycle lanes on existing arterial and collector roads. This programme
would enable an additional 108km32 of on-road painted cycle lanes. Most of the
improvements are concentrated within Papamoa, Bayfair and Otumoetai, where
31 The Tauranga Transport Strategic Model is the parent model to the TCM. As noted in section 3.2 of the Flow Report
(Tauranga Cycle Programme – Cycle Demand Assessment June 2019), the Tauranga Transport Hybrid Model was under
development by Beca and at the time of writing, only base model (2018) outputs from this parent model were available.
32 The modelling report produced by Flow (Tauranga Cycle Programme – Cycle Demand Assessment June 2019) indicates
Option 2 would enable an additional 103km of painted on-road cycle lanes. This figure was subsequently increased to
108km as a result of minor refinements to the model.
Page | 21You can also read