PREPARING FOR TOMORROW'S NETWORK - Powerco
←
→
Page content transcription
If your browser does not render page correctly, please read the page content below

PREPARING FOR
TOMORROW’S
NETWORK
SUMMARY ASSET MANAGEMENT PLAN 2019

                                     POWERCO Asset Management Plan Summary | Welcome   A
Welcome to our 2019 Summary Asset Management Plan (AMP).
This Summary AMP outlines the key points from Powerco’s full AMP and is
a companion to the full AMP. The AMP documents are intended to provide a
starting point for discussions with stakeholders and interested parties, and to
provide us with feedback on the vital service that Powerco provides.

The AMP is an important part of Powerco’s planning and investment framework.
It describes for our customers, stakeholders, employees and partners how we
will manage our electricity distribution network to deliver the standards of safety
and reliability of electricity supply that our customers demand. It also allows us
to engage with stakeholders on the network of the future and to test our thinking
and planning for how we deliver our customers’ future energy needs.

                                                                  POWERCO Summary Asset Management Plan 2019   1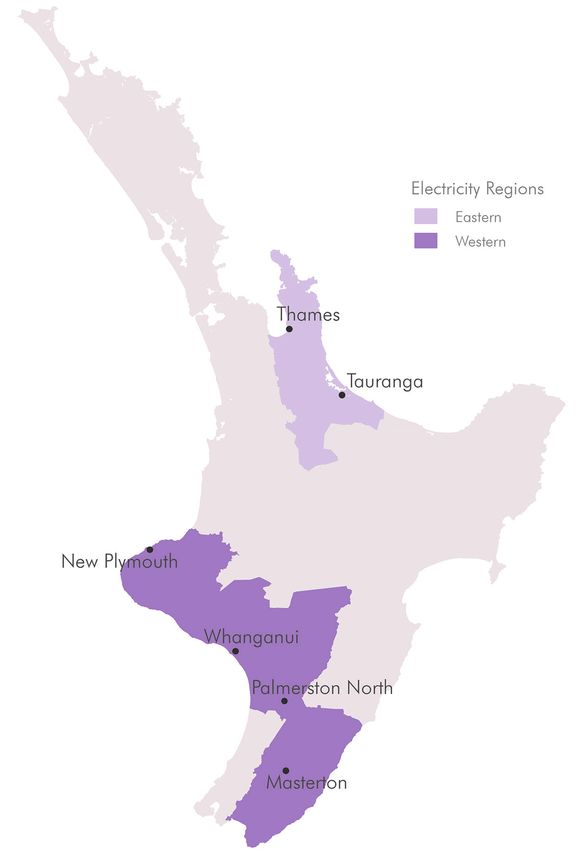
01
EXECUTIVE                                                            INTRODUCING OUR 2019 ASSET                         OUR NETWORK COMMITMENT
                                                                     MANAGEMENT PLAN
SUMMARY                                                                                                                 Delivery of our five-year Customised
                                                                     Our core business is to ensure that                Price-quality Path (CPP) plan is now
                                                                     electricity is delivered to our customers          well under way
                                                                     safely, reliably and efficiently
                                                                                                                        The first four years covered under this AMP
                                                                     It is essential that we continue to invest in      focus strongly on how we plan to deliver to
                                                                     our assets to ensure they are in appropriate       our CPP targets during the remainder of the
                                                                     condition and of sufficient capacity to meet       regulatory period.
                                                                     the needs of our customers in the long term.
                                                                                                                        Working within our regulatory price constraints,
                                                                     We also recognise that society is facing           during the past decade we lifted investment
                                                                     an unprecedented challenge regarding a             by almost 60% in response to the ageing
                                                                     warming environment. Minimising carbon             of our asset fleets and economic growth
                                                                     emissions is a key priority for New Zealand        in our communities. However, even at this
                                                                     and, by implication, for our customers.            increased level, which exceeded our regulatory
                                                                                                                        allowance, there was mounting pressure for
                                                                     As a company, we are fully committed to
                                                                                                                        a further step change.
                                                                     helping New Zealand achieve its carbon
                                                                     reduction targets agreed to in terms of the        Sitting at the heart of our CPP application
                                                                     Paris Accord (2015), and the Government’s          was the analysis that indicated the significant
                                                                     associated target of a 100% renewable energy       challenges we had to address in the future.
                                                                     supply by 2035.1 We are committed to acting        These included increases in the number of
                                                                     in an environmentally responsible manner in        assets that were approaching end-of-life,
                                                                     all our investment decisions and operational       ongoing growth in the communities we serve,
                                                                     practices – as witnessed by our recent             and increased complexity associated with
                                                                     certification to the ISO 140012 standard           ensuring stable network operation in an
                                                                     and our high GRESB3 score.                         evolving energy environment.
                                                                     However, our impact on carbon reduction is         Under our CPP allowance, the Commerce
                                                                     insignificant compared with what we can help       Commission approved expenditure of $1.27
                                                                     our customers, including generators, achieve –     billion4 during the five-year period – an increase
                                                                     through our role enabling them to create,          of 38% on the previous five years.
                                                                     use and save energy as efficiently as possible.
                                                                                                                        Our key commitments for the future of our
                                                                     The key to supporting New Zealand’s carbon         electricity network, supported by the CPP
                                                                     reduction targets will be running our network      allowances and described in the AMP, are
                                                                     to open-access principles, offering maximum        summarised below.
                                                                     flexibility to customers with the opportunity to
                                                                     innovate, connect to, and transact over our        Ensuring safe and resilient networks
                                                                     network without impediment. While future           We remain committed to stabilising the
                                                                     energy market arrangements are still being         underlying condition and performance of our
                                                                     developed, we will ensure that the network         asset fleets. Our asset renewal, maintenance
                                                                     remains safe, operates stably and provides         and vegetation investment is intended to arrest
   Under normal hydrological conditions.
                                                                                                                        the trends we are seeing:
1.

   ISO 14001 is an internationally accepted standard that provides
2.                                                                  sufficient capacity under any reasonable
   the framework to put an effective environmental management
                                                                     energy use scenario.                               • In-service asset failures increasing over time
   system in place within an organisation.
   GRESB is an independent environmental, social and governance
3.                                                                                                                        for key asset fleets.
   benchmark for real assets, defining the global standard
4.
   Real 2016 dollars

2        POWERCO Summary Asset Management Plan 2019
• Increasing numbers of end-of-life, under-        We believe we will see increased application of
   performing assets remaining in service.          the new technology over time, as prices reduce,
• A
   poor, and deteriorating, reliability position   suitable applications emerge in New Zealand,
  versus our peers.                                 and the new technology becomes better
                                                    understood by our customers. At present, the         fully commited to
• P
   ockets of network performance well              most promising emerging technologies include:
  outside reasonably acceptable limits.
                                                    • Electric vehicles (EV)
• Increasing levels of defective assets and        • Photovoltaic cells (PV)
   vegetation encroachment.
                                                    • H
                                                       ome and network scale energy storage
Supporting growth in our communities                  solutions
Our regions have been experiencing sustained        • A
                                                       dvanced energy and demand management
population and economic growth in recent              solutions
years and, as a result, we have experienced         • T
                                                       he advent of community-based energy
strong demand growth across parts of our              trading schemes
networks. Some of the drivers for this growth
                                                    Such new solutions will bring benefits to
include the following:
                                                    our customers, but they will also increase
• B
   ay of Plenty – population growth and            complexity for distribution network operators.
  horticulture processing volumes.                  Issues such as local voltage fluctuations, two-
• W
   aikato – continued dairy intensification        way energy flows and increased load volatility
  and a shift to snap chilling.                     will need to be anticipated and addressed. It is
• T
   aranaki – population growth and dairy           important we act now to understand these new
  intensification.                                  technologies and ensure we can accommodate
• O
   ther regions – population growth and            them efficiently on our networks.
  changing land-use patterns.
Because of this growth, there are now many          IMPROVING ASSET MANAGEMENT
locations where we have no practical way of         CAPABILITY
rerouting supply in the event of a key asset
failing. The risk and associated cost of a          Our operating costs and network performance
failure has become unacceptably high for our        compare well but there is more to be done
customers. Focused action is necessary, as the
number of such scenarios on our networks is         ISO 55001
unacceptable.
                                                    We are committed to obtaining certification
Enabling our customers’ energy choices              to the ISO 55001 asset management
New technology offerings and increasing             standard by 2020. AMCL Ltd recently
customer eagerness to take control of their         conducted a gap assessment on our asset
energy options – and thereby reducing their         management approach against ISO 55001
own carbon footprint – are leading to a change      and the Global Forum on Maintenance & Asset
in the way energy markets operate. Distribution     Management (GFMAM) standards.
utilities play a key role in facilitating these     While we are assessed as ‘competent’ or ‘close
changes, while ensuring that basic delivery         to competent’ in most areas, there are some
standards continue to be met.                       areas where we are still classed as ‘developing’.

                                                                                                        POWERCO Summary Asset Management Plan 2019   3
01. Executive summary
We are in the process of preparing an action We have developed CBRM models for power
plan to address the gaps identified. transformer, circuit breaker, ring main unit and
ground-mounted distribution transformer fleets,
and are considering expanding our modelling to
DATA QUALITY
include underground distribution cables.
We are committed to improving and
CBRM modelling has also highlighted our need
expanding our asset data to support
to improve asset data and is helping inform our
ongoing decision-making and asset
data quality improvement plans.
management improvements. This will
require increased standardisation, expanded
inspections, improved information processing,
LOOKING BEYOND CPP
and better auditing processes.
Electricity distribution networks are built to
We are expanding the level of auditing we
serve customers’ long-term interest
undertake in the field, as well as applying
analytical tools to highlight potential deficiencies While there is much deliberation about changes
in data quality. We intend to work towards ‘one in the energy environment, a large majority
source of truth’ across our business and our of our customers continue to use centrally
service providers, with clear data ownership generated electricity as their key energy source.
and responsibility allocations. We do not predict this changing significantly in
the foreseeable future. Therefore, it would be
imprudent to materially adjust investment
NEW FOUNDATIONS
and asset management plans now for an
New Foundations is a programme of uncertain future.
improvements to our core enterprise systems,
Accordingly, we will continue to keep a strong
as we move to an SAP environment. This is
focus on the health, capacity and operation
a key initiative that will enable us to have the
of our existing network, as well as expand the
right repositories and systems to transform
network to meet the increased demand of new
asset data into insightful information. Our new
– and often existing – customers.
enterprise resource planning system will
support our ability to efficiently collect, store While we will continue to seek out the most
and analyse asset and network data when efficient means of limiting expenditure on asset
commissioned at the start of FY20. renewal and reinforcement, including applying
innovative new solutions wherever practical,
It is a vital component of our asset management
we expect most of our network expenditure
capability enhancements and will have a
will remain on conventional electricity network
significant impact on our ability to deliver our
assets and practices.
CPP commitments.
CATERING FOR THE CHANGING ENERGY
CONDITION-BASED RISK MANAGEMENT
ENVIRONMENT
We have developed Condition-Based Risk
3Ds – decarbonisation, digitisation and
Management (CBRM) models for many of
decentralisation
our key fleets. It has allowed us to develop
improved asset renewal forecasts based The so-called 3Ds is an important emerging
on the assessment of asset condition and risk. energy industry theme. These present
4 POWERCO Summary Asset Management Plan 2019significant challenges and uncertainties future market arrangements, we expect this
for our industry. Our evolving approach to transition to happen beyond our CPP period.
understanding and addressing this theme is
However, it is important to recognise that New
outlined in our network evolution roadmap in
Zealand will not be isolated from changing
Chapter [13] of our full AMP.
customer energy consumption patterns and
Particularly important within this AMP planning associated emerging market arrangements, and
period, especially towards the latter years, is nor would we want to be, as these changes will
our contribution to decarbonisation. We are reflect one of the most effective means we have
committed to operating in an environmentally to achieve our Paris Accord commitments
sustainable way. and the Government’s low carbon target.
As our own energy use is relatively low, and Therefore, we see the near-term future as the
we generate very little electricity, we believe ideal time to analyse, test and prepare for
we can make a much bigger contribution to the expected future changes to the energy
our society’s decarbonisation efforts through environment. Further out in the AMP period
effectively planning and operating the electricity we see the need to start significant investment
distribution network in an open-access to achieve the basics of the required open-
arrangement. Assisting customers and energy access network. This will initially focus on
providers to easily conduct energy transactions additional monitoring and limited automation
over our network would encourage distributed on our network, particularly on the Low Voltage
and renewable generation. (LV) side.
Additionally, effective demand management,
energy storage and tariff incentives will help
maximise the utilisation of existing energy 10-YEAR EXPENDITURE FORECASTS
infrastructure and defer or minimise future Investment of approximately $278 million
investment. Electricity should also offset other, per annum
less environmentally friendly, forms of energy,
The investments we propose will enable us to
and the network should facilitate this, for
address asset condition and security related
example electric vehicles offsetting the demand
issues. It will also help ensure we continue to
for petroleum.
meet our customers’ service expectations and
Realising these benefits requires us to operate support the growth of the communities we
the network in an open-access manner, with serve.
minimal impediments for customers to connect
devices or transact on the network. Intense
CAPITAL EXPENDITURE
debates about the nature of such open-access
networks are under way around the world. Our planned capital investments for the
2019-2029 period reflect a targeted blend
Transitioning to an open-access network will
of investment across growth and security,
require considerable effort and investment,
asset renewal and non-network categories.
particularly in providing the required visibility,
Key highlights include the following:
controllability, flexibility and stability of all parts of
the network. Given the relatively low uptake of • S
ustained investment in asset renewals
emerging grid edge technology in New Zealand, – post CPP expenditure is expected to
and the immaturity of the local discussion on stay at current CPP levels. We forecast a
POWERCO Summary Asset Management Plan 2019 501. Executive summary
constant level of expenditure is required to resulting from increasing customer connection asset condition and network risks. Data
manage the health of our overhead fleets. activity, and potential increase in the volumes and information management practices
of Transpower-initiated outdoor-to-indoor will also be enhanced with our ERP
• S
ustained investment in growth and
switchgear conversion works. Our expected implementation.
security – network growth investment is
capital investment during the planning period
forecast to remain consistent with CPP • A
sset management maturity – we are
is set out below.
levels. During the CPP our expenditure proposing substantial improvements in
predominantly focuses on improving the way we practise asset management
breaches in security of supply. Post CPP OPERATIONAL EXPENDITURE to reflect industry good practice and to
expenditure focuses more on improving Our updated operational expenditure is realise improved efficiencies in the future.
voltage support on the network. We will also in line with our previous CPP forecasts. To achieve this, we are bolstering our internal
be investing in LV visibility improvements as Key highlights include the following: capabilities and skills. As part of our asset
we shift to an open-access network. management improvements we intend to
• A
ddressing maintenance defects –
achieve ISO 55001 certification by the end
• R
eduction of investment in core the backlog of outstanding maintenance
of 2020.
systems and network technology – defects had previously been growing at
we forecast a reduction in IT investment an accelerating rate. We have arrested • E
nhanced capacity – our project delivery
as we complete implementation of a new this increase and are now reducing the capacity is being increased in proportion
ERP system early in the CPP period, and as size of the pool to appropriate levels to the uplift in construction and maintenance
our core systems shift to the cloud. We will during the CPP period. work proposed under the CPP. Allowance
continue current levels of investment in our is made for additional business support
• Improved inspection techniques –
network evolution plan to allow for testing staff to assist with the increased business
we have commenced our pole-top
of new and innovative network and non- complexity and demands anticipated with
photography and Light Detection and
network solutions. enhanced IS systems and increased work
Ranging (LiDAR) trials for improved asset
volumes.
Expenditure during the CPP period of the condition and vegetation inspection.
planning window is largely consistent with our We are also continuing to implement new Our expected operational expenditure during
CPP allowance – limited increases are foreseen techniques to better understand actual the planning period is set out below.
Figure 1: Capital Expenditure Figure 2: Operational Expenditure
250 120
$m (real 2019)
$m (real 2019)
100
200
80
150
60
100
40
50
20
0 0
FY19 20 21 22 23 24 25 26 27 28 29 FY19 20 21 22 23 24 25 26 27 28 29
6 POWERCO Summary Asset Management Plan 2019Why an open-access network? Limiting choice is bad for customers.
Our customers are increasingly concerned about the impact of their Conventional network reinforcement is an expensive and, generally,
energy use on the environment. They are interested in how their inefficient solution to short-term power fluctuations. Constraining
electricity is generated and how they can use it most efficiently. customers in what or how much they can connect to the network
This local interest is reflected at a national level, with one of the will greatly inhibit their ability to manage their use and reduce
Government’s key commitments being a goal of a carbon-neutral their electricity carbon footprint – thereby foregoing one of the
electricity supply. more important levers New Zealand has to achieve its overall
environmental targets.
In a fortunate convergence of improving technology and
cost-efficiency, our customers have: Networks of tomorrow
• more choice and the power to exercise their values. In our view, the best way to achieve customers’ goals is by
•
an increasing ability to achieve significant reductions in their operating an open-access distribution network. This will be
energy use footprint. achieved by:
A key contributor is the ability to cost effectively generate on- • applying suitable developing technology.
premise electricity, through renewable methods such as solar • much improved visibility of power flows and utilisation.
panels or small wind generators. • increased network automation.
This not only reduces electricity taken from the grid, but also holds • improved data and analytics.
potential for exporting excess capacity to other nearby customers,
Essentially this future network would allow customers to be largely
or allowing customers without their own generation to buy
unconstrained in what they can connect to the network and how
renewably created electricity from local suppliers and communities.
they would use it to support their energy transactions – purchasing
Other key factors are efficiency improvements in energy-hungry and exporting electricity.
devices, and the ability to switch to renewable energy sources,
Our role will be to ensure that networks have the capacity to cope
particularly related to transport and heating.
with our customers’ evolving energy needs, while remaining safe,
The limits of today’s networks stable and efficient.
The design of traditional electricity networks, however, limits the
extent to which renewable generation, or large variable loads,
can be accommodated.
Networks were designed for one-way power flows from large
generators to end customers, who used mainly passive appliances.
Connecting significant volumes of distributed generation, or large,
rapidly varying loads to a network not designed for it, can at times
cause serious power quality and network instability issues.
Without substantially changing the nature of distribution networks
and how they operate, the only mitigation options for electricity
distribution businesses (EDB) are to make major reinforcements
to the network or constrain customers in what they can connect
and how they can use the network.
POWERCO Summary Asset Management Plan 2019 702 EVOLVING OUR NETWORKS FOR THE FUTURE 8 POWERCO Summary Asset Management Plan 2019
THE NEED TO CHANGE                                    stakeholders to create, use and save energy
                                                                                                                   as efficiently as possible.
                                                             The role of energy systems in decarbonising
                                                             the economy has been a strong focus                   We do not subscribe to the view that
                                                             across the world                                      distribution assets will mostly become
                                                                                                                   surplus to requirements
                                                             New Zealand has set ambitious targets and is
                                                             making quick progress to form a plan that will        Distribution networks provide a vital platform to
                                                             lead to a net zero-carbon economy by 2050.            support flexibility and innovation for customers’
                                                             As noted by the New Zealand Productivity              future energy use and meeting New Zealand’s
    1D                                                       Commission in last year’s Low-emissions               decarbonisation challenges.
                                                             economy report, […] steps will be needed              We see that the key to supporting New
   Digitisation                                              to manage growing complexity and risks to             Zealand’s carbon reduction targets, will be
   Digitalisation is the increase                            system and service providers’ stability, and to       running our network to open-access principles.
   in digitally enabled sensors,                             ensure a level playing field for different types of   This will offer maximum flexibility to customers
   data and analysis available                               technology.                                           (end users and generators) with the opportunity
   to customers, the market
   and asset owners                                          Our Network Evolution strategy reflects this          to innovate, connect to, and transact over
                                                             focus. It aims to enhance the value we offer to       our network without impediment. While future
                                                             our customers and, through this, to the wider         energy market arrangements are still being
                                                             New Zealand society, the environment, and             developed, we will ensure that the network
                                                             the economy. In particular, it recognises the         remains safe, operates stably and provides
                                                             challenges brought by the 3Ds of the energy           sufficient capacity under any reasonable
                                                             industry:                                             energy use scenario.
                                                             • D
                                                                ecarbonisation is the challenge to reduce         The way we design, build, and operate
                                                               CO2 emissions to fight climate change.              our network has to change
                                                             • D
                                                                ecentralisation is the shift from central         The pathway to change, however, remains filled
                                                               generation electricity to distributed devices       with uncertainty. The sector is being highlighted
                                                               that generate, store or consume electricity.        as prone to disruption, as technology becomes
                                                                                                                   cheaper, customers’ needs and expectations
                                                             • D
                                                                igitalisation is the increase in digitally
                                                                                                                   in terms of quality of service change, and
                                                               enabled sensors, data and analysis available
                                                                                                                   environmental pressure increases. Despite
                                                               to customers, the market and asset owners.
                                                                                                                   these changes, the large majority of our existing
                                                             We recognise that society is facing an                customers will continue to expect the same
                                                             unprecedented challenge regarding a                   conventional electricity supply they have now.
 2D                                  3D
                                                             warming environment                                   Therefore, we have to strike an effective balance
Decentralisation                    Decarbonisation          We are committed to being an                          between investing in conventional network
Decentralisation is the shift       Decarbonisation is the   environmentally responsible business,                 assets to maintain expected service, and
from central generation             challenge to reduce      which is also reflected in our investment             adapting to emerging technology and changing
electricity to distributed          CO2 emissions to fight   decisions and operational practices. But the          consumption patterns. We have to make long-
devices that generate, store        climate change                                                                 term decisions that are economically efficient
                                                             biggest contribution we, and other electricity
or consume electricity                                                                                             and in the best interests of our customers.
                                                             distributors, can make towards helping this
                                                             cause, is by enabling and supporting our

                                                                                                                       POWERCO Summary Asset Management Plan 2019      9
02. Evolving our networks for the future
THE CHANGING ENERGY DECARBONISATION
ENVIRONMENT Decarbonisation is the challenge to reduce
Decarbonisation After almost a century, the way electricity is
delivered to customers is starting to change
CO2 emissions to fight climate change
is the challenge to The New Zealand Productivity Commission’s
In a legacy system, such as New Zealand’s, the Low-emissions economy report details
reduce flow of electricity has been almost exclusively pathways for New Zealand to reduce its carbon
from large generators, through transmission emissions, in line with the targets of the Paris
and distribution networks, to end customers. Accord. It highlights the electricity sector as one
emissions to fight of the main impacted sectors and an enabler
New technology in generation and consumption
climate change is challenging the model of networks configured
to allow more carbon-intensive sectors to
decarbonise, e.g. substituting petrol cars with
to meet peak demand, offering a one-size-fits all
electric vehicles.
approach to passive or disengaged customers.
This has led to more stress on the network Most electricity distribution utilities do not
during peak hours. We are starting to see signs generate significant electricity and are not
of this on our network. Figure 3 demonstrates themselves large electricity users. Therefore, our
that although the overall electricity consumption main role is to encourage and accommodate
for each customer has not changed materially, carbon reduction initiatives by offering end-
peak electricity demand has been steadily users and generators the technical solutions
growing during the past decade9. and services that this policy decision requires.
9.
nnual compound growth in the average consumption per Installation Control Point (ICP, all categories) since FY11 has been 1.2%, while the coincident
A
network peak demand during the same period has grown by 1.9% per year.
Figure 3: Average electricity consumption 130
Growth index (2009 = 100)
and demand on our network
120 Maximum demand
110
Energy per ICP
100
90
Note: The figures are based on electricity drawn from grid exit points
(GXPs) and do not include the impact of distributed generation. 80
The 2019 consumption is a projection of expected consumption. 2009 2010 2011 2012 2013 2014 2015 2016 2017 2018 2019
10 POWERCO Summary Asset Management Plan 2019DECENTRALISATION DIGITALISATION
Decentralisation is the shift from central Digitalisation is the increase in digitally
generation electricity to distributed devices
that generate, store or consume electricity
enabled sensors, data and analysis available
to customers, the market and asset owners
Decentralisation
shifting from
Customers expect the ability to offset their Digitalisation will help our stakeholders to
own electricity consumption or to sell surplus understand and manage their energy demand
electricity, while maintaining a connection to our profiles, and also allow them to conduct energy
network to cover the times that their devices transactions over our network.
cannot generate, for example at night. The cost of data capture, storage and
This requires us to maintain electricity communication continues to decrease.
generate, store or
connections at full capacity, even if average Low-cost sensors and communication consume electricity
consumption levels reduce. It will require us mediums, eg Long Range Wide Area Network
to consider alternative pricing structures in (LoRaWAN), are becoming mainstream. With
future, particularly if we are to avoid charging it, artificial intelligence, blockchain, and other
other customers more as a result. capabilities have become more prominent as
computing processing power increases.
Concentrated clusters of new distribution
edge devices10, such as solar photovoltaic (PV) For asset managers, this trend offers major
generators or electric vehicles, can also cause opportunities to efficiently increase visibility
voltage stability or other power quality issues. of network condition, utilisation and operational
Older networks, in particular, which were not conditions. It will allow us to enhance our
designed for potential two-way power-flows service offering, improve network utilisation
or rapidly changing, high-peak demands, will and reduce potential instability issues that
need intervention, otherwise we will have to limit could arise from connecting edge devices.
the connection of such devices. This would be This all would contribute to more efficient
a last resort and an undesirable situation, as and stable network utilisation and support
we would not only inhibit customer flexibility, cost effective delivery.
but we would also run counter to achieving
carbon reduction targets. Digitalisation
10.
istribution edge devices are new types of end-customer loads connected to the distribution network that were not traditionally prevalent and have
D
characteristics that can cause power signal distortion in different ways to traditional, mainly resistive, customer loads. It includes local generation,
particularly PV, electric vehicles, energy storage devices, and the like.
POWERCO Summary Asset Management Plan 2019 1102. Evolving our networks for the future
OBSERVATIONS OF THE NETWORK • L
ocal generation – significant of excess power generated) to customers.
improvements in efficiency, along with Regardless of the initial driver, the scale of
While we know that around the world there
major reductions in cost, are making it uptake has supported large-scale manufacture
are many examples of how the 3Ds are
economically and technically viable to bring and resulted in reduced costs.
fundamentally changing the industry, the
electricity generation closer to the source of
speed of the change in New Zealand is By contrast, the uptake of PV in New
consumption.
still uncertain. In the section below we Zealand, while growing substantially on an
explore our observations and their practical We believe this trend will remain true for the next annual basis, is still at a much lower level.
implications for our network, starting with two to three years and that our network will be The Electricity Authority reported that from
high-level consumption trends, and distribution able to accommodate these changes in the short 2016 to 2018 New Zealand had an increase in
edge devices. term. However, in the longer term, network capacity of 32%.
stability and capacity could be at risk.
PV uptake on our network is small – with total
CONSUMPTION TRENDS PV connection just 1.1% of our ICPs. Recent
SOLAR PHOTOVOLTAIC GENERATION trends on our network are shown in Figure 4
As described before, while peak demand is still
and Figure 5.11
increasing slowly, the average consumption per The uptake of PV follows the sun – our
Installation Control Point (ICP) remains relatively network is not always sunny International literature suggests that when PV
consistent. This is mainly because of: penetration reaches about 10% on a network,
Residential PV generation is growing rapidly
issues associated with the variability of its
•
Energy efficiency – modern household across the world. Uptake rates between
output could become material, requiring some
countries vary, but have been particularly
appliances are becoming more energy efficient form of network investment.12 At current
pronounced in Germany, parts of Australia,
and improved building efficiency standards growth rates, this still appears to be some
the United Kingdom, Denmark and some
also contribute to lower energy use. distance off on our network.
US states, such as California. This has
• E
nergy awareness – customers broadly been in direct response to government
11.
Electricity Authority, www.emi.ea.govt.nz.
are increasingly aware of their energy mandates to achieve low carbon emission This relates to issues such as excessive voltage rise at periods of low
12.
consumption and many are taking active targets, encouraged by way of subsidies, load, and voltage fluctuations with potential to create network instability.
The impact could be reduced if modern inverters allowing volt/VAR
steps to reduce it. tax incentives or feed-in tariffs (buy-back correction, or energy storage devices are in wide use.
Figure 4: PV uptake on our network (percentage of ICPs) Figure 5: PV uptake on our network (number of ICPs)
2.5 1,500
Percentage of ICPs
Number of ICPs
Wairarapa 1,250 Tauranga
2.0
1,000
1.5 Tauranga
750 Thames Valley
1.0 Wairarapa
500 Manawatu
Taranaki
0.5 Whanganui
250
0.0 0
Jan Jul Jan Jul Jan Jul Jan Jul Jan Jul Jan Jul Jan Jul Jan Jul Jan Jul Jan Jul
2014 2015 2016 2017 2018 2014 2015 2016 2017 2018
12 POWERCO Summary Asset Management Plan 2019ELECTRIC VEHICLES The study suggested that this increase in
demand can be mitigated by the introduction
EVs
EVs will change the network – but not in the
short term of smart charging. Figure 7 shows how smart will change
EV charging can influence the demand profile.
The use of EVs (full electric or plug-in hybrid)
is still in its relative infancy in New Zealand, EV uptake and demand response capability
with a total of 11,000 vehicles registered at at a household level is hard to assess as
the end of 2018. With its high proportion of customers are not currently required to
renewable electricity generation, New Zealand notify the network operator when they have
is well placed to achieve major carbon purchased an EV or installed non-significant
emissions reductions from switching its chargers, i.e. those that do not require a change
vehicle fleet from conventional fuel to electricity. in their electricity supply. This lack of visibility
has an impact on the efficacy of network
As the government incentivises and promotes investment and reinforcement to accommodate
their use and penetration numbers can rise, the capacity and quality challenges introduced
the potential for localised power quality issues through EV charging. We are working with
also increases within the low voltage network. wider industry groups to both address the
To facilitate EV charging, particularly at peak lack of visibility and to improve our ability
demand times and with fast chargers, could to monitor and predict EV uptake increases.
require substantial network reinforcement.
In 2018, we commissioned a study in
collaboration with Unison and Orion to model
the impact of EV charging on residential ICP
demand13. It showed that, without any form of
control, the demand could increase significantly, 13.
or example, Electric Vehicles in New Zealand: From Passenger to
F
Driver, published by Dr Allan Miller and Scott Lemon, EPECentre,
as shown in Figure 6. University of Canterbury.
Figure 6: Impact of EV charging on an average household Figure 7: Impact of smart EV charging on an average household
demand profile demand profile
2.5 2.5
kW
kW
2.0 Plus passive 2.0 lus passive
P
EV charging EV charging
Pre-EV re-EV
P
1.5 demand 1.5 demand
1.0 1.0
0.5 0.5
0.0 0.0
00.00
03.00
06.00
09.00
12.00
15.00
18.00
21.00
00.00
03.00
06.00
09.00
12.00
15.00
18.00
21.00
00.00
03.00
06.00
09.00
12.00
15.00
18.00
21.00
00.00
03.00
06.00
09.00
12.00
15.00
18.00
21.00
00.00
03.00
06.00
09.00
12.00
15.00
18.00
21.00
00.00
03.00
06.00
09.00
12.00
15.00
18.00
21.00
00.00
03.00
06.00
09.00
12.00
15.00
18.00
21.00
00.00
03.00
06.00
09.00
12.00
15.00
18.00
21.00
Weekday Weekend Weekday Weekend Weekday Weekend Weekday Weekend
Summer Winter Summer Winter
POWERCO Summary Asset Management Plan 2019 1302. Evolving our networks for the future
ENERGY STORAGE DEMAND MANAGEMENT DISTRIBUTION NETWORKS
Energy storage will be an enabler for the New Zealand is been a world leader in OF THE FUTURE
New Energy Future demand management The future nature of electricity distribution
For years, New Zealand has been using water networks is being widely debated around
The main focus of energy storage is use for
heaters as controllable load. Considerable the world. We subscribe to the New
battery storage capacity, which is increasing
debate is under way on whether these load Zealand-specific Network Transformation
at a significant rate – mainly in utility scale
control systems should be maintained, Roadmap developed by the Electricity
applications. There are many other forms of
expanded, or replaced with newer technology. Network Association (ENA)14. It is backed up
storage such as compressed air storage and
Hot water control systems continue to play an by international research in similar jurisdictions,
pumped water storage and various forms of
important part in managing peak demand on particularly Australia and the United Kingdom.
heat storage are also receiving attention, but
generally for large scale applications only. our network and avoiding transmission peak As described in the ENA’s study, we recognise
charging to our customers. that the network of the future will be influenced
Residential scale applications are expanding
With improving communications systems by two main factors:
rapidly, but the overall storage capacity
associated with these is still relatively small. and more intelligent home devices, new •
Customer behaviour – how engaged are
Other than the installation cost, uptake rates opportunities are opening up for demand customers with their energy supply?
for domestic storage systems are also very management on the customer side of the
•
Technology – how much renewable
sensitive to factors such as (the absence of) electricity meter. While it is not our intent to
electricity, and associated edge devices,
feed-in tariffs, subsidies, the cost of electricity, become involved in customer products, such
is connected to the grid?
and the reliability of supply. as home area networks, we will continue to
pursue demand management solutions where Using this dichotomy, four scenarios were
Although the cost of battery storage systems these offer economic alternatives to network created and are summarised in Figure 8.
has reduced substantially in recent years and is reinforcement. 14.
ource: ENA, “Network Transformation Roadmap”,
S
anticipated to decline further in the foreseeable https://www.ena.org.nz/dmsdocument/403, 2018
future, for the vast majority of individual
customers it is still significantly more expensive
than conventional grid-supplied electricity (by
comparable capacity).
Figure 8: Network transformation scenarios adapted from ENA with evolution pathways
In some instances, mainly in remote rural
areas, the installation of combined generation
Passive Consumer Behaviour: I care about my energy supply Active
and battery storage units is economically
feasible and uptake rates in these cases may
accelerate. It is also noted that the combination High
of effective storage and local, mainly PV,
Grid Supplied Renewable Energy
generation offers customers a significant Rise
Set
of and
the Prosumer
Forget Rise of the Prosumer
degree of flexibility in how they procure and use Open
Intelligent
accessnetwork
network Open access network
electricity, which in some cases may override
decisions based on economic factors alone.
In the longer term, our view is that energy
storage systems, both at utility and
residential scale, will have a valuable role Backup Grid Leaving the grid
in the provision and use of electricity. Traditional network Shrinking network
Low
14 POWERCO Summary Asset Management Plan 2019These purposely extreme scenarios are
intended to provide clarity in thinking and
While the network relies on physical assets
to convey electricity from bulk electricity
Intelligent
assessment. It is unlikely that any of these will
arise by themselves. A more feasible outcome,
supply points to customers and the majority
of customers remain passive, there are some
networks
however, will be a mix of customer outcomes, differences from the traditional network:
will suit the
possibly leaning more in one direction. To
respond to these scenarios, we have devised
•
Distributors still do not participate in energy ‘Set & Forget’
four possible evolution pathways that can meet
markets, but are compensated for the scenario
reliability of service and for energy efficiency
each of the challenges and requirements.
improvements15.
•
Intelligent devices are widespread
TRADITIONAL NETWORK throughout the network. These allow visibility
This is largely the distribution network that of power flows, asset loading, and asset and
we are accustomed to. It has the following network performance. They also provide
characteristics: control of devices, which in turn allows much
•
Physical assets convey electricity from bulk greater network automation.
electricity supply points to customers. •
Networks can be reconfigured in real-time to
•
Passive customers respond to demand patterns, or operational
events.
•
Distributors do not participate in energy
markets and are compensated only for the •
It is possible to safely increase network
assets they provide and operate utilisation to much higher levels and
automation allows network reconfiguration
•
Networks and their components are largely
after faults, or self-healing networks, that can
passive
provide substantial reliability improvements
•
Substantial degree of redundancy built in
Intelligent networks will suit the ‘Set and
•
Assets are sized for peak demand Forget’ scenario.
•
Large localised concentrations of EV and PV
can compromise stability OPEN-ACCESS NETWORK
Traditional networks suit the “Backup Grid” This next stage expands on the capabilities
scenario. of the Intelligent Network to allow widespread
local generation sources, with associated two-
INTELLIGENT NETWORK way power flows. It also ensures open-access
arrangements for customers to allow them to
This is the often-touted ‘smart grid’, which is
transact over the network and to connect any
based on the traditional network with extended
device they wish within acceptable safety and
capabilities for monitoring, measurement,
reliability limits.
control and automation – and the associated
communications network and information It still relies on physical assets to convey
systems to support this. There is also a shift from electricity from bulk electricity supply points to
centralised to de-centralised control, relying more the customers, as well as from customer to
on the local ‘intelligence’ of modern devices. customer, or customer to bulk supply point.
15.
This is to ensure that incentives exist to find optimally efficient solutions, rather than stick to traditional network investment solutions.
POWERCO Summary Asset Management Plan 2019 1502. Evolving our networks for the future
•
Customers are actively involved in energy SHRINKING NETWORK
acquisition, generation, and consumption The shrinking network describes the situation
management where it may make sense for a customer’s
•
Opportunity for multiple sources of primary electricity supply to be derived from
distributed generation devices, and other sources other than the grid – mass defection
customer side devices. will then occur. The level of investment on the
NZ’s networks •
Distributor is not involved in transactions
associated network would drop to a minimum
will change, across the network
as it would be economically impossible to
maintain anything other than an adequate
but when and how •
Network provides the functionality to level of safety and meet our minimum legal
are uncertain maintain stability, quality and protection obligations.
under a range of operating scenarios,
There are few existing larger scale examples
including the use of large-scale energy
of this scenario around the world, and none
storage
we are aware of in New Zealand. However, it is
•
Revenue earned through electricity potentially possible when individual households,
conveyance, and other network services – local communities and industries build their own
reflecting for example, the cost to connect power generation and energy storage facilities,
distributed generation, maintain stability, and particularly where they are somewhat isolated
provide flexible open-access functionality from the grid.
•
Distributors transact with customers for We also facilitate decommissioning of long rural
value that customers can add to the feeders supplying isolated loads through use
operation of the network – for example of its Base Power alternative, albeit only for
for demand management capability, and individual or very small groups of customers.
electricity buy-back This benefits both us and the customer.
•
Network investments and asset sizing will The shrinking network scenario aligns with
reflect evolving electricity demand patterns the “Leaving the Grid” scenario.
•
Customer pricing evolves to reflect a far
larger degree of individualisation than in
the past
•
Customers can connect their EV and PV
and maximise their utilisation
Open-access networks will suit the “Rise
of the Prosumer” scenario.
16 POWERCO Summary Asset Management Plan 2019Map of the Summary AMP
1 2 3 4
Executive Evolving our networks Our network Our customers
summary for the future
ur Place in the
O Customer Service
Introducing our 2019 The Need to Change............9 Electricity Sector.................18 Priorities.............................23
Asset Management Plan.......2
The Changing Energy Eastern Region...................20 How Customer Feedback
Our Network Environment.......................10 Influences our Strategy.......25
Western Region..................20
Commitment........................2
Observations of the Network Assets..................21
Improving Asset Network.............................12
Management Capability........3
Distribution Networks
Looking Beyond CPP...........4 of the Future.......................14
10-year Expenditure
Forecasts.............................5
5 6 7 8
Asset Management Maintaining the Designing for a Expenditure
Strategy existing network growing network forecasts
Network Targets.................27 How we forecast Investment Triggers............32 Capital Expenditure............34
Asset Management for Renewals......................30 Network Security Operating Expenditure........35
Improvements....................28 Network Opex Planning......31 Criteria................................32
Planned projects of significance across our network
Coromandel / Waikino........38 Kinleith / Waikato................42
Tauranga............................39 Manawatu / Tararua............43
Egmont / Taranaki..............40 Wairarapa...........................44
Whanganui / Rangitikei.......41
POWERCO Summary Asset Management Plan 2019 1703
OUR NETWORK OUR PLACE IN THE ELECTRICITY SECTOR
In terms of both supply area and network length, our network is the largest of any single distributor
in New Zealand.
Our place in New Zealand’s electricity sector is illustrated below.
Figure 9: Our place in the electricity sector
GENERATION TRANSMISSION DISTRIBUTION RETAIL
(national grid)
Electricity is generated This electricity is Electricity is distributed to Retailers buy electricity
across New Zealand transported from homes and businesses via from generators and
using water (hydro), generators to distribution distribution networks. sell it to homes and
wind, geothermal, gas networks using the businesses.
and coal stations.16 national grid, owned and Powerco is one of 29
operated by Transpower. distribution companies.
REGIONAL NETWORKS
Our network includes two separate regions; Eastern and Western. Both networks contain a range
of urban and rural areas, although both are predominantly rural.
Table 1 provides summary statistics relating to our assets in the Eastern and Western regions.
Figure 10 provides a geographical overlay of these regions.
Table 1: Asset population summary (2018)
MEASURE EASTERN WESTERN COMBINED
Customer connections 159,680 179,134 338,814
Overhead circuit network length (km) 7,177 14,560 21,737
Underground circuit network length (km) 3,318 2,955 6,273
Zone substations 51 69 120
Peak demand (MW) 466 433 897
Energy throughput (GWh) 2,701 2,398 5,099
Distributed generation is a growing trend but still only a very small
16.
proportion of total generation.
18 POWERCO Summary Asset Management Plan 2019Figure 10: The regions we cover
POWERCO Summary Asset Management Plan 2019 1903. Our network
EASTERN REGION WESTERN REGION
The Eastern region consists of two zones The Western region comprises four
– Valley and Tauranga – which have differing network zones. Similar to the Eastern region,
geographical and economic characteristics these zones have differing geographical and
presenting diverse asset management economic characteristics, presenting various
challenges. asset management challenges. Because
of the age of the network and, in particular,
For planning and pricing purposes we divide
the declining asset health of overhead lines,
this region into two zones:
extensive asset renewal is required in this
• V
alley includes a diverse range of terrains region. This renewal is about double the cost
from the rugged and steep forested coastal compared with what is required in the Eastern
peninsula of Coromandel to the plains and region on an annual basis.
rolling country of eastern and southern
• T
aranaki, which is situated on the west
Waikato. Economic activity in these areas
coast plains, is exposed to high winds and
is dominated by tourism and farming
rain. The area has significant agricultural
respectively.
activity, oil and gas exploration and
From a planning perspective, this region production, and some heavy industry.
presents significant challenges in terms
• W
hanganui includes the surrounding
of maintaining reliability on feeders
Rangitikei and is a rural area exposed
supplying sparsely populated areas in what
to westerly sea winds on the coast and
is often remote, difficult-to-access terrain.
snow storms in high country areas. It is
Investment priorities have focused on predominantly agriculture based with some
improving network security and resilience, industry.
and developing better remote control and
• P
almerston includes rural plains and
monitoring facilities.
high country areas exposed to prevailing
• T
auranga is a rapidly developing coastal westerly winds. It is mainly agricultural with
region, with horticultural industries, a port logistical industries, and has a university, with
and a large regional centre at Tauranga. associated research facilities, in the large
The principal investment activities in regional centre of Palmerston North.
this region have been associated with • W
airarapa is more sheltered and is
accommodating the rapid urban growth predominantly plains and hill country. It has
in Tauranga, maintaining safe and reliable a mixture of agricultural, horticultural and
supplies to the port, and supplying new viticulture industries.
businesses.
The four Western region zones are discussed
The Valley and Tauranga zones are discussed in in more detail in Chapter 3.4 of the full AMP.
more detail in Chapter 3.3 of the full AMP.
20 POWERCO Summary Asset Management Plan 2019NETWORK ASSETS
We have categorised our electricity assets • Zone substations
into 25 fleets. We use the term ‘asset fleet’ to • Distribution transformers
describe a group of assets that share technical
• Distribution switchgear
characteristics and investment drivers. We group
• Secondary systems
the 25 asset fleets into seven portfolios, as
set out below. The large number of assets in certain fleets,
• Overhead structures eg poles, gives an indication of the scale of
our network and the work we undertake on it.
• Overhead conductor
• Underground cables
Table 2: Asset population summary (2018)
ASSET TYPE POPULATION
Overhead structures
Poles 264,146
Crossarms 424,505
Overhead conductor
Subtransmission (km) 1,507
Distribution (km) 14,804
LV (km) 5,110
Underground cables
Subtransmission (km) 169
The large number of
assets
Distribution (km) 2,051
LV (km) 4,456
Zone substations
Power transformers 191 gives an indication
Indoor switchboards 121
of the scale of
Buildings 160 our network
Distribution assets
Transformers 35,245
Switchgear 41,927
Secondary systems
Zone substation protection relays 1,782
Remote terminal units 297
POWERCO Summary Asset Management Plan 2019 2104
OUR CUSTOMERS The expectations of our customers guide During the past three years, growth across all
our investment and network delivery of our customer segments has exceeded our
forecasts. We have had to refine our forecast
We are proud to serve more than 335,000
load estimates and increase network capacity.
diverse groups of households, businesses and
Our customer connection teams and processes
communities. Our customer base includes:
have been bolstered to ensure we meet this
•
23 electricity retailers who operate on our growing need and continue to provide good
network trading as 32 brands customer service.
• 337,137 homes and businesses comprising:
–
Residential consumers and small EMBEDDED GENERATORS
businesses – ‘mass market’ We provide direct network connections
–
Medium-size commercial businesses for a number of embedded generators
–
Large commercial or industrial businesses Sixteen of these have export capacity over
•
21 directly contracted industrial businesses, 1MW, while a further four are classed as
including large distributed generators industrial cogeneration, where generated
power is wholly or partly consumed on-site.
•
19 local territorial authorities and the New
Zealand Transport Agency In addition, there are approximately 2,900
distributed generation installations of less than
The table below sets out the proportions of our
1MW capacity connected to our network.
customer base and contrasts with the volume of
The combined capacity of these smaller
electricity they use – this illustrates the significant
generators is just over 14MW. Of these,
electricity consumption of our larger customers.
nearly all are domestic photovoltaic (PV) panel
Our customers are distributed relatively installations of less than 10kW capacity.
evenly across our network regions
The uptake rate of small scale distributed
across all The largest regional concentrations are in the generation (SSDG) on our network has risen
Bay of Plenty, Taranaki and Manawatu, each from about 10 to 70 installations per month in
having a large urban centre – Tauranga, New the past four years as prices of PV and inverter
Plymouth and Palmerston North respectively. technologies has dropped.
Table 3: Number of customers (ICPs) and electricity delivered
CUSTOMER TYPE ICPS % OF ELECTRICITY % OF TOTAL
TOTAL DELIVERED ELECTRICITY
ICPS (GWH) DELIVERED
Mass market 335,094 99.4 2,640 54.5
Commercial 1,419 0.4 252 5.2
Large commercial / industrial 624 0.2 1,955 40.3
Total 337,137 100% 4,847 100%
22 POWERCO Summary Asset Management Plan 2019We have a policy to support and facilitate deliver a simple and effective energy supply
the appropriate development of distributed for customers is a key part of what we do.
generation, while ensuring appropriate control
given the potential local impacts on network
OTHER STAKEHOLDERS
operation.
We provide network services to a range of
other stakeholders. Amongst a range of other
ELECTRICITY RETAILERS
stakeholders we work with:
We operate an interposed model
•
the New Zealand Transport Agency and
That means retailers purchase our services, territorial local authorities that require us to
bundle them with energy supply and the cost move our lines or cables for roading projects,
of accessing the transmission grid, and provide
•
House relocation companies requiring us to
a bundled price for delivered energy to their
switch off our lines during their operations,
customers. We have agreements with 23
retailers used by our customers. •
Developers requiring connection services to
housing developments.
Given the importance we place on our
relationship with electricity retailers, we have a
dedicated relationship management team that
CUSTOMER SERVICE PRIORITIES
focuses on providing them with a high level
of commercial and operational support. This We use a variety of means to engage with our
helps them provide a quality bundled service to customers and capture their feedback. What
customers and seamlessly resolve any supply customers tell us they value can be captured
issues on their behalf. Working with retailers to four key service dimensions below.
Reliability of Supply Responsiveness
Value
Customer Service and
Cost Effectiveness Information Quality
POWERCO Summary Asset Management Plan 2019 23You can also read