BYU ScholarsArchive Brigham Young University
←
→
Page content transcription
If your browser does not render page correctly, please read the page content below
Brigham Young University
 BYU ScholarsArchive

Theses and Dissertations

2021-04-05

Deploying and Analyzing Air Quality Sensors in Mongolian Gers
Lehi Sttenio Alcantara
Brigham Young University

Follow this and additional works at: https://scholarsarchive.byu.edu/etd

 Part of the Engineering Commons

BYU ScholarsArchive Citation
Alcantara, Lehi Sttenio, "Deploying and Analyzing Air Quality Sensors in Mongolian Gers" (2021). Theses
and Dissertations. 8908.
https://scholarsarchive.byu.edu/etd/8908

This Thesis is brought to you for free and open access by BYU ScholarsArchive. It has been accepted for inclusion
in Theses and Dissertations by an authorized administrator of BYU ScholarsArchive. For more information, please
contact ellen_amatangelo@byu.edu.
Deploying and Analyzing Air Quality Sensors in Mongolian Gers

 Lehi Sttenio Alcantara

 A thesis submitted to the faculty of
 Brigham Young University
 in partial fulfillment of the requirements for the degree of

 Master of Science

 Derek L. Hansen, Chair
 Barry M. Lunt
 Philip B. Lundrigan

 School of Technology

 Brigham Young University

 Copyright © 2021 Lehi Sttenio Alcantara

 All Rights Reserved
ABSTRACT

 Deploying and Analyzing Air Quality Sensors in Mongolian Gers

 Lehi Sttenio Alcantara
 School of Technology, BYU
 Master of Science

 The purpose of this research is to develop best practices for deploying air quality sensors
in a remote location such as Mongolia. I discussed the architecture and design constraints when
collecting remote air quality sensors data, the challenges that emerge while implementing a
sensor-based network in a remote location such as Mongolia. The tradeoffs of using different
architectures are described.

 I observed the usage of electrical heaters in modified gers in remote locations and
conclude how effective they are in reducing PM2.5 levels by analyzing air quality data and go
through the process of cleaning up the data and removing humidity from low-cost sensors used
to deploy in a remote location such as Mongolia so that the PM2.5 reading is more accurate.

 In order to help many humanitarian efforts dealing with better air quality in developing
countries, an air quality sensor was designed to keep low cost as much as possible. The cost is
about $200 to build, which is cheaper than other low-cost sensors, yet provides more
functionality (e.g., CO2 sensing) and used cellular connectivity to upload data in real-time. This
sensor has implications beyond Mongolia. The sensor can be used anywhere WiFi connectivity is
not available, such as parks, bus stops, and along roadways, breaking the constraints that other
low-cost sensors have. Removing the need for WiFi is a necessary step in allowing ubiquitous air
quality sensing.

 The contributions in this thesis are: First, I presented the challenges one should consider
while deploying air quality sensors in developing countries. Second, since Mongolia offers a
unique environment and constraints, I shared experiences in deploying sensors in a remote
location like Mongolia. This experience goes beyond air quality sensors and can inform anyone
who is deploying sensors in remote areas. Third the analysis of the PM2.5 on the gers gives us
better insights as to whether modifying gers with insulation and using electrical heaters as
opposed to burning coal to heat up the gers makes a difference in regard to better air quality in
the gers.

Keywords: wireless sensor networks, remote sensing, system applications and experience, data
analysis, internet of things, air quality
ACKNOWLEDGMENTS

 I would like to thank all IT faculty members, especially committee chairs Dr. Hansen and

Dr. Teng for their various inputs and directions in developing this thesis. Also, a big thank you

goes to Dr. Lundrigan from Electrical and Computer Engineering Department for his mentorship

and guidance throughout this journey. The NET (Network Enhanced Technologies) Lab team

was a great experience and I’m grateful to be part of it and the chance to work together in

various tasks. Dennis Eggett from the Center for Collaborative Research and Statistical

Consulting from Brigham Young University for his statistics expertise contribution in this thesis.

Finally, I would like to express my gratitude to my wife, Liesel, for her patience and support in

all my education goals throughout the years I have been in school.
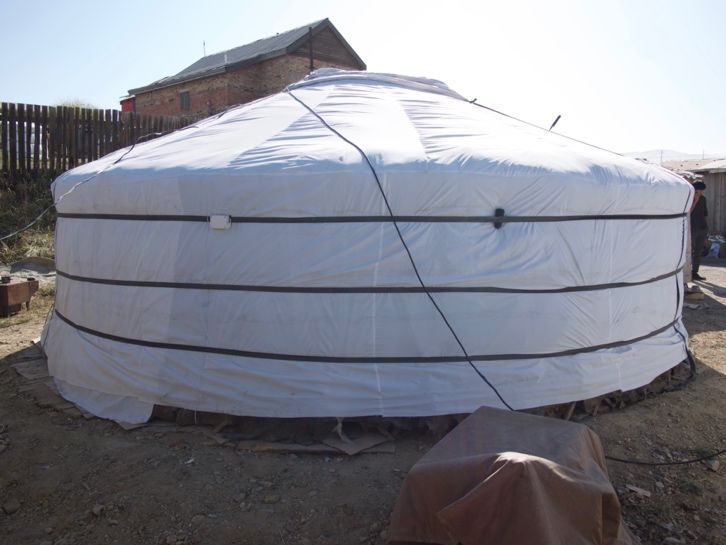
TABLE OF CONTENTS

LIST OF TABLES ......................................................................................................................... vi
LIST OF FIGURES ...................................................................................................................... vii
1 Introduction ............................................................................................................................. 1
 1.1 Key Terms ........................................................................................................................ 3
 1.2 Research Objectives and Questions ................................................................................. 4
 1.3 Outline of Thesis .............................................................................................................. 4
2 Literature Review .................................................................................................................... 6
 2.1 Air Quality Health Effects and Measurement .................................................................. 6
 2.2 History and Efforts to Regulate PM2.5 Levels .................................................................. 7
 2.3 Air Quality Sensor Deployment ..................................................................................... 12
 2.4 Deploying Sensors in Mongolia ..................................................................................... 13
 2.4.1 Infrastructure Challenges .......................................................................................... 14
 2.4.2 Skilled Professionals & Cost .................................................................................... 15
 2.4.3 Security & Reliability ............................................................................................... 15
 2.4.4 Mongolia Geography & Deployment Challenges..................................................... 15
 2.5 Mongolian Modified Ger Project ................................................................................... 16
 2.6 Summary ........................................................................................................................ 16
3 Methodology.......................................................................................................................... 18
 3.1 Field Deployment Methodology .................................................................................... 18
 3.2 Data Analysis Methodology ........................................................................................... 20
 3.3 Air Quality Sensors Deployment and Analysis Replicability ........................................ 25
 3.3.1 Accuracy and Precision of Air Quality Sensor Sensirion SPS30 ............................. 25
 3.3.1.1 Laboratory Evaluation of Sensirion SPS30 ...................................................... 26
 3.3.1.1.1 Accuracy (PM2.5) ........................................................................................ 26
 3.3.1.1.2 Precision (PM2.5) ......................................................................................... 27
 3.3.1.1.3 Coefficient of Determination ...................................................................... 28
 3.3.1.2 Field Evaluation of Sensirion SPS30 ................................................................ 29
4 Mongolian Field Deployment & Architecture....................................................................... 31
 4.1 Q1A: Design Tradeoffs of Using Different Wireless Architectures .............................. 31
 4.1.1 Mongolia Air Quality Deployment Architecture Ratings Explanation .................... 34
 4.2 Q1B: Sensor-Based Network in Mongolian Gers Challenges ....................................... 38
 4.2.1 Challenges & Lessons Learned from Deployment ................................................... 40
 4.2.1.1 Unplugged Sensors ........................................................................................... 40

 iv
4.2.1.2 WiFi vs Cellular vs LoRa ................................................................................. 40
 4.2.1.3 Management Tools............................................................................................ 41
5 Air Quality Intervention Analysis ......................................................................................... 42
 5.1 Q2A: Analyzing Effective of Modified Gers in Reducing PM2.5 .................................. 43
 5.2 Q2B: Temperature Affect PM2.5 Gains on Modified Gers ............................................. 43
 5.3 Q2C: Day of Week and Time of Day Affect PM2.5 Gains on Modified Gers................ 45
 5.3.1 Hourly Median PM2.5 for Unmodified Gers ............................................................. 45
 5.3.2 Hourly Median PM2.5 for Modified Gers .................................................................. 46
6 Discussion.............................................................................................................................. 50
 6.1 Summary ........................................................................................................................ 50
 6.2 Limitations ..................................................................................................................... 52
 6.3 Future Work ................................................................................................................... 53
References ..................................................................................................................................... 54
Appendix A: Supplemental Materials ........................................................................................... 61

 v
LIST OF TABLES

Table 2-1: WHO Interim PM2.5 Levels and Countries That Follow It ............................................. 9
Table 2-2: WHO Short Term (24 hr) PM2.5 Levels and Countries That Follow It ........................ 10
Table 2-3: Consideration of Deploying Sensors Network in Developing Countries.................... 14
Table 4-1: Developing Countries Air Quality Deployment Architecture Ratings ....................... 33
Table 4-2: Circle’s Legend ........................................................................................................... 33
Table 5-1: All Temperature Ranges PM2.5 Estimates for Unmodified/Modified Gers ................ 43
Table 5-2: PM2.5 Estimates for Modified/Unmodified Gers by Temperature Range ................... 45
Table 5-3: Grand Total Difference for PM2.5 Average Hourly Median........................................ 47
Table 5-4: PM2.5 Estimates for Modified/Unmodified Gers by Hour........................................... 48
Table 5-5: PM2.5 Estimates for Unmodified/Modified Gers by Time Buckets ............................ 49

 vi
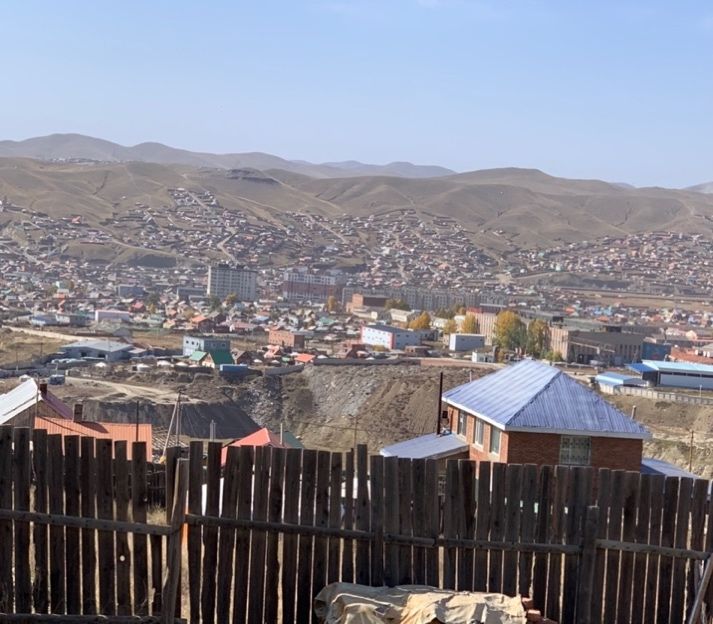
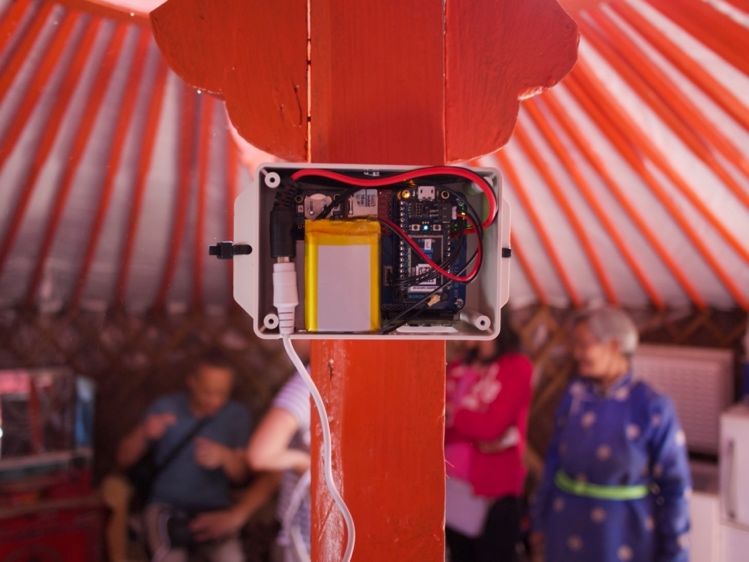
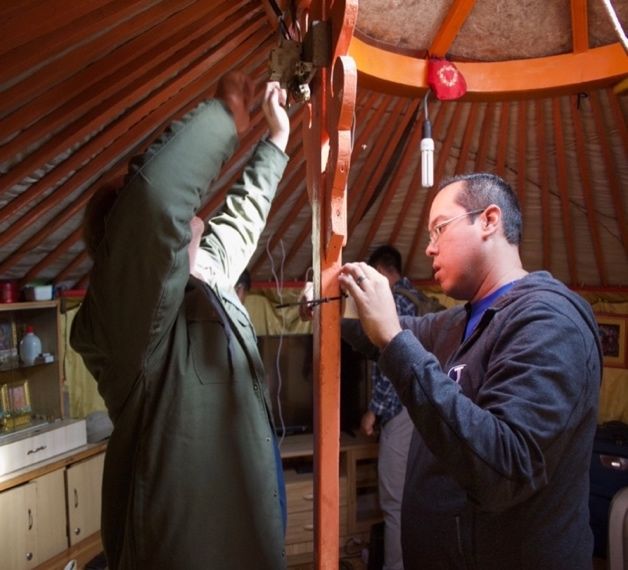
LIST OF FIGURES

Figure 2-1: PM2.5 Trend in the USA ............................................................................................... 9
Figure 3-1: All Sensors Graph by Hourly Median........................................................................ 23
Figure 3-2: Grafana Heatmap with Hourly Median for All Sensors ............................................ 23
Figure 3-3: Sensirion SPS30 ......................................................................................................... 26
Figure 3-4: PM2.5 Accuracy Between Sensirion ........................................................................... 26
Figure 3-5: PM2.5 Precision Between Sensirion SPS30 Vs FEM GRIMM .................................. 27
Figure 3-6: Coefficient of Determination Between Sensirion SPS30 Vs FEM GRIMM ............. 28
Figure 3-7: PM2.5 1 Hour Mean, µ/m3 Coefficient of Determination .......................................... 29
Figure 3-8: PM2.5 1 Hour Mean, µ/m3 .......................................................................................... 30
Figure 4-1: Air Quality Sensor Installation Location ................................................................... 39
Figure 4-2: Cover Off of an Air Quality Sensor Deployed in a Ger............................................. 39
Figure 4-3: A Mongolian Ger Where the Air Quality Sensors Were Deployed .......................... 39
Figure 4-4: Ulaanbaatar Ger District ............................................................................................ 39
Figure 5-1: Average PM2.5 Levels Compared with Average Daily Temperature ......................... 44
Figure 5-2: Hourly Median PM2.5 for Unmodified Gers .............................................................. 45
Figure 5-3: Hourly Median PM2.5 for Modified Gers ................................................................... 46

 vii
1 INTRODUCTION

 Poor air quality is a problem that knows no boundaries. It affects populations all over the

world (Carrington & Taylor, 2018; Sengupta, 2018). Epidemiological studies show that ambient

air pollutants like PM, O3, SO2, and NO2 are contributors to several respiratory problems

including bronchitis, emphysema and asthma (Mabahwi et al., 2014). One area of the world that

is hit particularly hard by poor air quality is Mongolia.

 Traditionally Mongolian families that live in gers use coal to both cook meals, as well as

heat up the gers during the Winter months where temperature can drop as low as -40 °C. The

burning of coal inside the ger causes hazardous amounts of particles that are harmful. During the

Winter months, 80% of Ulaanbaatar’s air pollution is caused by burning raw coal in stoves in the

ger districts. Mongolia has a population of 3 million people, and in 2016 an estimated 1800

people died from diseases due to gers air pollution, and more than 1500 people died from

diseases attributable to outdoor air pollution (Alcantara et al., 2020; Bulletin of the World Health

Organization, n.d.).

 Deseret International Charities and the Gerhub (Gerhub, n.d.) are looking for ways of

improving the ger structure to be more energy-efficient, thus needing less coal or no coal at all to

be burned with the intent to improve air quality inside the ger. Some ideas include building new

structures instead of using traditional gers or modifying current gers to be more energy-efficient

(A Ger with Less Brr, 2019). In making the gers more energy-efficient, an electric heater was

 1
used as opposed to using a coal stove. Although these solutions apparently provide an abundant

benefit to the people living in gers and the community all together, no indoor air quality data has

been collected in Mongolia to measure the effects of these modifications to gers and quantify the

benefits (Alcantara et al., 2020).

 Many commercial air quality sensors exist (United States Environmental Protection

Agency, n.d.); however, deploying air quality sensors in this context requires special

considerations. First, the cost of the device needs to be as low as possible. Since these projects

are typically humanitarian based, there is not much money to spend on instrumentation. Second,

it is vital to be able to monitor the data in real-time. Real-time data allows maintainers to know

when the sensors are unplugged or malfunctioning and fix the problem. Without real-time data

capability, data collection becomes challenging (you must send someone to every sensor to

download the data off of the device), and any sensors problems would not have been known until

after all the data is collected. Third, most commercial sensors that are real-time use WiFi to

upload the data this is a severe infrastructure limitation because in the ger districts of Mongolia,

there is no WiFi connectivity as the residents use cellular data through their smartphones instead;

Fourth, solutions that do not require significant human effort to maintain are desirable. A sensor

that fulfills these requirements (an inexpensive real-time sensor that uploads data through

cellular) is not commercially available (Alcantara et al., 2020).

 Although some initial attempts have been made to deploy air quality sensors in

developing countries, as discussed in the literature review, there is a need to research on various

aspects in regard to deploy air quality sensors in developing countries such as the following:

 • Deployment architecture best practices, pros and cons of each architecture.

 • Deployment challenges faced while deploying sensors in Mongolian gers.

 2
• Analyze organizations efforts in reducing air pollution inside the gers.

 • Check modified gers participants usage patterns while using electrical heaters and

 how it correlates to PM2.5 levels. This will help anyone looking into deploying

 sensors in remote areas and how to analyze the data.

1.1 Key Terms

A few terms to be aware of in this research paper are the following:

Ger: It is a portable round tent covered with skin or felt used as a form of dwelling by many

nomadic groups in Central Asia (Yurt, n.d.).

PM2.5: Particulate matter are microscopic particles or liquid matter suspended in the air. The

PM2.5 refers to the size of the particulate matter, in this case meaning a diameter of 2.5

micrometers or less. PM2.5 also known as fine particulate matter, tends to penetrate into the gas

exchange regions of the lung (Particulates, n.d.).

WiFi: It is a family of wireless network protocols based on IEEE 802.11 standards, it is

commonly used for local area networking between devices and internet access (Wi-Fi, n.d.).

Cellular: This is a communication network using wireless as the last link. This network is then

distributed over land areas named “cells” (Cellular Network, n.d.).

IoT: Internet of Things – a network of physical objects embedded with sensors with a goal of

connecting and exchanging data with other devices and systems using the internet (Internet of

Things, n.d.).

Modified Ger: Mongolian gers that were retrofitted by Deseret International Charities in

conjunction with Brigham Young University Capstone engineering students by replacing the

traditional Mongolian stove with an electrical heater, added a radiant barrier to reflect/keep heat

inside the gers during the Winter months, and the floor was insulated under the wood slats.

 3
Unmodified Ger: Traditional Mongolian ger that uses a coal stove to heat the ger during the

Winter months.

ISP: Internet service provider.

1.2 Research Objectives and Questions

(Q1) What are the architecture and design constraints when collecting remote sensor data in

Mongolian gers?

(Q1A) What are the design tradeoffs of using different architectures (WiFi/Cellular/LoRa) for

collecting sensor-based data? What are the pros and cons of each architecture?

(Q1B) What challenges are faced when implementing a field deployment sensor-based network

in Mongolian gers?

(Q2) How effective are the modified gers in reducing PM2.5 levels in Mongolian gers?

(Q2A) How effective are the modified gers versus the unmodified gers in reducing PM2.5?

(Q2B) How does temperature affect the PM2.5 gains from the modified gers?

(Q2C) How does day of week and time of day affect the PM2.5 gains from the modified gers?

1.3 Outline of Thesis

 • Chapter 2: Literature Review

 o An overview of what has been done in air quality sensing deployments focused on

 air quality health effects and measurements, deploying sensors in developing

 countries, Mongolia improved heater project and how this research informs this

 4
thesis. In depth discussion of challenges faced while deploying sensors in

 developing countries.

• Chapter 3: Methodology

 o Methods employed to answer the research questions and objectives and accuracy

 and precision of used air quality sensor are discussed in detail.

• Chapter 4: Mongolian Field Deployment & Deployment Architecture

 o Architecture and design constraints when collecting remote sensor data in

 Mongolian gers. This chapter also includes lessons learned from the Mongolian

 field deployment.

• Chapter 5: Air Quality Intervention Analysis

 o In depth analysis of PM2.5 data and how it correlates to the Mongolia improved

 heater project.

• Chapter 6: Discussion

 o Summary and discussion of findings and limitations. Includes a brief discussion

 of possible future work.

• Appendix A: Supplementary Materials

 5
2 LITERATURE REVIEW

2.1 Air Quality Health Effects and Measurement

 Several studies indicate that air pollutants contribute to increased mortality and hospital

admissions. The human effects range from nausea and trouble breathing to skin irritation to

cancer (Brunekreef & Holgate, 2002; Kampa & Castanas, 2008). It can also lead to birth defects,

serious developmental delays in kids, and reduced activity of the immune system, leading to

many diseases (Brunekreef & Holgate, 2002).

 Many studies show that all kinds of air pollution at a high pollution concentration affects

the airway (Balmes et al., 1987; Kagawa, 1985; Kampa & Castanas, 2008). Similarly, long-term

exposure to lower pollutant concentrations also affects the airway. Symptoms like nose and

throat irritation, dyspnea and bronchoconstriction, in particular those who have asthma, are

normally experienced after exposure to high levels of sulfur dioxide, nitrogen oxides and heavy

metals like arsenic, nickel or vanadium. Air pollution in the lungs can cause angina or even

myocardial infraction. Memory disturbances, hand tremors, anger, sleep disorders, blurred

vision, fatigue, and slurred speech, neurological cancer were all observed after arsenic, lead and

mercury exposure. In the digestive system dioxins induce liver cell damage as well as

gastrointestinal and liver cancer (Kampa & Castanas, 2008).

 The size of pollution particles varies. Typical measures include PM2.5 and PM10 where the

number indicates that the aerodynamic diameter is smaller than 2.5 mm and 10 mm respectively.

 6
The size of the particles determines the location in the respiratory tract that they will deposit.

PM10 particles deposit mainly in the upper respiratory tract while PM2.5 particles are able to

reach lung alveoli, which is more damaging to the lungs (Kampa & Castanas, 2008).

 In a Winter season in Ulaanbaatar, Mongolia a central government site reported PM2.5 of

250 μg/m3 inside gers (Allen et al., 2013). The average PM2.5 in gers during the daytime in

Winter ranged from 178.4 ± 152.7 to 208 ± 173 μg/m3 (Ban et al., 2017; Lee et al., 2018).

Prolonged exposure to such levels can be very detrimental to your health causing an estimate of

40,000 attributable disability-adjusted life years and 1400 attributable deaths annually (Hill et al.,

2017). Children in Mongolia with respiratory diseases and neurodevelopmental disorders have

been linked to exposure to toxic chemicals from both indoor and outdoor air pollution (Jadambaa

et al., 2015). PM2.5 can get into the lungs and into the bloodstream causing hypertension, damage

to blood vessels, spread to other organs such as the heart and cause damage to its functions and

cell structure (Martins & Carrilho da Graça, 2018). In this thesis, I will focus on PM2.5 levels for

reasons explained in the following sections.

2.2 History and Efforts to Regulate PM2.5 Levels

 Since the 1950s the United States of America suffered severe air pollution because of

increased energy consumption and motor vehicles. In order to improve air quality, the Air

Pollution Control Act was established in 1955, it was the first federal legislation on air pollution.

The Clean Air Act was funded from it in 1963. CAA authorized the development of

comprehensive federal and state regulations to limit emissions from both stationary and mobile

sources (Pui et al., 2014).

 Many other organizations were brought up with the purpose of setting standards and

regulations in order to reduce pollutant particulate matter. PM2.5 became the standard

 7
measurement because of the significant adverse health effects outlined in the prior section (Pui et

al., 2014).

 According to (Pui et al., 2014) the U.S. achieved substantial reduction of PM2.5 through the

years which may be attributed to the following efforts:

 1. Effectively conducted countrywide PM2.5 measurements and sampling

 2. Accurately measured PM2.5 mass and chemical composition concentrations

 3. Accurately derived the source allocation of PM2.5

 4. Effectively implemented both voluntary emission control and mandatory

 5. Established partnerships between several organizations such as: academia,

 industrial groups, and environmental organizations, federal, state, local, and tribal

 governments (Pui et al., 2014)

 As shown in Figure 2-1, these efforts have led to significant decreases in PM2.5 over time.

The U.S. has been a leader in reducing PM2.5 levels. Unfortunately, not all countries have seen

reductions. It’s also not clear that the same strategies that worked in the U.S. will also work in

other countries with vastly different infrastructures and sources of pollution as described in the

following sections.

 According to (Martins & Carrilho da Graça, 2018) many Countries adopt the WHO (World

Health Organization) guidelines which has different categories such as annual and short term

(24hour) limits on human exposure to PM2.5. WHO organization advises countries to set and

enforce their own national standards. WHO defined an average annual air quality guideline and 3

interims PM2.5 exposure levels to help countries to set goals to lower PM2.5 and also recommends

that annual average should take more importance than 24 hours average as it can be influenced

 8
by a sporadic high PM2.5 event. The Tables 2-1 & Table 2-2 describe the different guidelines

and a few countries and certain areas in those countries that follow these guidelines.

 Figure 2-1: PM2.5 Trend in the USA (https://www.epa.gov/air-
 trends/particulate-matter-pm25-trends)

 Table 2-1: WHO Interim PM2.5 Levels and Countries That Follow It

 WHO AQG/Interim Level PM2.5 Countries

 WHO AQG 10 μg/m3 Canada, Bolivia, Gatemala

 First Interim Level 35 μg/m3 China, Hong Kong, Malaysia, Rwanda
 Second Interim Level 25 μg/m3 Montenegro, Norway, the Republic of Kosovo,
 Russia, Colombia, Mongolia, the Philippines, the

 Republic of Korea, Thailand

 Third Interim Level 15 μg/m3 The Dominican Republic, El Salvador, Honduras,
 Puerto Rico, Ecuador, Paraguay, Peru Albania,

 Bangladesh, Japan, Jordan, Saudi Arabia and Taiwan

 9
Table 2-2: WHO Short Term (24 hr) PM2.5 Levels and Countries That Follow It

 Short term (24 PM2.5 Countries

 hr) PM2.5 limit 25 μg/m3 Australia, Bolivia, Guatemala and British Columbia

 (WHO AQG) (Canada)

 28-35 μg/m3 Canada, Paraguay, Japan, Russia, Saudi Arabia,

 Taiwan, the United States, Puerto Rico

 37.5-40 μg/m3 Singapore, Bulgaria, South Africa

 45-60 μg/m3 Mexico, Chile, Colombia, Ecuador, Mongolia,

 Philippines, The Republic of Korea, Thailand, Brazil,

 India

 65-80 μg/m3 Bangladesh, The Dominican Republic, El Salvador,

 Honduras, Jamaica, Jordan, Peru, Trinidad, Tobago and

 Buenos Aires, Albania, China, Malaysia, Hong Kong,

 Egypt

 Accurately measuring PM2.5 is a critical step to improve public health (Mahajan et al.,

2018). Also according to (Giannadaki et al., 2016) if an effort world wide was indeed followed

by adopting what is currently implemented in the USA which is as of 2012 of 12 μg/m3 for air

quality standard for PM2.5, millions of premature deaths per year can be prevented. The

following sections will discuss strategies for deploying air quality sensors that measure PM2.5.

 Other countries have developed strategies to reduce PM2.5, for instance China, a

developing country that has adopted actions to improve PM2.5 by settings restrictions to both

outdoors and indoors PM2.5. Outdoors regulations such as: reducing dust from land and buildings

 10
in urban areas where the government ensures urban greening to reduce uncovered land; vehicles

and industrial emissions restrictions. Indoors regulations such as: controlling indoors smoking in

public areas by designating smoking and non-smoking zones; using clean fuels like natural gas,

methane and electricity as opposed to straws, coal and wood; optimized and well-ventilated

stoves should be promoted. Lastly clean the house regularly, avoid burning incense and increase

indoor greening helps to lower PM2.5 (Li et al., 2017); using portable air cleaners in building as to

reduce PM2.5 is also being implemented and used (Martins & Carrilho da Graça, 2018).

 The focus of this thesis is on air quality sensors and impacts in Mongolia. Mongolia is

unique because high levels of PM2.5 largely come from residents trying to survive the brutal cold

in the Winter season by utilizing coal stoves, the most affordable way to cook and heat up the

ger. The coal burning inside the ger exposes its residents to PM2.5 at high and prolonged levels

that are not healthy (Lim et al., 2018). The focus of this thesis is on measuring reductions in

PM2.5 due to the BYU capstone modified gers project described later in this chapter. Specifically,

I observed how effective a modified ger is compared to a traditional unmodified ger in reducing

PM2.5 and identified usage patterns in modified gers and how they affect PM2.5 levels.

 According to (Lim et al., 2018), the U.S. Millennium Challenge Account funded a

program in Mongolia designed to develop energy efficient stoves to improve PM2.5 air quality

inside of gers. The project targeted the ger district in Ulaanbaatar where they recorded the PM2.5

levels for a full 24 hours. 60 gers were selected to participate in this study, 31 with improved

stove and the other 29 with traditional Mongolian stove and it was projected that they would

reduce 50-80% PM2.5. However, in this particulate effort they found that the indoor PM in the

ger with the improved stove were not significantly lower when compared to the gers with

traditional stove. As a matter of fact, the study found that the indoor PM2.5 in gers with the more

 11
energy efficient stove were significantly higher than the gers that had the traditional stove. This

suggests that there is room for improvement in heating interventions, such as the one evaluated

in this thesis.

2.3 Air Quality Sensor Deployment

 There have been several initiatives monitoring PM2.5 using various types of sensors in

previous years. Most of the conventional approaches rely on having air quality monitoring

stations deployed strategically and operated by environmental agencies or other environment

monitoring organizations. Monitoring stations are costly and big which creates issues during

large-scale deployment (Mahajan et al., 2018). The cost of a Continuous Ambient Air Quality

Monitoring Station (CAAQMS) can run between $100-130K and around $20-25K for

maintenance (Gulia et al., 2020). More recently, deploying large numbers of inexpensive air

quality sensors has been possible as described below.

 Many commercially available low-cost air quality sensors already exist (United States

Environmental Protection Agency, n.d.). Of particular interest are the Purple Air (PurpleAir:

Real Time Air Quality Monitoring, n.d.) and AirU (Kelly & Gaillardon, 2017) sensors because

they are low-cost (around $260 USD) and reasonably accurate. These sensors have been used in

a large number of studies and have been deployed in many places around the world (Hegde et al.,

2017). However, these two sensors use WiFi to report data in real-time. Since WiFi is not a

viable option in Mongolia and other remote locations, these sensors are not well suited for those

contexts. The Mongolia deployment requires a low-cost stationary sensor that must upload data

in real-time.

 12
There are many platforms and architectures designed to handle air quality data, for instance

EpiFi (Lundrigan et al., 2018; Moore et al., 2018). EpiFi is a system designed for

epidemiological research/study purposes. It is designed to deploy sensors in participant’s homes.

Because EpiFi relies on WiFi, it is also not feasible for deployment in Mongolia. There is a need

for deployments that solve the same problem as EpiFi, but that work in more remote locations

that aren’t dependent on WiFi (Alcantara et al., 2020).

 Other work has been done on sharing experiences and lessons learned related to

deploying less expensive air quality sensors in home environments. Hnat et al. shared their

experience of residential sensing deployments in the U.S. (Hnat et al., 2011). They shared

deployment issues including running out of wall sockets, wireless connectivity issues,

environmental hazards such as children, pets, and robotic vacuums, participants dropping from

the study, and maintenance challenges due to combinations of commercial and custom designed

devices. Similarly, Barrenetxea et al. shared their experience with wireless sensor network

deployments ranging from Swiss Federal Institute of Technology in Lausanne university campus

to up high in the Swiss Alps. They recommend not making the system more complex than it

needs to be, not immediately trusting the data coming in from the sensors, looking for data

outliers and detecting software bugs, and determining when sensors were unplugged

(Barrenetxea et al., 2008).

2.4 Deploying Sensors in Mongolia

 Several studies have examined air quality sensor deployment in developing countries

(Alcantara et al., 2020; Gulia et al., 2020; Miazi et al., 2016). Deploying technology in

developing countries, including Mongolia, can be challenging for a number of reasons outlined

in this section.

 13
Table 2-3: Consideration of Deploying Sensors Network in Developing Countries

 Infrastructure Designers should tailor interventions that fit with the current

 infrastructure including power, internet connectivity, data centers.

 Skilled Need to be able to hire skilled professionals to implement and support

 Professionals the sensors network.

 Cost Need to have money to be able to design, architect, implement and

 support the sensors network.

 Security Needs to be secured so the money invested does not cause losses.

 Reliability Sensors need to be reliable, so support is easily maintained for both

 sensors and its network.

2.4.1 Infrastructure Challenges

 In order to successfully deploy sensors, each sensor needs an adequate and reliable Internet

connection, scalable infrastructure, continuous power and data backup system. Such an

infrastructure does not exist and presents a problem in most developing countries due to

prohibitive costs (Miazi et al., 2016).

 Electrical power industries are among the costliest in an economy, yet also critical to most

IoT sensor deployments. Many homes in developing countries do not have access to electrical

power. Data centers are also essential, and they consume so much energy and rely upon efficient

and reliable energy sources, such that they are not feasible to build in many developing countries

(Miazi et al., 2016).

 14
2.4.2 Skilled Professionals & Cost

 Knowledgeable professionals to work with IoT such as technicians, engineers, scientists are

scarce in developing countries which can pose a problem to deploy IoT sensors. The acquisition

of sensors can be quite costly, also the need to keep up with the latest innovations and hiring

scientists from developed worlds is again costly (Miazi et al., 2016).

 Once again, just to emphasize one main point, a deployment in Delhi city, India for instance

states that one of the many cons about deploying air quality sensors in developing countries is

the cost aspect of it. Not only there is a cost to purchase air quality sensors, but there is also a

cost to hire skilled workers to deploy and maintain sensors, purchase instruments to calibrate

sensors, and pay for electricity and security. As the size of a sensors network increases, there is

also a need to analyze the data coming out of it (Gulia et al., 2020).

2.4.3 Security & Reliability

 For a successful IoT deployment, the sensors need to be robust, and use batteries that last

months and are recharged by solar power. They need to last a long time and be easily

replaceable. Whenever a sensor is disconnected or re-connected from the network it is important

to know when these events happen, therefore managing each sensor is crucial to correct

problems when they arise in a network of sensors. As security of IoT sensors are still in the

beginning stages, security is an important aspect that needs to be figured out before it is widely

deployed (Miazi et al., 2016).

2.4.4 Mongolia Geography & Deployment Challenges

 Ulaanbaatar is the capital of Mongolia; the country is located in between Russia and China.

The elevation is 1,528 m, terrain is semidesert, desert plains, grassy steppe, mountains in the

 15
west and southwest; Gobi Desert in south-central. Mongolia has harsh Winter conditions. There

is limited natural fresh water in some areas; the burning coal of soft coal in power plants and the

lack of enforcement of environmental laws leads to air pollution in Ulaanbaatar (Mongolia - The

World Factbook, n.d.).

 Mongolia is a uniquely challenging context for deploying technology as many residents live

in gers where there are no set power outlets to plug into. Each home is wired depending on the

residents’ abilities and preferences, which makes connecting sensors to power plugs more

transient and sparse compared to a traditional American home (Alcantara et al., 2020).

2.5 Mongolian Modified Ger Project

 Deseret International Charities in conjunction with Brigham Young University Capstone

engineering students introduced the idea to replace the traditional Mongolian stove with an

electrical heater, add a radiant barrier to reflect/keep heat inside the gers during the Winter

months, and the floor was insulated under the wood slats.

 After retrofitting 150 gers Deseret International Charities then asked the NET (Network

Enhanced Technologies) Lab led by Dr. Lundrigan from Brigham Young University to track the

PM2.5 in the modified gers as to determine whether the retrofit of gers makes an impact in

relation to making it less polluted and therefore improve the quality of life of the residents. The

NET Lab team used this practical project to learn more generalizable insights about how to

effectively deploy air quality sensors in Mongolia.

2.6 Summary

 In summary, although significant research has explored the deployment and accuracy of

air quality sensors in public health contexts, little work has taken on these issues in a developing

 16
country context, and none in Mongolia. I hope to add this experience of deploying and analyzing

air quality sensors in Mongolia to anyone thinking of deploying and analyzing a sensors-based

network in remote locations.

 17
3 METHODOLOGY

 This chapter outlines the mixed method approach used to address the research questions.

The first question used a field deployment of air quality sensors in Mongolian gers from

September 20, 2019 through April 30, 2020. The second question used quantitative methods to

analyze the data captured from the field deployment. Finally, I shared details about the accuracy

of the air quality monitors that were used in the study, since the findings are dependent on them.

Each of these are discussed below.

3.1 Field Deployment Methodology

 Our first research question identifies the architecture and design constraints that exist when

collecting remote sensor data in Mongolian gers. This section describes the methodology used to

address each of the sub-questions.

 (Q1A) What are the design tradeoffs of using different architectures (WiFi/Cellular/LoRa)

for collecting sensor-based data? What are the pros and cons of each architecture?

 To address our first sub-question, I used a field deployment approach with a team from

BYU that visited Mongolia in September 20-24th. I started by conducting a literature review on

known challenges of implementing sensor-based networks in developing countries including

Mongolia. Before traveling to Mongolia, we created prototypes using both LoRaWAN and

 18
cellular platforms, ultimately deciding to go with the cellular platform as described in (Alcantara

et al., 2020).

(Q1B) What challenges are faced when implementing a field deployment sensor-based network

in Mongolian gers?

 To address this second sub-question, I performed a literature review about known issues

when implementing networks of sensors in developing countries and Mongolian gers. The team

also identified several challenges through our own field deployment. To identify these

challenges, we discussed as a team design tradeoff of using different architectures

(WiFi/Cellular/LoRa) for collecting sensor-based data.

 During the deployment, the team installed air quality sensors in 35 gers, troubleshooting

devices and setup as needed. We met as a team regularly and discussed the needs of specific

families and issues that came up during deployment.

 When on-site in Mongolia we ran into problems related electrical outlet availability.

Some participants were short in power outlets and therefore by adding a plugged-in air quality

sensor we were occupying at times an outlet that was important to the participants at one time or

another. We ended up in a follow-up trip providing power outlets to make the plugging of the air

quality sensor less intrusive.

 Another on-site problem was related to sensors having issues sending in air quality

sensors data, at times it would send data just fine and then it stopped, after further

troubleshooting we have improved the software that writes data points to the microSD card and

keeps track of what has been acknowledged. Fortunately, the software update was done over the

 19
air by using Particle Boron microprocessor software update feature delivered via internet through

the cell towers.

 After returning to the U.S., the team met weekly to review status of the sensors, identify

any problems, assign a contact in Mongolia to troubleshoot and fix the sensors, and receive

feedback from the contact about what he learned. Lessons learned from a field deployment were

discussed and synthesized by the team. Details of our implementation can be found in (Alcantara

et al., 2020) and Chapter 4.

3.2 Data Analysis Methodology

 Our second research question focuses on analyzing data from the sensors to gain insights

about the effectiveness of modified gers in reducing PM2.5. This section describes the

methodology used to address each of the sub-question.

 To address this question and the three sub-questions related to it, I captured PM2.5 data,

performed some data cleanup as described below, aggregated the data, visualized the data, and

performed statistical analyses. Because the air quality sensor being used was the Sensirion

SPS30 (See pages 33-35 for the reason), although a reliable and accurate air quality sensor, it

was not able to remove the humidity out of the PM2.5 data collection, which makes the PM2.5 data

higher than it should be. Therefore, the removal of humidity is imperative in order to get to the

true PM2.5 value. According to (Di Antonio et al., 2018) in order to remove humidity from

particulate matter the following formula can be used, see Formulas 3-1 and 3-2.

 = 1 + ( 1.65
 1 ) (3-1)
 −1+

 ( )
 ( ) = (3-2)

 20
Where k = 0.4 and water activity is the same as Ammonium Sulphate (RH = 35%) which

is amongst the most common in urban areas (Di Antonio et al., 2018). Tim Dye, an expert in air

quality data, suggested that because we were using a low-cost air quality sensor that did not

remove humidity when it was collecting PM2.5, we should eliminate any data above 80%

humidity. The Sensirion SPS30 not only senses PM2.5 but also humidity which is important

because it is used to remove water particles due to humidity.

 Aggregating gers by categories such as modified and unmodified helped in analyzing the

data, although many participants that had modified gers were still at times using coal stove

during the day and electrical heaters at night because electricity was cheaper. All PM2.5 data that

had anomaly data like negative or above 1000 PM2.5 were modified to 0 and 1000 PM2.5

respectively. In the Sensirion SPS30 specifications documentation it mentions that the mass

concentration range it can measure PM is between 1 to 1000, thus the reason to only keep PM2.5

measurement value up to 1000 (Particulate Matter Sensor SPS30 | Sensirion, n.d.). Timestamps

were converted from UTC to Mongolian time, so the correct date and time when a data was

collected were represented.

 The tools used in this thesis were mainly comprised of Jupyter Notebook for running

certain commands once and not having to re-run for a subsequent command as it saves the

previous computations in memory, Grafana and also Python along with some libraries including

the following:

 1. Influxdb – Important to perform a data dump of the database.

 2. Pandas – Crucial to read the database dump and store it into a DataFrame,

 manipulate data as needed and perform data clean up.

 21
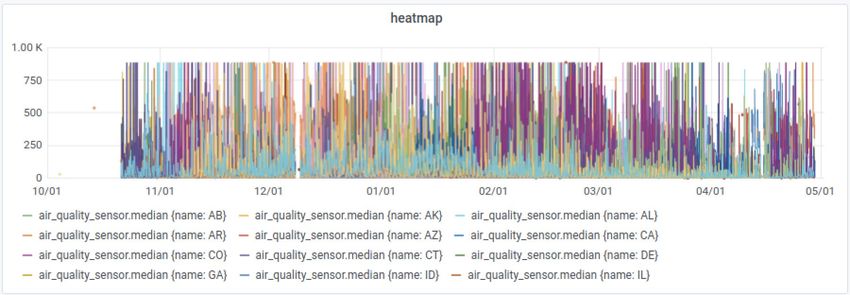
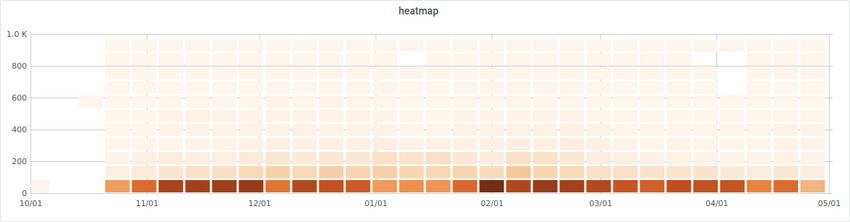
3. Matplotlib – A plot library allowing data visualization.

 4. Numpy – Library used to manipulate arrays.

 5. Scipy – Allows to perform mathematics on data.

 6. Tqdm – This is quite helpful for the developer as it is a smarter progress meter

 helpful when downloading large data and display how much data it has

 downloaded and how much is left to be downloaded.

 7. Os – Interacts with the operating system. This was useful to check whether a

 database dump file already exists and load the data from it. If no file exists that

 contained the data, then query the database, download data and save it to a file.

 These were all helpful to download the data from the influxDB database and after the

data was downloaded to plot it, analyze it, calculate statistics, and visualize the data. Microsoft

Excel was also used to perform some data analysis. All of these were necessary to make sense of

the raw air quality data.

 After the data was cleaned up as discussed previously, I was then able to join both

modified and unmodified gers in Jupyter Notebook and export the data to a CSV file. Once the

CSV file was created, it could be imported into other tools. I created VMware Ubuntu virtual

machine and installed InfluxDB so as to run it locally. I then created a script to read each line of

the exported CSV file, transform it into a format that can be inserted into InfluxDB and loaded

all data to a newly created InfluxDB database.

 In order to make sense of the 5,238,205 data points and to remove extreme outliers, I

summarized the data into hourly medians. I then used Grafana to help visualize it. See Figures 3-

1 and 3-2 below.

 22
Figure 3-1: All Sensors Graph by Hourly Median

Figure 3-2: Grafana Heatmap with Hourly Median for All Sensors

 23
Although this helped make initial sense of the data, I needed to perform additional data

statistics and create more helpful visual data aggregations to make more sense of the data. To do

so, I exported the hourly median to a different CSV dataset for each ger. I then joined all CSV

files into one Excel sheet in preparation for more statistical data analysis and used Microsoft

Excel to create a heatmap for both aggregated categories (modified and unmodified gers) and for

each ger as well to analyze and see patterns. This allowed us to identify outliers, including 4 gers

whose data was consistently so high, I believe there was a problem with the sensor. It also helped

us view missing data and create summary graphs that are shown in Chapter 5. I also added

average temperature data for Ulaanbaatar for each day in our dataset. This was needed for the

statistical analysis used to answer our research questions. Our statistical analysis was performed

using SAS with the aid of Dennis Eggett, from the Center for Collaborative Research and

Statistical Consulting from Brigham Young University.

 (Q2A) How effective are the modified gers versus the unmodified gers in reducing

PM2.5? And (Q2B) How does temperature affect the PM2.5 gains from the modified gers? We

addressed our first (Q2A) and second (Q2B) research questions in a single statistical model,

since it was important to account for temperature when considering the differences in PM2.5 from

the modified and unmodified gers. We used a mixed method analysis of covariates, blocking on

individual ger and using modified/unmodified ger type as the treatment effect. We also ran the

model for four different temperature ranges, since temperature is highly correlated with PM2.5

due to the need to run the heaters more in the colder weather (See Figure 5-1). We applied a

Bonferrroni correction to account for the fact that were making multiple comparisons. Results

are shown in Chapter 5.

 24
(Q2C) How does day of week and time of day affect the PM2.5 gains from the modified

gers? I created heat maps showing the median PM2.5 values for the day of week and time of day

on the X and Y axis for each ger, aggregated modified gers, aggregated unmodified gers, and

each individual ger. These were visually analyzed to identify common patters and are shown in

Chapter 5 to demonstrate the common patterns of use across days and time of day.

 We also performed the same statistical analyses described above, but separating it based

on day of the week, hour, or four time blocks (night, morning, midday, and afternoon) for all

temperature ranges. Results are shown in Chapter 5.

3.3 Air Quality Sensors Deployment and Analysis Replicability

 In this section I go over in details about how Sensirion SPS30 accuracy and precision were

performed as to give confidence in this research thesis so that anyone would be able to replicate

this study using the same air quality sensor with a level of confidence. By reading this thesis

along with this research paper (Alcantara et al., 2020) anyone should be able to replicate the air

quality sensors deployment, its logic and be able to analyze air quality sensors data.

3.3.1 Accuracy and Precision of Air Quality Sensor Sensirion SPS30

 The Sensirion SPS30 (Figure 3-3) is an optical particulate matter sensor. Its measurement

is based on laser scattering and contamination-resistance technology. It was selected for this

deployment as it fits the low-cost sensor requirement, and it has good accuracy and precision as

it is demonstrated in this section (Particulate Matter Sensor SPS30 | Sensirion, n.d.).

 25
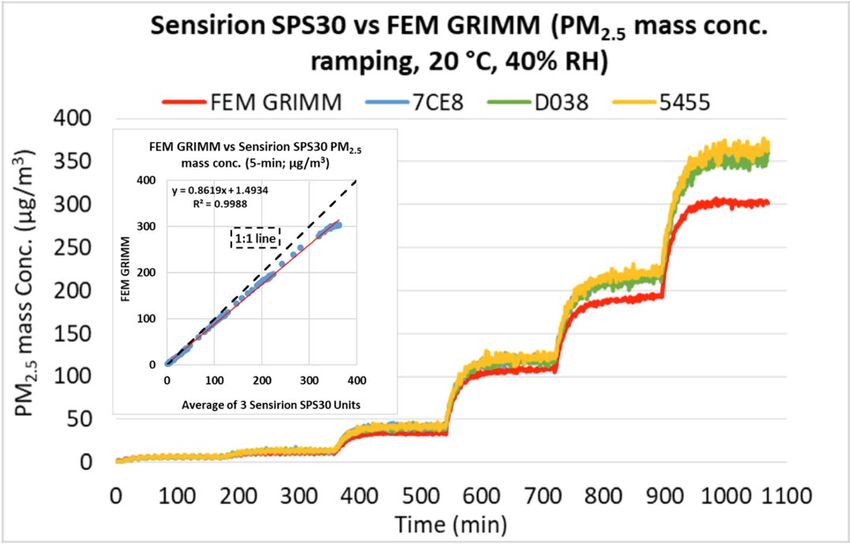
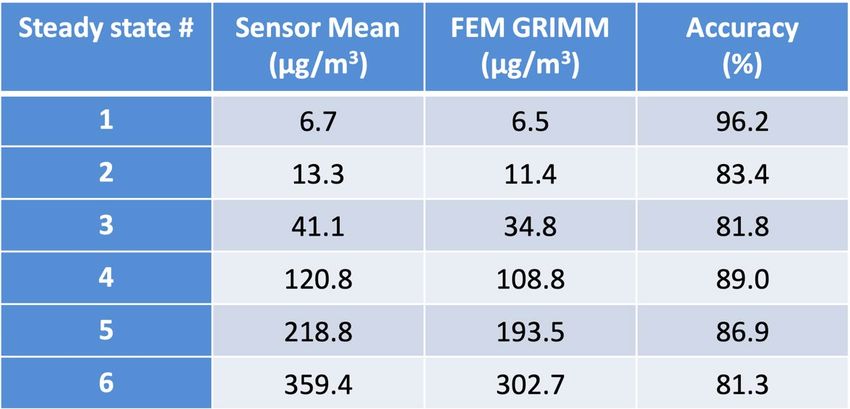
Figure 3-3: Sensirion SPS30 (Sensirion-Sps30---Summary-Report.Pdf, n.d.)

3.3.1.1 Laboratory Evaluation of Sensirion SPS30

3.3.1.1.1 Accuracy (PM2.5)

 To demonstrate the accuracy for the sensor Sensirion SPS30, 3 sensors are matched up

against FEM GRIMM which is the gold standard used to compare and contrast with the

Sensirion SPS30.PM2.5 is collected and aggregated for comparisons. At 20 ℃ and 40% Relative

humidity, see Figure 3-4.

 Figure 3-4: PM2.5 Accuracy Between Sensirion (Sensirion-Sps30---
 Summary-Report.Pdf, n.d.)

 26
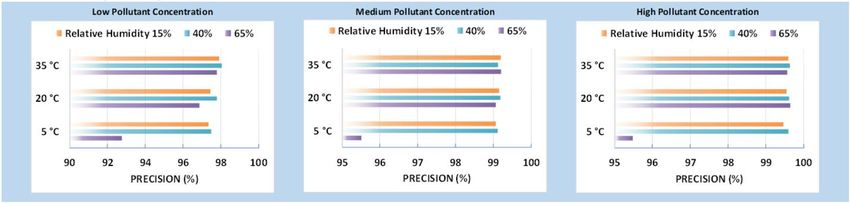
For a detailed discussion of the accuracy measures in this analysis see (Sensirion-Sps30--

-Summary-Report.Pdf, n.d.). As shown in the Figure 6 above Sensirion SPS30 overestimates

measurements from FEM GRIMM on mass concentration at 20 ℃ and 40% Relative Humidity.

Accuracy for the Sensirion SPS30 was fairly constant (81% to 96%) for the PM2.5 mass

concentration range tested (Sensirion-Sps30---Summary-Report.Pdf, n.d.).

3.3.1.1.2 Precision (PM2.5)

 A combination of nine evaluations dealing with temperature and relative humidity were

performed to measure the precision of PM2.5 concentration at either low, medium or high

pollutant levels. See Figure 3-5 for further findings where 100% signifies high precision. Details

of the definition of precision are provided in (Sensirion-Sps30---Summary-Report.Pdf, n.d.).

Figure 3-5: PM2.5 Precision Between Sensirion SPS30 Vs FEM GRIMM (Sensirion-Sps30---
Summary-Report.Pdf, n.d.)

 27
3.3.1.1.3 Coefficient of Determination

 R2 is the coefficient of determination; it quantifies how the 3 sensors followed the PM2.5

Concentration change by FEM GRIMM instrument. When the values of R2 are close to 1 it

means near perfect agreement and 0 means no correlation.

 From Figure 3-6 it is demonstrated that at 20 ℃/40% relative Humidity the Sensirion

SPS30 shows strong correlation against FEM PM2.5 data with R2 > 0.99 in the lab setting. It also

shows that relative humidity and temperature had only a small effect on the Sensirion SPS30

sensor precision. It showed significant variation on colder temperature and high humidity such as

5 ℃/65% relative humidity.

 Figure 3-6: Coefficient of Determination Between Sensirion SPS30 Vs FEM
 GRIMM (Sensirion-Sps30---Summary-Report.Pdf, n.d.)

 28
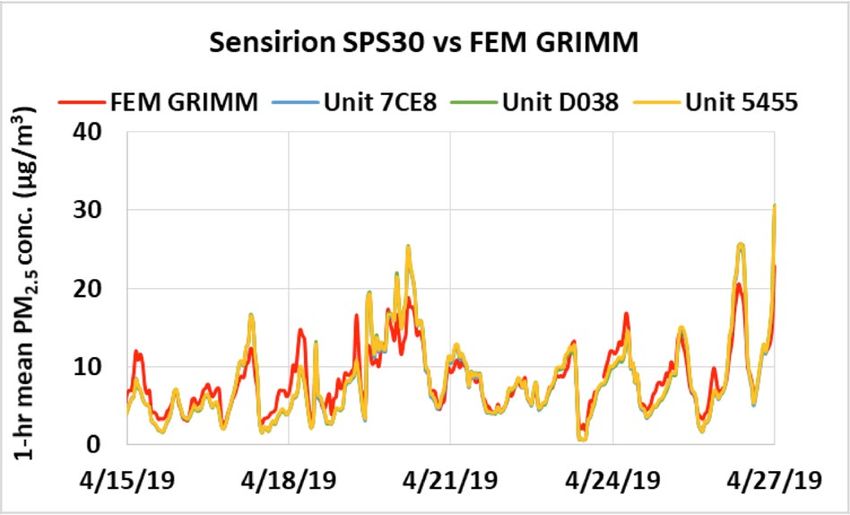
Spikes were present at relative humidity changes in concentration. See Figure 3-6 where

it shows the correlation between time and PM2.5 mass concentration changes between three

Sensirion SPS30 (7CE8, D038 and 5455) against the gold standard FEM GRIMM (Sensirion-

Sps30---Summary-Report.Pdf, n.d.).

3.3.1.2 Field Evaluation of Sensirion SPS30

 Three Sensirion SPS30 were deployed between 03/07/2019 and 05/14/2019 showing

moderate to strong correlation for PM2.5 compared to the lab experiment. In all 3 sensors, it

showed low intra-model variability and data recovery approximately 100%. See details in

(Sensirion-Sps30---Summary-Report.Pdf, n.d.).

 The Coefficient of determination PM2.5 for all sensors (7CE8, D038 and 5455) and FEM

GRIMM instrument is: 0.64 < R2 < 0.85 indicating moderate to strong correlation which can be

seen on Figures 3-7 & 3-8.

 Figure 3-7: PM2.5 1 Hour Mean, µ/m3 Coefficient of

 Determination (Sensirion-Sps30---Summary-Report.Pdf, n.d.)

 29
Figure 3-8: PM2.5 1 Hour Mean, µ/m3 (Sensirion-Sps30---Summary-
Report.Pdf, n.d.)

 30
4 MONGOLIAN FIELD DEPLOYMENT & ARCHITECTURE

 The purpose of this chapter is to answer our two research questions related to the deployment

of PM2.5 sensors in Mongolian gers. Specifically, I addressed the high-level question: What are

the architecture and design constraints when collecting remote sensor data in Mongolian gers? I

did this by addressing two sub-questions, each of which is addressed in a separate subsection:

 Research Question 1A (Q1A): What are the design tradeoffs of using different architectures

(WiFi/Cellular/LoRa) for collecting sensor-based data? What are the pros and cons of each

wireless architecture?

 Research Question 1B (Q1B): What challenges are faced when implementing a sensor-based

network in Mongolian gers?

4.1 Q1A: Design Tradeoffs of Using Different Wireless Architectures

 Choosing to work with wireless technologies while deploying air quality sensors is

important in Mongolia because gers are temporary living circumstances where even though

electricity is easy to find in the ger district, WiFi being a more permanent and wired solution is

not viable. There are three major options for wireless protocol system: WiFi, Cellular, and

LoRaWAN. These are each discussed separately below.

 31
1. WiFi Protocol

 According to (Wi-Fi, n.d.) WiFi is a wireless network protocol commonly used for local

area networking of devices and internet access. WiFi has high absorption, and it works best for

line-of-sight usage. Obstructions such as walls, home appliances substantially reduce its range.

A WiFi access point has often an indoor range of around 20 feet, while outdoor is around 150

feet. WiFi most common radio bands are 2.4 and 5 gigahertz (Wi-Fi, n.d.).

 WiFi access points usually are wired with an internet service provider. Because of its

rather short range and the air quality sensors deployment network covered a big area meaning we

would need many WiFi access points which would potentially be many single points of failure,

WiFi is not the solution for this deployment.

 2. Cellular Protocol

 Cellular network consists of a communication network in which the last link is wireless,

and the distribution is over land areas called cells. To avoid interference a cell uses a different set

of frequencies from neighboring cells (Cellular Network, n.d.). In suburban areas the cell towers

are spaced between 1-2 miles apart, in dense metropolitan cities they are spaced between 0.25-

0.5 miles apart, and in rural/flat terrain they may be spaced between 30-45 miles apart

(Kanchwala, 2018).

 Different cell signal encodings were developed to distinguish signals from different

transmitters such as frequency-division multiple access (FDMA), time-division multiple access

(TDMA) and code-division multiple access (CDMA) (Cellular Network, n.d.).

 32
You can also read