Digital Inclusion: Assessing Meaningful Internet Connectivity in Malaysia - Rachel Gong - Khazanah Research Institute
←
→
Page content transcription
If your browser does not render page correctly, please read the page content below
DISCUSSION PAPER 11/20 | 07 SEPTEMBER 2020

Digital Inclusion: Assessing
Meaningful Internet
Connectivity in Malaysia
Rachel Gong
Khazanah Research Institute

     The KRI Discussion Papers are a series of research documents by the author(s) discussing
     and examining pressing and emerging issues. They are stand-alone products published to
     stimulate discussion and contribute to public discourse. In that respect, readers are
     encouraged to submit their comments directly to the authors.

     The views and opinions expressed are those of the author and may not necessarily represent
     the official views of KRI. All errors remain authors’ own.

  DISCUSSION PAPER 11/20 | 07 September 2020

  Digital Inclusion:
  Assessing Meaningful Internet Connectivity in Malaysia
  This discussion paper was prepared by Rachel Gong from the Khazanah Research Institute (KRI)
  with research assistance from Shariman Arif Mohamad Yusof, Ahmad Ashraf Ahmad Shaharudin,
  Amos Tong Huai En, Anne Sharmila Selvam, Claire Lim Yu Li, Emir Izat Abdul Rashid, and Shenyi
  Chua. The author would like to thank the #NetworkedNation research team, Hady Hud, Nungsari
  Ahmad Radhi, Rinalia Abdul Rahim, and reviewers from Bank Negara Malaysia for their valuable
  comments. The author would also like to gratefully acknowledge the use of data shared by Bank
  Negara Malaysia, Pos Malaysia Berhad, and Telekom Malaysia Berhad. All errors remain the
  author’s own.

  Author’s email address: rachel.gong@krinstitute.org

  Attribution – Please cite the work as follows: Gong, Rachel. 2020. Digital Inclusion: Assessing meaningful
  internet connectivity in Malaysia. Kuala Lumpur: Khazanah Research Institute. License: Creative Commons
  Attribution CC BY 3.0.

  Translations – If you create a translation of this work, please add the following disclaimer along with the
  attribution: This translation was not created by Khazanah Research Institute and should not be considered
  an official Khazanah Research Institute translation. Khazanah Research Institute shall not be liable for any
  content or error in this translation.

  Information on Khazanah Research Institute publications and digital products can be found at
  www.KRInstitute.org.

  Cover photo by Morning Brew on Unsplash.

KRI Discussion Paper | Digital Inclusion: Assessing meaningful internet connectivity in Malaysia 2
DISCUSSION PAPER 11/20 | 07 SEPTEMBER 2020
Digital Inclusion: Assessing Meaningful Internet
Connectivity in Malaysia
Rachel Gong
Summary
• This paper explores the digital divide in Malaysia by examining three aspects of digital
inequalities from a demand-side perspective: first, internet penetration rates (access);
second, data pricing (affordability); and third, several ways in which Malaysians use the
internet (application). The paper also discusses why closing the digital divide requires
more than just technical solutions and offers some policy considerations regarding
meaningful connectivity and digital inclusion.
• Generally speaking, as at 2019, Malaysia is a highly digitally networked nation, with 90%
of households using the internet, mostly through mobile broadband plans on smartphones.
Internet usage trends show the digital generation gap closing, but the digital gender gap
widening. Despite data affordability, there remains a positive relationship between median
household income and both fixed and mobile broadband subscription rates.
• The most popular online activities among internet users in Malaysia are still oriented
around communication, socialising, and media consumption, but economic activities rank
highly as well, with approximately one in two internet users engaging in work-related
activities, banking, and shopping online.
• Providing affordable digital access is just the first step in the digital transformation of a
society. Policymakers would do well to consider the societal implications of an increasingly
digital population before jumping ahead to automation, artificial intelligence, and 5G.
Digital literacy, data privacy, cybersafety, and surveillance are just some of the issues that
need to be addressed as part of the nation’s digital inclusion efforts.
• Six areas for future research and policy considerations are discussed: (1) Internet access as
a public utility, (2) measurement of meaningful metrics, (3) the benefits of fixed broadband,
(4) subsidies for devices, not just data, (5) reformatting of legal codes, and (6) focusing on
fundamentals first.
KRI Discussion Paper | Digital Inclusion: Assessing meaningful internet connectivity in Malaysia 3Introduction Sabahan student Veveonah Mosibin made international headlines1 in June 2020 when her video of spending 24 hours in a tree to take her online examinations went viral. The Malaysian Communications and Multimedia Commission (MCMC) responded by releasing a statement indicating that plans had been made to build a new telecommunications tower2 where she lived, which would improve the 3G coverage and service in the area, and to upgrade coverage in the area to 4G under the Universal Service Provision (USP) fund. Considering that Malaysia’s internet penetration rates are well over 100%, indicating that the average Malaysian has at least one way of accessing the internet, and that internet penetration in Sabah in 2019 was 80.7%3, is Veveonah’s story an outlier, or is it indicative of a deeper structural inequality masked by macro-statistics? This paper explores the digital divide in Malaysia by examining three aspects of digital inequalities from a demand-side perspective: first, internet penetration rates (access); second, data pricing (affordability); and third, several ways in which Malaysians use the internet (application). The paper also discusses why closing the digital divide requires more than just technical solutions and offers some policy considerations regarding meaningful connectivity and digital inclusion. Even before the new normal wrought by the Covid-19 pandemic, Malaysia was well on its path of digital transformation. The National Fiberisation and Connectivity Plan (NFCP) had been established, aiming to “put in place robust, pervasive, high quality and affordable digital connectivity throughout the country”4, efforts to improve digital financial services and go cashless saw the average Malaysian making 150 e-payment transactions in 2019, compared to just 83 in 20155, and schools and universities were trying out online classes in line with the National e- Learning Policy 2.06. The pandemic has accelerated this process, and it is imperative that efforts to develop a digital economy do not neglect the fundamentals of a digital society, namely meaningful connectivity and digital inclusion. 1 BBC (2020) 2 Malaysian Communications and Multimedia Commission (2020b) 3 Malaysian Communications and Multimedia Commission (2020a) 4 Malaysian Communications and Multimedia Commission (n.d.) 5 Author’s correspondence with Bank Negara Malaysia (BNM) 6 Ministry of Higher Education (n.d.) KRI Discussion Paper | Digital Inclusion: Assessing meaningful internet connectivity in Malaysia 4
Box 1. Definitions of digitization, digitalization, and digital transformation

      Digitization: the process of making a digital (i.e. electronic) version of something analog, e.g.
      scanning a document or converting a paper ledger into an electronic spreadsheet.

      Digitalization: the process “in which many domains of social life are restructured around digital
      communication and media infrastructures”7. This process changes the world of work, making
      “the acquisition of digital skills…a prerequisite for individual, industry, and regional success”8
      e.g. automated filtering of resumes and first-round interviews taking place via video-
      conferencing.

      Digital transformation: the process of technological adoption and cultural change that have
      broader socio-technological implications, e.g. influencers on social media becoming primary
      news sources as paid print journalism declines.

  What is the digital divide?
  Research on digital inequalities in the late 1990s and early 2000s described a “digital divide” that
  was primarily focused on digital inequalities in terms of internet access9. As internet connectivity
  spread quickly in developed nations and the digital divide closed, at least in terms of access,
  researchers turned their attention to other areas of digital inequalities, such as affordability,
  quality of service, and digital literacy10.

  Most of this early research used socio-economic factors such as income and educational
  attainment to predict internet use11, but as access became more ubiquitous, researchers flipped
  their models and began to use internet access as a predictor of socio-economic and socio-political
  outcomes. Initially, research indicated that people who were better off were more likely to use
  the internet. Later research indicated that people who used the internet were likely to improve
  their life outcomes, leading to a reinforcing cycle that could worsen existing inequalities.

  Studies have shown, broadly speaking, that increases in internet accessibility are positively
  associated with improvements in socio-economic outcomes, such as educational attainment, job
  opportunities12, political engagement13, and health literacy14. These positive relationships have
  been found not just in countries with developed infrastructure but in developing countries as
  well.

  7 Brennen and Kreiss (2016)
  8 Muro et al. (2017)
  9 DiMaggio, Hargittai, Celeste, et al. (2001), Robinson et al. (2015)

  10 Hargittai, Piper, and Morris (2018)

  11 Howard, Busch, and Sheets (2010), Willis and Tranter (2006)

  12 DiMaggio and Bonikowski (2008), Hjort and Poulsen (2019), Kuhn and Mansour (2014)

  13 Samsudin A. Rahim (2018)

  14 Neter and Brainin (2012)

KRI Discussion Paper | Digital Inclusion: Assessing meaningful internet connectivity in Malaysia 5
As more and more of society’s functions become dependent on internet connectivity and
computer processing power, the debate continues as to whether digital inequalities are the result
of existing socio-economic inequalities or the cause of continued and worsened social
inequalities. These are not mutually exclusive explanations, but both point towards the same
policy implication – that one of the priorities of digital policy should be universal, affordable high-
speed internet access.
In 2016, the United Nations (UN) affirmed “the importance of applying a comprehensive human
rights-based approach in providing and in expanding access to Internet and request[ed] all States
to make efforts to bridge the many forms of digital divide”15. The UN declared internet access a
human right and several countries such as Costa Rica, Finland, Greece, and India have made it a
legal requirement that all their citizens have access to the internet. This does not mean that
service is provided at no cost; rather it means that government policy values internet access as a
public utility, like water and electricity.
What is meaningful connectivity?
An important shift in the conversation on the digital divide is a move away from a binary view of
internet access and towards a spectrum measuring multidimensional aspects of meaningful
connectivity. The UN’s Broadband Commission for Sustainable Development defines meaningful
universal connectivity as “broadband adoption that is not just available, accessible, relevant and
affordable, but that is also safe, trusted, empowering users and leading to positive impact”16.
The Alliance for Affordable Internet (A4AI) has proposed a meaningful connectivity standard that
takes into account four dimensions, as shown in Table 1:
Table 1. Four dimensions of meaningful connectivity
Dimension of internet access Minimum threshold
Regular internet use Daily use
An appropriate device Access to a smartphone
Enough data An unlimited broadband connection at home or a place of work or study
A fast connection 4G mobile connectivity
Source: A4AI 2020
Usage of this standard would mean that instead of evaluating the digital divide in terms of a single
binary measure of internet penetration, policymakers would assess progress to reduce the divide
along these four dimensions. At the time of writing, this standard has been tested in Colombia,
Ghana, and Indonesia17.
15 United Nations Human Rights Council (2016)
16 International Telecommunication Union (2019)
17 Alliance for Affordable Internet (2020)
KRI Discussion Paper | Digital Inclusion: Assessing meaningful internet connectivity in Malaysia 6How is broadband defined? One of the difficulties in assessing the extent of the digital divide lies in the ways that terms are defined and measured. For starters, the definition of broadband internet, which is commonly understood to mean a high-speed connection that is always available (as compared to the early days of the internet when users had to manually dial in each time they wanted to connect), is inconsistently specified. The International Telecommunication Union (ITU), a UN agency, in 2003 defined broadband as a combination of connection capacity and speed, “at 1.5 or 2.0 Mbps”18. In 2018, this definition was revised to “access in which the connection(s) capabilities support data rates greater than 2 Mbps”19. The United States of America’s Federal Communications Commission (FCC), in its 2018 Broadband Deployment Report, defined broadband connections as having a minimum 25 Mbps download speeds and 3 Mbps upload speeds20. The Malaysian government, in its National Broadband Initiative (NBI) in 2010, defined broadband along two categories: broadband to high impact economic areas and businesses with a minimum speed of 10 Mbps and broadband to the general population with average speeds of 2 Mbps21. The NFCP has set a target for internet service providers to deliver average speeds of 30 Mbps for download and 10 Mbps for upload22. The definitions used in this paper follow the 2019 MCMC specifications of fixed broadband with speeds starting at 1 Mbps, and mobile broadband with speed starting at 650 kbps23. Broadband can be further divided into fixed broadband and mobile broadband. Fixed broadband refers to a connection tied to an unmoving location, for example, at home, school, or the office. Mobile broadband refers to a connection that is portable, usually associated with a SIM card and accessed via a smartphone. Figure 1. Broadband classification Source: Author’s visualization 18 International Telecommunication Union (2003) 19 International Telecommunication Union (2018) 20 Federal Communications Commission (2018) 21 Malaysian Communications and Multimedia Commission (2010) 22 Malaysian Communications and Multimedia Commission (n.d.) 23 Malaysian Communications and Multimedia Commission (2020a) KRI Discussion Paper | Digital Inclusion: Assessing meaningful internet connectivity in Malaysia 7
Mobile broadband can be classified according to what generation of development it belongs to.
  For simplicity, the following classifications are based on only the data transfer capabilities of each
  generation. The first generation of mobile technology was analog, that is, voice only. The second
  generation (2G) allowed mobile users to transfer small bits of digital data, typically via text
  messages; 3G allowed mobile users to transfer data at up to speeds of 21.6 Mbps although in
  practice speeds of 2 Mbps were the norm. 4G was a big jump up from 3G, with speeds theoretically
  able to reach over 100 Mbps, and 5G is expected to jump an even bigger order of magnitude, with
  data transfer speeds reaching over 1 Gbps.

  Until 5G infrastructure is widely installed and compatible devices reach the consumer market at
  affordable prices, the average mobile broadband user will have to be content with 3G or 4G
  service, which is generally enough for typical consumer use such as checking email and social
  media, streaming audio or video, or playing games. Table 2 summarises the development of
  internet service provision in Malaysia.

  Table 2. A brief history of internet service provision in Malaysia

    1985      The Malaysian Institute of Microelectronics System (MIMOS) is established as Malaysia’s first
              internet service provider (ISP)a
    1986      Rangkaian Komputer Malaysia (RangKom) is set up between academic institutions a
    1991      JARING (Joint Advanced Integrated Networking) is launched as a separate entity which absorbed
              RangKom and commercialized Internet accessb
    1992      A satellite link is established between Malaysia and the United States with speeds of 64kbpsb
    1994      JARING upgraded the average connection speed in Malaysia to 1.5Mbps, accessible via fixed
              telephone lines in 16 major citiesb
    1996      Telekom Malaysia Berhad (TM) is awarded second ISP license, established TMNetb
    1998      TIME, Maxis, Mutiara (later known as Digi), Celcom and Prismanet received ISP licenses c
              The government passed the Communications and Multimedia Act 1998 (CMA) and Malaysian
              Communications and Multimedia Commission Act (1998), which established the Malaysian
              Communications and Multimedia Commission (MCMC)d
              The Universal Service Provision (USP) fund is established to fund infrastructure costs of the Rural
              Broadband Initiative (RBB). ISPs contribute 6% of weighted net revenue to the USP funde
    2001      TM launched Streamyx that provided national coverage and at a minimum speed of 384kpbs f
    2008      The Government formed the Broadband Implementation Strategy in 2008 which consisted of two
              key strands: High Speed Broadband (HSBB) and Broadband to the General Population (BBGP) h
              Public-private partnership (PPP) is established with TM for HSBB Phase 1 to provide speeds of
              10Mbps to 100Mbps in strategic areash
    2010      The government launched the National Broadband Initiative (NBI) g
              TM launched its HSBB service, Unifi, providing 48 exchange coverage areas across Malaysiag
    2015      Further PPPs are developed for Phase 2 of HSBB and Sub-Urban Broadband Project (SUBB) to
              upgrade copper lines and improve speeds in suburban areasi
    2018      Mandatory Standard on Access Pricing (MSAP) is implemented to regulate wholesale prices of
              broadbandj
              The Ministry of Communications and Multimedia launched the National Fiberisation and
              Connectivity Plan (NFCP) to further improve high-speed broadband coverage nationwidej

  Sources: aMohamed b. Awang-Lah (1987), bNorfaezah binti Abd Halim (2010), cMCMC (2015b), dMCMC (2016b),
  eMCMC (2006), fTelekom Malaysia (2002), gMCMC (2010a), hNor Akmar Shah Minan (2009), iTelekom Malaysia

  (2015), j(Raju 2019)

KRI Discussion Paper | Digital Inclusion: Assessing meaningful internet connectivity in Malaysia 8
Assessing Access The first of the three aspects of the digital divide explored in this paper is access, measured in terms of internet penetration, user demographics, and broadband subscription rates. Global comparison: internet penetration statistics According to the Department of Statistics Malaysia (DOSM), household internet use in Malaysia has increased from 21% in 2009 to 90% in 201924. However, it is unclear from this statistic whether that refers to a fixed connection or a mobile connection. The Malaysian Communications and Multimedia Commission (MCMC) reports slightly different statistics, indicating that broadband penetration rates per 100 inhabitants have increased from 17% in 2010 to 131% in 201925. In other words, for every 100 people in Malaysia, there are approximately 131 registered broadband subscriptions, most of them in the form of SIM cards. It should be noted that this number is the sum of both fixed and mobile subscriptions, which are not perfect substitutes. While it is highly likely that an individual with a fixed broadband subscription also has a mobile broadband subscription, the reverse is not as likely. The DOSM and MCMC numbers differ because of the distinct ways these agencies calculate internet penetration. The DOSM method employs a household survey in which respondents are asked whether they used the internet in their household in the last three months. The MCMC method takes the number of registered broadband accounts and divides it by the population of the country, as estimated by DOSM. Statistics from both agencies are reported to the International Telecommunications Union (ITU) to evaluate different measures of internet penetration. Table 3 compares Malaysia’s internet penetration rates to selected countries in 2017 and 2018. Malaysia outperforms the global average in terms of internet users and mobile broadband penetration but falls behind in terms of fixed broadband penetration. Based on DOSM’s 2018 figures provided to the ITU, 81.2% of individuals in Malaysia use the internet, compared to a global average of 73.6% across 82 reporting countries. The 2018 numbers MCMC provided to the ITU supply further detail, indicating a fixed broadband penetration rate of 8.6%, compared to a global average of 15.5% across 178 reporting countries, and a mobile broadband penetration rate of 134.5%, compared to a global average of 111.2% across 179 reporting countries. The statistics indicate that mobile broadband is preferred over fixed broadband globally, even in countries with developed fixed line infrastructure. 24 Department of Statistics Malaysia (2012, 2020a) 25 Malaysian Communications and Multimedia Commission (2010a, 2020a) KRI Discussion Paper | Digital Inclusion: Assessing meaningful internet connectivity in Malaysia 9
Table 3. Malaysia’s internet penetration rates compared to selected countries, 2017, 2018
    Country                        Internet users   Internet users   Fixed broadband   Mobile broadband
                                      (%, 2017)        (%, 2018)         (%, 2018)        (%, 2018)
    MALAYSIA                            80.1             81.2               8.6               134.5
    Selected benchmarks
    South Korea                         95.1             96.0              41.6               129.7
    U.K.                                94.6             94.9              39.6               118.4
    U.S.                                87.3              -                33.8               129.0
    Australia                           86.5              -                30.7               113.6
    China                               54.3              -                28.5               115.5
    India                               34.5              -                 1.3                86.9
    Comparable GDP per capita
    Kazakhstan                          76.4             78.9              13.4               142.3
    Poland                              76.0             77.5              16.1               134.8
    Mexico                              63.9             65.8              14.6                95.2
    Comparable population
    Canada                              91.0              -                39.0                89.6
    Saudi Arabia                        82.1             93.3              20.2               122.6
    Ghana                               39.0              -                 0.2               137.5
    Selected ASEAN
    Singapore                           84.4             88.2              28.0               148.8
    Philippines                         60.0              -                 3.7               126.2
    Vietnam                             58.1             70.3              13.6               147.2
    Thailand                            52.9             56.8              13.2               180.2
    Indonesia                           32.3             39.9               3.3               119.3

  Source: International Telecommunication Union 2019
  Note: Dash “-” indicates no data available.

  National demographics: internet penetration by gender and age

  Figure 2 shows the proportion of women in the Malaysian population and the proportion of
  internet users who are women from 2012 to 2018. The proportion of women in the population
  remains steady around 48.0%, but the proportion of internet users who are women declines over
  time from 43.6% to 41.0%. This is a worrying trend as it indicates a possible increase in the digital
  gender divide.

  The digital gender divide is not limited to Malaysia. Across the 100 countries, including Malaysia,
  assessed in the Inclusive Internet Index 202026, men are 12.9% more likely than women to have
  internet access. The index indicates that this digital gender gap becomes wider as income levels
  and women’s participation in the labour force decrease. The good news is that an expert survey
  conducted by the A4AI and the World Wide Web Foundation in 2018 found that Malaysia had a
  gender-responsive broadband policy in place, which included “gender-specific targets for
  internet access and digital skills training, with adequate budget set aside to implement the

  26   The Economist Intelligence Unit (2020)

KRI Discussion Paper | Digital Inclusion: Assessing meaningful internet connectivity in Malaysia 10
policy”27. Evidence of this policy’s implementation and outcomes will need to be collected and
evaluated to determine its effectiveness.
Figure 2. Percentage of women in Malaysia vs Figure 3. Percentage of population aged >50 in
internet users Malaysia vs internet users
50 % 50%
45 % 45%
40 % 40%
35 % 35%
30 % 30%
25 % 25%
20 % 20%
15 % 15%
10 % 10%
5% 5%
0% 0%
2012 2014 2016 2018 2012 2014 2016 2018
Population Internet Users Population Internet Users
Sources: DOSM population estimates, MCMC Internet Users Survey 2012, 2014, 2016; 2018
Figure 3 shows the proportion of the Malaysian population aged 50 and above and the proportion
of internet users in this age group from 2012 to 2018. This proportion of this age group in the
general population increases slightly from 17.2% to 19.3% during this time period, but the
proportion of internet users in this age group increases much more rapidly from 4.2% to 16.0%
as internet usage increases overall.
While 20-something year-olds continue to form the biggest age group among internet users, data
suggest that the digital age gap is closing. The age of the average internet user in Malaysia
increased from 29.7 years in 2012 to 36.2 years in 201828. As the time period under analysis is
just 2012-2018, this effect is likely not only due to internet users moving up into the next age
group, but also likely indicates that more seniors are coming online.
On the one hand, this is an encouraging finding, indicating that Malaysians of all ages are adopting
digital technologies. On the other hand, older internet users who have limited technological
exposure and experience may find themselves at greater risk of becoming victims of cybercrime,
especially fraud and scams, or distributors of misinformation on social media. Reports indicate
that there are seniors unfamiliar with terminology, including cashless and online payments who
are struggling to find appropriate education, guidance, and support29. Seniors also report less
experience with computers, the internet, and technology in general30. As such they are
27 World Wide Web Foundation (2018)
28 Malaysian Communications and Multimedia Commission (2014, 2019b)
29 Wong et al. (2018), Yaakob, Wan Hassan, and Daud (2016), Yeoh (2019)
30 Hui (2016)
KRI Discussion Paper | Digital Inclusion: Assessing meaningful internet connectivity in Malaysia 11uncomfortable with the pace at which digital technology evolves and may be reluctant to try relatively more complicated tools such as cashless online payment apps even as they embrace social media and messaging apps31. State subscription rates: trends in fixed and mobile broadband The following figures show trends in broadband subscription rates at state-level from 2011-2019. Figure 4 shows state trends in broadband subscription rates while Figure 5 shows state trends in mobile broadband subscription rates. Both figures are sorted in descending order of fixed broadband subscription rates for ease of comparison. Kuala Lumpur has the highest subscription rates among the states for both fixed and mobile broadband. The fixed broadband subscription rate peaked in Kuala Lumpur in 2014 at 23.1% but then declined as mobile broadband gained popularity. As at 2019, Kuala Lumpur, Selangor, Pulau Pinang, and Putrajaya outperform the national average in terms of fixed broadband subcription rates. Mobile broadband penetration in Kuala Lumpur is significantly higher than all the other states; the mobile broadband subscription rate in Kuala Lumpur in 2019 is 249.6%, implying that, on average, every resident has at least two SIM cards. There are at least two possible explanations for this high number. First, Kuala Lumpur has a larger number of large firms that are likely to register SIM cards for their employees’ work use. Second, there is a large number of migrant workers in Kuala Lumpur who are likely to have registered SIM cards but are themselves not counted in population estimates. Overall trends show fixed broadband subscription rates remaining relatively flat over the years, with a national rate of 9.0% in 2019 versus 7.6% in 2011. These statistics indicate that there are approximately 9 registered fixed broadband subscriptions for every 100 inhabitants. However, since the average household size in Malaysia is 3.9 people32, it would be reasonable to assume that approximately 35% of the population has access to a fixed broadband connection. Mobile broadband subscription rates, on the other hand, show substantial growth beginning in 2015, which accounts for the dramatic growth from a national rate of 11.6% in 2011 to 122.7% in 2019. This growth can be attributed to at least three developments circa 2015. First, there was the roll out of 4G beginning in 2013 that supplemented the migration from 2G to 3G, all of which improved mobile broadband quality of service. Second, smartphones prices dropped, which made them more widely affordable. Third, telephone companies (telcos) responded by heavily promoting mobile data packages33. 31 Andalib and Hashim (2018), Wong et al. (2018) 32 Department of Statistics Malaysia (2020b) 33 Malaysian Communications and Multimedia Commission (2016) KRI Discussion Paper | Digital Inclusion: Assessing meaningful internet connectivity in Malaysia 12
Figure 4. Fixed broadband subscription rates by state, 2011-2019
                                                             Ku

                                                    WP Kuala Lumpur
                                           24 %
                                                                                           National
                                           16 %                                            State
                                           8%

                                           0%
                                             2011 2013 2015 2017 2019

                Selangor                             Pulau Pinang                           WP Putrajaya
    24                                     24                                     24

    16                                     16                                     16

     8                                      8                                      8

     0                                      0                                      0
      2011   2013    2015    2017   2019     2011   2013    2015    2017   2019     2011   2013    2015   2017   2019

                    Johor                                  Melaka                          Negeri Sembilan
    24                                     24                                     24

    16                                     16                                     16

     8                                      8                                      8

     0                                      0                                      0
      2011   2013    2015    2017   2019     2011   2013    2015    2017   2019     2011   2013    2015   2017   2019

               WP Labuan                                   Perak                               Sarawak
    24                                     24                                     24

    16                                     16                                     16

     8                                      8                                      8

     0                                      0                                      0
      2011   2013    2015    2017   2019     2011   2013    2015    2017   2019     2011   2013    2015   2017   2019

                    Perlis                                 Kedah                               Pahang
    24                                     24
                                                                                  24
    16                                     16                                     16
     8                                      8                                      8
     0                                      0                                      0
      2011   2013    2015    2017   2019     2011   2013    2015    2017   2019     2011   2013    2015   2017   2019

              Terengganu                                   Sabah                              Kelantan
    24                                     24                                     24

    16                                     16                                     16

     8                                      8                                      8

     0                                      0                                      0
      2011   2013    2015    2017   2019     2011   2013    2015    2017   2019     2011   2013    2015   2017   2019

  Source: Author’s calculations based on MCMC data

KRI Discussion Paper | Digital Inclusion: Assessing meaningful internet connectivity in Malaysia 13
Figure 5: Mobile broadband subscription rates by state, 2011-2019
Ku
WP Kuala Lumpur
250 %
National
200 %
150 % State
100 %
50 %
0%
2011 2013 2015 2017 2019
Selangor Pulau Pinang WP Putrajaya
250 250 250
200 200 200
150 150 150
100 100 100
50 50 50
0 0 0
2011 2013 2015 2017 2019 2011 2013 2015 2017 2019 2011 2013 2015 2017 2019
Johor Melaka Negeri Sembilan
250 250 250
200 200 200
150 150 150
100 100 100
50 50 50
0 0 0
2011 2013 2015 2017 2019 2011 2013 2015 2017 2019 2011 2013 2015 2017 2019
WP Labuan Perak Sarawak
250 250 250
200 200 200
150 150 150
100 100 100
50 50 50
0 0 0
2011 2013 2015 2017 2019 2011 2013 2015 2017 2019 2011 2013 2015 2017 2019
Perlis Kedah Pahang
250 250 250
200 200 200
150 150 150
100 100 100
50 50 50
0 0 0
2011 2013 2015 2017 2019 2011 2013 2015 2017 2019 2011 2013 2015 2017 2019
Terengganu Sabah Kelantan
250 250 250
200 200 200
150 150 150
100 100 100
50 50 50
0 0 0
2011 2013 2015 2017 2019 2011 2013 2015 2017 2019 2011 2013 2015 2017 2019
Source: Author’s calculations based on MCMC data
KRI Discussion Paper | Digital Inclusion: Assessing meaningful internet connectivity in Malaysia 14Table 4 shows the states’ median household income and fixed and mobile broadband subscription
rates as at 2019, sorted by state median household incomes. States whose median household
income is above the national average are likely to have fixed and mobile broadband subscription
rates that also outperform the national average, although the direction of causality cannot be
conclusively determined. The data suggest that there is a significant positive relationship
between fixed broadband subscription rates and median household income, and that this
relationship is weaker between mobile broadband subscription rates and median household
income.
Table 4. Broadband subscription rates and median household incomes, by state, 2019
State Fixed broadband (%) Mobile broadband (%) Median household income (RM)
MALAYSIA 9.0 122.7 5873
Kuala Lumpur 16.4 249.6 10549
Putrajaya 12.5 102.1 9983
Selangor 15.8 130.5 8210
Labuan 8.1 107.8 6726
Johor 9.9 142.0 6427
Pulau Pinang 12.9 143.3 6169
Melaka 9.9 116.3 6054
Terengganu 4.7 96.4 5545
Negeri Sembilan 9.0 137.4 5005
Perlis 5.5 108.5 4594
Sarawak 5.9 107.4 4544
Pahang 4.7 102.3 4440
Kedah 5.3 100.0 4325
Perak 8.0 116.2 4273
Sabah 3.1 82.0 4235
Kelantan 2.5 93.0 3563
Source: Household Income Survey (HIS) 2019, author’s calculations based on MCMC 2020
Note: Figures diverge slightly from MCMC statistics due to rounding.
Using Household Income Survey (HIS) data from 2012, 2014, and 2016, state median household
incomes and fixed broadband subscription rates, the latter lagged by a year, were found to be
positively correlated (r(46) = .72, pAssessing Affordability
The second of the three aspects of the digital divide explored in this paper is data affordability,
measured using data pricing for both fixed and mobile broadband and considered in absolute and
relative terms.
Absolute pricing: how much does internet access cost in Malaysia?
Mobile broadband plans are typically priced according to how much data is allocated over a fixed
period, e.g. 20 GB per month. Fixed broadband plans are typically priced according to the speed
at which data are transferred, e.g. 100 Mbps, and do not limit the amount of data transferred.
Figure 6. Mobile broadband prices per GB and subscription rates, 2012-2019
RM 40 140 %
RM 35 120 %
RM 30
100 %
RM 25
80 %
RM 20
60 %
RM 15
40 %
RM 10
RM 5 20 %
RM 0 0%
2012 2013 2014 2015 2016 2017 2018 2019
Postpaid Price Prepaid Price Subscription Rate
Source: Author’s calculations based on web and MCMC data
Figure 6 shows the absolute price per GB of mobile data from 2012 to 2019. As might be expected,
as the price of mobile data drops, the total number of mobile broadband subscriptions increase.
From 2012 to 201834, prepaid subscriptions comprised, on average, 79.4% of all mobile
broadband subscriptions. Prepaid subscriptions are slowly declining, making up 72.7% of all
mobile broadband subscriptions in 201835. Postpaid plans are generally better value than prepaid
plans, but usually require a payment commitment and come at higher prices.
34 2019 data were not available at the time of writing.
35 Malaysian Communications and Multimedia Commission (2016, 2019)
KRI Discussion Paper | Digital Inclusion: Assessing meaningful internet connectivity in Malaysia 16Figure 7. Fixed broadband prices and subscription rates, 2012-2019
RM 160 20 %
18 %
RM 140
16 %
RM 120
14 %
RM 100
12 %
RM 80 10 %
8%
RM 60
6%
RM 40
4%
RM 20
2%
RM 0 0%
2012 2013 2014 2015 2016 2017 2018 2019
Price Subscription Rate
Source: Author’s calculations based on web archive and MCMC data
Figure 7 shows the monthly price of a fixed broadband subscription with unlimited data from
2012 to 2019. Fixed broadband prices do not appear to have affected subscription rates very
much, even when the price of the cheapest unlimited data subscription dropped by about 40%
from 2016 to 2019. This decrease in price was partly attributable to the implementation of the
Minimum Standard on Access Prices (MSAP). The MSAP regulates the price of wholesale
broadband prices, effectively driving down the price of retail broadband.
Reports indicate that, as a result of the MSAP’s implementation, “demand for fixed residential and
commercial broadband services rose by 18 to 22 percent”36 from August 2018 to August 2019
and that “the number of fixed broadband subscription[s] with the uploading speed of more than
100 Mbps rose eight-fold to 1.2 million subscribers in 2018”37. However, the upgrade in quality
of service at lower prices does not necessarily correspond to an increase in the number of new
fixed broadband subscribers. As seen in Figure 7, the total number of fixed broadband subscribers
increased by approximately 10.2% from 2018 to 2019.
Relative pricing: is internet access affordable in Malaysia?
In order to close the affordability gap, it is necessary but not sufficient for absolute data pricing
to decrease over time. Internet access could remain at a relatively higher cost for low income
groups, hence the need to assess not just price, but price relative to income.
36 Bernama (2019)
37 Ibid.
KRI Discussion Paper | Digital Inclusion: Assessing meaningful internet connectivity in Malaysia 17In addition to its proposed standards for meaningful connectivity, the A4AI also uses a “1 for 2”
measure to access affordability: “Affordable internet is where 1GB of mobile broadband data is
priced at 2% or less of average monthly income”38. This measure was adopted by the UN’s
Broadband Commission for Sustainable Development in 2018 as part of its goal to close the global
digital divide.
To assess whether broadband prices in Malaysia meet this affordability threshold, a variation of
the “1 for 2” measure was applied to the cheapest mobile data plans and to the cheapest unlimited
data fixed broadband plans available from 2012 to 2019. Median individual monthly income was
estimated and used for the calculation instead of gross national income per capita.
Using this benchmark, Malaysia performs well in terms of mobile broadband affordability. In
2019, the price per GB of data for both prepaid and postpaid mobile broadband is less than 0.3%
of every state’s median individual monthly income with prepaid data being slightly more
expensive than postpaid data, as shown in table 5. In Kelantan, where a mobile data plan is the
most expensive, relative to the rest of the country, 1GB of prepaid mobile data costs 0.25% of the
state’s median individual monthly income. This is well below the A4AI’s 2% affordability
threshold and indicates that mobile data in Malaysia is generally very affordable.
Fixed broadband data does not appear to be as affordable as mobile broadband data. Table 5
shows data pricing as a percentage of each state’s median individual monthly income in 2019.
Table 5. Data pricing as a percentage of median monthly individual income, 2019
State Prepaid mobile Postpaid mobile Fixed broadband Fixed broadband
(per GB) (per GB) (per GB) (unlimited data)
WP Kuala Lumpur 0.09 % 0.06 % 0.08 % 1.52 %
WP Putrajaya 0.09 0.06 0.09 1.60
Selangor 0.11 0.07 0.10 1.95
WP Labuan 0.13 0.09 0.13 2.38
Johor 0.14 0.09 0.13 2.49
Pulau Pinang 0.15 0.10 0.14 2.60
Melaka 0.15 0.11 0.14 2.65
Terengganu 0.16 0.12 0.15 2.89
Negeri Sembilan 0.18 0.13 0.17 3.20
Perlis 0.20 0.13 0.19 3.49
Sarawak 0.20 0.13 0.19 3.53
Pahang 0.20 0.13 0.19 3.61
Kedah 0.21 0.14 0.20 3.70
Perak 0.21 0.14 0.20 3.75
Sabah 0.21 0.14 0.20 3.78
Kelantan 0.25 0.17 0.24 4.50
Source: Author’s calculations based on web archive data and HIS 2019
38 Alliance for Affordable Internet (2019)
KRI Discussion Paper | Digital Inclusion: Assessing meaningful internet connectivity in Malaysia 18At first glance, it seems that fixed broadband is only ‘affordable’ at the 2% threshold in Kuala Lumpur, Putrajaya, and Selangor. This analysis suggests a plausible explanation for why an individual might not want to subscribe to fixed broadband especially if they are already paying for a mobile broadband subscription. However, this interpretation of the data for fixed broadband pricing is not strictly comparable to mobile data pricing for two reasons. First, this is a variation of the affordability measure that does not consider the price per GB of data, instead calculating the price of access to unlimited data. Second, fixed broadband access is accessible in the household by more than one person, but the price is calculated for an individual subscriber. Thus, if multiple household members use large quantities of data, it is likely that the price per GB of fixed broadband data would be lower than the price per GB of mobile broadband data. Assuming that the average internet user uses approximately 9 GB of data per month at home, and the average Malaysian household comprises four people, at least two of whom use that much data, the estimated price per GB of fixed broadband data does become comparable to the price of prepaid mobile data, as shown in Table 539. Nonetheless, as mobile services are the preferred means of internet access in Malaysia, take-up of fixed broadband for supplementary internet access remains low. This analysis implies that data affordability is not the barrier to getting people connected, as mobile data plans are extremely affordable. However, internet users solely on mobile plans may not be able to take advantage of the benefits of fixed broadband connectivity unless they are able to pay for two broadband subscriptions. 39 See Appendix: data pricing calculations for further details on this estimate. KRI Discussion Paper | Digital Inclusion: Assessing meaningful internet connectivity in Malaysia 19
Assessing Application
  The third of the three aspects of the digital divide explored in this paper is application, measured
  using indicators of five of the top ten online activities in Malaysia – communicating by text, visiting
  social networking platforms, video streaming, online banking, and online shopping.
  The following analyses use selected data to gain insight into how Malaysians use the internet.
  Unless specifically stated, these data are not nationally representative, and should not be used to
  generalize across the Malaysian population. They simply indicate trends and the distribution of
  online activities for subsets of internet users in Malaysia.

  What are Malaysians doing online?

  Figure 8 shows the ten most popular online activities among internet users in Malaysia in 2018,
  sorted by the proportion of internet users who report engaging in such activities. Communicating
  by text ranked first, followed by visiting social networking platforms. Streaming videos online
  was the fourth most popular online activity, with online banking and online shopping in ninth and
  tenth place respectively.
  Figure 8. Online activities, 2018

                             Communicate by text                                                       96.5

                  Visit social networking platform                                              85.6

                                To get information                                              85.5

              Watch or download video/online TV                                          77.6

                                     Work related                             61.9

                     Communicate by voice/video                              60.6

                                             Study                           60.2

                          Read online publication                      56.3

            Online banking and financial activities                   54.2

                         Online shopping/booking                      53.3

                                                      0%   20    40                 60          80            100
  Source: MCMC Internet Users Survey 2018

KRI Discussion Paper | Digital Inclusion: Assessing meaningful internet connectivity in Malaysia 20
Communication, social networks, and video streaming
Figure 9. Unifi Mobile data usage for top four apps, by state, 2019
Selangor
Johor Youtube
WP Kuala Lumpur Instagram
Sabah
Facebook
Sarawak
Perak Whatsapp
Pulau Pinang
Pahang
Kedah
Kelantan
Terengganu
Negeri Sembilan
Melaka
WP Putrajaya
Perlis
WP Labuan
0% 10% 20% 30% 40% 50% 60% 70% 80% 90% 100%
Source: Author’s calculations based on TM Berhad data
Note: Share of data usage is limited to these four apps and does not represent total mobile data usage.
In 2019, mobile internet users in Malaysia used approximately 14 GB of data each month40. Figure
9 shows the share of internet data used by four of the most popular data-intensive mobile apps
in 2019. These four apps – YouTube, Facebook, Instagram, and Whatsapp – rank among the top
ten mobile apps, in terms of data volume, used by unifi Mobile users in 2019.
These data are in line with the 2018 MCMC survey findings as three of these four apps are the
preferred apps used for the two most popular online activities of 2018. Whatsapp was the most
popular text communication app, being used by 98.1% of internet users who used such apps.
Facebook and Instagram were the two most popular social networking apps, used by,
respectively, 97.3% and 57.0% of social network users.
The fourth most popular online activity, video streaming, generated the most amount of data,
which is expected as videos are data-intensive. Across all states, YouTube generated the biggest
share of data volume, averaging 50% of data used by these four apps. While there are other apps
and platforms used for video streaming, such as Astro Go, iFlix, and Netflix, YouTube was the most
data-intensive app among unifi Mobile users.
Facebook was the most popular social networking platform among internet users in 2018, but in
2019 Instagram generated more data volume than Facebook among unifi Mobile users. This may
not indicate Instagram’s increased popularity among users, but simply be due to the Instagram’s
content being more data-intensive than Facebook’s content.
Although it is the most commonly used app for the most common online activity (communication
by text), Whatsapp data made up the smallest proportion of data traffic among the four apps. This
40 This approximation is based on numbers in the Axiata, Digi, and Maxis 2019 annual reports.
KRI Discussion Paper | Digital Inclusion: Assessing meaningful internet connectivity in Malaysia 21is to be expected because, photo and video sharing notwithstanding, the majority of Whatsapp
exchanges occur through text and voice, which have a smaller data footprint than videos.
While the data sample used in this analysis is not nationally representative, there is no reason to
expect internet use behaviour to differ signficantly across service providers. It is reasonable to
assume that the data volume would be proportionally similar across service providers. This
implies that the lion’s share of internet data – and digital content – in Malaysia is being driven by
Google and Facebook, which owns Instagram and Whatsapp, and all together make up four of the
most data-intensive apps in the country.
Online banking
Online banking and financial activities comprised the ninth most popular online activity in 2018.
Figure 10 shows the indexed growth trends of bank accounts, active online accounts41, and online
financial transactions from 2011 to 2019. Figure 11 shows active online accounts as a percentage
of total number of bank accounts from 2011 to 2019. The growth rate of online accounts, which
increased starting in 2015, can be expected to continue or increase given the efforts made by Bank
Negara Malaysia (BNM) to move Malaysia towards adopting electronic payments and becoming
a cashless society.
Figure 10. Growth trends of bank accounts, online Figure 11. Online accounts as a percentage of total
accounts, and online transactions, 2011–2019 bank accounts, 2011–2019
(2011 = 1)
10 50 %
Bank Acc
9 45 %
Online Bank Acc
8 40 %
Online Transaction
7 35 %
6 30 %
5 25 %
4 20 %
3 15 %
2 10 %
1 5%
0 0%
2011 2013 2015 2017 2019 2011 2013 2015 2017 2019
Source: Author’s calculations based on Bank Negara Malaysia data
The number of online transactions per month has increased almost nine-fold over the last nine
years while the number of online accounts have increased five-fold. Online accounts remain less
than half the total number of bank accounts in 2019, indicating that there is still room for growth
41 Active online accounts are defined as Internet/mobile banking subscriptions with at least one online
transaction per month.
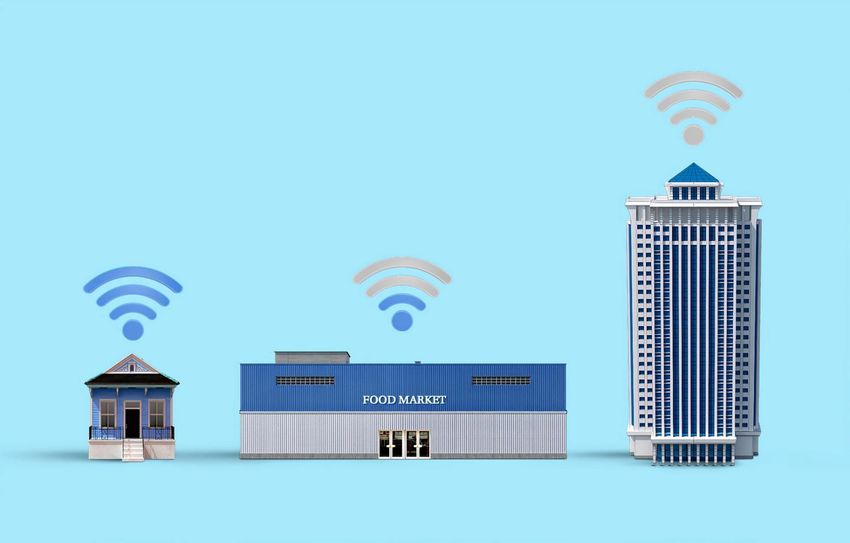
KRI Discussion Paper | Digital Inclusion: Assessing meaningful internet connectivity in Malaysia 22in digital financial services. The Covid-19 pandemic is likely accelerating the transition to cashless systems. Not only do electronic payment systems provide cost savings and improve efficiency, but they are also a means of extending financial services to unbanked communities. In addition to digital banking services provided by traditional banks, BNM has issued licenses to 47 non-bank e-money issuers to provide electronic payment systems, including e-wallets such as Boost, GrabPay, and TouchNGo.42 Widespread take-up of digital financial services at all levels of society is important in facilitating the transition to a cashless society. Implementing BNM’s Interoperable Credit Transfer Framework (ICTF) would allow cross- platform transactions from bank accounts to non-bank e-wallet accounts. In a market with multiple e-wallets, such interoperability would improve efficiency and convenience by allowing an e-wallet user to seamlessly pay and receive funds from users of other participating e-wallets. Not only would this facilitate personal and commercial transactions, it could also facilitate the disbursal of social assistance and social protections, including the PRIHATIN economic stimulus package (PRIHATIN) funds, to financially under-served populations in rural and remote areas. Online shopping Online shopping was the tenth most popular online activity in 2018 and is likely to rise in the rankings as a result of the pandemic. Figure 12 shows the distribution by state of the number of Pos Laju e-commerce deliveries per thousand people in 2018 and the median monthly household income in 2016 relative to their respective national averages, which are scaled to zero. This means that Selangor’s median household income in 2016 was approximately RM2000 more than the national average median household income and the number of e-commerce deliveries per thousand people in Selangor in 2018 was approximately 600 packages more than the national average of deliveries per thousand people. A pattern emerges between household income and online shopping, where states with higher median household incomes receive more e-commerce deliveries per thousand people, Negeri Sembilan being an exception to the rule. It should be noted that this chart represents e-commerce deliveries fulfilled by one specific courier whose market share may not be consistent across states. Nonetheless the data reveal how income inequalities and digital inequalities are linked. These economic and digital inequalities can have public health consequences. Digital inequality scholars point out that those on the privileged side of the digital divide can work from home, stay in touch with friends and family online, and have their groceries, meals, and household supplies ordered online and delivered. They are better equipped to remain sheltered and connected, thus lowering their exposure and risk to the coronavirus43. Nor are health concerns related solely to the coronavirus. Socially isolated individuals with limited or no internet connectivity during quarantines or movement control orders may face mental health challenges such as anxiety or loneliness and may not be able to get the regular healthcare they need without access to telemedicine. 42 Data on the take-up rates and geographic distribution of these electronic payment systems were not available at the time of writing. 43 Robinson et al. (2020) KRI Discussion Paper | Digital Inclusion: Assessing meaningful internet connectivity in Malaysia 23
Figure 12. Pos Laju e-commerce deliveries per thousand people, by state, 2018

   WP Kuala Lumpur
           Selangor
    Negeri Sembilan
              Johor
            Melaka
       Pulau Pinang
           Sarawak
            Pahang
        Terengganu
              Perak
              Perlis
             Kedah
             Sabah
           Kelantan

                  -3000        -2000        -1000        0         1000     2000      3000       4000

                          Volume Per '000           Median HH Income         National Averages

  Source: Author’s calculations based on Pos Malaysia data and HIS 2016

KRI Discussion Paper | Digital Inclusion: Assessing meaningful internet connectivity in Malaysia 24
Further research and policy considerations
Three aspects of the digital divide in Malaysia have been examined in this paper: internet
penetration rates (access), data pricing (affordability), and internet use (application).
Generally speaking, as at 2019, Malaysia is a highly digitally networked nation, with 90% of
households using the internet, mostly through mobile broadband plans on smartphones. Internet
usage trends show the digital generation gap closing, but the digital gender gap widening.
Mobile data plans are affordable and popular, with national mobile broadband subscription rates
exceeding 130% while national fixed broadband subscription rates lag behind at 9.0%. However,
internet users solely on mobile plans may not be able to take advantage of the benefits of fixed
broadband connectivity unless they are able to pay for two broadband subscriptions. Despite data
affordability, there remains a positive relationship between median household income and both
fixed and mobile broadband subscription rates.
The most popular online activities among internet users in Malaysia are still oriented around
communication, socialising, and media consumption, but economic activities rank highly as well,
with approximately one in two internet users engaging in work-related activities, banking, and
shopping online.
What then of the story of Veveonah Mosibin that opened this paper? First and foremost, her story
demonstrates that there remains a need for improved network coverage and quality of service,
important supply-side considerations that are outside the scope of this paper.
Her story also underlines why the digital divide is a pressing policy issue that needs to be
considered from a demand-side perspective. As discussed earlier, improving digital access,
affordability, and literacy could lead to gains in educational attainment, economic opportunity,
and health literacy, all of which are important as Malaysia recovers from the Covid-19 pandemic
and continues its development and growth, including its efforts towards digital inclusion.
What is digital inclusion?
Digital inclusion is a broad policy-driven approach towards ensuring that “all individuals and
communities, including the most disadvantaged, have access to and use of Information and
Communication Technologies (ICTs). This includes 5 elements:
1) affordable, robust broadband internet service;
2) internet-enabled devices that meet the needs of the user;
3) access to digital literacy training;
4) quality technical support; and
5) applications and online content designed to enable and encourage self-sufficiency,
participation and collaboration.
Digital inclusion must evolve as technology advances. Digital inclusion requires intentional
strategies and investments to reduce and eliminate historical, institutional and structural
barriers to access and use technology”44.
44 National Digital Inclusion Alliance (n.d.)
KRI Discussion Paper | Digital Inclusion: Assessing meaningful internet connectivity in Malaysia 25Digital inclusion is about more than closing the digital divide. Building more infrastructure, improving network performance, and developing devices and apps that are easier to use and more secure are important technical solutions to the problem of the digital divide. But digital inclusion also requires social solutions, including addressing social inequality, rethinking social norms and behaviours, and thinking proactively about the societal implications of digitalization, including ecuation, healthcare, and social cohesion. Providing affordable digital access is just the first step in the digital transformation of a society. Researchers and policymakers would do well to consider the societal implications of an increasingly digital population before jumping ahead to automation, artificial intelligence, and 5G. Digital literacy, data privacy, cybersafety, and surveillance are just some of the issues that need to be addressed as part of the nation’s digital inclusion efforts. The findings of this discussion paper invite further investigation on the uses, benefits, and risks of digital technologies in a networked, data-driven society. The following topics are presented for both research and policy consideration: 1. Internet access as a public utility Internet access is important for more than just economic outcomes, and is key to social development. As described earlier, the UN has declared internet access a human right and several countries have made it a legal requirement that all their citizens have access to the internet. This policy implies that governments should take the lead on the funding and provision of infrastructure in non-profitable areas, especially rural areas deemed unprofitable to private service providers. In Malaysia, this is managed using the Universal Service Provision (USP) fund under Section 204 of the Communications and Multimedia Act (CMA) 1998. Telecommunications licensees whose annual revenue exceeds RM2 million contribute 6% of their weighted net revenue to the USP fund. This fund is currently the central source of funding for the NFCP but, should this prove insufficient to ensure universal coverage of populated areas, additional funds should be allocated for the provision of internet infrastructure. The public sector should be cautious of entering into public-private partnerships where private companies take the lead on both funding and service provision. Facebook’s Free Basics programme was intended to bring free internet access to rural areas in India by allowing users to access a limited set of websites and apps. India’s telecommunications regulators rejected this plan because it violated net neutrality, meaning that it privileged some services (including Facebook) instead of allowing equal access to all online content45. 2. Measurement of meaningful metrics As described earlier, the A4AI has proposed a new standard on meaningful connectivity, which includes four dimensions: enough speed, an appropriate device, enough data, and daily access. The organisation has proposed a method of applying this standard and has tested it in Colombia, Ghana, and Indonesia46. The adoption of these metrics to complement internet penetration rates 45 Bhatia (2016) 46 Alliance for Affordable Internet (2020) KRI Discussion Paper | Digital Inclusion: Assessing meaningful internet connectivity in Malaysia 26
You can also read