www.ssoar.info - SSOAR: Home
←
→
Page content transcription
If your browser does not render page correctly, please read the page content below
www.ssoar.info

   COVID-19 and Digital Transformation: Developing
   an Open Experimental Testbed for Sustainable
   and Innovative Environments (ETSIE) using Fuzzy
   Cognitive Maps
   Höhl, Wolfgang

   Preprint / Preprint
   Arbeitspapier / working paper

Empfohlene Zitierung / Suggested Citation:
Höhl, W. (2021). COVID-19 and Digital Transformation: Developing an Open Experimental Testbed for Sustainable
and Innovative Environments (ETSIE) using Fuzzy Cognitive Maps.. https://nbn-resolving.org/urn:nbn:de:0168-
ssoar-71259-0

Nutzungsbedingungen:                                           Terms of use:
Dieser Text wird unter einer CC BY-NC-SA Lizenz                This document is made available under a CC BY-NC-SA Licence
(Namensnennung-Nicht-kommerziell-Weitergebe unter gleichen     (Attribution-NonCommercial-ShareAlike). For more Information
Bedingungen) zur Verfügung gestellt. Nähere Auskünfte zu den   see:
CC-Lizenzen finden Sie hier:                                   https://creativecommons.org/licenses/by-nc-sa/4.0
https://creativecommons.org/licenses/by-nc-sa/4.0/deed.de
COVID-19 and Digital Transformation - Developing
an Open Experimental Testbed for Sustainable and
Innovative Environments (ETSIE) using Fuzzy
Cognitive Maps
1st Wolfgang Höhl
Department of Informatics
Technical University of Munich (TUM)
arXiv:2101.07509v2 [cs.CY] 20 Jan 2021
Munich, Germany
wolfgang.hoehl@tum.de
Abstract—This paper sketches a new approach using Fuzzy Affairs, Dr. Stefanie Hubig, also expects a boost for digital
Cognitive Maps (FCMs) to operably map and simulate digital transformation in schools [3]. But there are also critical voices.
transformation in architecture and urban planning. Today these In a petition to the German ministers of education, the Munich
processes are poorly understood. Many current studies on digital
transformation are only treating questions of economic efficiency. teacher Tina Uthoff calls for ”an end to distance learning” [4].
Sustainability and social impact only play a minor role. Decisive Not all families are able to provide the same level of care and
definitions, concepts and terms stay unclear. Therefore this are under great pressure. But there are also other interesting
paper develops an open experimental testbed for sustainable solutions. A Munich wholesale market for gastronomy and
and innovative environments (ETSIE) for three different digital retail now supplies food to senior citizens and social food
transformation scenarios using FCMs. A traditional growth-
oriented scenario, a COVID-19 scenario and an innovative and banks with the help of taxi drivers. Logistics software provides
sustainable COVID-19 scenario are modeled and tested. All three the optimized routes for the taxi drivers. The remarkable and
scenarios have the same number of components, connections and decisive factor here is not only using innovative technologies
the same driver components. Only the initial state vectors are and an innovative idea. Much more it is a specific way to think
different and the internal correlations are weighted differently. about solutions, a special ”thought style”, a guiding mission
This allows for comparing all three scenarios on an equal basis.
The mental modeler software is used (Gray et al. 2013). This statement and a clear direction. An effective push always needs
paper presents one of the first applications of FCMs in the context a clear direction. The whole process of digital transformation
of digital transformation. It is shown, that the traditional growth- today is very poorly understood. Therefore this paper sketches
oriented scenario is structurally very similar to the current a new approach using Fuzzy Cognitive Maps (FCMs) to oper-
COVID-19 scenario. The current pandemic is able to accelerate ably map and simulate the process of digital transformation
digital transformation to a certain extent. But the pandemic
does not guarantee for a distinct sustainable and innovative in architecture and urban planning. Fuzzy Cognitive Maps
future development. Only by changing the initial state vectors (FCMs) belong to the so-called soft computing techniques,
and the weights of the connections an innovative and sustainable such as fuzzy logic, neural network theory, genetic algo-
turnaround in a third scenario becomes possible. rithms and probabilistic reasoning. Zadeh [5], [6] defines soft
Index Terms—soft computing; fuzzy cognitive maps; digital computing as an efficient technique that incorporates human
transformation; COVID-19; decision making; sustainability; in-
tegrated world system modeling knowledge effectively, deals with imprecision and uncertainty
and learns to adapt to unknown or changing environments
for better performance. Bonissone [7] and Jain [8] mention
I. I NTRODUCTION
that soft computing has been successfully applied in many
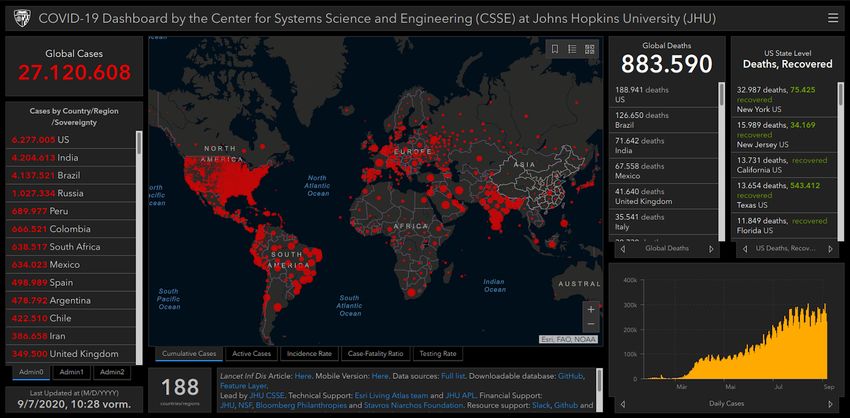
You probably all know this interactive graphic very well. scientific areas such as in engineering, medicine, information
Figure 1. shows a real-time visualization of the worldwide systems, business, political and social sciences. FCMs are
spread of the corona virus by the Johns Hopkins University in flexible tools that have been applied in different contexts
Baltimore [1]. This interactive map was created with ArcGIS [9] including environmental assessment [10]–[12], engineering
Online. As an architect and planner you probably know similar and technological management [13] and energy [14]. Papa-
GIS software that is used in comparable cases. This graphic georgiou and Groumpos [15] especially consider FCMs to be
is a good example for emerging technologies in the current capable to deal with situations where the human reasoning
digital transformation. The current pandemic is accelerating process includes uncertain descriptions. FCMs are usually
digital transformation. This is not only the opinion of German used for modelling specialist knowledge. For data gathering
Federal Minister Andreas Scheuer [2]. The President of the and model building expert interviews and expert opinions
German Conference of Ministers of Education and Cultural are used. Also the delphi method or similar methods can be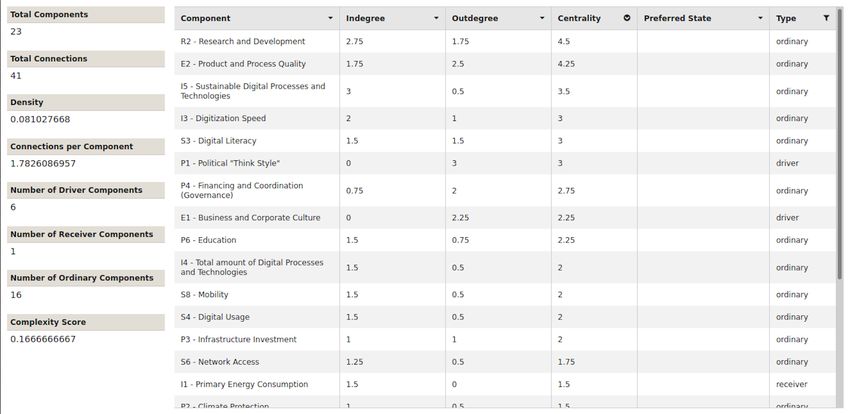
Fig. 1. Coronavirus COVID-19 Global Cases by the Center for Systems Science and Engineering (CSSE) at Johns Hopkins University (JHU)

applied in this initial stage. Secondly FCMs include important           added open experimental testbed for sustainable and innovative
modeling means for describing particular domains showing                 environments (ETSIE) is developed. Three different digital
the concepts (variables) and the relationships (connections)             transformation scenarios are designed. A traditional growth-
between them. For modeling and simulation usually special-               oriented scenario, a COVID-19 scenario and an innovative
ized FCM software is used. FCMs are described as a well-                 and sustainable COVID-19 scenario are modeled and tested.
established artificial intelligence technique that incorporates          All three scenarios have the same number of components,
ideas from artificial neural networks and fuzzy logic. Thus              connections and the same driver components. Only the initial
they are an attractive modeling approach that encompasses                state vectors are different and the internal correlations are
advantageous features. On FCMs the following weaknesses                  weighted differently. This allows for comparing all three
can be detected: the main deficiencies of FCMs are the critical          scenarios on an equal basis. The mental modeler software is
dependence on the initial expert’s beliefs, the recalculation of         used [16]. This paper develops the value added ETSIE model
the weights corresponding to each concept every time a new               as a general framework using FCMs, provides a discussion
strategy is adopted and the potential convergence to undesired           integrating an overview of literature and highlights directions
equilibrium states. In order to update the initial knowledge             for future inquiry, but it is not expected to collect extensive
of human experts and to combine the human experts’ struc-                empirical data. It is shown, that the traditional growth-oriented
tural knowledge with training from data, specific automated              scenario is structurally very similar to the current COVID-19
learning methodologies for FCMs my be applied. This paper                scenario. The current pandemic is able to accelerate digital
presents one of the first applications of FCMs in the context of         transformation to a certain extent. But the pandemic does
digital transformation. In the current discussion, a fundamental         not guarantee for a distinct sustainable and innovative future
clarification of the terms and their correlations in digital trans-      development. Only by changing the initial state vectors and
formation seems to make sense. Thus this paper provides an               the weights of the connections an innovative and sustainable
overview of literature. In this fundamental discourse, fourteen          turnaround in a third scenario becomes possible.
up-to-date studies on digital transformation in architecture and
urban planning [17]–[30] and twelve studies from the fields
of computer science, philosophy of science and media ethics
have been searched for stakeholders, specific terms or concepts
and correlations in digital transformation [31]–[42]. Terms
are clarified, technologies and trends can be identified. The
specific ”thought styles” and paradigms of the stakeholders are
discovered. These elements are then operably mapped and rep-
resented in a suitable, integrated model using FCMs. A value
II. L ITERATURE R EVIEW                          B. Stakeholders of the Digital Transformation
   This chapter presents a fundamental discourse, fourteen up-        All industries are directly affected by digital transformation.
to-date studies on digital transformation in architecture and      The processes only differ in speed and intensity. Thierstein de-
urban planning [17]–[30] and twelve studies from the fields        scribes digital transformation as global and all-encompassing:
of computer science, philosophy of science and media ethics        ”Digital transformation permeates all ways of life ... [21].”
[31]–[42] have been searched for stakeholders, causes and          Goger et al. describe digital transformation as a cross-cutting
key drivers, technologies and trends in digital transformation.    issue that cuts across all areas of society [22]. The industries
Terms or concepts are clarified, technologies, trends and five     only have a different digitization speed. Roland Berger believe
indicators of sustainable development could be identified.         that the construction industry is less affected by the corona
Specific ”thought styles” and paradigms of the stakeholders        crisis, as are mechanical engineering and pharmaceutical and
are discovered.                                                    medical technology [23]. They see most other industries as
                                                                   being heavily affected, such as airlines, tourism and travel,
A. COVID-19 as an Accelerator of Digital Transformation?
                                                                   trade, financing, oil and gas, automotive and logistics. After
   According to Horx [17], Widmann [18], Detting [19] and          examining the aforementioned available literature [8-33] four
von der Gracht [20] there are two general characteristics          different stakeholders groups can be identified: (P) politics, (R)
of the corona crisis: on the one hand the novelty of the           research and development, (E) economy and (S) civil society
corona virus and on the other hand the relatively slow course      as shown in table I.
of the crisis compared to other natural disasters. Horx sees
the corona crisis as ” ... a general slowdown of our world                                          TABLE I
culture”, which affects both globalization and our forms of                                 G ROUPS OF STAKEHOLDERS
communication. In his opinion, this slowdown will continue                  Groups                   Description
after the crisis. ”If you take stock, this crisis is a general      P       Politics                 Cities, districts and communities, fed-
slowdown of our world culture. This applies to globalization                                         eral, state and local authorities
                                                                    R       Research and Develop-    Research institutions
and to our forms of communication. It is a slowdown that                    ment
will remain [17].” On the contrary for Widmann the corona           E       Economy                  Companies, architects and urban plan-
crisis is not a natural disaster in the conventional sense [18].                                     ners
According to all we know today, this pandemic is of natural         S       Civil Society            Population and employees
origin. However, pandemics distinguish between people and
material assets, and they always affect the socially weak most
severely. However, the boundaries to natural disaster remain       C. Causes and Drivers of the Digital Transformation
blurred. Detting outlines a possible more resilient and robust        A study by IE.F and Roland Berger defines following drivers
future for society between the polar risks of total interstate     for a successful digital transformation as shown in table II
and social isolation and the chance of a new sustainable and       [24]. These drivers can be easily assigned to the four different
glocal social-ecological market economy [19]. Depending on         stakeholders groups.
the duration of the crisis, von der Gracht sketches four polar
scenarios between very moderate and very drastic economic                                       TABLE II
and social consequences [20]. The strong isolation, social              G ROUPS OF STAKEHOLDERS AND ASSIGNED CAUSES AND DRIVERS
                                                                                ACCORDING TO IE.F AND ROLAND B ERGER [24]
conflicts and the virtualization of many areas of life face
a rapid recovery and a return to what he calls ”normal                      Groups                   Causes and Key Drivers
operations”. A positive outlook for a new and innovative social     P       Politics                 Sufficient funding and better political
scenario is unfortunately missing here. COVID-19 is novel                                            coordination (governance)
and cannot be fought with conventional means. Innovative                                             Extension of the digital infrastructure
ideas and technologies must be developed. Due to economic
interests, a certain time pressure arises, which pushes the                                          Avoidance of data monopolies and bet-
                                                                                                     ter data protection (data ethics)
research and development of new technologies. So COVID-             R       Research and Develop-    -
19 is an accelerator of digitalization and technological devel-             ment
opment, in the same sense as other natural disasters can be.        E       Economy                  A new business and corporate culture
                                                                    S       Civil Society            Greater digital literacy
Thus the corona crisis can be described as a natural disaster
in slow motion. Its relatively slow or time-stretched course
compared to other natural disasters allows for a coordinated,         Goger et al. mention following components as key drivers
reasonable and gradual technological response. The associated      of digital transformation in architecture and urban planning as
deceleration and slowing down of everyday life during the          shown in table III [22]:
first corona lockdown is certainly still well remembered by us        According to a study by the ”Münchner Kreis”, product and
all. The reduction of many growth-driven processes during the      process quality (79%) and qualified employees training (78%)
Corona crisis thus also led to a certain social and ecological     are currently considered the most important success factors
sustainability.                                                    in future industrial manufacturing [24]. Alain Thierstein also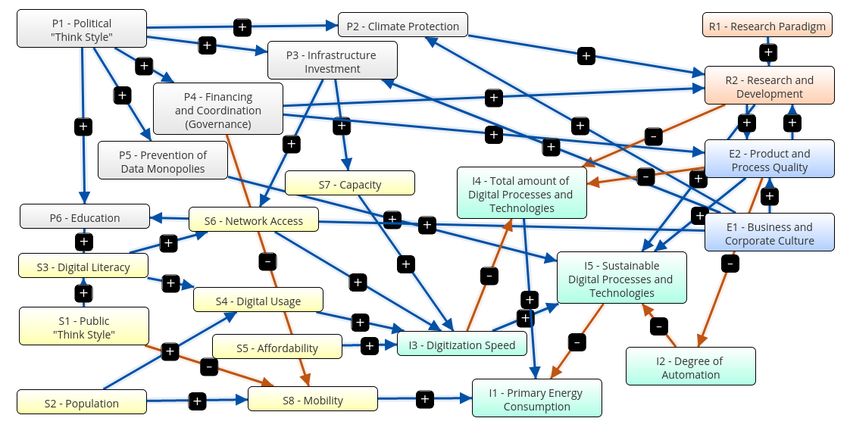
TABLE III                                     progress. Simplified surveys could be provided through drone
     G ROUPS OF STAKEHOLDERS AND ASSIGNED CAUSES AND DRIVERS               flights. Innovative manufacturing processes could support or
                   ACCORDING TO G OGER ET AL . [22]
                                                                           even replace conventional procedures. IoT and Big Data will
         Groups                  Causes and Key Drivers                    be deployed during building use for automatic building data
 P       Politics                Sustainability                            collection, automatic ventilation and building climate control.
 R       Research and Develop-   -
         ment
                                                                           During demolition, the building can serve as a raw material
 E       Economy                 Globalization                             store (urban mining). Through a digitally transparent process,
                                 Sustainability                            all quantities and materials can be known in advance. Katz
                                 Efficiency and process optimization
                                                                           et al. describe digitization speed as a composite factor of af-
 S       Civil Society           Urbanization
                                 Demographic change                        fordability, infrastructure investment, network access, capacity,
                                 Mobility                                  usage and human capital [25]. As digitization speed can not be
                                 Individualization of work and life mod-   assigned to one stakeholder only, a new category of indicators
                                 els
                                                                           for system behaviour is created. With the degree of automation
                                                                           and the digitization speed the authors name two important
                                                                           indicators for the social sustainability of digital transformation.
mentions the importance of the structure of creative and                   Table V shows the extended list of stakeholders and indicators.
productive processes. He emphasizes the technological com-
petence of the individual (digital literacy), which is necessary                                     TABLE V
to take responsibility, to evaluate situations and to acquire the           G ROUPS OF STAKEHOLDERS AND INDICATORS WITH ASSIGNED CAUSES
                                                                                      AND DRIVERS ACCORDING TO K ATZ ET AL . [25]
new digital environment [21]. Table IV shows the collected
causes and drivers from the these two references:                                 Groups                  Causes and Key Drivers
                                                                            P     Politics                Infrastructure investment
                          TABLE IV                                          R     Research and Develop-   -
  G ROUPS OF STAKEHOLDERS AND ASSIGNED CAUSES AND DRIVERS                         ment
 ACCORDING TO THE ”M ÜNCHNER K REIS ” [24] AND T HIERSTEIN [21]            E     Economy                 -
                                                                            S     Civil Society           Affordability
         Groups                  Causes and Key Drivers                                                   Network Access
 P       Politics                -                                                                        Capacity
 R       Research and Develop-   -                                                                        Digital Usage
         ment                                                                                             Human capital
 E       Economy                 Product and process quality                I     Indicators              Digitization speed
 S       Civil Society           Qualified employees training                                             Degree of Automation
                                 Digital literacy

                                                                              The ”vision of digital construction” has a high social
                                                                           relevance in addition to its economic relevance. Schüller devel-
D. Degree of Automation and Digitization Speed as System                   oped the term ”digital literacy” [27]. He also names it among
Indicators                                                                 the so-called success factors of the digital transformation.
   Roland Berger see digitization in the workplace and the                 The speed of digitization in the respective industries will
home office as a direct effect of increasing digital transforma-           depend on the digital literacy of those involved in the process
tion [23]. Thus Berger confirm the interconnections between                and the quality of products and services. Simondon warns
the use of digital technology, user behavior and mobility                  against such purely economically driven automation [28]. He
(e.g. home office, digital collaboration). Goger et al. estimate           describes automation by the well-known image of a fully
that there is a 59% probability of substituting construction               automatic and autonomous robot. Simondon sees in it only an
occupations with Industry 4.0. At least they call it ”degree of            abstract mythical object, without any relevance for a practical
automation” or ”probability of automation” and present their               and really innovative technological development. ”Automatism
”vision of digital construction” [22]. During the early phases             and its use in the form of the industrial organization called
of development, better variant studies for decision making                 automation has far more of an economic or social than a tech-
become possible through visualization and simulation, better               nical meaning [28].” In order to ensure a functioning human-
and significantly more transparent information exchange. Cen-              machine interaction, Simondon advocates ”open machines”
tral digital twins of the building and applications of BIM in              with a certain ”margin of uncertainty”. Developments such
integral planning are getting in the field of vision, as well              as artificial intelligence, algorithms for the individualization
as processes for automated quality assurance and compliance                and personalization of interfaces or even autonomous driving
with building standards, simplified tendering on a digital basis           could easily be assigned to this fully digitalized automation.
and fully automated reading of masses and quantities. Dur-                 According to Baumanns, the interdisciplinary collaboration
ing construction, improved logistics through RFID tracking                 across all phases of a building’s life cycle (design, construc-
with location allocation would be possible. Digital recording              tion, operation) also still offers great potential for digital
of delivery bills and material parameters and a complete                   transformation. This includes a central, digital building model
documentation would digitally supplement the construction                  and digital, interdisciplinary communication and coordination.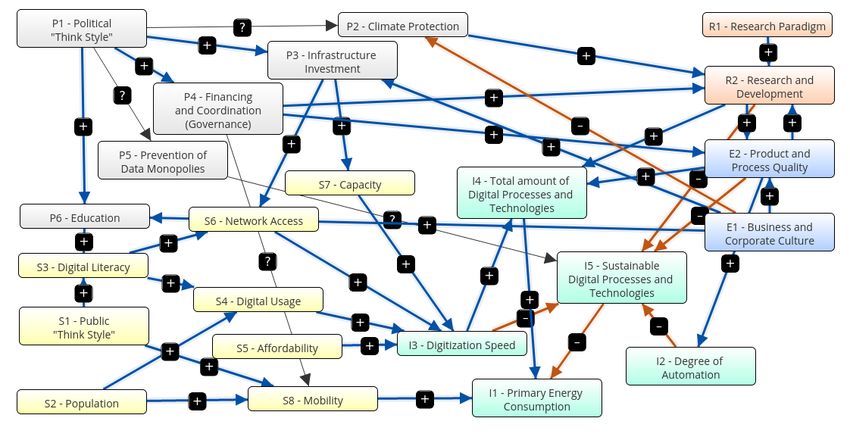
Baumanns defines the following megatrends [29] as shown                VII. To my opinion, the ”virtual project space” and ”cloud
in table VI.As growth drivers the authors describe residential         computing” can be described more as distinct technologies and
construction, infrastructure and transport. The general con-           less as a trend. Established in science, the term ”Collaborative
struction volume is currently benefiting from low loan and             Virtual Environments” (CVE) has long been used to describe
interest rates. As competitive advantages for companies he             these technical solutions. The same applies to BIM. I would
sees the areas of Smart Home, Smart Building and Building              only use the term trend in connection with an overarching sce-
Information Modeling (BIM). As current opportunities he                nario based on a specific thought style, mindset or paradigm.
mentions globalization, specialization and expansion of the
company’s own portfolio in the existing value chain and the                                       TABLE VII
increasing use of digital technology. The greatest potential he              G ROUPS OF STAKEHOLDERS AND INDICATORS WITH ASSIGNED
                                                                            TECHNOLOGIES AND TRENDS ACCORDING TO G OGER ET AL . [22],
assumes in the field of logistics, in the digital collection and                  D IGITAL ROADMAP AUSTRIA [30] AND BRZ [31]
analysis of data and in the automation of construction work.
He names five phases: Logistics, procurement, production,                      Groups                  Technologies and Trends
                                                                        P      Politics                Big Data
marketing/sales and after sales.                                        R      Research and Develop-   Artificial Intelligence (AI)
                                                                               ment
                           TABLE VI                                     E      Economy                 Open Innovation
 G ROUPS OF STAKEHOLDERS AND INDICATORS WITH ASSIGNED CAUSES                                           Intelligent energy networks (smart
            AND DRIVERS ACCORDING TO BAUMANNS [29]                                                     grids)
                                                                                                       Intelligent materials (4D)
       Groups                  Causes and Key Drivers                                                  New manufacturing processes (3D
 P     Politics                Sustainability                                                          printing)
                               Low interest rate policy                                                Extended Reality (xR)
 R     Research and Develop-   Digitization and Technology                                             5G mobile phone standard
       ment                                                                                            IoT and cloud computing
 E     Economy                 Globalization                                                           Building Information Modeling (BIM)
                               Smart Home / Smart Building                                             Blockchain Technology
                               Building Information Modeling (BIM)                                     Virtual Project Space
                               Specialization                           S      Civil Society           Mobility
                               Extension of the own portfolio (value                                   Social security
                               chain)                                                                  IT Security
 S     Civil Society           Urbanization                             I      Indicators              Primary Energy Consumption
                               Demographic change
 I     Indicators              -                                                                       Total amount of digital processes and
                                                                                                       technologies

                                                                                                       Sustainable digital processes and tech-
E. Technologies, Trends and Primary Energy Consumption                                                 nologies
   Analogous to Industry 4.0, Goger et al. coined the term
”Construction 4.0” [22]. The Digital Roadmap Austria identi-
fies ten technology areas with enormous development potential          F. Digitization, Digital Transformation, Innovation and Sus-
that could also be of significance for architecture and urban          tainability
planning [30]. A study by BRZ Deutschland GmbH. names                     F1. Digitization, Digital Transformation or Innovation?
the following six IT-trends in the construction industry [31].            Many authors mention digitization itself as a driver for
However, in these studies there is no distinction between con-         major changes in work processes. It would be much more
ventional and sustainable technologies. Some of the technolo-          accurate to name technological change through research and
gies mentioned, such as block chain technology, are currently          development as a driver of digitization. Thus research and
heavily criticized, because of their disproportionate energy           development appeared as a stakeholder on the scene. The
consumption. The sustainability of IoT is also under current           newly developed technology and the associated research and
discussion. The integrated IT and the lack of software updates         development (not digitization or digital transformation) are the
for intelligent household appliances could lead to a shorter           drivers. To a large extent new technological developments lead
lifetime of usual household appliances such as refrigerators.          to changes in work processes. Digital transformation can be
Moreover today there is no clear distinction and recommen-             better described as the systemic end result or as a significant
dation between sustainable technologies and non-sustainable            scenario in this macrosocietal transformation. Digitization and
technologies. Additionally there are currently no comparable           technology are also listed as trends in many studies. What
indicators of the systemic energy efficiency of the individual         is missing here is a precise distinction between digitization
technologies. This could be ensured by a technology-specific           (or digital transformation) as a cross-system scenario on the
ecological footprint. To take these factors into account, two          one hand and digital technology as a subordinate systemic
further indicators will be introduced to assess the sustainability     element resulting from research and development on the other.
of the overall system: primary energy consumption and the              Just as BIM, smart homes and smart buildings can be better
ratio of sustainable processes and technologies to the total           described as technologies rather than as trends. Digitization
amount of digital processes and technologies as shown in table         and digital transformation are not used as congruent terms in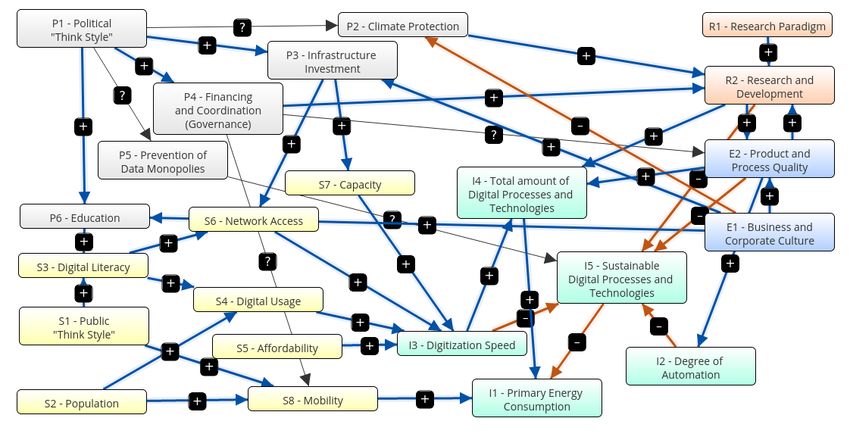
this paper. Digital transformation better desribes the whole       of thought styles, paradigms, ways of thinking or reasoning.
process. While digitization can usually be understood as           This group will be explained in more detail in the next
the ”conversion of analogue quantities into digital ones”.         section. Ian Hacking coined the term ”style of reasoning” in
But neither digitization nor digital transformation does not       connection with the continuous change in mission statements
necessarily mean innovation. The digitization of an existing       [32]. He essentially followed Alistair Crombie (1915-1996),
process does not necessarily have to be innovative per se.         who claimed that there are different scientific methods of
Purely economic and efficiency-oriented digitization is the        knowledge that have emerged in certain areas of human his-
adaptation of an existing process to modern technology.            tory. Ludwik Fleck developed the analogous concept of ”think-
However, this does not necessarily make the process new            ing styles” [33]. Rudolf S. Kuhn uses the term ”paradigm
and certainly not sustainable. Innovation always means             shift” to describe the change in basic conditions for theory
a previously unknown, new solution to a problem. The               formation in science, such as concept formation, methods
innovative idea is also fundamental to innovation, which then      of observation and technology used [34]. Nowadays, terms
leads to a new solution by recombining existing resources.         such as ”theory dynamics” and ”theory change” are often
At the beginning of an innovation there is always an idea          used to describe these phenomena. Luca Sciortino [35] also
and a new mindset, a new way of thinking about things.             mentions Michel Foucault’s ’episteme’ [36] and the ”research
The implementation into a suitable technological solution is       program” of Imre Lakatos [37]. All these authors thus describe
subordinated.                                                      phenomena in connection with change on the basis of changed
                                                                   mindsets and models, ways of thinking and paradigms. These
   F2. Sustainability                                              new perspectives lead to a new basis, enable new methods
   In the examined literature sustainability is often used as      and new technologies and, last but not least, lead to real
an ambiguous term or concept. For example Baumanns cites           innovation. Mission statements usually describe a desired goal
sustainability itself as a current megatrend [29]. Thus sus-       or an ideal state. They are at home in many areas. They are
tainability appears in a completely different context than in      often used in corporate culture. A mission statement serves as
IE.F and Roland Berger [24] and Goger et al. [22]. There           orientation and motivation for the employees of a company,
sustainability is mentioned as a trend. In many studies sus-       possibly provides information about the product range and
tainability is seen as a way of thinking, a thought style or a     activities of a company, can provide a certain framework
paradigm. It can also be interpreted as a social factor, such as   for the public appearance of a company and even influences
a sustainable lifestyle. Or it can be interpreted as an economic   the market value of a company. Kühl distinguishes between
factor such as a new sustainable business and corporate            three sides of a company [38]: the so-called ”show side”,
culture. Sustainability is often mentioned in connection with an   the ”formal side” and the ”informal side”. The front side
economically efficiency-oriented process optimization. Many        shows the external image, the facade of the company. The
experts also expect sustainability to have positive effects on     so-called formal side forms the official set of rules for all
future energy and resource consumption. Last but not least it      employees. The informal side describes Kühl as the sum
could stand for either a sustainable research paradigm or a        of ”... ingrained practices and ways of thinking, deviations
sustainable political ”thought style”. The term sustainability     from official rules and from cultivated myths, dogmas and
can also be interpreted in a political sense as the amount of      fictions.” But there are also certain mindsets or paradigms
political actions aiming climate protection. Thus sustainability   for technical or social developments. They are often closely
itself cannot precisely be assigned to one stakeholders group      related to current research and development and formulate
only. The term finds correspondences in all four stakeholders      certain utopias in these fields. They are ideal models or wishful
groups as a ”thought style” or a specific way of thinking. So it   thinking about future possibilities of technology and society.
will reappear again as a political ”thought style”, a ”research    These models and utopias are often the initial impetus, also
paradigm”, a public ”thought style” and an ”economic business      for new research projects. Some of the guiding paradigms for
and corporate culture”. It also can be defined as another          digital transformation date back to the 1990s. With ”ubiquitous
seperate concept, such as political or economical actions for      computing” Mark Weiser described an omnipresent mobile use
climate protection. Sustainability also can be seen as a quality   of spatial information accessible to everyone, without visible
of the whole system behaviour, when we think of technologies       interfaces and end devices [39]. Neil Gross expected ”that in
and trends. So indicators such as primary energy consumption,      the future spontaneous computer networks will emerge and
the degree of automation, digitization speed and the ratio of      form a ’giant digital creature’ [40]. He thus describes the
sustainable processes and technologies to the total amount of      current Internet of Things (IoT). ”Pervasive Computing” and
digital processes and technologies can be seen strongly related    ”Ambient Intelligence” also describe related topics today, but
to the main concept of sustainability as well.                     with different orientations [41]. Ambient Intelligence deals
                                                                   with intelligent systems embedded in the environment that
G. Thought Styles and Paradigms as Individual Mindsets for         support the user in his activities. In contrast to purely commer-
Digital Transformation                                             cial considerations, however, the focus here is often on social
   In the aforementioned sections another group of causes and      and procedural issues. Smart Cities” and ”Smart Homes” also
drivers of the digital transformation emerges. It is the group     belong to these thematic fields. The most important features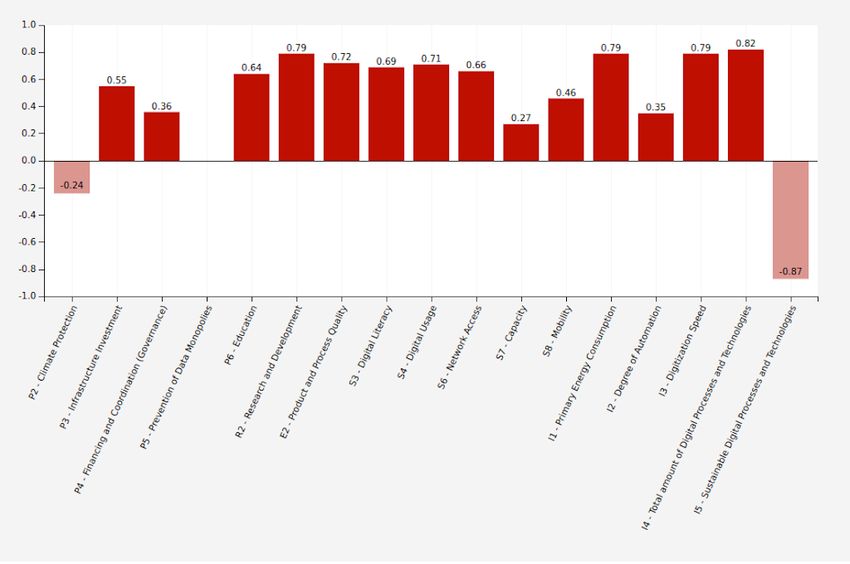
of ubiquitous computing are the disappearance of hardware           of ”globalization”, ”specialization”, ”extension of the own
and user interfaces, the adaptivity and self-organization of        portfolio”, ”product and process quality” and ”efficiency and
the digital system, automatic context perception, ubiquitous        process optimization” such as in tables III, IV and VI. Digital
availability of information, and global and local connectivity.     Usage (S4), affordability (S5), network access (S6), capacity
I fondly remember a photo of Archigram from the sixties. It         (S7) were adopted directly from table V. Mobility (S8) was
shows a telephone in a lying tree trunk, somewhere out in           also listed as in tables III and VII.
nature. Technical and social utopias are always intertwined.
Social models are not always easy to grasp. Tanner describes                                      TABLE VIII
                                                                                        C LARIFIED CONCEPTS AND TERMS
among other things the concept of ”common sense” [42]. He
understands this to mean social rules and behavior, identity-              Groups                         Concepts
forming myths and stories, the knowledge of things that ”one”        P     Politics                 P1    Political ”Thought Style”
                                                                                                    P2    Climate Protection
does or does not do. ”Common sense is the ability to think                                          P3    Infrastructure Investment
logically without using specialized or advanced knowledge                                           P4    Financing and Coordination
[42].” The digital transformation in a pluralistic society there-                                         (Governance)
                                                                                                    P5    Prevention of Data Monopolies
fore does not only know one single mindset or paradigm.                                                   (Data Ethics)
Companies have their own mission statements, research and                                           P6    Education
development work according to their own ways of thinking and         R     Research and Develop-    R1    Research Paradigm
                                                                           ment
standards, and the population pursues its own individualized                                        R2    Research and Development
life and work ideas, as sometimes, among other things, a             E     Economy                  E1    Business and Corporate Culture
sustainable lifestyle. Nevertheless, these mission statements                                       E2    Product and Process Quality
remain powerful drivers for our everyday life.                       S     Civil Society            S1    Public ”Thought Style”
                                                                                                    S2    Population
                                                                                                    S3    Digital Literacy
H. Clarifying terms, concepts and indicators                                                        S4    Digital Usage
   Table VIII summarizes all clarified concepts and terms                                           S5    Affordability
                                                                                                    S6    Network Access
from the former literature examination. We can state four                                           S7    Capacity
stakeholders (politics, research and development, economy                                           S8    Mobility
and civil society) such as mentioned in table I. Sustainability      I     Indicators               I1    Primary Energy Consumption
                                                                                                    I2    Degree of Automation
shows up in three different correlations such as in table VII.                                      I3    Digitization Speed
First it can be a ”thought style” for all four stakeholders                                         I4    Total amount of digital pro-
(P1, R1, E1, S1) (”a new business and corporate culture” in                                               cesses and technologies
                                                                                                    I5    Sustainable digital processes
table II, ”sustainability” and ”individualization of work and                                             and technologies
life models” in table III. Secondly it can include political
actions for climate protection (P2). Third sustainability can be
related to the indicators of primary energy consumption (I1)
and the ratio of sustainable processes and technologies (I5) to
the total amount of digital processes and technologies (I4) as
mentioned in table 7. These indicators can be completed by
the degree of automation (I2) and the digitization speed (I3)
as mentioned in table V. So we are able to define a group of
five indicators finally. The terms of infrastructure investment
(P3) (”extension of the digital infrastructure”), financing and
coordination (P4) (”governance”, ”low interest rate policy”)
and prevention of data monopolies (P5) (”data ethics” or
”avoidance of data monopolies and better data protection” or
”IT security”) were mentioned in tables II, V, VI and VII. The
terms of ”demographic change” and ”urbanization” as found
in tables III and VI can be expressed in population figures.
So both are summarized in the concept of population (S2).
Digital literacy (S3) and education (P6) were added as social
and political concepts, such as mentioned in table II (”greater
digital literacy”), table IV (”digital literacy” and ”qualified
employees training”) and table V (”human capital”). Research
and Development (R2) was introcuded to reflect the terms
of ”digitization and technology” and terms of technological
development and trends such as in tables VI and VII. Product
and process quality (E2) was inserted to reflect the terms
III. M ATERIALS AND M ETHODS                         abstract model we can derive an applicable or operable model,
                                                                   for example in a computer simulation. Now we could run an
A. Fuzzy Cognitive Maps (FCMs), Definition and Background
                                                                   iterative process to test the model and to generate certain sce-
   As mentioned in the introduction FCMs are usually used          narios. The output values can be validated against the source
to investigate complex systems. They consist of a network          system, errors and mistakes can be eliminated and we can
of concepts and weighted interconnections. The technique           start the process again from the beginning. From there we can
of FCMs is often deployed to reveal a dynamic system’s             start an optimization loop. Simulations usually are conducted
behaviour, describing how the system could evolve in time          within a large parameter space to simulate many possible
through causal relationships and for the evaluation of alterna-    situations. To optimize the target size, the input variables must
tives. Therefore this approach is considered useful in the con-    be varied. This can be done by try-and-error, but this takes a
text of scenario planning and decision making. For example         lot of time and effort. Therefore, in the last years, evolutionary
”Integrated World System Modelling” or an ”Integrated Global       optimization methods (e.g. data farming) have been developed
System Model” is particularly suitable for mapping complex         to reach the whole realm of a simulation’s test bed. These
processes using FCMs. The concept of Fuzzy Cognitive Maps          solutions usually are performed in iterative steps to find an
(FCMs) has been introduced by Bart Kosko in 1986 [43].             optimal solution. Usually this is done by High Performance
He suggested their use to those knowledge domains that             Computer (HPC) environments. The results can be depicted in
involve an high degree of uncertainty. He extended the work        scenarios. The procedure can be repeated until an optimized
of Axelrod, who found the technique of Fuzzy Cognitive             state is reached. Today, independent learning algorithms help
Maps (FCMs) representing a natural extension of cognitive          to optimize various system-internal parameters, such as the
maps by embedding to them the use of Fuzzy Logic [44].             weighting of correlations. Different learning paradigms and
He also introduced cognitive maps in the context of decision       software packages can be distinguished. Felix et al. [48] name
making for the representation of social scientific knowledge       seven software applications available today: FCM Modeler,
and decision making processes in the field of social and           FCM Designer, FCM Tool, JFCM, Mental Modeler, ISEMK
political systems. Mention has to be made to the fact that the     and FCM Expert. Because of the participatory, web-based
cognitive mapping approach to decision making uses elements        solution and because of the ease of use without programming
from other fields, such as psychology and graph theory.            knowledge, this paper uses the Mental Modeler software,
Since then, FCMs have proven to be a useful method for             developed by Gray et al. [16].
the systematic collection of knowledge and for the graphical
representation of causal relationships and are established in      B. Properties of FCMs
many ”hard” and ”soft” sciences. Caselles names several              •   Concepts or components: C1, C2, ... Cn are the system-
research groups that are currently working on global models              constituting variables;
to simulate the consequences of scenarios and intervention           •   State vector: A = (a1, a2, ... an) where ai is the initial
strategies in the world system [45]. As prominent examples               state and the value of the general term Ci. The values
he mentions the ”Regional Earth System” of the Earth System              assigned to the terms are usually in the range [0;1];
Science Interdisciplinary Centre at the University of Maryland,      •   Directed edges: they symbolize the causality between the
the ”Millennium Project” of the World Bank, the ”Integrated              terms C1, C2 and are represented as arrows or double
Global System Model” of MIT and the ”Australian Stocks                   arrows;
and Flows Framework (ASFF)”. Bottero et al. for example,             •   Adjacency matrix: E = {eij}, where eij is the weight (w)
successfully use FCMs to model urban resilience dynamics                 of the directed edge CiCj. The values assigned to each
and to support scenario planning and strategic decision making           relation are in the range [-1;1]. The value 0 means, that
[46]. The procedure follows the conventional method of a sim-            there is no causal relation between the terms Ci and Cj.
ulation. Cloud describes the usual professional development
of model-building and simulation proceeds in three stages            FCMs can be described by different kinds of representation:
[47]: Theoretical basis and monitoring (observation), problem      On the one hand by a graphical representation, the concepts
and solution attemts, criticism and elimination of possible        or components and the directed edges. On the other hand
errors and mistakes. In the first step you are confronted with     by a mathematical representation, which consists of a table
a kind of ”source system”. This system is real and can be          mentioning all state vectors in an adjacency matrix. Figure 2.
observed or monitored experimentally. Let us assume this is        shows a graphical representation of a Fuzzy Cognitive Map
the process of digital transformation in architecture and urban    (FCM). Table IX shows the corresponding adjacency matrix.
planning. For monitoring and data gathering usually expert
interviews, expert opinions or literature reviews are used. Also   C. Developing an Open Experimental Testbed for Sustainable
the delphi method or similar methods can be applied in this        and Innovative Environments (ETSIE) using Mental Modeler
initial stage. From there we can derive our input values. The        One of the great minds of simulation and statistics, George
second step is building an abstract model from that source         Edward Pelham Box used to say: ”All models are wrong,
system (idealization and abstraction). Usually only one specific   but some of them are useful.” [49] This paper presents one
aspect is modeled to clarify one specific question. From the       of the first applications of FCMs in the context of digital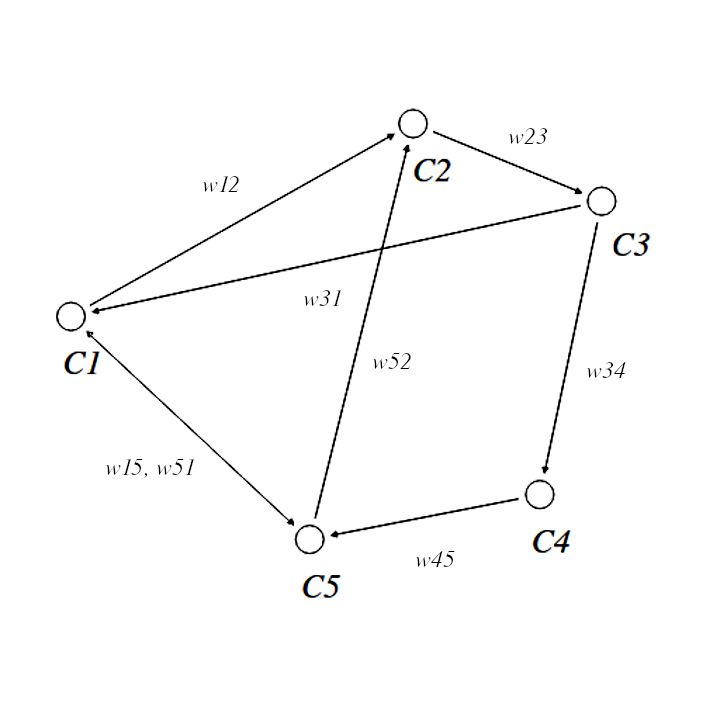
to collect extensive empirical data. The ETSIE model is
                                                                     developed in the spirit of Open Innovation. The model itself
                                                                     and all data are openly available to all interested people for
                                                                     review and further research. From the current literature review
                                                                     it can be observed that the process of digital transformation
                                                                     is often seen in a predominantely growth-oriented economic
                                                                     sense. During the current pandemic it can be observed as
                                                                     well, that sustainability is not necessarily written in capital
                                                                     letters. Developing innovative and sustainable social and
                                                                     economic models is currently not the first priority. Therefore
                                                                     three different digital transformation scenarios are designed.
                                                                     A traditional growth-oriented scenario, a COVID-19 scenario
                                                                     and an innovative and sustainable COVID-19 scenario are
                                                                     modeled and tested. All three scenarios have the same
                                                                     number of components, connections and the same driver
                                                                     components. Only the initial state vectors are different and
                                                                     the internal correlations are weighted differently. This allows
                                                                     for comparing all three scenarios on an equal basis. The
                                                                     following three scenarios are illustrated:

                                                                       •   Traditional, growth-oriented scenario
                                                                       •   COVID-19 scenario (natural disaster)
   Fig. 2. Graphical Representation of a Fuzzy Cognitive Map (FCM)
                                                                       •   Innovative and sustainable COVID 19 scenario

                           TABLE IX                                     Five indicators provide information on the quality of the
      A DJACENCY M ATRIX OF A F UZZY C OGNITIVE M AP (FCM)
                                                                     different scenarios:
            C1          C2          C3          C4         C5
 C1         0           1           0           0          1           •   Primary energy consumption (I1)
 C2         0           0           1           0          0
 C3         1           0           0           1          0           •   Degree of automation (I2)
 C4         0           0           0           0          1           •   Digitization speed (I3)
 C5         1           1           0           0          0           •   Total number of existing digital processes and technolo-
                                                                           gies (I4)
                                                                       •   Number of sustainable digital processes and technologies
                                                                           (I5)
transformation. It aims to design a fuzzy but useful general
framework and proof of concept for future inquiry. In this
paper terms and concepts for model building are collected               Inside the given Mental Modeler software platform data
from a literature review. Using this ”fuzzy” method it is            is calculated by the capabilities of the software. For setting
also common for experts to define the correlations in the            the state vectors the software only allows values between -
model. Thus the correlations and causalities correspond              1 and +1. State vectors are set by a reasonable assumption
to reasonable assumptions by the author. For simulation              by the author to get significant results. One single scenario
the mental modeler software is used, developed by Gray               is generated at one calculation time. Simulation results are
et al. [16]. FCMs can describe and simulate the dynamic              taken directly from the given software. No further iterations,
behavior of systems. Simulating the system behaviour is              no evolutionary optimization methods or learning algorithms
usually based on mathematical operations and takes place in          are used. No other than the mentioned scenarios are generated.
iterative steps. Unfortunately, the Mental Modeler software          The three scenarios then subsequently are compared to each
is very limited in this respect and does also not allow for          other to see, if the ETSIE model delivers useful and significant
the use of dedicated learning algorithms. However, scenario          results and is able to be a proof of concept.
building is very simple, user-friendly and allows for a quick
visualization of results. Therefore, this paper only uses the
given possibilities of scenario building in the Mental Modeler
Software and does not include an additional, algorithmically
supported simulation in iterative steps. This paper develops
an open experimental testbed for sustainable and innovative
environments (ETSIE) as a general framework using FCMs. It
highlights directions for future inquiry, but it is not expected
D. Stakeholders F. Three Alternative Scenarios
The following four different groups of people can be In the following, three alternative scenarios, including the
identified as stakeholders for the ETSIE model: COVID-19 scenario, are depicted using FCMs in the ETSIE
model and evaluated according to the five basic indicators
mentioned above. Table XI shows a description of all three
• (P) Politics (cities, counties and municipalities - federal, alternative scenarios:
state and local)
• (R) Research and development
• Scenario 1 - Traditional, growth-oriented scenario
• (E) Economy (companies, architects and urban planners)
• Scenario 2 - COVID-19 scenario (natural disaster)
• (S) Civil society (population and employees)
• Scenario 3 - Innovative and sustainable COVID-19 sce-
nario
E. Concepts TABLE XI
T HREE ALTERNATIVE SCENARIOS
The concepts from table VIII are directly transferred to table
X. This table shows the concepts of the ETSIE model with a Alternative scenarios Description
(1) Traditional growth- This scenario includes a traditional form of the
detailed description. All concepts are assigned to the different oriented scenario growth-oriented economy, no political subsi-
stakeholders: politics (Pn), research and development (Rn), dies for sustainable developments, no sustain-
economy (En), civil society (Sn) and indicators (In). able research and development, an increase of
individual life and work forms and an increase
of individual mobility
TABLE X (2) COVID-19 scenario This scenario is characterized by rising gov-
L IST OF CONCEPTS (natural disaster) ernmental expenses, economical subsidies,
growing investment in research, but no ded-
Name Description icated promotion of sustainable technologies
P1 Political Thought Style Common sense or style of reasoning (3) Innovative and This scenario shows an innovative approach
P2 Climate Protection Political actions for climate protection sustainable COVID-19 towards a sustainable digital transformation
P3 Infrastructure Political actions for infrastructure in- scenario under COVID-19 conditions.
Investment vestment
P4 Financing and Coordi- Political actions regarding subsidies
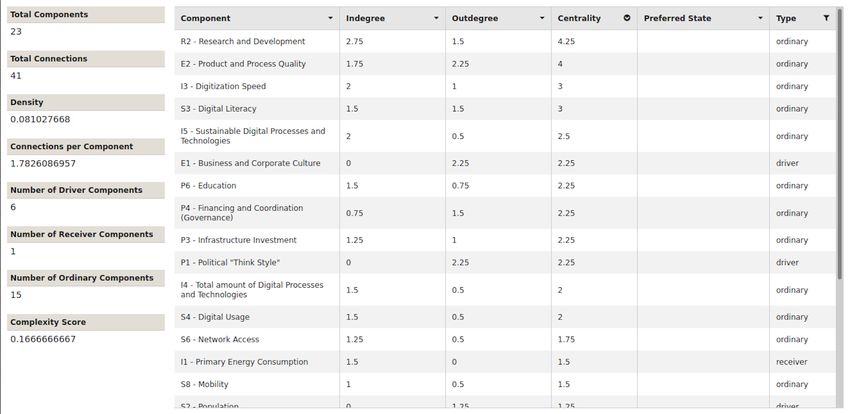
nation (Governance) and governmental support All three scenarios are built from the same number of
P5 Prevention of Data Mo- Political actions regarding data ethics
nopolies (Data Ethics) concepts (or components) and connections. They all have
P6 Education Political actions for educational sup- the same density and the same number of connections
port per component. All three models have exactly the same
R1 Research Paradigm Common sense or style of reasoning
R2 Research and Develop- Research actions complexity score and show six driver components as listed
ment below:
E1 Business and Corporate Common sense or style of reasoning
Culture
E2 Product and Process Economical actions regarding product • P1 - Political Thought Style
Quality and process quality • R1 - Research Paradigm
S1 Public Thought Style Common sense or style of reasoning • E1 - Business and Corporate Culture)
S2 Population Total amount of population
S3 Digital Literacy Amount of digitally educated people • S1 - Public Thought Style
S4 Digital Usage Average daily usage time of digital • S2 - Population
media • S5 - Affordability
S5 Affordability Average price of digital technology
S6 Network Access Amount of people having digital net-
work acces This structural design, the general form of the models,
S7 Capacity Average available bandwidth per in-
habitant remains the same in all three scenarios. Only the weights of
S8 Mobility Average daily usage time of means of the connections between the nodes (or components) change.
transport This is intended to make it easier and clearer to recognize
I1 Primary Energy Con- Primary energy demand (Qp)
sumption deviating results and behaviour of the individual models.
I2 Degree of Automation Percentage of digital process automa-
tion
I3 Digitization Speed Composite factor of population, digital
literacy, digital usage, affordability, ca-
pacity and network access
I4 Total amount of digital Total amount of digital processes and
processes and technolo- technologies
gies
I5 Sustainable digital pro- Percentage of sustainable processes
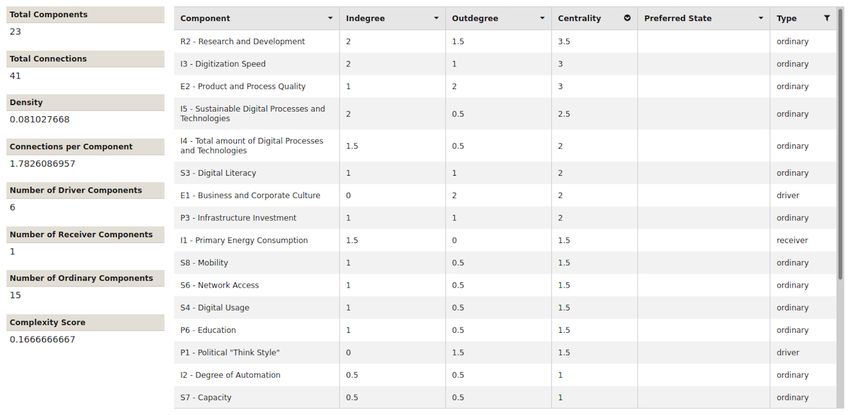
cesses and technologies and technologiesIV. R ESULTS Government expenses (+0.36) and expenditures for
infrastructure extension (+0.55) are increasing. Data
A. Scenario 1 - Traditional Growth-Oriented Scenario
monopolies are not avoided (0). Climate protection measures
Figure 3. shows a graphical representation of the first are decreasing (-0.24). The number of digital processes
scenario, the traditional growth-oriented scenario. It is and technologies is increasing (+0.82), while the share of
characterized by following parameters: The state promotes sustainable technologies is declining (-0.87). The speed of
infrastructure development, research and education. There digitization (+0.79), primary energy consumption (+0.79)
is no state support for the economy, mobility is not and the degree of automation (+0.35) are increasing. Digital
encouraged, sustainable technologies are not promoted, and literacy is increasing (+0.69), there is better network access
data monopolies are not avoided. There are no additional (+0.66), higher capacities (+0.27) and more digital usage
government measures for climate protection. The economy (+0.71). Individual mobility (+0.46) and product and process
additionally supports education, infrastructure extension quality (+0.72) increase. Education (+0.64) and research
and the degree of automation. They invest in research for (+0.79) both grow. Table XVI shows the adjacency matrix
product and process quality, but do not promote sustainable and the state vectors in scenario 2. The initial state vectors
technologies decisively. Research develops new technologies are depicted in white colour on grey ground. Figure 6. shows
without promoting sustainability. The population is growing a graphical depiction of the results of scenario 2 in a bar
moderately and continues to pursue consumption-oriented diagram.
and individual life and work models, without a significant
sustainable share. As a result, government expenses (+0.24)
and expenditure on infrastructure extension (+0.46) are C. Scenario 3 - Innovative and Sustainable COVID-19 Sce-
increasing. Data monopolies are not avoided (0). Climate nario
protection measures are decreasing (-0.24) and the number of Figure 7. shows a graphical representation of the third
digital processes and technologies is increasing (+0.65), while scenario, the innovative and sustainable COVID-19 scenario. It
the share of sustainable technologies is decreasing (-0.7). The is characterized by following parameters: There are additional
digitization speed is increasing (+0.66), as well as the primary government measures for climate protection. The state pro-
energy consumption (+0.72) and the degree of automation motes the extension of infrastructure and avoids data monopo-
(+0.22). There is a higher digital literacy (+0.45), better lies. It invests in education, digital literacy and research. There
network access (+0.43), higher capacities (+0.23) and more is less state support for the economy. Sustainable mobility is
digital usage (+0.44) and a corresponding higher mobility promoted through urban structural measures (e.g. Göderitz et
(+0.46). Corresponding to an increasing product and process al. ”Die gegliederte und aufgelockerte Stadt” [50]). Individual
quality (+0.44), education (+0.46) and research (+0.44) grow. traffic is reduced. Sustainable technologies are promoted in
Table XV shows the adjacency matrix and the state vectors a targeted manner. The companies support climate protec-
in scenario 1. The initial state vectors are depicted in white tion, education and infrastructure development. The degree
colour on grey ground. Figure 4. shows a graphical depiction of automation is oriented towards a socially sustainable de-
of the results of scenario 1 in a bar diagram. velopment. The companies invest in research, product and
process quality and in sustainable technologies. The population
is growing moderately and pursues predominantly socially
B. Scenario 2 - COVID-19 Scenario (Natural Disaster) sustainable and cooperative living and working models, with
Figure 5. shows a graphical representation of the second a high sustainable proportion.
scenario, the COVID-19 scenario (natural disaster). It is char- Government expenses (+0.36) and expenditure on infras-
acterized by following parameters: The state is promoting tructure extension (+0.46) are increasing. Additional measures
the extension of infrastructure and is also investing more for climate protection (+0.46) and against data monopolies are
in research. Education and digital literacy receive additional taken (+0.24). The share of sustainable technologies (+0.96)
support. There is temporary state support for the economy, is increasing, while the total number of digital processes
mobility is not promoted, sustainable technologies are not and technologies is being reduced (-0.84). The digitization
promoted, data monopolies are not avoided. There are no addi- speed increases (+0.78) while primary energy consumption
tional government measures for climate protection. Companies decreases (-0.76). The degree of automation decreases (-0.36).
provide additional support for digital education, infrastructure Digital literacy is increasing (+0.69), there is better network
extension and automation. They also invest in research for access (+0.64), higher capacities (+0.23) and more digital
product and process quality, but without providing dedicated usage (+0.71). Individual mobility decreases (-0.18). Product
funding for climate protection or sustainable technologies. and process quality (+0.75), education (+0.64) and research
Research is increasingly developing new technologies without (+0.89) all three grow. Table XVII shows the adjacency matrix
promoting sustainability. The population is growing moder- and the state vectors in scenario 3. The initial state vectors
ately, but continues to pursue consumption-oriented and indi- are depicted in white colour on grey ground. Figure 8. shows
vidualized models of living and working, without a significant a graphical depiction of the results of scenario 3 in a bar
sustainable share. diagram.You can also read