Informal food vendors and their role in the food and nutrition security of low-income workers in Bandung City, Indonesia - SUSTAINABLE DIETS FOR ...
←
→
Page content transcription
If your browser does not render page correctly, please read the page content below
SUSTAINABLE DIETS FOR ALL
                            RESEARCH
                              PAPER

Informal food
vendors and their
role in the food and
nutrition security of
low-income workers
in Bandung City,
Indonesia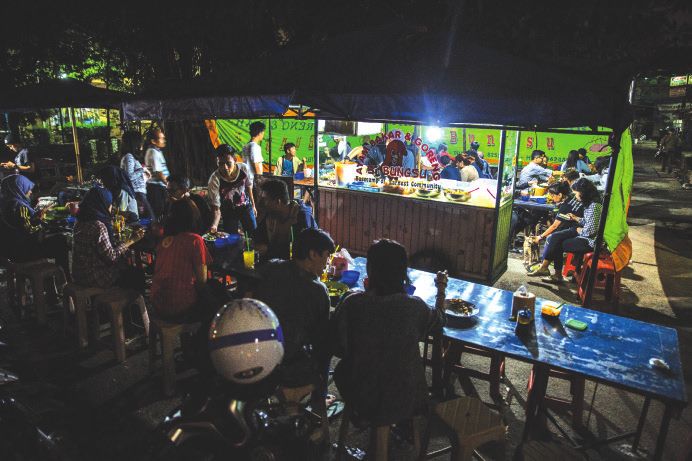
First published: May 2019
ISBN: 978-1-78431-694-5

AUTHORS
Ronnie S Natawidjaja is director of the Centre for Sustainable Food
Studies at Padjadjaran University.
Hepi Hapsari is the chair of Social Economics Department, Faculty of
Agriculture, Padjadjaran University.
Dindin Makhmudin is a technical staff member of the Centre of Excellence
for Applied Science and Technology at Padjadjaran University.
Irlan A Rum is a lecturer and researcher at the Department of Economics,
Padjadjaran University.
Hanny Sulistyoningrum is an executive secretary and researcher at the
Centre for Sustainable Food Studies, Padjadjaran University
William Vorley is a senior associate at IIED, UK.

ACKNOWLEDGEMENTS
We would like to thank the informal food vendors who participated in the
survey, the 303 factory workers who participated in the food journal for
the whole week, and informants from the staff of PT Kahatex. We are
also grateful to Shelley Cheong-Holdaway, Seth Cook, Judith Fisher,
Alejandro Guarin, Nicole Kenton, Anne-Marie Mayer, Frank Mechielsen,
Queentries Regar, Frances Reynolds, and Clare Rogers for review, editing,
layout and coordination. Funding was provided by the Netherlands
Ministry of Foreign Affairs via Hivos, and the UK Department for
International Development via IIED. Photos are from the authors unless
otherwise stipulated.

Cover photo: Mobile street vendor selling rujak to factory
workers, Bandung.
© Kumal Jufri/Panos for Hivos.

    RESEARCH PAPER                                                          IIED + HIVOS   2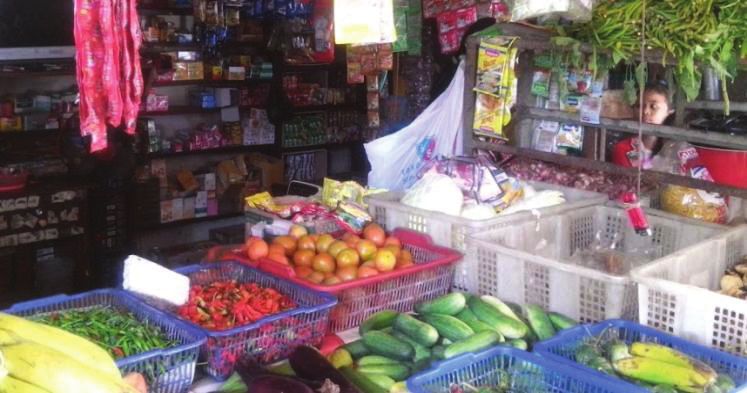
CONTENTS

Acronyms and abbreviations4
Summary5
Introduction6
1 	 Informal street food vendors in Bandung’s food system                               7
    1.1 Background                                                                      7
    1.2 Street vendors in Bandung                                                       7
    1.3 Bandung street vending policy                                                   8
2 Profiles of vendors and their customers                                              10
    2.1 Street vendor profiles                                                         10
    2.2 Street food consumer profiles                                                  14
3 	 The role of street vendors in the food and nutrition security of low-income workers16
    3.1 Surveys of female factory workers and food vendors                             17
    3.2 Food availability for factory workers                                          18
    3.3 Nutrition and diversity                                                        25
4 	 Conclusions and recommendations27
    Policy and advocacy implications                                                   27
References29
Annex 1 Daily food diary                                                               31

  RESEARCH PAPER                                                         IIED + HIVOS   3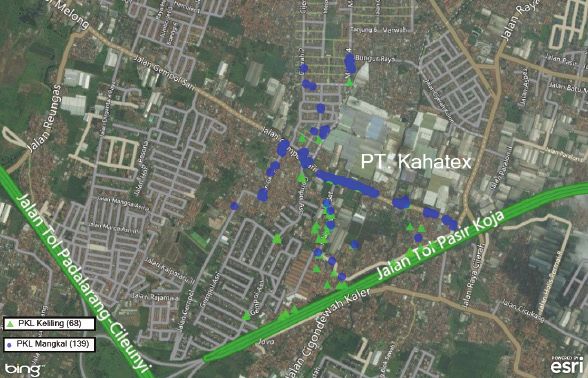
ACRONYMS AND
ABBREVIATIONS

CSFS          Centre for Sustainable Food Studies, Padjadjaran University

DDS           Dietary diversity score

GPS           Global positioning system

IDR           Indonesian rupiah

kcal          Kilocalories

MDD-W         Minimum dietary diversity in women of reproductive age

MSG           Monosodium glutamate

PKL           pedagang kaki lima (PKL, street vendor)

PT            Perseroan Terbatas (limited company, as in PT Kahatex)

RDA           Recommended dietary allowance

RT            rukun tetangga (neighbourhood association)

RW            rukun warga (community association)

SME           Small and medium-sized enterprise

Exchange rate at time of field research in 2015: 1USD = IDR 14,200

       RESEARCH PAPER                                                       IIED + HIVOS   4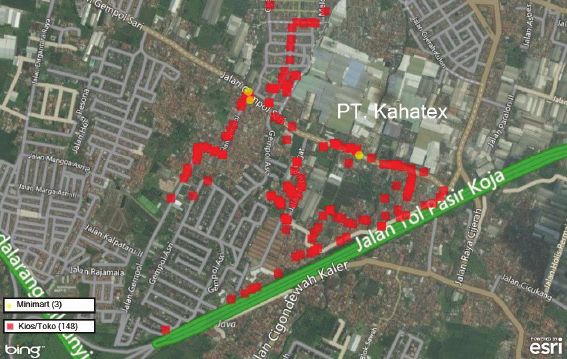
SUMMARY

In common with many rapidly growing cities in Southeast         This central place of street vendors in the food security
Asia, street vendors have a contested place in the growth       of the working poor was uncovered in research carried
of Bandung and present city authorities with regulatory         out among 300 female mainly migrant textile factory
challenges. Policy responses show both hostility to and         workers around the large PT Kahatex textile factory at
cohabitation with street vendors. They include restricting      the western edge of the city. The women themselves were
the presence of vendors to certain streets through zoning,      involved in data collection, using seven-day food diaries
relocating and formalising vending via vendor centres and       and 24-hour recall. The research showed that food stalls
food festival events. These reflect mixed objectives of         or warung are generally the most important source of
tackling traffic congestion, improving order, and attracting    nutrition for the workers; static and mobile street vendors
tourists to the city.                                           were also important. The surveyed workers had a high
                                                                dietary diversity.
The role of street vendors and informal food provision in
urban food security and the food system of the working poor     A one-size-fits-all policy for street vendors may fail to take
has largely been overlooked. This research, conducted in        the different roles of vendors and informal provision into
two parts, set out to fill that gap. The first part explored    consideration, especially their part in the food system of
the nature of street vending in Bandung from a qualitative      the working poor who underpin the city’s economy. Workers’
survey of vendors and their customers in three districts of     food and nutrition security may be affected negatively by
the city. The second part focused more empirically on the       relocation policies. Evidence is key to supporting a more
role of street and informal vendors in the food and nutrition   disaggregated approach to the informal food system. Policies
security of low-income residents, specifically young women      can then be adjusted to the realities and benefits of informal
textile factory workers.                                        and semi-formal provisioning that build on flexibility
                                                                and advantages of informality, while minimising risks to
A 2015 census recorded over 22,000 street vendors in
                                                                consumers and urban governance. Evidence is still largely
Bandung City, 55% of whom sell food and beverages. We can
                                                                brought into policy processes by experts. However if vendors
categorise food vendors into four broad categories: main
                                                                and workers can generate evidence themselves, there is the
meals (either full menu with mixed meals, or single dishes);
                                                                potential to advocate directly around their priorities, and be
beverages; and snacks/sweets. Full menu mixed meals gave
                                                                less dependent on others to set the agenda.
the highest gross sales, but also required more capital and
involved higher risk.

The study found two quite distinct categories of street
food consumers: the recreational/leisure consumer and the
subsistence consumer. The recreational consumer purchases
food from street vendors once or twice a week, spending
quite a large amount per visit. The subsistence consumer,
on the other hand, uses street vendors as their main food
source — 50 to 80% of their total food intake — and spend
IDR10,000 to IDR15,000 (USD0.7-1.0) per visit.

    RESEARCH PAPER                                                                                    IIED + HIVOS      5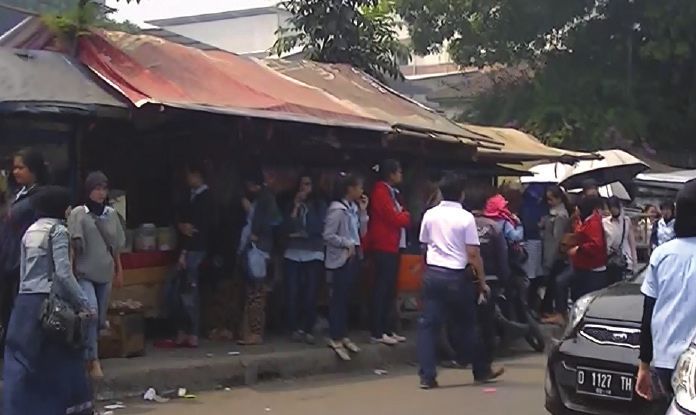
INTRODUCTION

This research is part of a process of evidence generation to     was conducted by the Centre for Sustainable Food Studies
help protect and improve the food systems of the urban poor      (CSFS) of Padjadjaran University, in collaboration with IIED
in the city of Bandung, in a period of rapid urbanisation and    and Hivos. The structure of this document is as follows:
modernisation. It focuses on the role of street food vendors     in Section 1 we provide some background on Bandung’s
and informal food providers, who have a contested place in       informal food system; in Section 2, we provide an overview
the city’s growth. The research set out to better understand:    of the informal street vendors and their consumers; in
(1) the place of street and informal vending in the city’s       Section 3 we focus on the role of informal food vendors
food system; and specifically (2) the role of different food     in providing food access to female factory workers; and
outlets in the food and nutrition security of (mainly migrant)   Section 4 presents the conclusions and recommendations.
low-income female workers in Bandung’s factory area. It

    RESEARCH PAPER                                                                                     IIED + HIVOS      6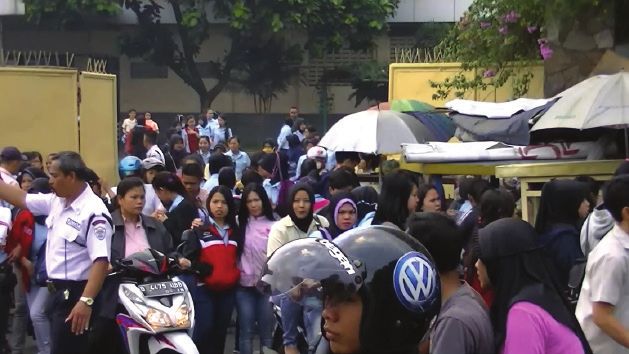
1. INFORMAL STREET
FOOD VENDORS IN
BANDUNG’S FOOD SYSTEM

1.1 Background                                                       municipal authorities. The dominant approach in Indonesian
Indonesia is one of the most urbanised countries in Southeast        cities has been to apply disincentives (Permana et al.,
Asia. Its share of urban dwellers grew from 15% in 1960 to           2016). In many cases, city authorities have forcibly evicted
over 55% in 2017, when the total population reached 264              or relocated street vendors in the name of urban order and
million. This migration to urban areas is caused in part by          cleanliness. Vendors are often subject to harassment and
steady economic growth, but also inequality in rural land            extortion, including from organised crime (Felbab-Brown,
holdings, and a national development policy that is biased           2013; Paskarina et al., 2017).
towards urban areas and prioritises industry (Rachbini and
                                                                     Some progressive municipal authorities in Indonesia have
Hamid, 1994; Todaro and Stilkind, 1991). Urbanisation has
                                                                     tried a more collaborative approach, via engagement,
been accompanied by quite rapid economic restructuring,
                                                                     relocation, and training, as well as incorporating street
including a shift out of agriculture, which has seen a
                                                                     vending into strategies to promote gastro-tourism. Examples
drop in contribution to GDP from 45% in 1970 to 14% in
                                                                     include Surakarta (Sj-Sumarto, 2009), Yogyakarta in central
2014 (Rothenberg et al., 2016). Informality is persistent
                                                                     Java (Gibbings, 2017), and Jakarta where the then governor
in Indonesia where it accounts for around two-thirds of
                                                                     Joko Widodo applied his blusukan approach of direct
employment and 93% of enterprises (ibid.).
                                                                     involvement with people on the ground, that had met with
In West Java, 60% of low-income families live in urban areas         success in his previous role of mayor of Surakarta. These
(Statistics Indonesia, 2015). Official statistics put the level of   collaborative approaches may however break down and
poverty in major Indonesian cities at between 5 and 10% of           revert to hostilities when cleared areas are recolonised by
the population, with Bandung the lowest at 4.8% (Statistics          vendors (Taylor and Song, 2016).
Indonesia, 2014). But with the national poverty line set
                                                                     In Bandung in West Java, the city has, since 2011, taken a
at less than a dollar per day — well below the World Bank
                                                                     zoning approach to forbidding or restricting street vendors
international reference of USD1.90 per day — these statistics
                                                                     in some city streets to improve traffic flow and civic order. It
do not give a full reflection of urban cash scarcity.
                                                                     is recognised, however, that street vendors contribute to a
When it comes to food security, being poor in an urban               vibrant gastro-tourism sector in the city.
environment makes people more vulnerable than in a rural
                                                                     1.2 Street vendors in Bandung
area. Informal food vendors are an important food source
                                                                     Bandung’s informal sector, especially its street vendors,
in developing countries’ urban areas (Benson et al., 2014),
                                                                     grew rapidly during the employment collapse that came
and Indonesia is no exception. For poor urban families, the
                                                                     with the economic crisis of the late 1990s. The sector is an
availability of affordable food is crucial to their wellbeing
                                                                     important part of the urban economy since it has proven a
and associated food security. Yet, despite this important
                                                                     life support for the poor, especially during economic crises,
contribution to food provision and income for the urban
                                                                     by providing affordable food and fulfilling people’s daily
poor, street vendors are often marginalised within urban
                                                                     needs (Rachbini and Hamid, 1994; Kusakabe, 2006). These
governance. Policies and plans for urban modernisation
                                                                     vendors are known locally as pedagang kaki lima (PKL).
and public order have often put municipal authorities on a
                                                                     Bandung City Regulation No. 04/2011 defines a street vendor
collision course with street vending. Informal vending is seen
                                                                     as “a vendor who carries out informal business/retail/
as an undesirable activity, and is considered an eyesore by
                                                                     trading, operating at a public facility, either in an open and/

    RESEARCH PAPER                                                                                          IIED + HIVOS       7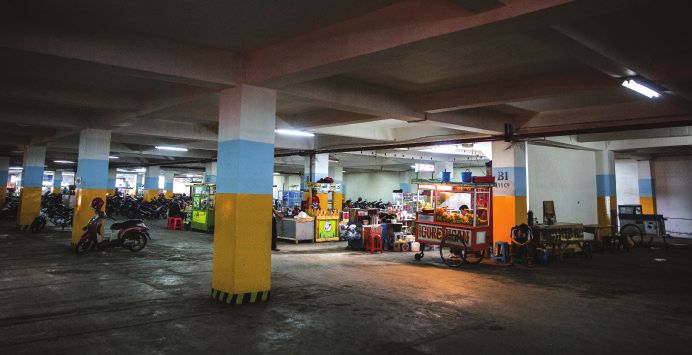
or closed space, using a moving or stationary cart” (Bandung     consumers on tight budgets divide their spending between
City Government, 2011).                                          formal and informal businesses.

Data on the street vendor population in Bandung vary             1.3 Bandung street vending policy
from year to year, partly due to inconsistent data               The growing number of street vendors in Bandung City has
recording. In 2013, the city government carried out its          created a dilemma for the city authorities. On one hand,
most comprehensive census and data collection on street          the Asian economic crisis showed that an informal economy
vendors, covering all 36 sub-districts in Bandung City. The      helps the poor to survive in hard times. However, on the
census recorded 20,326 street vendors in the city, 55% selling   other hand, after the crisis subsided, the number of street
food and beverages and the remaining 45% selling non-food        vendors continued to grow and occupy many streets and
products. A similar survey in 2014-2015 saw a growth to          public spaces, creating traffic congestion and a perceived
22,359 street vendors (Bandung City Government, 2018).           threat to public order and sanitation.

In 2013, Astanaanyar sub-district in Bandung had the highest     Approaches to food vendors have ranged from restrictive to
population of street vendors with 2,001 traders, or 18% of       permissive. The initial approach, starting in 2005, focused
the total. In this densely populated area close to Bandung’s     squarely on disincentives. City Regulation No. 11/2005,
old downtown shopping block, street vending has a history        which was designed to improve the city’s orderliness,
going back to the 1970s. The sub-district includes the Grand     cleanliness and beauty, required seven city locations to
Mosque (Masjid Raya) and surrounding shopping areas. In          be free of street vendors, and included a provision against
2014, the city moved the street vendors to relocation areas      setting up a stall and selling on a footway, park or green
in the Grand Mosque basement car park, Tegalega Park and         belt. It was clear that in 2005 the city authorities saw street
sports complex, or out to Gedebage Market in the city’s          vendors as nothing more than a problem for the city with
eastern suburbs.                                                 no potential to contribute to urban development. However,
                                                                 removing and relocating street vendors had little success.
The second largest concentration of street vendors is in the
                                                                 Most of the vendors returned to the street in a few weeks,
adjacent sub-district of Regol (1,688 vendors in 2013), which
                                                                 playing hide-and-seek with officials.
hosts the Kebon Kalapa shopping mall and Tegalega Park and
sports complex. Non-food vendors dominate in this area,          In early 2011, the city government adopted a more
representing 64% of traders. Vendors here have created an        permissive approach, combining restriction with incentives
informal market on the street for consumers entering the         and capacity building. City Regulation No. 4/2011
downtown area, shopping mall and recreation park from the        demonstrates an important improvement in the way the
south side of the city.                                          city sees the phenomenon of street vendors in urban areas.
                                                                 It contains several important provisions. First, it defines
Other sub-districts with high concentrations of street
                                                                 street vendors, and what they can and cannot do. Second,
vendors are Bandung Wetan (1,392 vendors) and
                                                                 it sets up a special task force responsible for assisting
Kiaracondong (1,031 vendors). These two sub-districts are
                                                                 and monitoring the regulation’s implementation. Task
centres of business and trading for construction, housing
                                                                 force members come from various city departments that
supplies, machinery, electronics, and retail for the eastern
                                                                 deal with street vendor issues, including those overseeing
side of the city. There are no public parks or open spaces in
                                                                 cooperatives and SMEs, tourism, sanitation and public
these areas, so street vendors mostly occupy the pedestrian
                                                                 order. The third provision of the 2011 regulation divides
footway, parking spaces and roads. Street vendors are
                                                                 the city into three types of zone for street vending — red,
concentrated in the same space as formal businesses — all
                                                                 yellow, and green. In red zones, street vendors, whether
four sub-districts are busy trading, business and shopping
                                                                 permanent or mobile, are not allowed to operate; here
areas. This shows that in a city context, formal and informal
                                                                 streets should be free of street vendors at all times. Red
activities are interconnected and support one another.
                                                                 zones are areas around religious buildings (mosques,
Lower level employees and formal business workers are both
                                                                 churches, etc), military complexes, most of the main roads
consumers at informal businesses in the same location. Some

    RESEARCH PAPER                                                                                      IIED + HIVOS      8
crossing the city (17 national roads and 28 provincial roads),    The 2011 regulation does not only apply to street vendors,
as well as seven main business locations. In a yellow zone,       but also to the consumers who buy from them. Consumers
street vendors may only operate at certain locations and/or       who are found buying from street vendors in a red zone, or
certain times. This includes areas surrounding a traditional      yellow zone outside the restricted time or place, will be
market (wet market) where street vendors may operate on           charged IDR1,000,000 (around USD68). Those who cannot
the road and footway from 10pm to 6am. Some areas, such           afford to pay the penalty (based on presented evidence)
as in front of city offices, sports facilities and other public   within three days will be convicted of committing a minor
service facilities, may be used by street food vendors at         criminal act and charged in instalments of IDR200,000.
night from 5pm to 4am. In a green zone, street vendors are        Billboard signs and posters are on prominent display to
allowed to operate at any time. These green zones are set         remind the public about the penalty. The 2011 legislation
up as relocation areas for street vendors, or as a traditional    was applied more strictly from 2014 to reduce congestion
market, thematic culinary/market area or festival market;         and to prepare for the 60th anniversary of the Asia Africa
they include the basement car park of the Grand Mosque and        Conference in April 2015.
Gedebage main market.
                                                                  In September 2015, the Bandung city government set up a
The fourth and final provision of the 2011 regulation requires    street vendor forum at sub-district level in the city, with
street vendors to be registered. All street vendors relocated     the objective of reconciling the differing interests of street
to a green zone are mandated to register and are given            vendors, government and the community. But by October
a permit for one year. The permit for the location can be         2018, the head of the city’s office for Cooperatives and SMEs
extended, but is not transferable to somebody else. If a          stated that only around 5,000 of the city’s 22,000 street
vendor has a permit but is found operating in a red zone and      vendors were “well organized and managed” (Rosadi, 2018).
given three warnings in nine months, their permit will be
suspended, or in some cases revoked.

    RESEARCH PAPER                                                                                      IIED + HIVOS      9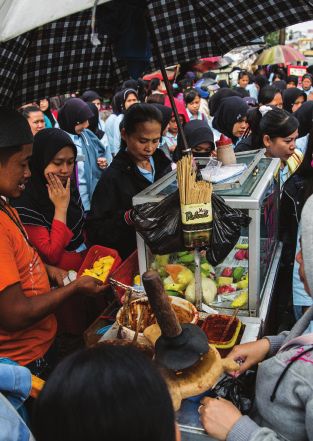
2. PROFILES OF VENDORS
    AND THEIR CUSTOMERS

2.1 Street vendor profiles                                            At each location, we interviewed three street vendors and
In 2015, we conducted an exploratory qualitative study to             three consumers, a representative of the local authority
understand the street vendors’ profiles, their customers,             (lurah or rukun warga),1 and the street vendors’ association
and the value chain of the food they sell. We selected                leader. We also interviewed the city government: the
three street vendor locations in Bandung: the Mesjid Agung            offices of Cooperatives and SMEs; Social Welfare; Planning,
(Grand Mosque) basement car park area in central Bandung              Agriculture and Food Security; and the police (Satpol PP). In
(green zone, relocated from red zone around the mosque                total, we interviewed 27 people between 31 August and 30
on ground level); Tegalega Park close to the sports complex           September 2015.
(yellow zone); and the Gempol Sari area close to the PT
                                                                      Categories of street vendor food on offer
Kahatex textile factory at the western edge of the city (red
                                                                      Initially, we divided street vendor food into three categories:
zone). Each case study location was selected to represent
                                                                      main meals; beverages/drinks; and snacks/sweets. From
street vendors in a different type of area: those selling in a
                                                                      field observation and in-depth interviews, we found that the
relocation area; those close to residential areas; and those
                                                                      main meal category was too broad and included too wide a
close to an urban industrial area. Table 1 gives a comparison
                                                                      range of prices. So we divided main meal vendors into two
of the three locations in terms of operation times, target
                                                                      categories, each with a different price range: full menu
consumers and zoning categories.
                                                                      mixed meals with a variety of meat and fish; and single
                                                                      menu vendors who focus on only one dish, with or without

Table 1. Vendor locations observed

                          Observation location in Bandung
                          Basement car park of the Grand      Tegalega Park, close to the          Around PT Kahatex textile
                          Mosque                              sports complex                       factory
    Street vendor         9am-9pm                             6am-11am                             6am-12am
    operating times
    Consumers             Visitors to Alun-Alun park          Residents of Tegalega area           PT Kahatex factory workers
                                                                                                   (24 hours) over four work shifts
                          Shoppers                            Users of sports arena and
                                                              recreation area at Tegalega
                          Shop and office workers
    Zone                  Green zone: street vending          Yellow zone: street vending          Red zone: no street vending
                          permitted at any time               permitted at certain times/          permitted at any time on
                                                              places                               certain streets
    Type of location      Relocation area                     Relocation area. Close to low        Close to urban industrial area
                                                              to medium-income residential
                                                              areas

1
    Lurah: administrative head of the kelurahan, the lowest level of urban administration; rukun warga: local community association.

       RESEARCH PAPER                                                                                        IIED + HIVOS       10
meat or fish (Table 2). A small additional category — fresh 52-67% value added. From our interviews, we understand
ingredients — was defined after further more in-depth that only street vendors with five to ten years’ experience
research in the PT Kahatex textile factory location; fresh can run this type of business. New entry street vendors in
ingredient vendors were also surveyed in this exploratory the main meal category tend to start by selling single dish
work — see Section 3.2. main meals. Street vendors of single dish main meals earn a
lower net margin, at IDR120,000 to IDR230,000 per day, with
Of the four categories, full menu mixed meals give the
32-49% value added. Thus the single dish food vendor can
highest gross sales, but also require more capital and involve
be categorised as lower budget, but adds moderate value,
higher risk. Street vendors selling full menu main meals
which is good for business. It requires less skill and presents
earn a net margin of IDR510,000 to IDR800,000 a day with
Table 2. Street food categories: daily costs and profits
Description Street food category
Main meals Beverages Snacks/sweets
Street food category Full menu, mixed Single dish, with or All types of drink, Mainly homemade,
meals with meat: without meat: gado- from homemade (hot/ such as traditional
rice and meat with gado, fried rice, fried cold) to bottled drinks finger food (jajanan
vegetables, mixed noodles, meatball pasar), rujak
rice, fish barbecue, noodle soup, etc
etc
Input cost excluding 855,000–1,030,000 275,000–330,000 250,000–400,000 90,000–200,000
labour (IDR)
Labour cost (IDR) 125,000–150,000 100,000–125,000 100,000–125,000 75,000–100,000
Transport cost and 10,000–20,000 5,000–15,000 10,000–15,000 10,000–15,000
fees (IDR)
Total cost (IDR) 990,000-1,200,000 380,000-470,000 360,000-540,000 175,000-315,000
Gross sales (IDR) 1,500,000-2,000,000 500,000-700,000 500,000-750,000 250,000-500,000
Net daily profit (IDR) 510,000-800,000 120,000-230,000 140,000-210,000 75,000-185,000
Value added 52-67% 32-49% 39-40% 43-59%
Family labour Married couple buys Married couple buys Married couple buys Married couple buys
food ingredients, food ingredients, and prepares drinks, food ingredients,
prepares food and prepares food and sometimes children prepares food and
cooks cooks help as well cooks
External labour 2 people None 1 person, mainly for None
transport
Share of women’s 30-50% 50% 30-50% 30-50%
participation
Source: Field interviews in 2015
RESEARCH PAPER IIED + HIVOS 11Relocated street vendors, Bandung Grand Mosque underground car park
(Photo: Kemal Jufri/Panos for Hivos)
a lower risk. However, from the comparison of costs and Street vendors at Tegalega Park, a yellow zone, were
benefits above, single menu meals are also quite profitable. relocated from the inside to the outside of the park, which
limited time for selling from 6am to midday every day
On the other hand, snacks and sweets offer the lowest
except Monday when the general area is cleaned. The street
profits for the vendor. Snack/sweet street vendors earn
vendors complained that the policy has kept changing from
a net margin of IDR75,000 to IDR185,000 per day, the
one mayor to another. They observed that the policy was
lowest of the food categories. However, these businesses
getting stricter, limiting their scope of activities, and they
create higher value added at 43–59% — making them more
claimed that their gross sales had dropped by between 10
attractive given the low capital outlay required to run the
and 30% because of the time restrictions.
business on the street. Interestingly, one vendor insisted
that he sells snacks/sweet food because he is continuing Street vendors in the Grand Mosque basement were
the family business. According to him, this is the only originally on the street and parks around the mosque and
business his family has known for a generation; he intends shops downtown in Bandung City. When those areas were
to continue even though he understands that it is becoming designated as red zones, the only alternative locations
less profitable. The same argument came from vendors of vendors were given were the underground car park next to
other kinds of food. From the high cost required, vendors the mosque, or Gedebage Market on the outskirts of the
of beverages achieve relatively lower net margins and only city. Relocation has had a major impact on vendors. The
create 39-40% value added. underground area is dark, hot, polluted by vehicle exhaust
fumes, and poorly signposted. The vendors’ leader in the
Generally, the street vendors we interviewed were not
basement location said there had been almost 5,000 vendors
aware of or did not have a full understanding of food health
in the downtown area, and only about 1,000 vendors agreed
and safety. Only one street vendor had attended a food
to relocate to the basement. The remaining vendors chose
safety seminar by the Office of Cooperatives and SMEs in
to relocate to Gedebage Market, or look for an alley in the
the previous year. The main health and safety problems
downtown area to sell from, against city regulations. The
observed were: 1) repeated use of old cooking oil; 2)
vendors complained that as a result of relocating to the
unhygienic facilities for cleaning eating utensils; and 3) poor
underground location, they lost 30 to 60% of their regular
waste disposal.
gross sales. The first three months after relocation saw the
We found street vendors who had been affected by the largest drop in sales. Some vendors could not accept the loss
relocation programme in two of our case study locations: the and moved away from the relocation area. However, after
Grand Mosque basement car park and Tegalega Park. At the six months, sales were reported to be improving, though not
time of this research there had been no relocations at the returning to previous levels.
third case study location, around the Kahatex factory.
RESEARCH PAPER IIED + HIVOS 12Interestingly, we also found new vendors in the Grand Street vendors mostly use fresh and perishable ingredients
Mosque basement car park who were not part of the (estimated by the interviewed vendors at 60-80% of raw
relocation. When we interviewed vendors at the site, one materials). Most vendors do not have large cold storage
new vendor who previously worked at a restaurant in Bali facilities, so they have to buy ingredients every day. Since
had opened two stalls in the basement. Based on a quick they buy ingredients in relatively small quantities, it is
assessment of the basement area, we estimated that most efficient to buy from local traditional retail markets.
about 50% of the vendors were new (ie not relocated from They buy dry materials weekly due to limited capital and
above ground). storage space. None of the vendors bought stock on a
monthly basis.
Vendor supply chains/networks
Street vendors buy their supplies from traditional markets Street vendors selling beverages use the least amount of
nearby. All the street vendors we interviewed purchased raw materials and internal inputs compared to the other
their ingredients to prepare food and beverages from the categories, since they mostly sell ready-to-drink beverages
Astanaanyar market, the largest traditional retail market in such as sodas (Coca Cola, Fanta, etc), bottled water and
the city’s central area, and other smaller markets closer to bottled tea drinks. Only a few vendors sell traditional drinks,
their residential areas. None purchased directly from nearby such as es cendol, goyobod, es campur, and es serut.
villages in rural areas or the central market (see Table 3).
Table 3. Street vendors’ ingredients
Description Food groups
Main food Beverages/drinks Snacks/sweets
Type of food Full menu, mixed Single dish, with or All types of drink, from Mainly homemade,
group meals with meat: without meet: gado- homemade (hot/cold) such as traditional
rice and meat with gado; fried rice; fried to bottled drinks finger food (jajanan
vegetables; mixed rice; noodle; meatball pasar), rujak
fish barbecue, etc noodle soup, etc
Source of Local traditional Local traditional Local traditional Local traditional
ingredients market: Astanaanyar markets: Astanaanyar, market: Astanaanyar market: Astanaanyar
Rencong, Pola Cijerah
Ingredients Perishable goods: Perishable goods: •• Perishable goods: Perishable goods:
purchased daily vegetables; eggs; vegetables; eggs; ginger; sugar; ice coconut milk;
tempeh; tofu; tempeh; tofu; cubes; coconut milk; cassava; banana
meat; chicken; fish; meat; chicken; fish; cingcau, etc leaves; vegetables;
meatballs; spices meatballs; spices •• Drinks in bottle/can/ spices
pack
Ingredients Dry goods: rice; sticky Dry goods: rice; sticky Dry goods: sugar; soy Dry goods: sugar; flour
purchased weekly rice; dry noodles; flour rice; dry noodles; flour beans
RESEARCH PAPER IIED + HIVOS 132.2 Street food consumer profiles large amount, from IDR50,000 to IDR300,000 (for one to six
Street vendors are an important part of food consumption in people) per visit.
Bandung City. Bandung consumers are heterogeneous, with
With its cool temperatures and pleasant surroundings,
a wide range of incomes and different levels of reliance on
Bandung is an ideal place to eat out on the street. Since
street food. Based on our interviews and field observations,
colonial times it has been customary for local residents to
especially from the three case study locations, we grouped
eat out with family and friends. Bandung City is popular
street food consumers into two categories: the recreational/
nationally and internationally as a tourist destination for
leisure consumer and the subsistence consumer (Table 4).
gastronomy and fashion. During weekends and holidays, the
The first group of consumers purchase food from street city is usually flooded with tourists.
vendors for recreational or leisure purposes. They go out to
In response, the city government has created thematic
buy food on the street in order to enjoy something different
weekend food festivals at several locations in the city. The
to their usual home-cooked food. In Bandung City there are
mayor of Bandung at the time of this research, Ridwan
plenty of popular (even legendary) street food locations
Kamil, has supported food festivals in every sub-district
known for their variety and good food. The interviews found
of the city as part of the relocation programme for street
that this type of consumer eats street food once or twice
vendors from the red zone areas.
a week. Since these are relatively special occasions and
the idea is to find something different, they spend quite a
Table 4. Street vendor consumer characteristics
Indicators Consumer type
Recreational/leisure Subsistence
Consumer characteristics Street vendor meals as recreation and Street vendor as an everyday food
a change from homemade food provider
Frequency of food purchases from 1-2 times a week Every day, 2-3 times
street vendors
Average spend on food per visit to 50,000-300,000 10,000-30,000
street vendor (IDR)
Share of total food spending spent on 10-30% 50-80%
street vendors
Reason for buying from street vendors Plenty of choice, some famous for Practical, easy to access, a lot of
as opposed to other food providers good food at a relatively affordable choice, relatively affordable price
price
Response to health and safety Due to some concerns, consumers are Consumers try to be selective and only
concerns selective and do not eat street food buy from known vendors
too often
RESEARCH PAPER IIED + HIVOS 14Street vendors as a leisure destination. University district, Bandung.
Photo: ©Kemal Jufri/Panos for Hivos
The second — and less visible — group of consumers use facilities have to rely on food from outside. Among the food
informal food providers as their main source of food. Some providers available, street vendors are considered the most
people do so because of limiting conditions, such as lack of affordable, practical, and varied. This type of consumer eats
time to cook, or lack of space or access to cooking facilities, street food two to three times a day, spending IDR10,000 to
or limited cash reserves because they are paid by the day. IDR15,000 per visit. Street vendors have become the main
This leaves them reliant on commercial food providers, such food source for this second type of consumer; interviewed
as warung (food stalls) and street vendors. We will see in consumers estimated it at 50-80% of their total food intake.
Section 3 how people who come to work in Bandung from Thus the nutrition and safety of street food have important
outside the city and rent a small room without cooking implications for these subsistence consumers.
RESEARCH PAPER IIED + HIVOS 153. THE ROLE OF
STREET VENDORS IN THE
FOOD AND NUTRITION
SECURITY OF LOW-INCOME
WORKERS
We now take a more in-depth look at subsistence consumers that female factory workers’ average daily energy and
and their link to informal food provision. Low-income protein intake for three age groups fell short of national
workers form the backbone of the city’s economy, and their recommendations by between 91 and 152 Kcal, and protein
food and nutrition security may be affected negatively by by 20-23 g. Nutritional intake was 262-411 Kcal less than
a policy of vendor clearance and/or relocation. Our study measured energy outflow. Separate research in Bangladesh’s
focuses on women textile workers in the PT Kahatex textile urban areas, including Dhaka, found that the nutritional
factory in Gempol Sari, an area of Bandung City which, as intake of adolescent female factory workers was deficient
reported in Section 2, has been designated as a red zone in both energy and nutrients. The authors urge immediate
with vending prohibited along the main route running in intervention to improve their nutritional status (Khan and
front of the Kahatex factory. Ahmed, 2005).
In the last 20 years, women’s participation in the workforce Bandung is an important centre for textile manufacturing
in Indonesia has been increasing very rapidly in line with in Indonesia. Women, often internal migrants, constitute
economic growth, although opportunities for women are around 80% of all workers in Indonesia’s garment factories
dominated by low-paid jobs, such as factory work. The (Fair Wear Foundation, 2017).
wages of female workers are lower than male workers, while
The informal food economy is central to the food security
their working hours and daily needs are almost the same.
of the urban working poor in many parts of Southeast Asia,
Low wages affect female workers’ ability to meet their own including Indonesia and Thailand (Carrillo-Rodriguez and
nutritional needs. Research in 2007 by Aziza (2008) found Reed, 2018). The role of street vendors and informal food
that the prevalence of anaemia in women of reproductive providers was considered highly relevant to the food and
age in Jakarta, Indonesia was 28% — and among women nutrition security of textile factory workers — part of the
workers, the prevalence was 30 to 40%. The study also found ‘subsistence’ role of street vending described in Section 2
that 15% of women workers suffered from chronic energy and — because of those workers’ low income and lack of access
protein deficiency. to cooking facilities. Uncovering this side of street vending
and informal provision in Bandung is important if policy is to
Research among female factory workers in other Asian
encompass the food system of the working poor, and not just
countries also serves as the basis for this research in
the recreational role of street food.
Indonesia. In Bangladesh, Sultana et al. (2014) showed
RESEARCH PAPER IIED + HIVOS 16Figure 1. Location of the PT Kahatex factory and lodgings of 300 surveyed female workers in Bandung and Cimahi
(1 dot = 2 respondents)
The objective of this part of the research was to better daily traffic jams. However, at the time of this research,
understand the availability and accessibility of food Bandung city authorities had never carried out an operation
outlets to female factory workers in Bandung, the workers’ against the street vendors, despite people repeatedly
purchasing behaviour, and the role of different food reporting them.
outlets in their food and nutritional security, including
PT Kahatex factory workers tend to lodge near the factory
dietary diversity.
to save time and transport costs. Information obtained
3.1 Surveys of female factory workers and food from the local sub-district office shows that the majority of
vendors workers reside at Kelurahan Gempol Sari RW 01, RW 02, RW
Established in 1979, the textile company PT Kahatex 03 and Kelurahan Cigondewah Kaler at RW 02, RW 12, and
employs more than 48,000 workers across two sites to RW 13 (Figure 1).
the east and west of Bandung City. The particular factory
In order to prepare our survey of PT Kahatex factory
covered by this research is located on the western border
workers, we visited the Kelurahan Cigondewah Kaler and
between Bandung City and Cimahi district, covering two
Gempol Sari offices, but found very limited information. The
kelurahan or sub-sub districts: Gempol Sari in Bandung City,
factory workers tend not to register as transfer residents
and Cimahi Selatan in Cimahi district. Kelurahan are divided
at these local offices in order to become formal residents
into several community associations called rukun warga (RW)
of Bandung City. They mostly keep their residential status
which themselves consist of neighbourhood associations,
from the areas they have migrated from, since their
rukun tetangga (RT).
factory contracts mean their stay may only be temporary.
A mayoral decree (888/2012, Article 15), declared However, the kelurahan offices were able to tell us in which
certain locations along Jalan Gempol Sari in front of the neighbourhoods the PT Kahatex factory workers were likely
Kahatex factory to be a red zone, where street vendors to live.
are prohibited from entering and doing business, due to
RESEARCH PAPER IIED + HIVOS 17Through a participatory mapping exercise with community status, labour turnover at the factory was very high. Most
leaders in the area, we were able to create a list of female respondents (57%) had worked between one and five years,
factory workers to populate our survey. The neighbourhood while 28% — mostly non-regular workers and/or workers on
leaders (both rukun warga and rukun tetangga) gave us a probation — had worked for less than a year.
complete list of temporary residents, including those who
Most of the food vendors in the area surveyed are informal
work at the Kahatex factory. Apparently, the RT head had
actors, and therefore the local government offices were not
made it mandatory for landlords of dormitories or rented
able to provide lists of registered food vendors. Instead, an
houses to report and make a copy of their residential ID
inventory of food vendors and services was created through
cards. The participatory mapping process in both kelurahan
a community-led mapping exercise. Through the mapping
showed 2,635 PT Kahatex female factory employees: 1,829
process, residents were able to show in detail where the
in Gempol Sari, and 806 in Cigondewah Kaler.
food vendors were present at different times of service
The sample population of 308 of these workers was (morning, noon, afternoon, and evening).
randomly selected in December 2015 across the six target
Following some training, the mapping exercise was carried
rukun warga in Cigondewa Kaler and Gempol Sari using the
out in the main area where most female factory workers
Slovin formula.
lived. Ten community members were involved in the process.
Each female factory worker in the sample was given a seven- Each group explored their own area of the main road and
day food journal to be filled in and collected every day by a the RW residential areas, GPS tagging any food vendor
field assistant. The daily diary covered the three mealtimes and service location found and recording information such
plus snacks (giving a total of up to six meal occasions), and as the type of vendor, food provided, hours of operation
workers were asked to report the type of food, amount, and business characteristics. They also interviewed and
location of consumption, source, and cost for each meal observed the vendors to capture and confirm information
occasion (see Annex 1). on the businesses. The groups carried out interviews and
observations during the changes in factory workers’ shifts,
The women workers we surveyed were aged from 18 to
from 6am to 7.30am and 1pm to 2.30pm, while observations
53 years old, with an average age of 23, with 79% in the
in the residential area were carried out after the afternoon
category of ‘young productive age’ (19-29) and 13% classed
and evening shifts.
as ‘advanced productive age’ (30-49). Only 11% were
local residents; the remainder being migrants mainly from 3.2 Food availability for factory workers
the districts and cities scattered across West Java. All Food providers based on types of vendor
respondent migrants stay in rented rooms or houses near the Food providers in the area of the Kahatex factory can be
factory, where rental prices ranged between IDR350,000 and classed into four main categories: minimarts (convenience
IDR500,000 per month. The respondents lived as immigrants stores of national chains Alfamart and Indomaret); different
for 3.5 years on average, while the oldest respondents had classes of kiosk or store; warung (food stalls, often in front
lived there for 25 years. Most respondents had graduated of a home); and street vendors (mobile and static).
from senior high school (77%) and junior high school (18%).
Minimarts are convenience stores selling groceries and
Some had dropped out of senior high school or university.
other goods, part of a national or transnational chain and
So on average the female factory workers at Kahatex had a
managed professionally using a computerised system and
good educational background.
employing several staff. Minimart buildings are generally
In terms of employment status, 27% of surveyed workers bigger than regular stores or warung and sell more items,
had non-permanent status and were paid a wage based with an emphasis on processed and packaged foods rather
on a day rate. The other respondents reported that they than fresh produce. There were three minimarts recorded
had long-term permanent employment (37%) or contracted at the research location: two Alfamarts and one Indomaret.
worker status (36%) at PT Kahatex. However, despite the One is located in front of the Kahatex factory and the other
status of permanent employee dominating the employment two are near the Gempol Sari village housing area.
RESEARCH PAPER IIED + HIVOS 18Figure 2. Minimart and kiosk locations
Kiosks or stores sell both food and non-food items from a
permanent building or as part of a house. Unlike a minimart,
kiosk customers do not use self-service, there is a limited
range and number of items for sale, and they are managed
in a traditional way. Foods sold at kiosks tend to be snacks,
such as bread and cookies. There are 148 kiosks in the
study area and 123 of them are located close to Kahatex
employees’ housing; 25 other kiosks are located in front
of the Kahatex factory. The distribution of the kiosks and
minimarts can be seen in Figure 2.
Food stalls or warung generally provide ready-to-eat food at
permanent locations or as part of a house. A characteristic
of warung is that they usually offer seats to allow their
customers to sit and eat.
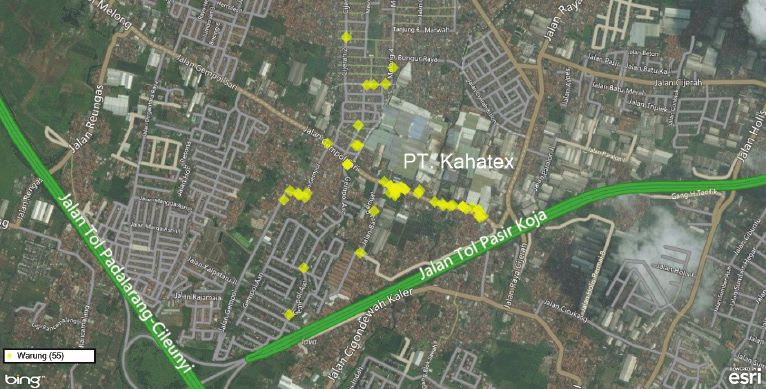
There were 55 warung identified in the research location,
accounting for 13% of the vendors. Most of them (60%) sell
ready-to-eat main courses (mainly full menu, as described
in Section 2), while others sell drinks and snacks. Usually
people eat while chatting with their friends, sitting at the
dining tables provided. Food stalls offer relatively cheap
prices and simple settings. Stalls may specialise in one
regional food culture such as Sundanese, Tegal or Padang.
Most of the warung in the study area are located in front
of the Kahatex factory (36 vendors, or 65%), while the
remainder (19 vendors, or 35%) are located in the housing
area as shown in Figure 3.
Food stall or warung
RESEARCH PAPER IIED + HIVOS 19Figure 3. Distribution of food stall or warung in the research location
Street vendors operate two basic models: PKL Mangkal residential areas. While static street food vendors have
(static) who tend to stay at the same place each day, and limited seats, mobile street food vendors have nowhere to
PKL Keliling (mobile) who travel around during the day to sit at all. The distribution of street vendors in the research
find customers. location can be seen in Figure 4.
There were 207 street vendors — 50% of all food vendors On the main road in front of the Kahatex factory, street
recorded in the research location—of which 139 were static vendors (mostly static) dominate food vending (see Table 5).
and 68 mobile. The majority of them sell main courses (112 These vendors work between factory shifts to target
vendors) specialising in single dishes, with the remainder employees as their main customers. In the area around the
selling snacks (47 vendors). Half of them work in front of factory workers’ housing, the pattern shifts to kiosks and
the Kahatex factory (106 vendors) and the other half in mobile street vendors.
Street vendors
RESEARCH PAPER IIED + HIVOS 20Figure 4. Distribution of street vendors in the research location
Type of food available to factory workers Fresh ingredients refer to food that requires processing
The types of food available to factory workers can be before it can be consumed. This is mostly sold by vendors
divided into five groups: unprocessed food; main courses; located on the west side of the front of the Kahatex
snacks; drinks; and fruit. Table 6 shows the percentage factory. The vendors of fresh ingredients sell chicken, fish,
of each food group provided by the five types of vendor vegetables such as carrots and kangkong (also known as
outlined above: minimart; kiosk/store; warung; and water spinach), as well as tofu and tempeh. Those selling
street vendors. fresh ingredients are mostly static street vendors, and they
Table 5. Number of food providers by type of vendor
Location Mini-mart Kiosk/ Food stall Street vendor Total
store (warung)
Mobile Static
Main road In front of Kahatex factory 2 25 36 16 90 169
Factory workers’ housing area 1 123 19 68 52 244
Total 3 148 55 68 139 413
Table 6. Role of different food vendors in providing each type of food to surveyed women factory workers (% meal occasions as
recorded in food diaries) (N=304)
Minimart Kiosk/store Food stall Street vendor Total
(warung)
Mobile Static
Fresh ingredients 0 0 5.9 0 94.1 100
Fruits 0 5.9 5.9 23.5 64.7 100
Snack food 1.2 49.8 4.7 19.8 24.5 100
Main course 0 15.7 38.2 7.8 38.2 100
Drinks 0 16.7 12.5 25.0 45.8 100
RESEARCH PAPER IIED + HIVOS 21Unprocessed and fresh food sold by street
vendors in front of the Kahatex factory
are small in number (17 vendors or 4%), because employees was sold at the time of the survey at IDR9,000 (less than
at the Kahatex factory generally prefer ready-to-eat food. USD1); rice cake with chicken kari (curry) was IDR5,000;
Consumers who buy unprocessed food are usually Kahatex and chicken was sold at IDR3,000-4,000 per piece. Ready-
factory employees who are married and live with their wife to-eat vegetables packed in a plastic bag, such as vegetable
or husband and children. soup, processed cabbage, carrot, broccoli and beans, cost
IDR2,000. Protein foods, such as egg and fish, were sold
Ready-to-eat main courses generally have high carbohydrate
at IDR3,000. One serving of rice cost IDR3,000. Therefore,
content — dominated by rice, rice cake (lontong) and other
employees could buy a main course meal consisting of rice,
varieties of rice — together with cooked vegetables and
vegetables, tempeh, and egg for only IDR7,000 — around
protein such as fish. These meals are provided by static
USD0.50.
street vendors (46%) and warung (38%). Prices are relatively
low; for instance, one plate of rice with fish and vegetables
Fish rice with veg, tempeh and sour soup, Rp 9.000 Lontong chicken curry, Rp 5.000
Examples of main course dishes available from street vendors Steamed chicken intestine, Rp 5.000
around the Kahatex factory
RESEARCH PAPER IIED + HIVOS 22Some processed snacks sold by street vendors
Snacks are light food consumed between meals, including sold cookies, while 112 (44%) sold fresh snacks, usually
processed foods like chips, batagor (fried tofu meatballs), produced by the vendors themselves.
and cookies. However, sometimes snacks like noodle soup
Drinks such as milk, tea, coffee, juice, bottled water or
can replace a main meal.
other packaged drinks are sold by several vendors. The price
Fruit can also be categorised as a snack. Fruit vendors sell for fresh juice was quite high, at around IDR8,000. Those
fresh fruit whole or in pieces. Sometimes they also sell who wished to have juice at a cheaper price could choose
processed fruit, such as rujak (mixed fruits with peanut and a small packet (sachet) of juice for IDR3,000. Those selling
palm sugar sauce). these drinks comprised static street vendors (46%), mobile
street vendors (25%) and kiosks (17%).
Most processed factory-made snacks, such as cookies, are
available at stores or kiosks. 126 of all the vendors (50%)
Several types of snack available at kiosks or stores
RESEARCH PAPER IIED + HIVOS 23Change of shift outside the Kahatex factory
Food providers’ service times The start of the morning shift is a time of heavy congestion.
Workers generally eat before they go to work, during their The street in front of the Kahatex factory is only 4-6
break, when they return from work, and when they rest at metres wide. It is packed with workers entering the gate of
home. Their activities can be observed between shifts at the the factory or leaving the factory, as well as many street
Kahatex factory. There are three shifts at the factory: vendors. In addition, there are minibuses parked on the
street waiting for customers. This heavy congestion on the
•• Shift 1 (morning) from 7am to 2pm
road and walkways lasts until 8am when traffic begins to
•• Shift 2 (afternoon) from 2pm to 11pm, and ease. After 8am, the mobile street vendors leave the factory
•• Shift 3 (night) from 11pm to 7am. and move to housing areas and schools near the factory. This
is repeated at around 1-2pm during the break between the
In the morning, both warung and street vendors get ready
morning and afternoon shifts. The start of the evening shift
to start selling food at 5.30am. Street vendors start earlier
is much quieter than the start of the earlier shifts.
because they have to carry their goods from their home to
the factory. Workers tend not to have time for breakfast at As noted in Section 3, the main route which runs in front of
home, so they will buy food from vendors near or on the way the Kahatex factory, Jalan Gempol Sari, was designated as
to the factory. Some workers have breakfast or lunch at a a red zone, with vending prohibited, though the prohibition
restaurant and others take food to eat at the factory. was not being enforced.
Vendors with businesses in housing areas begin preparing the
day before; those who make fresh food start as early as 3am
to be ready to serve customers at 5.30am when the workers
leave for the factory.
RESEARCH PAPER IIED + HIVOS 243.3 Nutrition and diversity The MDD-W score has been shown to be a good predictor
It is clear that street vendors and informal food provision of adequacy of micronutrient intake in Bangladesh (Nguyen
are central to the food security of these young women. But et al., 2018).
what about the nutritional quality of this food? Food diaries
Most of the sampled female workers at the Kahatex factory
are not always a reliable record of overall nutrition because
(83%) had MDD-W dietary diversity scores of 7-10 out of 10,
quantities are self-reported (Bingham et al., 1994). But
and 98% of the group had consumed items from at least
diaries can be used to assess dietary diversity.
five out of ten defined food groups the previous day, which
Dietary diversity of female factory workers constitutes the threshold for minimum dietary diversity for
As described earlier, nutritious, good quality food does not women aged 15-49 years under the MDD-W (Table 7). This
have to depend on animal sources, which are relatively demonstrates that traditional food sources such as warung
expensive. Instead food diversity can ensure food quality provide very diverse food to those factory workers who are
and provision of micronutrients. There are internationally dependent on food prepared outside the home.
recognised indices for measuring dietary diversity, including
It is interesting to see what kind of food group most
the minimum dietary diversity for women of reproductive
respondents consume as measured in the dietary diversity
age (MDD-W), developed by the FAO (FAO and FHI 360, 2016)
score. Figure 5 shows the percentage of respondents who
based on ten food groups:
reported consuming different MDD-W food groups over
•• Starchy staples the preceding 24 hrs. The figure shows that all of the
•• Pulses respondents ate starchy staples, such as rice or noodles,
•• Nuts and seeds and either meat, poultry or fish. However, only 40% of the
•• Dairy female workers ate nuts and seeds. Consumption of dairy
•• Meat, poultry, fish could also be considered low (55%), perhaps due to cultural
•• Eggs habits or avoidance of milk products due to their high fat
•• Dark green leafy vegetables content. Other food groups consumed by a limited number
•• Other Vitamin A-rich vegetables and fruit of respondents (65%) were vegetables and fruits rich in
•• Other vegetables, and Vitamin A, such as papaya and mango.
•• Other fruit.
Table 7. Dietary diversity scores by age group in surveyed women factory workers, 2015 (n=303)
MDD-W dietary diversity score
Age group 3 4 5 6 7 8 9 10 TotalFigure 5. Consumption of different food groups by surveyed women factory workers (MDD-W groupings, 24hr recall using food
diaries, n=304)
100 99
100
95
91
90
78
Percentage of respondents reporting
80
75 76
70
65
60
55
50
40
40
30
20
10
0
Starchy Pulses Nuts and Dairy Meat, Eggs Dark Other Other Other
staples seeds poultry, green vitamin veg fruit
fish leafy A-rich
veg veg and
fruit
RESEARCH PAPER IIED + HIVOS 264. CONCLUSIONS AND
RECOMMENDATIONS
In common with many rapidly growing cities, street vendors The centrality of street vendors and informal food providers
and other informal food providers have a contested place to the food security of the working poor was uncovered in
in the development of Bandung. In its regulations, the city research among 300 mainly migrant female textile factory
has responded to the challenge with both hostility and workers in the Gempol Sari area close to the large PT
engagement. There are policies to restrict vendors’ presence Kahatex textile factory at the western edge of the city. The
in certain streets through zoning, and also policies to women themselves were involved in data collection, using
support relocation and formalisation of vending through the seven-day food diaries and 24-hour recall.
establishment of vendor centres.
Despite the limitations of using food diaries for assessing
The policy narrative has largely centred on the need for nutrition, the research showed that food stalls or warung
an end to traffic congestion and perceived public disorder are generally the most important source of nutrition for
on one hand, and the defence of vendors’ livelihoods on the female factory workers; static street vendors were
the other. With formalisation and vendor centres comes an also important at lunchtime, while mobile vendors were
additional objective of street food as a strategy to attract more dominant sources of food in the morning and at night
tourists to the city. The role of street vendors in urban time. Applying the FAO tool for assessing women’s dietary
food security and the food system of the working poor, diversity, we can see that the informal food system was
who are the backbone of Bandung’s economy, has largely providing these factory workers with a diverse diet at low
been overlooked. cost; the majority had dietary diversity scores of 7–10 out
of 10.
This research, conducted in two parts, set out to fill
that gap. The first part explored the nature of street Policy and advocacy implications
vending in Bandung — the business models of vendors and The recreational/leisure consumer is important for Bandung
their customer segments — from a qualitative survey in City tourism, and the city government’s relocation policy and
three districts of the city. The second part focused more promotion of food festival events are good for developing
empirically on street vendors’ role in the food and nutrition gastro-tourism in Bandung. But these policies do not benefit
security of low-income residents — in this case young low-income citizens’ food security. This research has shown
migrant women textile factory workers. that the food system of the working poor is supported by
thousands of street vendors and warung within the informal
The study found two quite distinct categories of street food
and semi-formal food economy. In common with other cities,
consumers: the recreational/ leisure consumer and the
municipal policy towards street vendors is undifferentiated.
subsistence consumer. The recreational consumer purchases
A one-size-fits-all policy for street vendors may fail to take
food from street vendors once or twice a week, spending
these different segments into consideration, and relocation
quite a large amount per visit. The subsistence consumer,
policy may negatively affect the food and nutrition security
on the other hand, purchases food from street vendors
of low-income workers. While they can create traffic
every day as their main food source. They eat street food
congestion and crowding during workers’ break times,
two to three times a day, spending IDR10,000 to IDR15,000
removing or relocating vendors to other areas would have
(USD 0.7-1.0) per visit. Our exploratory survey was small and
an impact on the availability of food for factory workers,
more research in this area is required. But these preliminary
because workers need access to food close to their place of
data suggest that street vendors have become the main food
work and residence.
source for this second type of consumer, contributing 50-80%
of their total food intake. Thus the nutrition and safety of
street food are important issues for this group.
RESEARCH PAPER IIED + HIVOS 27You can also read