When Segmentation is Not Enough: Rectifying Visual-Volume Discordance Through Multisensor Depth-Refined Semantic Segmentation for Food Intake ...
←
→
Page content transcription
If your browser does not render page correctly, please read the page content below
When Segmentation is Not Enough: Rectifying
                                         Visual-Volume Discordance Through Multisensor
                                         Depth-Refined Semantic Segmentation for Food
                                         Intake Tracking in Long-Term Care
                                         Kaylen J. Pfisterer1,2,3*+ , Robert Amelard4+ , Audrey G. Chung1,2 , Braeden Syrnyk5 ,
                                         Alexander MacLean1,2 , Heather H. Keller3,6 , and Alexander Wong1,2,3
arXiv:1910.11250v2 [cs.CV] 31 Mar 2021

                                         1 University of Waterloo, Waterloo, Systems Design Engineering, Waterloo, ON, N2L 3G1, Canada
                                         2 Waterloo  AI Institute, Waterloo, ON, N2L 3G1, Canada
                                         3 Schlegel-UW Research Institute for Aging, Waterloo, N2J 0E2, Canada
                                         4 KITE-Toronto Rehabilitation Institute, University Health Network, Toronto, ON M5G 2A2
                                         5 University of Waterloo, Waterloo, Mechanical and Mechatronics Engineering, Waterloo, ON, N2L 3G1, Canada
                                         6 University of Waterloo, Waterloo, Kinesiology, Waterloo, ON, N2L 3G1, Canada
                                         * kpfisterer@uwaterloo.ca
                                         + these authors contributed equally to this work

                                         ABSTRACT

                                         Malnutrition is a multidomain problem affecting 54% of older adults in long-term care (LTC). Monitoring nutritional intake in LTC
                                         is laborious and subjective, limiting clinical inference capabilities. Recent advances in automatic image-based food estimation
                                         have not yet been evaluated in LTC settings. Here, we describe a fully automatic imaging system for quantifying food intake.
                                         We propose a novel deep convolutional encoder-decoder food network with depth-refinement (EDFN-D) using an RGB-D
                                         camera for quantifying a plate’s remaining food volume relative to reference portions in whole and modified texture foods. We
                                         trained and validated the network on the pre-labelled UNIMIB2016 food dataset and tested on our two novel LTC-inspired plate
                                         datasets (689 plate images, 36 unique foods). EDFN-D performed comparably to depth-refined graph cut on IOU (0.879 vs.
                                         0.887), with intake errors well below typical 50% (mean percent intake error: -4.2%). We identify how standard segmentation
                                         metrics are insufficient due to visual-volume discordance, and include volume disparity analysis to facilitate system trust. This
                                         system provides improved transparency, approximates human assessors with enhanced objectivity, accuracy, and precision
                                         while avoiding hefty semi-automatic method time requirements. This may help address short-comings currently limiting utility of
                                         automated early malnutrition detection in resource-constrained LTC and hospital settings.

                                         Introduction
                                         Malnutrition has multidomain effects and should be monitored especially in older adults as evidenced by the clinical ramifi-
                                         cations (morbidity1 , decreased quality of life2 ), annual economic impact (USA $15.5 billion3 , UK £7.3 billion4 ), and high
                                         prevalence (23% malnourished5 ). In long-term care (LTC) homes, the prevalence is greater with malnutrition or risk for
                                         malnutrition affecting 54% of residents6 . Malnutrition and risk for malnutrition is primarily due to low food intake of residents7 .
                                         Thus, tracking and preventing poor food intake is paramount. However, we lack quality tracking methods for food and fluid
                                         intake, especially needed with multiple staff involved in the care of residents over the course of a day or week. While methods
                                         for measuring food and fluid intake exist, these methods are subject to self-reporting bias, negatively affecting both validity
                                         and accuracy8, 9 (e.g., errors up to: 400%, 24-hr recall; 50%, portion size10 ). In the LTC sector, personnel are mandated to
                                         report at-risk resident’s food and fluid intake; however, correct estimation of intake occurs only 44% of the time under routine
                                         conditions and as low as 38% of the time with delayed recording11 . As a result, trust in these measurements is low, with
                                         limited utility in practice but care providers would like to utilize this information if measurement reliability and trust in these
                                         measurements could be ensured12 .
                                             Automated tools may provide a time efficient and cost effective, and objective alternative. We previously established that
                                         the LTC sector requires a system that is reliable, accurate, cost effective and time efficient for measuring food and resulting
                                         energy, macro and micronutrient intake12 . However, before assessing food and fluid intake, three main questions must first be
                                         answered: where is there food (segmentation), what foods are present (classification), and how much food remains relative to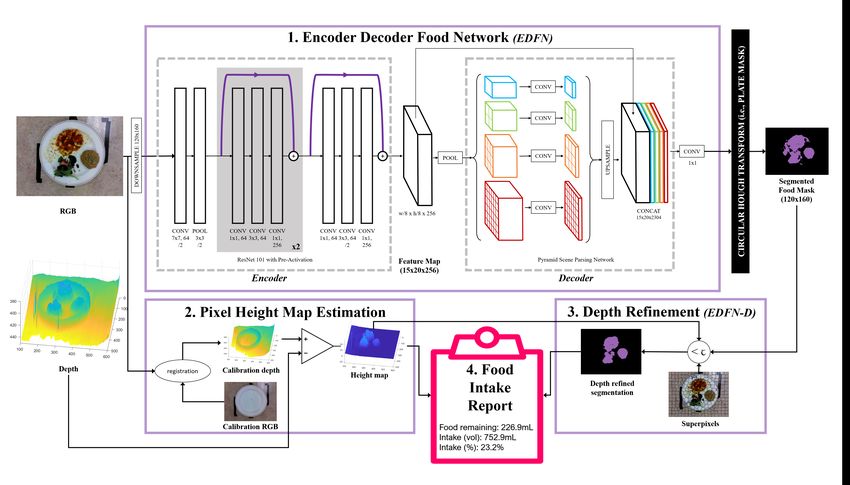
the initial amount (volume estimation)? For the purpose of this paper, we focus on the where (segmentation), and the how much
(volume estimation), as types of food items in LTC are well constrained through monthly menu-planning. Additionally, food
classification has received the most attention; reviews of the literature can be found elsewhere (e.g.,13–17 ).
    Food segmentation is a domain which is relatively unexplored. Existing food intake tracking systems rely on images from
multiple perspectives18, 19 , require a single image with a fiducial marker (i.e., reference object20, 21 ), or may not be suitable for
real-time monitoring(22 ). Others are limited to predicting food areas with a bounding box23 , require manual labelling for each
food item22 , or require manual selection of bounding boxes24 . These methods involve operator time and may impact accuracy.
For example, two operators may segment food differently, foods may be incorrectly labelled, or labels may be missed in some
cases. One semi-automatic method, interactive graph cut segmentation, has yielded strong accuracy in food segmentation24–26 .
It does not impart the same degree of burden as manual segmentation and we consider this as an “applied ground truth”.
However, interactive annotation graph cut27 requires user input to initialize the segmentation process (e.g., drawing areas to
keep or discard). Adding a few seconds per image within the LTC environment makes it prohibitive within this context.
    While food image segmentation progress has been made, error assessment in these systems tends not to be reported, or
segmentation is coupled with either classification22–25, 28–30 or volume26 , making sources of error difficult to disentangle. This
has practical implications as there is generally no way to systematically assess error propagation as part of the pipeline for
predicting nutritional outcomes. This results in the system operating as a “black-box”, which may limit the uptake of these
approaches in practice due to low perceived trust-worthiness. Beyond the user and ethical perspectives, several researchers also
describe the need for accurate segmentation methods for accurately predicting nutritional information (e.g., energy, macro-
/micronutrient content) down-stream in the pipeline21, 22, 29, 31 . Intersection over union (IOU) has been the most consistently
reported accuracy metric31–34 . IOU has several advantages over more traditional precision/recall metrics as it considers the
proportion of properly assigned pixels but also penalizes false positive predictions; however, it may not necessarily capture an
assessor’s perspective on what is relevant food (e.g., to include or not include crumbs).
    Food volume estimation systems are also relevant for estimating portion sizes of consumed food by subtracting the remainder
of food from the original portion size. Several attempts have been made using template shape matching28, 35–40 . Three main
drawbacks of these methods are the requirement of a shape library, difficulty with template matching with occlusions, and
varying preparation methods of the same food. For example, if a food is prepared differently it may not map onto the appropriate
shape model (i.e., 3D banana in peel may be in the library but sliced or diced banana may not). Similar to the segmentation
problem, others have applied a multi-image perspective or stereo reconstruction for volume estimation41, 42 or building a 3D
representation through point-cloud representation43 . The main drawback of these approaches is the time required to take the
photos from different perspectives or gather enough sample points scanned for an accurate 3D representation; lack of time is a
main concern when considering the LTC context. Another challenge of these approaches is accurate modelling/measuring of
highly textured foods. This is a particularly salient issue for LTC where modified textures are often prescribed as part of a
therapeutic diet so very different foods can appear similar (e.g., minced or pureed foods). Others have employed depth cameras
and structured lighting to map the topology of the foods22, 44–47 . One drawback of depth- and structured-light-only methods is
highly reflective foods (e.g., gelatin, soup) which can throw off the readings but they have an advantage at being more robust
against illumination variations47 . Despite the deep learning boom, acquiring adequately large and complete food datasets
for training and testing has limited progress48 . The few forays have been fairly early-stage as they contain either large mean
volume estimation errors (up to 400 mL error22 ), measure in terms of niche units (bread units tailored to diabetes49 ), or are
limited to a small number of or synthetic food items in a highly controlled environment (e.g.,50, 51 ).
    Recent reviews corroborate that further work is needed for developing an accurate, objective and cost-effective automated
system15, 17 and describe the need for more complex meal scenarios (i.e., beyond solid, separated foods, or synthetic foods)16, 17
and adequate statistical analyses of methods15 . In line with these opportunity areas and current human computer interaction
trajectories52 , we seek to improve trust and transparency by focusing on developing an explainable system which approximates
human assessors but with enhanced objectivity, accuracy, and precision. Specifically in this paper, we describe and evaluate
a novel fully automated depth-refined multisensor food intake tracking system. Here the depth-refined segmentation and
volume estimation have been decoupled to disentangle and assess potential sources of error. Through this decoupling, we
seek to enhance reliability for eventual integration with nutritional intake estimation, and to reduce potential barrier to uptake
in practice. We designed the segmentation system to be used in clinical settings (such as LTC or hospitals) with acquisition
consistent with LTC food and fluid intake visual assessment procedures. Our system is comprised of an RGB-D camera, a
novel deep convolutional neural network encoder-decoder food network (EDFN), fuses output from the EDFN with superpixel
processing, and incorporates depth information for enhanced segmentation and volume estimation. The use of a single RGB-D
camera brings simplicity over a multi-camera or multi-perspective set-up, reducing processing and acquisition time while
removing subjectivity in the assessment. We trained our EDFN on the UNIMIB2016 dataset53 and test it on two novel datasets
to reduce bias and enhance generalizability. The two novel datasets are 1) a regular texture foods dataset and, 2) a modified
texture foods dataset (e.g., pureed, minced). To the best of our knowledge, this is the first modified texture foods dataset used

                                                                                                                                 2/18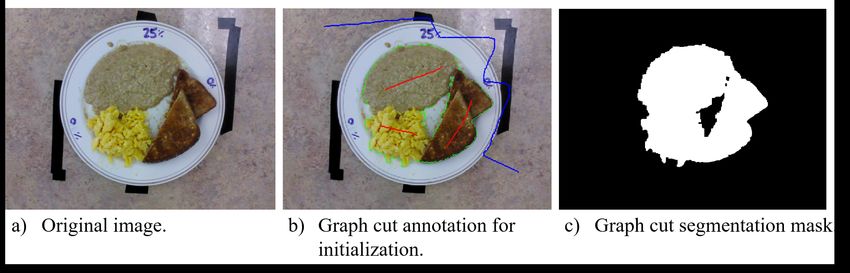
for segmentation or volume estimation. We conducted comprehensive analyses including IOU, 2D- and 3D- percent intake
error, absolute intake error, and mean intake error bias. We use ground-truth hand segmentation and comparison against an
“applied ground truth” through the graph cut semi-automated method. We supplement these analyses with volume disparities
to illuminate how segmentation strategies impact accuracy and under what conditions IOU may be insufficient to assess true
accuracy. Using this more holistic construct for assessment, we aim to enable trust in the system and document potential
circumstances and limitations of the system relevant to the LTC domain for early malnutrition detection via plate-by-plate food
consumption tracking.

Results
When solely considering intake using segmentation, the form factor of food inherently assumes depth is uniform across the
segmented portion. However, this approach fails to fully capture the context of food; we refer to this as the “visual-volume
discordance”. For example, consider one tablespoon (15 mL) of tomato sauce, this sauce could be piled relatively high into
a mound (i.e., representing relatively few plate pixels), or could be very thinly spread across the majority of the plate (i.e.,
representing many plate pixels). From a computer vision approach to segmentation, these two plates would yield extremely
different segmented areas while the absolute volume of the sauce would be the same. A human assessor is able to note there is
little sauce on the plate in either configuration. Depth-refinement, either as part of the segmentation pipeline or conducted
through relative changes in volume for food volume intake assessment, circumvents this issue by providing context beyond
the pixel count of a segment and brings assessment closer (but with higher precision and accuracy) to a human assessor. Now
consider what is deemed “ground truth” from hand segmentation of an image. Here, human assessors indicate where on the
plate there was food to generate the ground truth. However, considering segmentation accuracy in isolation misses important
context about how much food is present, which is the more pertinent question for assessing food intake. As such, we cannot rely
fully on classical segmentation accuracy for evaluating system performance since there can be a strong discordance between
visual (RGB) and volume (RGB-D) assessments. Volume consideration is particularly essential for estimating food intake when
accounting for the high prevalence of modified texture foods in LTC. While metrics pertaining to visual accuracy are most
synonymous with traditional assessments of segmentation accuracy (e.g., IOU), metrics pertaining to volume accuracy may be
more representative of true intake, especially for modified texture foods which have higher fluidity. Figure 1 provides a visual
analyses of the results taking into account these considerations while Table 1 provides a numerical summary of results. Data
are reported as (mean ± SD).

Regular Texture Foods
Food Segmentation Accuracy
Regarding the regular texture foods dataset, food segmentation accuracy was high for our proposed system without and with
depth-refinement (EDFN: 0.943 ± 0.047, EDFN-D: 0.918 ± 0.048). Our proposed, depth-refined system was comparable to
the no-depth and depth-refined graph cut implementations (GC: 0.955 ± 0.055, GC-D: 0.933 ± 0.060). Variance was similar
but slightly lower for our proposed EDFN and EDFN-D than GC and GC-D.

Segmentation Agreement
Segmentation agreement (IOU) was also good, and further improved through depth-refinement for our proposed system
(EDFN: 0.885 ± 0.069, EDFN-D: 0.927 ± 0.029). The graph cut IOU both without and with depth-refinement outperformed
our proposed methods owing to user-specified seed points (GC: 0.938 ± 0.036, GC-D: 0.941 ± 0.029). We attribute the
improvements of both our proposed system and our applied ground truth with depth-refinement to reduction in the visual-volume
discordance due to low-profile yet visually distinct foods on a plate, such as pasta sauce.

Percent Intake Error (2D and 3D)
Regarding 2D percent intake error (i.e., using segmentation alone), our non-depth-refined and depth-refined proposed systems
were outperformed by the depth-refined graph cut implementation (EDFN2D : -23.4% ± 21.2, EDFN-D2D : -16.5% ± 17.6,
GC2D : -6.8% ± 13.5, GC-D2D : -5.3% ± 12.7). These negative values, which were improved with depth-refinement, imply
a bias towards under-segmenting an image. Refer to the discussion for clinical implications of this bias towards under-
segmentation. Regarding the 3D percent intake error, the graph cut implementations outperformed our proposed system
(EDFN3D : -9.1% ± 8.8, EDFN-D3D : -9.0% ± 8.9, GC3D : 0.4% ± 1.3, GC-D3D : 0.4% ± 1.3).

Volume Estimation Accuracy
Regarding the volume error (mL) on the regular texture dataset, while initially it appeared depth-refinement worsened
performance across methods (EDFN: -14.7 mL ± 50.0, EDFN-D: -17.2 mL ± 50.3, GC: 0.0 mL ± 7.1, GC-D: -1.8 mL ± 6.9),
the plate-level absolute volume error was improved with depth refinement and variance was much smaller (e.g., EDFN-D
volume intake error -130.2 mL ± 154.8; EDFN-D mean absolute error 18.0 mL ± 50.0). However, intake error from volume was

                                                                                                                           3/18
Figure 1. Visual comparison of proposed method (EDFN) and our “applied ground truth” (GC) both without and with depth-refinement (EDFN-D, GC-D). Examples
span both regular and modified textures and illustrate a) plates with high visual-volume discordance, as well as b) examples where depth-refinement rectified oppositional
segmentation compared to human assessor. IOU is shown in black bold at the top of the frame while volume error (mL) is indicated in white text at the bottom of each
frame; negative volume error implies under-segmentation (i.e., over-estimation of intake).
4/18Table 1. Comparative analyses of system performance within and across LTC datasets between our proposed method (EDFN, EDFN-D) and the “applied ground truth”
graph cuts (GC, GC-D). % error intake refers to the proportion of segmented pixels calculated using the predicted estimate minus the target ground-truth hand segmented
regions; 2D: no-depth, 3D: with depth-refinement.
Dataset Segmentation accuracy Intake accuracy Volume estimation accuracy (mL)
Method GSA FSA IOU 2D % intake error 3D % intake error Mean absolute error Mean error bias Volume intake error
Regular texture foods
EDFN 0.973 (0.018) 0.943 (0.047) 0.885 (0.069) -23.4 (21.2) -9.1 (8.8) 17.1 (49.2) -14.7 (50.0) -129.2 (154.3)
EDFN-D 0.984 (0.012) 0.918 (0.048) 0.927 (0.029) -16.5 (17.6) -9.0 (8.9) 18.0 (50.0) -17.2 (50.3) -130.2 (154.8)
GC 0.987 (0.009) 0.955 (0.055) 0.938 (0.036) -6.8 (13.5) 0.4 (1.3) 4.5 (5.5) -0.0 (7.1) 1.8 (6.6)
GC-D 0.988 (0.005) 0.933 (0.060) 0.941 (0.029) -5.3 (12.7) 0.4 (1.3) 4.6 (5.4) -1.8 (6.9) 0.2 (6.5)
Modified texture foods
EDFN 0.990 (0.011) 0.922 (0.165) 0.846 (0.114) -44.0 (38.6) -0.8 (5.2) 2.8 (3.1) 1.7 (3.8) 0.3 (3.6)
EDFN-D 0.991 (0.014) 0.697 (0.348) 0.819 (0.166) -16.5 (20.0) 1.4 (5.9) 2.3 (3.2) -0.7 (3.9) 0.8 (3.6)
GC 0.995 (0.006) 0.834 (0.157) 0.898 (0.082) -27.4 (25.5) 0.7 (3.1) 2.2 (2.7) -1.9 (2.9) -0.9 (3.3)
GC-D 0.991 (0.013) 0.656 (0.328) 0.819 (0.165) -14.5 (18.1) 2.1 (4.6) 3.2 (3.4) -3.1 (3.5) -0.5 (3.4)
All foods
EDFN 0.981 (0.017) 0.934 (0.116) 0.867 (0.094) -32.8 (32.0) -5.3 (8.5) 10.8 (37.4) -7.4 (38.2) -71.4 (131.7)
EDFN-D 0.987 (0.013) 0.819 (0.259) 0.879 (0.125) -16.5 (18.7) -4.2 (9.2) 11.0 (38.1) -9.9 (38.4) -71.8 (132.3)
GC 0.991 (0.008) 0.901 (0.128) 0.920 (0.064) -16.2 (22.3) 0.5 (2.3) 3.5 (4.6) -0.8 (5.7) 0.6 (5.6)
GC-D 0.990 (0.010) 0.809 (0.262) 0.887 (0.127) -9.5 (16.1) 1.1 (3.3) 4.0 (4.7) -2.4 (5.7) -0.1 (5.3)
Values are (mean ± SD) GSA: Global segmentation accuracy, FSA: Food segmentation accuracy, IOU: intersection over union.
Table 2. Summary of volume estimation accuracy across portion sizes for the modified texture foods dataset across our proposed EDFN and EDFN-D.
Dataset Segmentation accuracy Intake accuracy Volume estimation accuracy (mL)
Portion GSA FSA 2D % intake error 3D % intake error Mean absolute error Mean error Volume intake error
EDFN (no-depth-refinement)
P1 0.996 (0.003) 0.970 (0.066) 0.0 (0.0) 0.0 (0.0) 3.3 (3.4) 2.0 (4.3) 0.0 (0.0)
P2 0.994 (0.006) 0.965 (0.089) -30.2 (17.2) -0.8 (8.0) 3.0 (3.1) 2.1 (3.8) -0.1 (3.3)
P3 0.992 (0.009) 0.941 (0.125) -50.1 (23.5) -0.9 (5.3) 2.9 (2.9) 1.9 (3.6) 0.1 (3.7)
P4 0.987 (0.013) 0.912 (0.176) -68.0 (35.3) -1.1 (5.6) 3.0 (3.2) 1.4 (4.2) 0.6 (4.5)
P5 0.982 (0.014) 0.821 (0.254) -71.9 (43.4) -1.0 (3.8) 2.0 (2.6) 1.1 (3.1) 0.9 (4.6)
EDFN-D (depth-refined)
P1 0.996 (0.004) 0.945 (0.074) 0.0 (0.0) 0.0 (0.0) 2.6 (3.3) 0.1 (4.3) 0.0 (0.0)
P2 0.994 (0.010) 0.908 (0.132) -22.8 (17.5) 0.3 (8.7) 1.9 (3.0) 0.0 (3.6) 0.1 (3.3)
P3 0.992 (0.013) 0.824 (0.162) -30.6 (17.5) 1.4 (6.3) 2.3 (3.5) -0.5 (4.1) 0.7 (4.2)
P4 0.987 (0.018) 0.640 (0.275) -25.2 (20.1) 2.8 (6.6) 2.9 (3.8) -1.7 (4.5) 1.8 (4.4)
P5 0.986 (0.016) 0.157 (0.262) -3.9 (16.2) 2.3 (3.5) 1.7 (2.2) -1.5 (2.4) 1.6 (4.0)
Values are (mean ± SD) GSA: Global segmentation accuracy, FSA: Food segmentation accuracy, IOU: intersection over
union.
5/18high and both our proposed system and graph cut implementations (EDFN: -129.2 mL ± 154.3, EDFN-D: -130.2 mL ± 154.8,
GC: 1.8 mL ± 6.6, GC-D: 0.2 mL ± 6.5). Corroborated by the negative mean error bias for EDFN and EDFN-D, we empirically
attribute this wide variance and high intake error paired with low plate-level absolute volume error to salad. As intake error is
calculated with a plate relative to the full portion, variability in a food’s appearance could be high leading to high intake error,
with accurate absolute volume. Salad, as part of the lunch plates had low-density with widely varying degrees of air pockets
between leaves of lettuce at each plating. Depending on how “fluffy” the salad was put into position, it could take on differing
volumes. This is discussed in detail later.
Modified Texture Foods
Food Segmentation Accuracy
Regarding the modified texture foods dataset, food segmentation accuracy was high for our proposed system, however depth-
refinement reduced the accuracy based on classical segmentation accuracy calculations (EDFN: 0.922 ± 0.165, EDFN-D:
0.697 ± 0.348). In both cases however, our proposed system outperformed the graph cut analogs (GC: 0.834 ± 0.157, GC-D:
0.656 ± 0.328. Depth-refinement brings the context of volume, whereas the initial ground-truth hand segmentation used for
comparison was based solely on visual appearance of food on the plate. Modified texture foods by nature tend to spread out
more due to increased fluidity and as such, are at greater risk for the visual-volume discordance.
Segmentation Agreement (IOU)
Compared to the regular texture food dataset, segmentation agreement (IOU) was adequate (over 0.80) and relatively unaffected
by depth-refinement. Our proposed system was slightly outperformed by the graph cut implementation on IOU, with the graph
cut variance smaller in non-depth-refined segmentation (EDFN: 0.846 ± 0.114, GC: 0.898 ± 0.082). Our proposed method
was comparable to graph cut for the depth-refined counterparts (EDFN-D: 0.819 ± 0.166, GC-D: 0.819 ± 0.165).
Percent Intake Error (2D and 3D)
Regarding the 2D percent error of intake, non-depth-refined implementations had unacceptably high percent error of intakes
(EDFN2D : -44.0% ± 38.6, GC2D : -27.4% ± 25.5) with unacceptably wide variances still present in depth-refined implementa-
tions (EDFN-D2D : -16.5% ± 20.0, GC-D2D : -14.5% ± 18.1). This provides additional evidence to support the need to rectify
the visual-volume discordance, especially in modified texture foods where visually salient food remnants are more likely to
remain on the plate after consumption. Depth-refinement had a minimal impact on percent intake error for all implementations
yielding very low error in estimating volume intake error (EDFN3D : -0.8% ± 5.2, EDFN-D3D : 1.4% ± 5.9, GC3D : 0.7% ± 3.1,
GC-D3D : 2.1% ± 4.6). Again, negative intake implications are addressed in the discussion.
Figure 2 depicts these visual-volume discordance errors and illustrates how depth-refinement (black lines) both reduced the
variance of the percent intake errors as well as reduced the relative intake error compared to the non-depth-refined counterparts
(red) and using P1 as the reference “full-portion”. Across methods, error tended to increase as the remaining portion size
diminished with the exception of EDFN-D (2D) with error peaking at the third portion and receding across portions P4 and P5.
We attribute this trend to depth-refinement compensating for higher degrees of visual-volume discordance on plates more likely
to have smearing (i.e., plates with less on the plate relative to the initial portion size). This highlights why visual representation
context of where food resides is inadequate and how additional depth context pertinent to how much food is present is required
particularly for modified texture foods.
Volume Estimation Accuracy Across Portion Sizes
Typically, volume errors, as well as volume intake errors, were low (less than 4.0 mL) across EDFN and GC implementations
as shown in Table 2. To supplement this using our proposed EDFN and EDFN-D, Figure 3 shows volume accuracy across each
of the 5 portions (P1-P5) relative to the volume across the ground-truth hand segmented food regions. While our EDFN-D
implementation was more accurate, it had similar precision to EDFN. A similar trend in reduced error in mL across smaller
portions was observed for both EDFN and EDFN-D albeit with EDFN-D error shifted downwards. With EDFN-D, the three
smallest portions (P3, P4, P5) had negative values indicating the depth-refinement omitted depth values across additional pixels
relative to the initial segmentation and yielded a slight under-segmentation of food.
Discussion
Our proposed fully automatic system imparts a reduced processing burden compared to semi-automatic segmentation. Using
graph cuts as our “applied ground-truth”, task completion time represents an additional point for consideration, and our
automated approach provides a key advantage in the food and nutrition tracking context. Empirically, user-defined seed
initialization for graph cut implementation incurred approximately 5 seconds of manual annotation time per image. Assuming
192 residents across 6 neighbourhoods (units) in LTC, this implies 48 additional minutes during a meal-service simply to
annotate the images. The average time for charting residents’ food intake for a day is already at least 270 minutes12 , which
6/18Figure 2. Intake accuracy of our proposed method without (EDFN, red) and with (EDFN-D, black) depth-refinement on the
modified texture foods dataset. 2D refers to two-dimensional % intake error in terms of the proportion of pixels estimated
compared to the ground-truth hand segmentation of food areas. 3D refers to three-dimensional % intake error in terms of the
relative volume across the estimated food segment compared to the volume across the ground-truth segmentation of food areas.
Here, P1 is the reference plate with P2-P5 representing simulated degrees of increasing intake (i.e., P5 most eaten).
Figure 3. Volume error of the modified texture dataset, in millilitres, of our proposed method without (EDFN) and with
(EDFN-D) depth-refinement compared to the volume across the ground-truth hand segmented food area. P1 is the reference
plate with P2-P5 representing simulated degrees of increasing intake (i.e., P5 most eaten).
7/18implies that annotation could impart an 18% time increase to complete food intake charting. This approach is infeasible and
prohibitive within this context. Instead, compared to the graph cuts method which had a tendency to under-segment food, our
proposed automatic segmentation method requires minimal additional time commitment from the user enhancing its potential
for uptake in the field.
Segmentation errors (under- or over-segmentation) have clinical significance for identification of inadequate intake before
low intake progresses to eventual malnutrition. Estimated intake could be incorrect due to either under-estimating food
consumption (i.e., less food reported than actually consumed) or over-estimating food consumption (i.e., more food reported
than actually consumed). Over-segmenting food areas (i.e., under-estimating intake) implies the predicted food area is
over-estimated and translates to reporting that there is more food present (less food intake) than what is true. Conversely,
under-segmenting food areas (i.e., over-estimating intake) implies the predicted food area is under-estimated and translates to
reporting there is less food present (more food intake) than there is. Over-segmentation (under-estimating food consumption)
may be the lesser of two evils for the majority of LTC residents; if food intake is better than what is reported, residents at-risk for
malnutrition may be less likely to be missed. Clinically, residents receiving modified texture foods consume significantly fewer
calories, have higher cognitive impairment, and require more assistance with activities of daily living than residents on regular
texture diets54 making these even higher-risk residents. However, under-segmentation (over-estimating food consumption),
increases risk of missing residents with nutrient inadequacies through introducing false negatives and potentially missing
residents with poor food intake that could result in malnutrition. While under-reporting may lead to increased referrals for
malnutrition screening, most at-risk residents who eat very little would still be identified which might help to identify residents
who could benefit from a dietary intervention.
It appears segmentation is not enough and there is a need for additional context from volume. We observed that under-
segmentation was an issue mostly with 2D % volume intake across implementations and datasets. We evaluated 2D % volume
intake for consistency with existing methods, however, the system’s 3D intake estimation is preferred whenever possible.
Additionally, returning to Figure 2, this plot showcases the need for methods beyond segmentation for food intake tracking.
While we observed a decrease in 2D % intake error with depth-refinement across the remaining plate portions, errors for P2,
P3, and P4 were more than 20%. A system based on segmentation methods alone may be accurate when very little food is
consumed or nearly all the food is consumed. Certainly, there is value in improved accuracy for these edge-cases55 . However,
were we to rely on a system without-depth refinement, this degree of error may be deemed inappropriately high and be a barrier
to uptake. Further refinements from depth-refined volume estimations yielded additional improvement in 3D percent error
intake and may provide a palatable alternative within an acceptable error margin of less than 10% (where current practice is up
to 62% error11 ; 50% for portion size10 ) with the added benefit of more fine-grained assessment (continuous measurement versus
25% incremental bins). While we also observed negative values for volume intake error for our proposed system, EDFN-D,
this error was largely due to salad. It appeared as though GC seemed to understand the visual representation of salad better
than our proposed method. We suspect this could be improved with additional instances of salad included in the training and
validation set. Green vegetables in general were under-represented in UNIMIB2016 and provides an opportunity area for
additional comprehensive food intake tracking databases. Whereas the volume intake error for the regular texture foods which
included salad was on the order of 130 mL, the modified texture foods circumvented the low density foods problem with volume
intake error of 0.8 mL. Arguably, accuracy on these modified texture foods is more clinically relevant for at-risk residents.
Additionally, building in some depth redundancy may better approximate a human assessor and improve initial acceptability.
Perhaps more pertinent to uptake of the system and recurring use of the system is how the computer “sees” food on a plate
and how this compares to the human experience for supporting trust in the automated system. For example, from the human
assessor perspective, a plate containing sauce remnants would be ignored and treated as completely consumed food while the
computer vision approach would observe each of the pixels containing sauce remnants and mark it as still containing food as in
the case of Figure 1. This may lead to distrust in the system because the system makes decisions differently and in opposition
to how a human assessor would classify the presence of food. Borrowing from clinicians perceptions of artificial intelligence
tools, the alignment between the system output and what would be expected from a human’s interpretation is essential for
continued use56 . By incorporating depth-refinement, even though the IOU for modified texture foods decreased, it brings the
assessment closer to how a human would interpret a plate with the added benefits of greater precision and objectivity. This area
has been largely unexplored because, with one exception, available food datasets only include full plates (see Supplementary
Materials for an overview of available food datasets). For measuring food intake, additional application appropriate metrics
such as intake error and volume estimation accuracy must be considered since assessing system performance solely from a
segmentation accuracy perspective can be misleading.
While our proposed system is not error-free, it is significantly more accurate than current LTC methods. As aforementioned,
current LTC home food intake accuracy shows correct estimation of intake occurring as low as 38% of the time11 and when
portion size is mis-estimated, has error up to 50%10 . Part of the issue, in practice, may be that the granularity of these estimates
is also wide since estimates are recorded as 25% incremental food intake bins57, 58 . This may introduce further subjectivity
8/18between assessors. Hypothetically, one human assessor may estimate a plate to be 30% eaten so a value of 25% would be
recorded; another assessor may estimate intake at 45% reflecting a record of 50% consumed. With depth-refinement, our
proposed EDFN-D removes this subjectivity, operates on a continuous scale, and has a mean 3D % intake of estimation error of
-4.2% across both datasets and a mean volume intake error of 0.8 mL on the modified texture foods dataset.
To further improve reliability and consistency of the system, negative volume errors and the issue of low-density foods
should be considered. For the proposed EDFN-D, the volume errors for plates after the highest intake (P4 and P5) were negative
because the depth-refinement omitted volumes across pixels that were initially segmented as food. As part of future work, it
would be interesting to explore how necessary initial colour-based segmentation is for establishing how much food is present or
whether placing greater weight on depth maps could improve accuracy for volume estimation accuracy. Given the issue of
low-density foods impacting volume regardless of segmentation method, this must be considered a limitation of over-head food
intake systems and these types of foods (e.g., potato chips, salad) may need to be treated differently and separately to other
foods. Perhaps repeat imaging of these foods separately, flattening the food before imaging, or applying a general food density
score to estimate the range of volume values in these foods could address this limitation.
In summary, we proposed an application-driven design for a novel fully automatic multisensor segmentation system which
leverages depth-refinement for improved accuracy. We assessed our system on two representative LTC food intake datasets
which included simulated intake plates since current datasets contain only full-plate portions or do not contain pixel-level
segmentations. For further advancing the field, additional food intake datasets with pixel-level segmentation are needed. A
system such as the one presented here which approximates a human assessor but is objective, faster, more consistent, and can
more accurately quantify food intake measurements may provide a valuable step towards automated tracking of food and fluid
intake within the LTC sector.
Methods
Data Collection
Data were collected in an industrial research kitchen which conforms to LTC kitchen standards. We constructed an image
acquisition system that enabled top-down image capture. We imaged 36 foods representative of LTC where 9 were regular
texture foods listed as options on a LTC menu comprising our novel “regular foods” dataset. A set of 63 modified texture food
samples representing 27 unique foods were prepared by a LTC kitchen (The University Gates, Schlegel Villages) and either
minced or pureed comprising our “modified texture foods” dataset. During image acquisition, the room temperature varied
from 20.6◦ C to 22.5◦ C. Images were saved to a computer for model training and evaluation. For a summary of the types and
representation of foods imaged, see Table 3.
Regular Texture Foods Acquisition
Three representative meals each consisting of three food items (breakfast: oatmeal, toast, eggs; lunch: pasta, salad, cookie; and
dinner: meatloaf, mashed potatoes, corn) were selected from an LTC menu and imaged as part of this data collection series.
Each plate was assembled with up to three food items. One full serving of each food item was defined by the nutritional label
serving size.
Plates were imaged at every permutation of 0%, 25%, 50%, 75%, 100% of each food item consumed. Here, 0% corresponds
to the initial, largest mass portion (P1), and 100% corresponds to no amount of that food component remaining (P5). The largest
mass portion, P1 was deemed a “full” portion with P2-P5 representing smaller and smaller masses. These 25% incremental
bins were selected based on standard dietary intake record forms used in LTC59, 60 . This yielded 125 unique plates per meal
(375 unique plates). Foods were selected to be representative based on a LTC menu.
Modified Texture Foods Acquisition
We imaged 63 food samples (56 unique + 7 duplicates) representing 27 unique food items. Each set of samples for a given
unique food contained at least one example of a modified texture (i.e., minced, pureed or both) either imaged fresh, after being
held at serving temperature, or both. Holding food at serving temperature is standard practice in LTC serveries as meal items
are prepared in advance of meal service. Each food sample was imaged at 5 different portions (P1-P5), with one exception
containing 4 portions, by progressively removing some of the sample with a spoon to simulate varying degrees of leftovers for a
total of 314 images. The largest mass portion, P1, was deemed a “full” portion for intake purposes, with P2-P5 representing
smaller and smaller masses. Foods were representative of a typical LTC menu as they were prepared by the LTC kitchen and
represented a variety of fruits, vegetables, pastas, soup, and meat dishes.
Imaging System for Food Volume Estimation System
The goal was to estimate volumetric food intake from RGB-D images of food on a plate. We developed a deep convolutional
neural network (DCNN) for generating food segmentation maps, which was refined using depth heuristics and combined with
9/18Table 3. Imaged foods represented in each of the regular texture foods dataset and the modified texture foods dataset. Regular
texture foods were derived from LTC menus and imaged with three foods per meal (breakfast: oatmeal, toast, scrambled eggs;
lunch: tortellini, salad, cookie; dinner: meatloaf, potatoes, corn) at every 25% incremental amounts of each food item relative
to the full portion. Modified texture foods were imaged separately with at five incrementally smaller portions.
Food component Regular texture foods Modified texture foods
Grains
Oatmeal Macaroni salad
Whole wheat toast Vegetable rotini
Cheese tortellini with tomato sauce Bow tie pasta with carbonara sauce
Vegetables and fruits
Mixed greens salad Sweet and sour cabbage
Corn Red potato salad
Mashed potatoes Seasoned green peas
Strawberries & bananas
Stewed rhubarb & berries
California vegetables
Baked polenta/garlic
Sauteed spinach & kale
Mango & pineapple
Asian vegetables
Greek salad
Proteins
Scrambled egg Braised beef liver & onions
Meatloaf Teriyaki meatballs
Baked basa
Tuna salad
Hot dog wiener
Braised lamb shanks
Salisbury steak & gravy
Mixed dishes
Oatmeal cookie Lemon chicken orzo soup
English trifle
Eggplant parmigiana
Orange ginger chicken
Blueberry coffee crumble cake
Barley beef soup
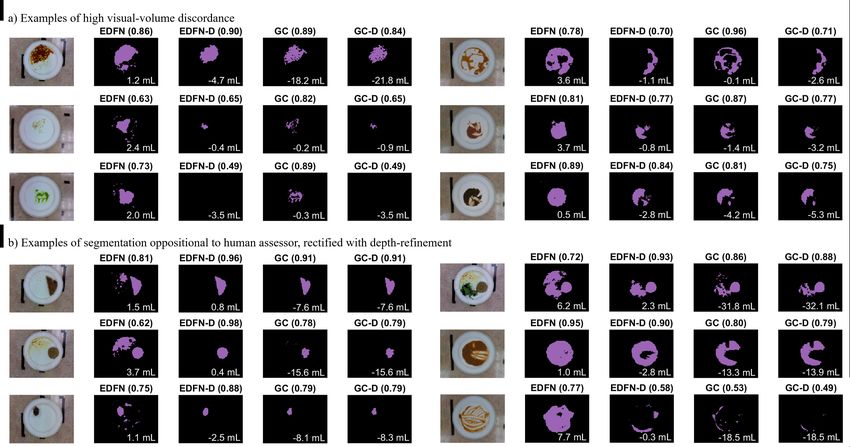
10/18Figure 4. System diagram of the proposed deep food segmentation network comprised of: 1) encoder-decoder food network (EDFN) consisting of a residual encoder
microarchitecture61 and a pyramid scene parsing62 decoder microarchitecture which outputs a segmented food mask; 2) pixel height map estimation for assessing food
depth; 3) depth refinement which outputs a depth-refined food mask (EDFN-D); and 4) food intake report summarizing the volume of food on the plate, the intake amount
(in mL) and the intake percent.
11/18calibrated pixel-wise food heights to estimate food consumption (in mL). Figure 4 shows a visual representation of the system
diagram. The following subsections describe the primary subsystems in more detail.
Encoder Decoder Food Network (EDFN) Architecture
Inspired by the success of encoder-decoder networks for semantic image segmentation63 , we designed the macroarchitecture
of the proposed food segmentation DCNN as a multi-scale encoder-decoder network architecture tailored for downsampled,
pixel-level semantic segmentation of food images. Figure 4 shows the network architecture, which consists of a residual encoder
microarchitecture, a multi-scale hierarchical decoder microarchitecture, and a final high-resolution, per-pixel classification layer
for producing a food segmentation map. The residual encoder microarchitecture is responsible for encoding RGB images into a
set of feature maps describing the objects in the image. The encoder feature map outputs are then processed through the decoder
microarchitecture which parses the scene at multiple spatial scales. These multi-scale representations were concatenated to the
feature map outputs, and a 1x1 convolutional layer was trained to output a two-class per-pixel segmentation map.
For the residual encoder microarchitecture, we leveraged a spliced ResNet101 architecture with pre-activation61 . The
ResNet101 architecture was chosen because of its powerful representational capability for learning discriminative feature
representations from complex scenes. We leveraged the notion of transfer learning by beginning with a ResNet101 network
architecture designed for classification, trained on the ImageNet dataset of natural scenes64 , and splicing off the deeper
ResNet101 layers to create the final encoder microarchitecture. More specifically, we splice at the third unit of the first residual
block62 , leading to the proposed residual encoding microarchitecture, which encodes 120×160 RGB images into 256 15×20
feature maps. As such, the image was fed through a 7×7 convolutional layer with 64 kernels and a stride of 2. Then, a
3×3 max pool with stride of 2 was performed to downsample the image. These representations were fed through the first
ResNet101 block, consisting of 64 1×1 convolution, 64 3×3 convolution, and 256 1×1 convolution layers three times, with
skip connections after every set of 3 layers. The last 3×3 layer was downsampled using a stride of 2. Thus, the encoder
microarchitecture outputs 256 feature maps at 1/8 the input image size.
The decoder microarchitecture of the proposed food segmentation network was designed to decode the feature maps from
the encoder microarchitecture into hierarchical global priors using a region binning scene parsing network architecture design.
It is well known that multi-scale context aids pixel segmentation65 which is particularly relevant within the context of food. As
humans observing food, there are two main components: the colour and the texture of the food. Texture also varies across
scales (i.e., food has a hierarchical visual nature to it). To account for the multi-scale context of food, we leveraged a pyramid
scene parsing network (PSPNet)62 which was connected to the feature outputs from the encoder microarchitecture. As such,
the PSPNet decoder microarchitecture performs analysis across four spatial scales, which adds information representing the
underlying feature representation and provides local-to-global context of the plate of food. The feature maps were fed into
four parallel max-pool layers, with bin sizes of 1×1, 2×2, 3×3, and 6×6. The upscaled hierarchical global prior outputs were
concatenated to the encoder feature maps and two class (food or not food) pixel-level segmentation was performed using a 1×1
convolution layer. A circle Hough transform66 was used to mask the plate from the table, eliminating detection of food outside
the plate boundaries (e.g., on tables with complex patterns).
Training and Validation Dataset Selection
Evaluating the appropriateness of training and validation dataset selection for application to food intake assessment in LTC
requires several considerations:
• Colour: Food comes in many colours. Part of supporting a healthy diet includes the mentality of “eat a rainbow” to
ensure various micronutrient needs in additional to macronutrient needs are met67 . As such, there should be a wide
distribution of colours naturally found in foods captured in the training and validation datasets.
• Texture: Similar to colour, foods also inherently come in a variety of textures. This aspect is particularly salient when
considering the LTC population where 47% of residents receive modified texture diets (e.g., minced, pureed) as part of a
strategy to address the high prevalence of swallowing difficulties pervasive in LTC68 .
• Portion: Given the application to food intake assessment, the ideal training dataset would have representative intake
images that include both before and after images of meals (i.e., not just full portions of served food). The rationale is
by having more representative examples of what foods can look like partially, or fully disassembled in the case of food
mixing, in the training dataset, the network will be more likely to learn representative examples of foods apart from the
original served context.
• Orientation: The occlusion conundrum where one food occludes another is very difficult to circumvent especially
in the LTC environment when taking multiple images from many perspectives is infeasible due to time constraints.
For the purpose of acquisition “in the wild” within LTC, images taken from the above configuration is preferred to
facilitate volume estimation and down-stream nutritional intake estimation. The issue of occlusion (e.g., seeing only
12/18the bun as part of an assembled hamburger) remains an issue, however is reasonable when accepting the assumption
that complex foods (e.g., foods with multiple components like a hamburger) are eaten in similar proportions. While this
is an undoubtedly fallible assumption, errors in down-stream nutritional estimation are constrained to a specific food
as opposed to influencing the entire plate. As such, the ideal training and validation database would be acquired in the
top-view configuration.
• Label level: To facilitate volume estimation and down-stream nutrient estimation, image segmentation must be conducted
pixel-wise as opposed to using bounding boxes. As such, the ideal training and validation database would be labelled at
the pixel-level.
• Style: Multiple food items on a plate is common in LTC as the “family style” approach to eating has been shown to
enhance food intake69 . While multiple plates may also be used in LTC (e.g., soup, side salad, dessert), the training and
validation dataset would ideally show representation consistent with “family style” as opposed to solely “single item”
plates.
• Accessibility: The ideal dataset needs to be readily available (i.e., non-proprietary).
Based on the above considerations, the most imperative are orientation and label level and the most suitable food database
available for training and validation for LTC (i.e., top-view with pixel-wise labelling) is therefore UNIMIB201653 . Refer to
Supplementary Materials for a compilation of popular food databases with a summary of rationale for selecting UNIMIB2016.
Training
We trained the proposed encoder-decoder food network (EDFN) on the UNIMIB2016 food dataset (1027 tray images, 73
categories), which contains per-pixel ground-truth segmentation53 . The encoder weights were frozen to conserve deep
computational feature extraction from large robust datasets, and only the decoder weights were optimized. The UNIMIB2016
dataset was chosen due to its food variety, overhead view, and pixel-level segmentation annotation. Additionally, since our
method was driven by LTC application requirements with data collection in a specific manner, we needed a dataset that was
similarly acquired (e.g., pixel-wise annotation, not bounding boxes) so training/fine-tuning could be accomplished without
bias by our novel LTC test datasets. While our LTC test datasets comprise a representative sample albeit with relatively few
food groupings, training on the UNIMIB2016 dataset with 76 food categories enhanced generalizability. Downsampling was
conducted to align the spatial feature sizes of the encoder and decoder microarchitectures with the UNIMIB2016 dataset53 . The
UNIMIB2016 data were resized to match our image height/width which were at the same aspect ratio (4:3). This resizing to
120x160 images provided two key advantages: (1) computation reduction, (2) better scaled kernels for the image size. We
empirically observed that there was not enough global context at the original resolution, resulting in the middle of foods getting
misclassified. By downsampling our image, the network was able to identify primary low-level features instead of getting stuck
in the texture of the food and could be successfully decoded by the pyramid scene parsing decoder microarchitecture. The
UNIMIB2016 data were randomly split into training and validation subsets (80%/20%). Since all UNIMIB2016 plates were
placed on the same tan colored tray, we found that the machine learning model inappropriately learned that the tray colour was
always indicative of non-food. Thus, we performed data augmentation on the UNIMIB2016 data by randomly rotating the hue
channel of each image’s background (non-food) pixels and adding it to the dataset, thus effectively doubling the training and
validation datasets. The network was trained using batch size 32 using RMSProp optimizer with softmax cross-entropy loss, a
learning rate of 0.0001 and a decay of 0.995. The network was trained over 200 epochs, and the best model according to the
validation loss was kept.
Segmentation Depth-Refinement
The generated food segmentation map from EDFN is based solely on visual information, and is thus privy to visual-volume
discordance. We therefore developed a heuristic for excluding labeled food areas that are irrelevant to food consumption (e.g.,
pasta sauce remnants). To do this, co-aligned depth maps were acquired synchronously with the RGB images for the plate
under analysis as well as an empty calibration plate.
Ten depth maps were averaged for each acquisition to account for measurement noise. The calibration depth map dC was
registered to the plate depth map dP to account for any changes in camera-plate orientation between calibration and plate
acquisitions. To accomplish this, the plate edges were identified from the RGB plate images using a Canny edge detector with a
Gaussian filter of σ =3 and hysteresis threshold values of 10 and 50. A circle Hough transform, using the range of expected
plate radii, was performed on these edge maps to determine the plate center and radius. Denoting the plate centers of the
calibration and food plate as (xC , yC ) and (xP , yP ), a translation transformation T = (xP − xC , yP − yC ) was applied to dC , thus
aligning the two depth maps. Pixel-wise food height was then computed:
hi = dC,i − dP,i (1)
13/18where hi is the food height relative to the plate for pixel i in mm. The transformation T accounts for planar translation between
acquisitions, but changes in tilt may also affect the measurement. Thus, a full-field correction was performed by constraining
the left and right limits of hi (table regions) to 0 mm. Specifically, for each row, we subtracted the weighted average of the
left and right table pixel heights (which should theoretically be 0 mm), weighted to the pixel’s distance from the left and right
boundaries. A 5 × 5 median filter was applied to the food height map to correct spurious measurements at plate boundaries.
Food height was used to refine the segmentation mask (“depth-refinement”) based on a priori knowledge that visual-volume
discordance is observed when very shallow and inconsequential foods are visually apparent, but are irrelevant to volumetric
analysis. Specifically, the image was decomposed into 250 perceptually meaningful superpixels using simple linear iterative
clustering70 (compactness=20, σ =2). For each superpixel Si , the constituent pixels were removed from the food map using
statistical thresholding on the pixel height distribution:
QhS (p) < τ (2)
i
where QhS is the quantile function of the distribution of pixel heights in Si . We set p = 0.75 and τ = 2 mm based on
i
measurement error along a flat table.
Food Volume Calculation
Food height was determined in mm units, but to calculate food volume, pixel spacing needed to be calibrated to mm (a
pixel-to-mm conversion). Using the known diameter of the plate d (259 mm), we used the detected plate radius r̂ from the
circle Hough transform to compute the conversion:
d
∆x = (3)
2r̂
Food volume in mL could then be computed by summing the per-pixel differential volumes within the food mask:
V= ∑ (∆x)2 hi (4)
i∈F
where F is the set of segmented food pixels. Volumetric food intake was computed by subtracting the plate volume from the
full portion volume. Similarly, percent intake was calculated relative to the full portion volume.
Testing
We tested the network on our two custom LTC datasets consisting of 689 (375+314) images representing 36 (9+27) different
foods (as outlined in Table 3). Original images were downsampled from 480×640 to 120×160 to decrease the number of
network parameters and improve computation time. The images were hand segmented to define ground truth segmentation
masks of the food on the plates.
We compared our results to those generated by semi-automatic graph cut segmentation. Since user input is required for
initialization, for consistency in the regular texture dataset, one line was used to denote each food item present on the plate and
one squiggled background line was indicated around the top and right side of the image as shown in Figure 5. The modified
texture dataset required additional user-defined seeding. The circle Hough transform plate masking used in our proposed system
was used here too. The output from this method is a plate-level food segmentation mask.
Data Analysis
To compare quantitative performance between methods, we use the common performance measures of global accuracy
(Equation 5) to describe the percentage of correctly classified pixels, food segmentation accuracy (Equation 6 to describe the
percentage of correctly classified food pixels, as well as the intersection over union (IOU) (Equation 7) both within a meal
(i.e., breakfast, lunch, dinner, modified texture single-imaged foods) and across meals. For this application, the IOU provides a
more representative metric for how our segmentation system is performing as it captures accuracy within the context of the
true bounded food areas since false positive predictions are penalized. The theoretical maximum value of IOU is 1.0 when the
intersection maps perfectly over the union without deviation. We define the metrics described above as follows:
TP+TN
Global Accuracy = (5)
T P + T N + FP + FN
TP
Food Segmentation Accuracy = (6)
T P + FN
target ∩ prediction
IOU = (7)
target ∪ prediction
14/18Figure 5. Sample graph cuts annotation with one line per food item (red) and one background line (blue) and resulting
segmentation mask.
Volume estimation accuracy was assessed by computing mean absolute intake error (mL) as volume calculated using
our proposed method or the “applied ground-truth” method with or without depth-refinement relative to the volume across
the ground-truth hand segmented areas. Error (mL) was calculated similarly but preserves the direction of error. Volume
intake error (mL) is the difference between the current portion relative to the full portion. Intake error was calculated for both
segmentation (2D) and volume (3D) data relative to the full portion. All values are reported as mean ± SD.
References
1. Pirlich, M. & Lochs, H. Nutrition in the elderly. Best Pract. & Res. Clin. Gastroenterol. 15, 869–884 (2001).
2. Keller, H. H., Østbye, T. & Goy, R. Nutritional risk predicts quality of life in elderly community-living Canadians. The
Journals Gerontol. Ser. A 59, M68–M74 (2004).
3. Goates, S., Du, K., Braunschweig, C. A. & Arensberg, M. B. Economic burden of disease-associated malnutrition at the
state level. PLOS ONE 11, e0161833 (2016).
4. Russell, C. A. The impact of malnutrition on healthcare costs and economic considerations for the use of oral nutritional
supplements. Clin. Nutr. Suppl. 2, 25–32 (2007).
5. Kaiser, M. J. et al. Frequency of malnutrition in older adults: a multinational perspective using the mini nutritional
assessment. J. Am. Geriatr. Soc. 58, 1734–1738 (2010).
6. Keller, H. et al. Prevalence of malnutrition or risk in residents in long term care: comparison of four tools. J. Nutr.
Gerontol. Geriatr. 38, 329–344 (2019).
7. Keller, H. H. et al. Prevalence and determinants of poor food intake of residents living in long-term care. J. Am. Med. Dir.
Assoc. 18, 941–947 (2017).
8. Martin, C. K. et al. A novel method to remotely measure food intake of free-living individuals in real time: the remote
food photography method. Br. J. Nutr. 101, 446–456 (2008).
9. Williamson, D. A. et al. Comparison of digital photography to weighed and visual estimation of portion sizes. J. Am. Diet.
Assoc. 103, 1139–1145 (2003).
10. Bingham, S. A. Limitations of the various methods for collecting dietary intake data. Annals Nutr. Metab. 35, 117–127
(1991).
11. Castellanos, V. H. & Andrews, Y. N. Inherent flaws in a method of estimating meal intake commonly used in long-term-care
facilities. J. Am. Diet. Assoc. 102, 826–830 (2002).
12. Pfisterer, K., Boger, J. & Wong, A. Prototyping the automated food imaging and nutrient intake tracking (AFINI-T) system:
A modified participatory iterative design sprint. JMIR Hum. Factors 6, e13017 (2019).
13. Lo, F. P. W., Sun, Y., Qiu, J. & Lo, B. Image-based food classification and volume estimation for dietary assessment: A
review. IEEE journal Biomed. Heal. Informatics 24, 1926–1939 (2020).
15/18You can also read