Treatment Planning for External Beam Radiation Therapy with Simultaneous Integrated Lymph Node Boost in Cervical Cancer - Semantic Scholar
←
→
Page content transcription
If your browser does not render page correctly, please read the page content below
Treatment Planning for External Beam
Radiation Therapy with Simultaneous
Integrated Lymph Node Boost in Cervical
Cancer

Kristine Fjellanger

Master of Science in Physics and Mathematics
Submission date: January 2018
Supervisor:       Anne Beate Langeland Marthinsen, IFY
Co-supervisor:    Josefine Ståhl Kornerup, St. Olavs Hospital

Norwegian University of Science and Technology
Department of Physics


Abstract

Cervical cancer with lymph node metastases has traditionally been treated
with external beam radiation therapy (EBRT) to a large pelvic target volume
followed by a sequential boost to the affected lymph nodes, and brachyther-
apy to boost the primary tumor. With modern intensity modulated EBRT
techniques (IMRT/VMAT) it has become possible to deliver the lymph node
boost dose together with the initial pelvic EBRT as a simultaneous integrated
boost (SIB).
    The radiotherapy department at St. Olavs Hospital has decided to start
using SIB in the treatment of this patient group. This is a study of treatment
planning technique, aiming at exploring different aspects of SIB treatment
planning for VMAT in the RayStation treatment planning system, assessing
the achieved plan quality and presenting recommendations for the depart-
ment protocol with regards to optimization functions, clinical and auxiliary
structures and arc configuration.
    5 patients that have received radiotherapy treatment with sequential
boost for cervical cancer, each with 1-4 positive lymph nodes, were included
in the study. SIB treatment plans with different types of optimization func-
tions and auxiliary structures were created for all patients. The treatment
planning aims from the EMBRACE II study protocol, regarded as the current
gold standard for cervical cancer radiation therapy, were used for evaluation
of the dose distributions along with visual inspection and QA measurements.
After a general strategy for structures and objectives had been selected, plans
with different arc configurations (1 arc, 2 single arcs or 2 arcs with RaySta-
tions dual arc feature) were created and compared.
    A general objective set with corresponding auxiliary structures that should
be a good starting point for the optimization process for most patients is
presented. The SIB treatment plans made with 2 arcs were satisfactory as
assessed by medical physicists and verified excellently according to the qual-

                                      i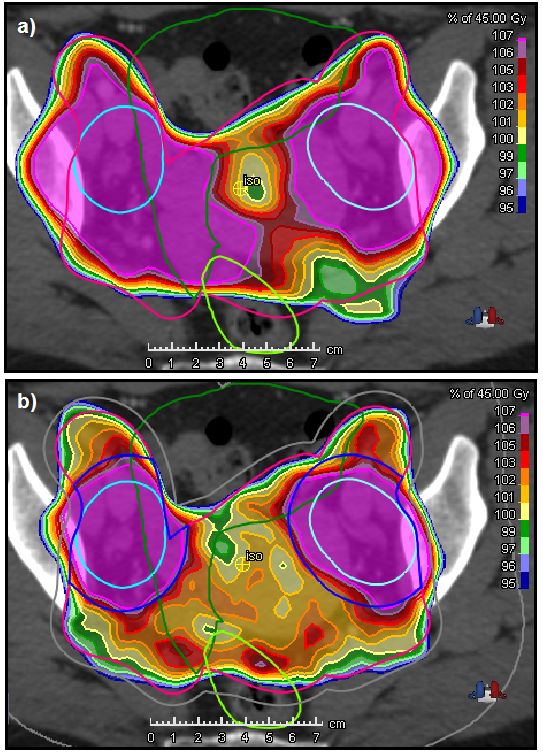
ity assurance procedure. Plans made with 1 arc displayed worse conformity
of the high dose regions to the target volumes, and were not acceptable for
2 of the 5 patients.
    Some challenges in the treatment plan creation were encountered. The
clinical goals for the bladder were only achieved for 2 of the 5 patients,
hence a change in the department protocol of treatment with empty bladder
is recommended. Another issue was that due to the large target volumes,
the treatment planning aims allowed significant cold areas. Thorough visual
inspection of the dose distributions should therefore be performed. However,
this study showed that implementation of SIB for lymph node metastases in
cervical cancer is feasible in the current clinical setting at St. Olavs Hospital.

                                        ii
Sammendrag

Livmorhalskreft med lymfeknutemetastaser har tradisjonelt blitt behandlet
med ekstern stråleterapi (EBRT) til et stort målvolum i bekkenet, etterfulgt
av en sekvensiell ekstern boost til positive lymfeknuter og brachyterapi som
boost til primærsvulsten. Med moderne, intensitetsmodulerte teknikker for
EBRT (IMRT/VMAT) er det nå mulig å gi den ekstra boostdosen til lym-
feknutene samtidig med den innledende, eksterne bekkenbestrålingen som en
simultan integrert boost (SIB).
     Stråleterapiavdelingen ved St. Olavs Hospital har bestemt at SIB skal
tas i bruk som en del av behandlingen for denne pasientgruppen. Dette
er en doseplanteknisk studie, med mål om å utforske ulike aspekter ved
doseplanlegging med SIB for VMAT i doseplansystemet RayStation, vurdere
plankvaliteten, samt gi anbefalinger til nye retningslinjer for avdelingen med
hensyn til optimeringsfunksjoner, målvolum, hjelpevolum og feltoppsett.
     5 pasienter som har mottatt stråleterapibehandling med sekvensiell boost
for livmorhalskreft, hver med 1-4 positive lymfeknuter, er inkludert i stu-
dien. Doseplaner med SIB, med ulike typer av optimeringsfunksjoner og
hjelpevolum, ble laget for alle pasientene. Dose-volumkrav fra EMBRACE
II-protokollen, som på nåværende tidspunkt anses som gullstandarden for
stråleterapi av livmorhalskreft, ble sammen med visuell inspeksjon og QA-
målinger brukt til evaluering av dosefordelingene. Etter valg av en generell
strategi for strukturer og objektiver ble planer med ulike feltoppsett (1 bue,
2 enkle buer eller 2 buer med ”dual arc”-funksjonen i RayStation) laget og
sammenlignet.
     Et generelt objektivsett med tilhørende hjelpevolum, som bør være et
godt utgangspunkt for optimeringsprosessen for de fleste pasienter, er pre-
sentert. Behandlingsplanene med SIB laget med 2 buer ble vurdert som
tilfredsstillende av medisinske fysikere, og verifiserte utmerket. For planene
laget med 1 bue var konformiteten dårligere, og dosefordelingen var ikke

                                      iii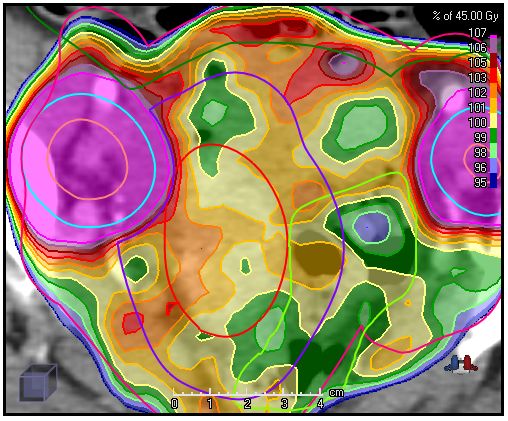
akseptabel for 2 av 5 pasienter.
    Enkelte utfordringer i doseplanleggingen ble oppdaget. Dose-volumkravene
for blæren ble bare oppnådd for 2 av 5 pasienter, derfor anbefales en endring
i avdelingens retningslinjer for behandling med tom blære. En annen ut-
fordring var at dose-volumkravene tillot betydelige kalde områder på grunn
av de store målvolumene. Grundig visuell inspeksjon av dosefordelingene er
derfor viktig. Denne studien viste imidlertid at innføring av SIB for lym-
feknutemetastaser ved livmorhalskreft er gjennomførbart i den kliniske set-
tingen på St. Olavs Hospital.

                                     iv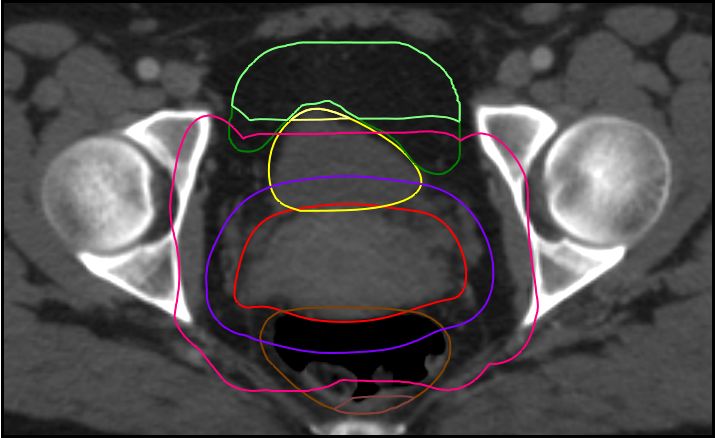
Preface

This thesis constitute the final work for my master’s degree in Biophysics and
Medical Technology at the Norwegian University of Science and Technology
(NTNU). The work was carried out at the radiotherapy department at St.
Olavs Hospital (Trondheim University Hospital) during the fall semester of
2017.
   A big thanks to my supervisors, medical physicists Anne Beate Langeland
Marthinsen and Josefine Ståhl Kornerup, for all the helpful discussions, thor-
ough feedback and continuous encouragement through the whole semester.
   Thanks also to the other physicists at the radiotherapy department for
answering my big or small questions, to chief physician Monika Eidem for
help with delineation, and to the head of the radiotherapy department, Anne
Dybdahl Wanderås.

                                                           Kristine Fjellanger
                                                                   Trondheim
                                                            January 14, 2018

                                      v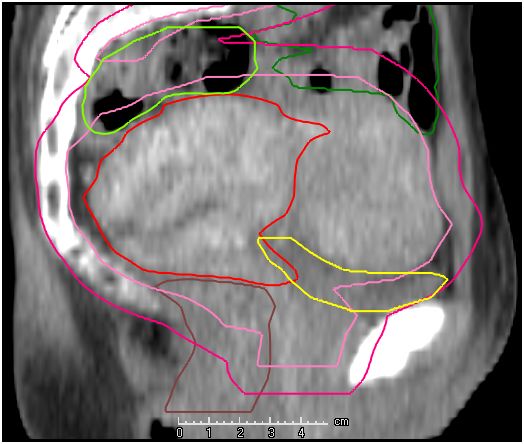
Contents

1 Introduction                                                                                   1

2 Theory                                                                                          3
  2.1 Cervical cancer . . . . . . . . . . . . . . . . . . . . . .                .   .   .   .    3
      2.1.1 Primary disease . . . . . . . . . . . . . . . . . .                  .   .   .   .    3
      2.1.2 The lymphatic system . . . . . . . . . . . . . .                     .   .   .   .    4
  2.2 External beam radiation therapy . . . . . . . . . . . .                    .   .   .   .    5
      2.2.1 The linear accelerator . . . . . . . . . . . . . . .                 .   .   .   .    6
      2.2.2 Intensity modulated radiation therapy . . . . .                      .   .   .   .    7
      2.2.3 Monitor units . . . . . . . . . . . . . . . . . . .                  .   .   .   .    8
  2.3 Cervical cancer treatment . . . . . . . . . . . . . . . .                  .   .   .   .    8
      2.3.1 Lymph node boost . . . . . . . . . . . . . . . .                     .   .   .   .    9
      2.3.2 Physical and biological doses . . . . . . . . . . .                  .   .   .   .   10
      2.3.3 Overall treatment time . . . . . . . . . . . . . .                   .   .   .   .   11
  2.4 The EMBRACE studies . . . . . . . . . . . . . . . . .                      .   .   .   .   12
  2.5 EBRT treatment planning for cervical cancer with SIB                       .   .   .   .   13
      2.5.1 Clinical structures . . . . . . . . . . . . . . . .                  .   .   .   .   13
      2.5.2 Auxiliary structures . . . . . . . . . . . . . . . .                 .   .   .   .   14
      2.5.3 Coverage probability planning . . . . . . . . . .                    .   .   .   .   15
      2.5.4 The RayStation treatment planning system . .                         .   .   .   .   15
  2.6 Quality assurance . . . . . . . . . . . . . . . . . . . . .                .   .   .   .   16

3 Material and methods                                                                           21
  3.1 Patients . . . . . . . . . . . . . . . . . . . .   .   .   .   .   .   .   .   .   .   .   21
      3.1.1 Delineation of clinical structures . . .     .   .   .   .   .   .   .   .   .   .   21
  3.2 Treatment plan optimization . . . . . . . . .      .   .   .   .   .   .   .   .   .   .   22
      3.2.1 Treatment planning aims . . . . . . .        .   .   .   .   .   .   .   .   .   .   22
      3.2.2 Selection of structures and objectives       .   .   .   .   .   .   .   .   .   .   22

                                     vi
3.2.3 Evaluation of arc configurations . . . . . . . . . . . . . 24
3.2.4 Beam and optimization settings . . . . . . . . . . . . . 25
3.3 Treatment plan evaluation . . . . . . . . . . . . . . . . . . . . 25
3.3.1 QA measurements . . . . . . . . . . . . . . . . . . . . 26
4 Results 27
4.1 Creation of auxiliary structures . . . . . . . . . . . . . . . . . 28
4.2 Selection of OAR objectives . . . . . . . . . . . . . . . . . . . 31
4.3 Optimization template . . . . . . . . . . . . . . . . . . . . . . 34
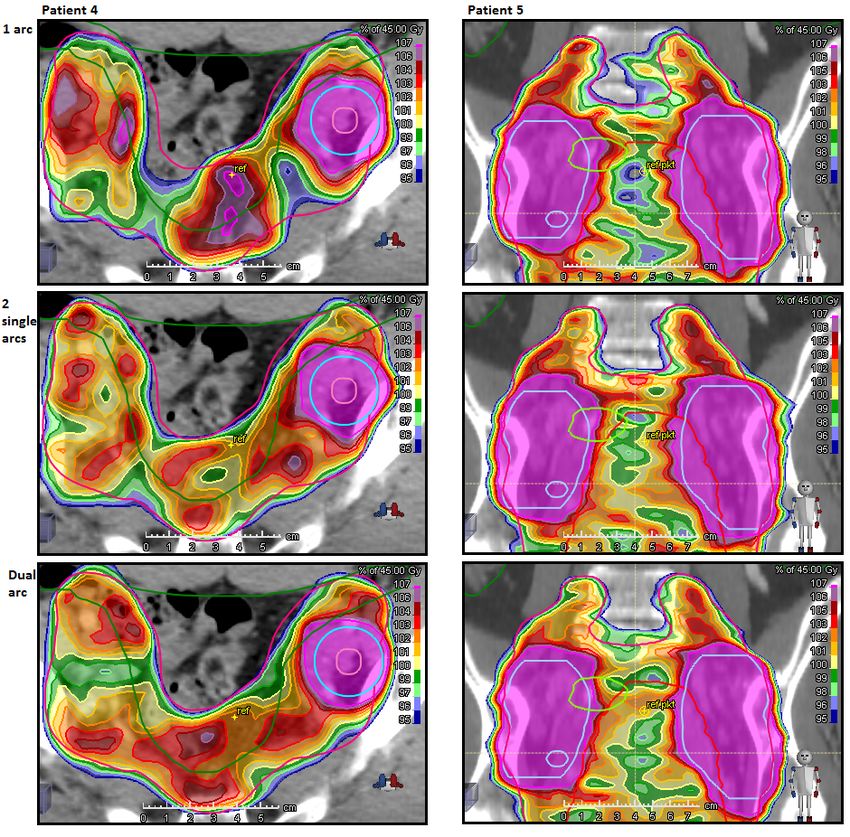
4.4 Evaluation of arc configurations . . . . . . . . . . . . . . . . . 34
4.5 Examples of challenges in the treatment planning . . . . . . . 36
4.5.1 Bladder anatomy and doses . . . . . . . . . . . . . . . 36
4.5.2 Target coverage and robustness . . . . . . . . . . . . . 38
5 Discussion 41
5.1 Clinical structures . . . . . . . . . . . . . . . . . . . . . . . . . 42
5.1.1 Margins for nodal targets . . . . . . . . . . . . . . . . 42
5.1.2 Delineation of target structures . . . . . . . . . . . . . 42
5.2 Auxiliary structures . . . . . . . . . . . . . . . . . . . . . . . . 43
5.2.1 GTV-T + 10 mm . . . . . . . . . . . . . . . . . . . . . 43
5.3 OAR objectives . . . . . . . . . . . . . . . . . . . . . . . . . . 44
5.4 Arc configurations . . . . . . . . . . . . . . . . . . . . . . . . 45
5.5 Optimization challenges . . . . . . . . . . . . . . . . . . . . . 46
5.5.1 Bladder protocol . . . . . . . . . . . . . . . . . . . . . 46
5.5.2 Target coverage and robustness . . . . . . . . . . . . . 46
5.6 Quality assurance . . . . . . . . . . . . . . . . . . . . . . . . . 47
5.7 Implementation of SIB in the clinic . . . . . . . . . . . . . . . 47
6 Conclusion 49
Appendices 54
A Optimization structures 54
A.1 Auxiliary structures . . . . . . . . . . . . . . . . . . . . . . . . 54
A.2 List of all structures . . . . . . . . . . . . . . . . . . . . . . . 55
B Summary of optimization objectives 56
C Selection of OAR objectives 59
viiD Evaluation of arc configurations 61
viiiAcronyms and abbreviations
CBCT Cone Beam Computed Tomography
CCW Counterclockwise
CIN Cervical Intraepithelial Neoplasia
CovP Coverage Probability
CTV Clinical Target Volume
CW Clockwise
DD Dose Difference
DTA Distance To Agreement
DVH Dose-Volume Histogram
EBRT External Beam Radiation Therapy
EMBRACE An intErnational study on MRI-guided BRachytherapy in lo-
cally Advanced CErvical cancer
EMBRACE II Image guided intensity modulated External beam radiochemother-
apy and MRI based adaptive BRAchytherapy in locally advanced CErvical
cancer
EQD2 (Biologically) Equivalent Dose in 2 Gy fractions
FDG-PET Fluorodeoxyglucose Positron Emission Tomography
FIGO Fédération Internationale de Gynécologie et d’Obstétrique (Interna-
tional Federation of Gynecology and Obstetrics)
GP Gamma Passing rate
ixGTV Gross Tumor Volume
HPV Human Papillomavirus
IMRT Intensity Modulated Radiation Therapy
ITV Internal Target Volume
LINAC Linear Accelerator
LN Lymph Node
MLC Multileaf Collimator
MU Monitor Unit
OAR Organ At Risk
OTT Overall Treatment Time
PTV Planning Target Volume
QA Quality Assurance
ROI Region Of Interest
SIB Simultaneous Integrated Boost
VMAT Volumetric Arc Therapy
xChapter 1
Introduction
Cervical cancer is one of the most common types of cancer in women, with
around 350 new cases in Norway each year [1, 2]. In almost half the cases,
the cancer has spread to regional lymph nodes at the time of diagnosis, and
for these patients the recurrence and survival rates are significantly worse [3].
Standard treatment for locally advanced cervical cancer includes external
beam radiation therapy (EBRT) to a large target volume in the pelvic area,
brachytherapy to boost the primary tumor and concomitant chemotherapy.
Any gross disease detected in the lymph nodes is usually treated with an
additional EBRT boost dose [4]. Traditionally, the lymph node boost has
been delivered as a sequential boost after the primary pelvic EBRT.
In recent years, EBRT using intensity modulated radiotherapy (IMRT) or
volumetric arc therapy (VMAT) has made it possible to deliver different doses
to specific parts of the target volume with high precision (”dose painting”),
making a new option available; simultaneous integrated boost (SIB). Using
this technique, the additional boost dose to the lymph nodes is integrated
in the same treatment plan and delivered at the same time as the initial
external beam fractions [5].
The potential advantages of SIB compared to sequential boosting include
reduction of hot spots in normal tissue, and shorter overall treatment time,
limiting tumor repopulation and improving local control. Several studies
have found that SIB has the capacity to improve the dose distribution [6, 7],
and achieve high levels of local control with acceptable rates of acute and
late normal tissue toxicities [5, 8].
SIB for treatment of affected lymph nodes is compulsory in the protocol
for EMBRACE II, a multicenter interventional study on treatment of locally
1advanced cervical cancer [9]. The EMBRACE II treatment protocol is based
on comprehensive data from the EMBRACE and Retro-EMBRACE studies
[10, 11] which included a large number of patients from a number of clinics,
and is at present considered the gold standard for cervical cancer treatment.
At St. Olavs Hospital, lymph node metastases in cervical cancer has until
now been treated by sequential EBRT boosting [12]. Based on the available
research and the EMBRACE II treatment protocol, the department has de-
cided to implement SIB in the radiotherapy treatment for this patient group.
This master’s thesis is a study of treatment planning technique, in contribu-
tion to the development of a clinical protocol for this type of treatment. The
goal was to test the feasibility of SIB treatment planning in the current clin-
ical setting, and highlight potential challenges and benefits with the method
for this patient group. Also, this work aims to investigate different strategies
for aspects of the treatment planning such as auxiliary structures, objective
sets and arc configurations, and present recommendations for the future de-
partment protocol based on specific testing using the available software, as
well as relevant literature.
2Chapter 2
Theory
2.1 Cervical cancer
Cervical cancer is the fourth most common cancer in women, with an esti-
mated 528 000 new cases and 266 000 deaths worldwide in 2012. About 84%
of cervical cancer instances and 87% of deaths occur in less developed regions
[13]. In Norway, 370 new cases and 79 deaths were reported in 2015 [1, 2].
Virtually all cases of cervical cancer are caused by persistent infection
with the sexually transmittable human papillomavirus (HPV). During the
last decades, widespread use of screening programs have reduced the inci-
dence of invasive cervical cancer dramatically in developed countries, and
HPV vaccination is expected to reduce the occurence further [14].
2.1.1 Primary disease
The cervix is the lower part of the uterus, connecting the uterine cavity and
the vaginal lumen (see figure 2.1). The openings into the uterus and vagina
are called the internal and external os, respectively. The canal between
the internal and external os, called the endocervix, is covered by mucus-
secreting glandular cells , while the lower, vaginal part of the cervix, covered
by squamous epithelium, is called the ectocervix.
Cervical cancer typically arises from cervical intraepithelial neoplasia
(CIN), an asymptomatic, potentially premalignant transformation of squa-
mous cells that emerges 5-15 years preceding invasive carcinoma. Most cer-
vical cancers originate in the squamocolumnar junction, or transformation
3zone, where the squamous epithelium of the ectocervix meets the columnar,
glandular epithelium of the endocervix [15].
Figure 2.1: Anatomy of the female reproductive system (left) and a closer
view of the cervix (right). Adapted from [16].
2.1.2 The lymphatic system
The lymphatic system is a one-way circulatory network consisting of lym-
phatic vessels, lymph nodes and other lymphoid organs. Its main responsi-
bilities are returning excess fluid from body tissues to the circulatory system,
and defending the body against foreign or harmful agents.
Interstitial fluid drains into lymphatic capillaries and becomes lymph,
which flows away from tissues in lymphatic vessels, is filtered through the
lymph nodes and continues to either the thoracic duct or right lymphatic
duct, which drains into the left and right subclavian veins respectively.
Lymph nodes are small, oval masses that tend to group in clusters, for
example under the arms (axillary lymph nodes) and in the pelvis (iliac lymph
nodes). Lymphocytes, a class of white blood cells that mediate all adaptive
immune responses, are concentrated in the lymph nodes. Lymph nodes act as
filters for bacteria, viruses and other foreign materials that can be recognized
and eliminated by lymphocytes.
The lymphatic system plays a key role in tumor metastasis by providing
a pathway for tumor cell dissemination; small lymph capillaries surrounding
or invading tumors may take up tumor cells and transport them via larger
lymph vessels to regional lymph nodes. The presence of metastatic tumor
4cells in regional lymph nodes is an important prognostic factor in many
cancers [17].
Lymph node metastases in cervical cancer
Studies on locally advanced cervical cancer have reported lymph node (LN)
metastases at the time of diagnosis in 45-47% of the patients [3, 18], and
increased frequency of positive LNs with FIGO stage1 [3]. Lymph node status
is nowadays most commonly evaluated by FDG-PET imaging, as it offers
functional information and can detect disease in normal-size lymph nodes,
rather than relying on size criteria only as with CT or MRI [3].
Lymph node regions where metastases from cervical cancer are frequently
found are shown in figure 2.2. The pattern of lymph node spread is almost
without exception from lower to higher level; pelvic nodes first (first true
pelvic and then common iliac), then para-aortic nodes and eventually supr-
aclavicular nodes [3, 20]. For example, none of the two referenced studies
found any positive para-aortic LNs in patients without positive pelvic LNs.
For cervical cancer patients, the prognosis depends strongly on the pres-
ence and extent of LN metastases. The risk of both recurrence and death
increases incrementally based on the most distant level of nodal involvement
at diagnosis. Kidd et al. found that the hazard ratio2 for disease recur-
rence was 2.40 for pelvic, 5.88 for para-aortic and 30.27 for supraclavicular
LN metastases respectively (compared to no lymph node involvement) [3],
and Wakatsuki et al. found a decrease in 5-year overall survival (following
EBRT with or without sequential LN boost and brachytherapy) from 82.0%
to 55.1% if pelvic LN metastases were detected [22].
2.2 External beam radiation therapy
Several modalities including photon, electron, proton, neutron and light ion
beams are used for external beam radiation therapy (EBRT) worldwide, in
addition to internal radiation techniques such as brachytherapy and intra-
operative radiation therapy. However, the majority of radiation therapy
1
Fédération Internationale de Gynécologie et d’Obstétrique (International Federation
of Gynecology and Obstetrics, FIGO) staging for carcinoma of the cervix uteri [19].
2
The hazard ratio indicate the risk of an event occuring in one group compared to
another (control) group.
5Figure 2.2: Lymph node regions commonly involved in cervical cancer. The
arrows indicate the direction of spread. Adapted from [21].
treatments are EBRT with photon or electron beams produced in a linear
accelerator.
2.2.1 The linear accelerator
Linear accelerators (linacs) for medical applications accelerate electrons through
interactions with a microwave frequency electromagnetic field to energies
ranging from 4 to 25 MeV. The monoenergetic electron beam can either be
6used directly for treatment of superficial lesions, or imparted on a high den-
sity (e.g. tungsten) target to create photons through bremsstrahlung. The
photon beam will contain a spectrum of energies, with maximum photon en-
ergy equal to the electron energy used. Photon beams of 6, 10, 15 or 18 MV
are most common in EBRT treatment.
For photon therapy, the radiation field is shaped by the fixed primary
collimator and two pairs of independently movable secondary collimator jaws,
providing a range of rectangular field sizes. Modern linacs also have a multi-
leaf collimator (MLC), with tungsten leaves of 0.5 to 1 cm width that can
move independently at rapid speed (3-6 cm/s) to shape the radiation field
[23].
2.2.2 Intensity modulated radiation therapy
Intensity modulated radiation therapy (IMRT) is a modern radiotherapy
technique, where the prescribed dose is shaped to the target volume by mod-
ulating the beam intensity and the MLC shape for each beam segment with
varying gantry angles. While IMRT refers to radiation delivery through a
number of fixed beam segments, VMAT is a subtype that incorporates con-
tinuous gantry rotation while the radiation field is modulated through MLC
movement and variations in dose rate, thereby reducing the treatment deliv-
ery time.
The improvement in conformity of radiation dose to target volume with
IMRT or VMAT compared to 3D conformal radiotherapy allows a dose esca-
lation to the target volume and/or a dose reduction to surrounding normal
tissue structures [24].
Vergalasova et al. compared IMRT and VMAT for treatment of gyne-
cological malignancies with SIB, and found that both methods produced
acceptable treatment plans, with slightly better dosimetry for IMRT, and
shorter treatment time and lower MU for VMAT [25]. In the following, this
report will focus on VMAT, as this technique is used for cervical cancer
treatment at St. Olavs Hospital.
Arc configuration
While good quality VMAT plans for simple geometries may be achieved
with one full or partial arc, more complex geometries may require several
rotational arcs to allow the modulation necessary to achieve a satisfactory
7dose distributions. As the MLC leaves have a given freedom of movement,
the possibilities for modulation of the shape and combinations of intensity
levels for each segment increase with multiple arcs [24]. One full arc rotation
typically takes less than two minutes.
2.2.3 Monitor units
Monitor units (MU) are a measure of machine output, or ”beam on” time, for
linacs. By convention, 1 MU equals the amount of charge that correlates with
an absorbed dose of 1 cGy in a water phantom at standardized calibration
conditions (target depth, source-to-surface distance, field size), recorded in
the ionization chamber in the linac head, for a particular beam energy [26].
When the dose rate (MU/min) is constant, the number of MU is propor-
tional to irradiation time. In IMRT/VMAT plans, only parts of the target
volume are irradiated at any time, and a downside compared to conformal
radiotherapy is increased MU, longer irradiation time and more leakage ra-
diation [27]. A high MU can be a sign that the treatment plan is heavily
modulated, and that accurate delivery of the plan may be a challenge.
2.3 Cervical cancer treatment
While early and limited disease can be removed surgically, the standard
treatment for locally advanced cervical cancer (FIGO stage IB2-IVA) is com-
bined external beam radiotherapy (EBRT), brachytherapy and concomitant
chemotherapy [14].
A dose of 45-50 Gy in fractions of 1.7 to 2 Gy is usually delivered by
EBRT to a large target volume in the pelvic area, in order to eradicate any
microscopic disease and prevent the cancer from spreading. In case of lymph
node involvement, the pelvic target volume is expanded upwards to include
nodal regions with a significant risk of lymphatic spread (the elective nodal
target) [9].
During the last half of the EBRT course or immediately afterwards, the
primary tumor is boosted using brachytherapy to reach a total biological dose
(see section 2.3.2) between 75 and 95 Gy. In brachytherapy, a radioactive
source with a steep dose gradient is placed inside the uterus and vagina in
order to deliver a high dose with good precision to the target volume while
sparing OARs nearby [14].
8Gross disease in areas not accessible for brachytherapy, such as metastases
in regional lymph nodes, the pelvic sidewall or the parametrium, can be
treated by additional EBRT boost doses [5].
2.3.1 Lymph node boost
Lymph node boosting in EBRT of cervical cancer implies an increase in the
dose to positive nodes compared to the surrounding target volume, due to
the presence of macroscopic disease. The boost dose may be given either
sequentially (following the radiation of the pelvic target) or simultaneously
with the initial EBRT fractions as an integrated boost.
Simultaneous integrated boost
Simultaneous integrated boost (SIB) is a novel method exploiting the possi-
bilities of intensity modulated EBRT techniques. Through intentional dose
heterogeneity, boost volumes receive a higher fraction dose within a larger
volume treated with a lower dose [5].
SIB has several possible advantages over sequential boosting for lymph
node metastases in cervical cancer. The inclusive planning offers more control
over the dose distribution, so that potentially overlapping hot spots in two
separate plans are avoided. Feng et al. found that SIB significantly reduced
hot spots in both the pelvic target volume and OARs, as well as the physical
dose to rectum and small bowel [6].
As the number of fractions used to deliver the treatment is decreased,
usually by 5-7 depending on the fractionation used for sequential boosting,
the overall treatment time (OTT) can be shortened, limiting tumor repopu-
lation [7]. Fewer fractions is also more convenient for the patient and saves
resources in the department, and as only one treatment plan is required, time
for planning and implementation in the clinic can be saved.
A concern with fraction doses higher than the well tested 2 Gy is the risk
of unpredicted normal tissue toxicities due to an increase in biological dose
to OARs close to boost volumes, especially if normal tissue unexpectedly
enters the areas where boost doses are given. However, Feng et al. found
that the EQD2 doses (see section 2.3.2) to rectum, small bowel and bladder
were equivalent for SIB and sequential boost techniques, and therefore expect
toxicities to be comparable [6]. Boyle et al. found that SIB of 2.2 Gy/fraction
was not associated with increased acute or late toxicity [5], and Vargo et al.
9concluded that the rate of late adverse events was acceptable [8]. These
studies demonstrate that doses of 2.2 Gy/fraction can be safely delivered to
boost volumes as an integrated treatment.
Lymph node boost doses
As the expected dose contribution from brachytherapy varies with location
of the lymph node, the appropriate boost dose will depend on LN region.
Studies have reported brachytherapy doses (EQD2, see next section) of 3.8-
6.2 Gy for pelvic nodes and 0.5-1.9 Gy outside the true pelvis (mean D50% )
[28], and median near minimum point doses of 3.6-4.7 Gy inside the true
pelvis and 0-1.2 Gy outside [29].
In the EMBRACE II protocol (see section 2.4), the following fractionation
schedules are suggested to achieve a desired total LN dose of 55-65 Gy EQD2
from EBRT and brachytherapy [9]:
• In true pelvis: 25 x 2.2 Gy = 55 Gy physical dose ≈ 55.9 Gy EQD2
from EBRT. A contribution from brachytherapy of ≈ 4 Gy gives a total
biologically equivalent dose of ≈ 60 Gy.
• Outside of true pelvis: 25 x 2.3 Gy = 57.5 Gy physical dose ≈ 58.9 Gy
EQD2 from EBRT. The dose from brachytherapy is negligible.
2.3.2 Physical and biological doses
While prescriptions for fraction doses and total doses for each modality are
given as absorbed physical dose, summation of overall doses from EBRT
and brachytherapy are performed using the biologically equivalent dose in
2 Gy fractions (EQD2). EQD2 is used for comparing the clinical effects of
radiation delivered using different fractionation regimens, and is defined as
h α/β + d i
EQD2 = D ,
α/β + 2
where D is the total absorbed dose and d is the dose per fraction. α/β
is the ratio of the parameters α and β in the linear-quadratic model, and
describes the fractionation sensitivity of tissues [14]. In biological dose cal-
culations for cervical cancer radiation therapy, α/β = 10 Gy is used for tumor
tissue and α/β = 3 Gy is used for normal tissue [9].
102.3.3 Overall treatment time
A multivariate analysis of 488 patients in the Retro-EMBRACE study (see
next section) showed that the effect of shortening the overall treatment time
(OTT) by 1 week was equivalent to a 5 Gy dose escalation for the high risk
clinical target volume [18]. The aim in the EMBRACE II treatment protocol
is to keep the OTT below 50 days, with use of simultaneous integrated lymph
node boost and careful timing of the brachytherapy schedule [9].
Figure 2.3 shows examples of possible overall treatment schedules with
SIB from the EMBRACE II protocol, as well as a schedule with sequential
lymph node boost used at St. Olavs Hospital.
Figure 2.3: Overall treatment schedules for radiotherapy of cervical cancer
with lymph node boost. a) and b) are examples from the EMBRACE II
treatment protocol giving OTTs of 44 and 47 days. c) is an example from the
EMBRACE II protocol for small and/or well responding tumors, giving an
OTT of 40 days. d) shows a typical treatment schedule with sequential boost
used at St. Olavs Hospital, giving an OTT of 50 days (5-7 boost fractions
have been applied based on the oncologist’s clinical assessment). Each box
represents one day, and white boxes represent days when no treatment is
given (weekends and break days).
112.4 The EMBRACE studies
EMBRACE is an international observational study on MRI-guided brachyther-
apy in locally advanced cervical cancer [10]. More than 1350 patients treated
in 27 centers between 2008 and 2015 were included, among them 37 patients
from St. Olavs Hospital. The main goals were to introduce MRI-based 3D
treatment planning for brachytherapy in a multicenter setting, and collect
data to correlate dose volume parameters for the CTV and OARs with treat-
ment outcome. Details of the EBRT and chemotherapy treatment were also
reported.
Retro-EMBRACE is a retrospective data collection project [11]. Data
from patients treated with image-guided brachytherapy before startup of
EMBRACE in each respective center was collected, and used for analysis
while the EMBRACE data matures. 852 patients were included in Retro-
EMBRACE.
A number of articles have been published based on the data from the
EMBRACE and Retro-EMBRACE studies, and a consecutive study called
EMBRACE II with interventions derived from the EMBRACE and Retro-
EMBRACE evidence has been initiated with an accrual period from 2016-
2019 [9]. The aim of this study is to implement advanced radiotherapy tech-
niques (image-guided, intensity modulated EBRT and image-guided adaptive
brachytherapy) and simultaneous chemotherapy for patients with locally ad-
vanced cervical cancer according to comprehensive guidelines, in order to
achieve an outstandingly high level of local, nodal and systemic control as
well as a high quality of life. Due to its extensive research foundation, the
EMBRACE II treatment protocol is at the moment regarded as a benchmark
for treatment of this patient group.
Some interventions in the EMBRACE II protocol that are of particular
relevance to this project are:
• Systematic utilization of IMRT/VMAT and daily image guidance.
• Standardized dose prescription for EBRT of 45 Gy in 25 fractions, 5
days a week, as the dose de-escalation from 50 Gy (traditionally used
in many centers, also at St. Olavs Hospital) to 45 Gy has the potential
to reduce morbidity.
• Simultaneous integrated boost in case of lymph node involvement.
12• Maximal overall treatment time of 50 days, including both EBRT and
brachytherapy.
2.5 EBRT treatment planning for cervical can-
cer with SIB
The general aim in radiotherapy is to deliver a dose sufficient to eradicate
disease in the target volume, while not exceeding the tolerance of normal
tissues nearby.
In VMAT treatment planning, a very large number of parameters can be
adjusted to achieve a satisfactory dose distribution. Computerized inverse
treatment planning using appropriate optimization algorithms is therefore
required. In inverse treatment planning, a series of aims, or optimization
functions, characterizing the desired dose distribution in both target volumes
and normal tissues are defined, and the optimization engine works iteratively
to determine the MLC shapes and fluence patterns that best fulfill the aims
[24].
2.5.1 Clinical structures
Radiotherapy treatment is prescribed by the oncologist according to a set of
structures delineated on 3D images (usually a treatment planning CT). To
exploit the sophisticated modern intensity modulated radiation techniques,
3D delineation of target and normal tissue structures with high precision is
required.
A general definition of target volumes for EBRT has been made by the
International Commission on Radiation Units and Measurements [24]:
• GTV: Gross tumor volume. The demonstrable extent of the tumor,
evaluated by clinical examination, anatomical imaging and/or func-
tional imaging.
• CTV: Clinical target volume. GTV + suspected microscopic extension
of malignant disease.
• ITV: Internal target volume. CTV + internal margin*, taking into
account uncertainties in size, shape and position of the CTV within
13the patient. Optional tool for help in PTV delineation when internal
uncertainties are large and/or independent of external (set-up) uncer-
tainties.
• PTV: Planning Target Volume. CTV + margin to account for the net
effect of all geometrical uncertainties (set-up variations*, organ motion
etc.), to ensure that the planned absorbed dose is actually delivered to
all parts of the CTV with a clinically acceptable probability.
* Internal and external (set-up) margins should be added quadratically
and not linearly to avoid unacceptably large total margins.
An overview of the clinical target structures defined in the EMBRACE
II protocol for EBRT of cervical cancer with lymph node boost is given in
table 2.1. The organs at risk that should be delineated are bladder, rectum,
sigmoid colon, bowel and femoral heads, and in case of para-aortic irradiation,
also kidneys and spinal cord.
2.5.2 Auxiliary structures
In order to meet the planning aims for a clinical structure it can sometimes
be advantageous to assign optimization functions to regions different from
the structure itself. For this purpose, auxiliary structures can be derived. An
example, suggested in the optimization guide from RayStation [30], is ring
ROIs: To achieve a sharper fall in the dose close to a target - both in normal
tissue and in larger target volumes around boost PTVs - without introducing
cold spots in the PTV, a ROI of about 1 cm around the PTV with a max
dose objective slightly lower than the prescribed target dose can be created.
Other examples are structures with a small help margin (in addition to
the PTV margin) in cases where achieving a certain dose level is critical also
at the border of a target volume, and structures where an overlap region is
removed to give full priority to another ROI in this region. If a target volume
and an OAR overlap and it is desired to favor target coverage, an auxiliary
out-volume for the OAR can be derived which includes only the parts outside
the target volume.
One auxiliary structure is suggested in the EMBRACE II treatment pro-
tocol: CTV-T HR with a 10 mm margin. This volume is likely to receive
a significant dose from brachytherapy, and for correct summation of OAR
doses from EBRT and brachytherapy and to avoid hot spots in OAR walls
14that are likely to receive a considerable brachytherapy dose, a max dose aim
for CTV-T HR + 10 mm could be applied.
2.5.3 Coverage probability planning
Coverage probability (CovP) planning has been proposed as a means to
achieve lower OAR doses when boosting LNs in cervical cancer patients [29].
CovP is based on the probability distribution of finding the GTV-N at a
specific point in the PTV-N, and aims for a heterogeneous target coverage
where underdosage is allowed at the edges of the PTV-N while the dose at
the center is higher than prescribed. This strategy has been shown to be
highly robust if daily image guidance based on bony fusion is performed, and
significantly lower doses to bowel and pelvic bones and a higher dose to the
central GTV-N were achieved with only a minor reduction in the CTV-N cov-
erage. Also, geographical misses would have limited dosimetric consequence
in a SIB setting as the LN targets are embedded in the pelvic PTV receiving
45 Gy. CovP has consequently been implemented in the EMBRACE II study
protocol [9].
2.5.4 The RayStation treatment planning system
The RayStation treatment planning system (by RaySearch Laboratories AB,
Sweden) is used for EBRT treatment planning at St. Olavs Hospital. A
review of some features in RayStation relevant to this study follows [31].
Arc configurations and dual arc
For VMAT treatment using one or more full arcs it is common to avoid
ambiguity in the definition of gantry angles by making each arc move coun-
terclockwise (ccw) from 178◦ or 179◦ to 182◦ or 181◦ , or clockwise (cw) from
182◦ /181◦ to 178◦ /179◦ or similar.
In optimizations of 1 arc, one fluence map is first generated at every 24◦
around the arc. Two MLC openings that form each fluence map are created,
and each of them are copied to every control point in one direction (2◦ -4◦
apart depending on beam settings). These MLC openings are used as a
starting point for the continued optimization.
With 2 arcs, one moving counterclockwise (ccw) from 179◦ to 181◦ and
the other clockwise (cw) back from 181◦ to 179◦ , the initial control points
15at every 24◦ for each arc would thus be only 2◦ apart. The resulting MLC
openings used as a starting point would be very similar for the two arcs given
the same collimator angle. However, the 2 single arcs can have different
collimator angles, giving an extra degree of freedom.
The dual arc feature in RayStation automatically creates a second arc
moving in the opposite direction of the original arc. Now 4 MLC openings
will form each fluence map (for the first arc only), and the two that are
most similar will be assigned to each arc. The second arc will have the same
collimator angle as the original arc and this can not be altered.
According to the RayStation user manual, using the dual arc feature
should generally result in improved plan quality with less modulation and
improved QA results compared to 2 single arcs with identical collimator
angles. It is, however, unclear whether the impact of different collimator
angles could partly or completely make up for this in a configuration with 2
single arcs.
Optimization functions
In inverse treatment planning, the planner defines a set of optimization func-
tions (objectives) and assigns weights corresponding to their relative impor-
tance. After every step in the optimization, weighted values representing
how far the planned dose distribution is from achieving each individual op-
timization function makes up the total objective function. The goal of the
optimization process is to minimize the value of the total objective function.
A selection of the available optimization functions in RayStation is de-
scribed in table 2.2.
2.6 Quality assurance
Quality assurance (QA) for VMAT includes initial commissioning of the linac
and treatment planning system as well as regular controls, and patient spe-
cific QA to ensure that the linac is able to accurately deliver the planned
treatment. This last step is especially crucial for VMAT treatments as the
continuous changes in gantry angle and speed, dose rate and MLC shape
makes both delivery and dosimetric evaluation complex. Therefore, routine
QA of VMAT plans typically involves delivery of the treatment plan to a
16phantom - a device that measures samples of the delivered dose - and com-
parison of the measured and planned dose distribution [32].
Two main concepts complement each other when comparing two dose
distributions. For each measurement point, the following parameters can be
calculated:
1. Dose difference (DD): Difference between the measured and calculated
dose. Suitable in regions with low dose gradients. Where the dose
gradient is high, a small inaccuracy in position could lead to a large
DD. A typical passing criterion for the dose difference is 3% of the
planned dose.
2. Distance to agreement (DTA): Distance between the measurement point
and the nearest point in the calculated dose distribution with the same
dose. Suitable in regions with high dose gradients. A typical passing
criterion for the distance to agreement is 3 mm.
Because of their individual shortcomings, the DD and DTA methods are
often used in conjunction, by evaluating them individually for each mea-
surement point and requiring each point to pass either one of the tests. In
the gamma method, they are combined into an abstract quantity called the
gamma index, giving a single quantitative measure for evaluation of treat-
ment plan quality. Input passing criteria are used for normalization of DD
and DTA values, so that a gamma index of ≤ 1 becomes the criterion for
each point to pass the test [33]. Figure 2.4 shows an example of how the
gamma method works.
The gamma passing rate (GP) is the percentage of evaluated points that
pass the gamma test. At St. Olavs Hospital, a GP of > 90% with 3%/3 mm
criteria is normally required for successful verification.
17Table 2.1: Definitions of target structures for EBRT of cervical cancer with SIB to
lymph nodes from the EMBRACE II treatment protocol [9].
Clinical structure Definition
GTV-T The initial gross tumor volume of the primary cervix
tumor.
CTV-T HR (high risk) GTV-T and any remaining cervix.
CTV-T LR (low risk) CTV-T HR, the entire uterus and parametria, and mar-
gins of 20 mm into the vagina and 5 mm towards bladder
and rectum.
ITV-T LR Margins from CTV-T LR depend on clinical judgement
of internal target motion and the level of image guidance
applied in the specific center.*
CTV-E Elective nodal region, including relevant vessels and
pathological lymph nodes in the true and false pelvis
for all patients with LN metastases. For patients with
≥ 3 positive LNs, or any positive LNs at the common il-
iac level or higher, the para-aortic region is also included
(see figure 2.2).
ITV 45 ITV-T LR + CTV-E.
PTV 45 ITV 45 with an isotropic margin of 5 mm.**
GTV-N(#) 55/57.5 Individual gross tumor volume for each pathological
lymph node, numbered from the most inferior. The dose
level is determined according to the assumed dose con-
tribution from brachytherapy, as described in section
2.3.1.
CTV-N(#) 55/57.5 In principle equal to the corresponding GTV-N, but an
individualized margin (usually ≤3 mm) can be applied
in special cases to account for e.g. different appearance
on CT and MRI, or possible progression before treat-
ment starts.
PTV-N(#) 55/57.5 The corresponding CTV-N with an isotropic margin of
5 mm.**
*
Multiple image series with different combinations of bowel and bladder filling
give useful information about the range of internal motion of the CTV-T LR. It
is recommended to perform an empty bladder scan in addition to a treatment
planning CT with comfortably filled bladder.
**
A margin of 5 mm is considered appropriate when using daily image guidance
and couch correction according to fusion on bony anatomy.
18Table 2.2: Optimization functions (objectives) in RayStation 6 (only those
used in this study are included) [31].
Objective Input Description
type parameter(s)
Min dose Dose level The objective is met when the dose is greater
than or equal to the specified dose in all parts of
the ROI.
Max Dose level The objective is met when the max dose in the
dose ROI is less than or equal to the specified dose.
Min/max Dose level, The objective is met when at least/only the spec-
DVH Volume ified percentage of the ROI receives more than
(%) the specified dose.
Min/max Dose level, The EUD (equivalent uniform dose) function
EUD Parameter equals a mean dose objective when A is set to
A 1, with cold and hot spots given equal weight
when trying to achieve a uniform dose. If A>1,
high doses are given higher weight, and if AFigure 2.4: Illustration of the gamma method for a situation with a 0.25 cm spatial shift and
a 2.5% normalization difference between the measured and calculated dose. Panel a) shows
the dose, dose difference (DD) and distance to agreement (DTA), with the arrow pointing out
a region where the passing criteria (illustrated by the horizontal line) for both parameters are
exceeded. Notice that the DTA is highest where the dose gradient is shallow, while the DD
peaks where the gradient is sharp. Panel b) shows the corresponding gamma index (dotted
line), with the arrow pointing out a region where the dose distribution fails the gamma test.
From [33].
20Chapter 3
Material and methods
3.1 Patients
5 patients that have recently received radiotherapy treatment for cervical
cancer at St. Olavs Hospital were included in the study. All data was
anonymized before the study began, and some adaptions were made ret-
rospectively to the delineated structures to make the findings more clinically
relevant. The department protocol is to perform the planning CT scan as
well as the EBRT treatment with an empty bladder. Efforts are also made
to avoid air in the rectum. In accordance with current practice in the de-
partment, the density of the rectum was set equivalent to water if air was
visible on the planning CT images.
3.1.1 Delineation of clinical structures
There were some differences between the delineated structures used for the
actual treatment of the patients (according to the current department pro-
tocol) and the clinical structures defined in the EMBRACE II treatment
protocol (see section 2.5.1):
• A CTV-T HR was not defined, only a CTV-T corresponding to the
CTV-T LR.
• No ITV was defined, instead a PTV 45 margin of 7-8 mm from the
CTV-E and 12 mm from the CTV-T was used.
21• The margins for nodal targets were not consistent between patients.
The total GTV-N to PTV-N margins varied from 12-18 mm.
• Sigmoid colon and bowel were not delineated.
With respect to limited availability of physicians for delineation it was
decided to use the existing target structures, while sigmoid colon and bowel
were delineated by an oncologist for this study.
3.2 Treatment plan optimization
VMAT treatment planning was performed using the RayStation 6R treat-
ment planning system (by RaySearch Laboratories AB, Sweden).
3.2.1 Treatment planning aims
The dose constraints from the EMBRACE II protocol for EBRT of cervical
cancer with SIB to lymph nodes are summarized in table 3.1. These were
used as clinical goals in the treatment planning process.
It should be noted that the dose-volume recommendations for the bladder
are based on a protocol with comfortably filled bladder, while planning and
treatment at St. Olavs Hospital is performed with an empty bladder.
In certain cases, some clinical goals were inherently impossible to fulfill
because patient anatomy caused them to conflict with other goals. The main
priority was to fulfill all clinical goals for the target volumes and those listed
as hard constraints, while the focus for the remaining OARs was fulfilling all
clinical goals reasonably achievable for each patient.
When the goals for an OAR could not be achieved due to a conflict with
target volumes, attempts were made to keep the dose within the organ as
low as possible while maintaining the desired target coverage.
3.2.2 Selection of structures and objectives
In order to become familiar with the treatment planning system, a simple set
of objectives for the clinical structures based on the aims in table 3.1 was used
as a starting point for the first rounds of optimization. As challenges with
achieving the aims appeared or inspection of the dose distributions revealed
cold or hot spots in specific regions, the objectives were adjusted or new ones
22Table 3.1: Treatment planning aims from the EMBRACE II protocol [9].
Aims categorized as hard constraints are in bold font, while soft constraints
(not based on clinical evidence) are in normal font. Absolute values for dose
levels are given in parenthesis for easier comparison with other parts of this
report.
Structure Planning aims
PTV 45 V95% > 95% (42.75 Gy)
ITV 45* Dmin > 95% (42.75 Gy)
PTV-N# 55 D98% > 90% (49.50 Gy)
Dmax < 107% (58.85 Gy)
CTV-N# 55 D98% > 100% (55 Gy)
D50% > 102% (56.10 Gy)
PTV-N# 57.5 D98% > 90% (51.75 Gy)
Dmax < 107% (61.53 Gy)
CTV-N# 57.5 D98% > 100% (57.50 Gy)
D50% > 102% (58.65 Gy)
**
GTV-T + 10mm Dmax < 103% (46.35 Gy)
Bladder V40Gy < 75%
V30Gy < 85%
Dmax < 57.5 Gy
Rectum V40Gy < 85%
V30Gy < 95%
Dmax < 57.5 Gy
Sigmoid Dmax < 57.5 Gy
Bowel V40Gy < 250 cm3
V30Gy < 500 cm3
Dmax < 57.5 Gy
Femoral heads Dmax < 50 Gy
***
Spinal cord Dmax < 48 Gy
***
Kidneys Dmean < 15 Gy
Dmean < 10 Gy
*
This structure was not delineated and the planning
aim could therefore not be applied in this study.
**
This structure is not identical to the ”CTV-HR +
10mm” structure suggested in the EMBRACE II
protocol, but it has the same purpose (see section
2.5.2).
***
In case of para-aortic irradiation.
23were added, attempting to create robust plans according to the aims in the
EMBRACE II protocol.
Creation of auxiliary structures
In attempts to amend specific issues, various auxiliary structures were created
and their impact on the dose distribution assessed:
• To restrict high doses to their designated structures by achieving sharp
gradients, auxiliary ”ring structures” as recommended in the RaySta-
tion optimization guide were tested (see section 2.5.2), and the result-
ing treatment plans were compared to plans made with dose fall-off or
dose-volume objectives for the original structures only.
• To test different combinations of objectives for OARs, out-volumes
(BladderOut, BowelOut etc.), were created by removing the part of the
organ that overlapped the target volume, with an additional margin of
0.5 cm. They were created for bladder, bowel, rectum and sigmoid for
all patients, except in cases were the remaining volume was negligible.
Selection of OAR objectives
Two strategies for assigning objectives to OARs were tested, to see if there
were any differences in the ability to achieve the clinical goals:
1. Using the built-in dose fall-off function in RayStation (see table 2.2).
2. Defining a set of dose-volume objectives for each OAR and its out-
volume (if applicable, see previous section).
One treatment plan with each strategy was made for all patients. These
plans were created with 2 full single arcs and collimator angles 5◦ (ccw) and
25◦ (cw).
3.2.3 Evaluation of arc configurations
In addition to the plans made with 2 single arcs described in the previous
section, plans with 1 arc and a dual arc were created for all patients. These
plans were made using dose fall-off objectives for OARs. The objective set
used in the plan with 2 single arcs for each respective patient was used as a
24starting point, with individual adaptions made both before and during the
optimization to achieve as many clinical goals as possible as well as a clinically
acceptable dose distribution. After any major change in the objective set,
the optimization was reset and started over.
A collimator angle of 25◦ was used for the 1 arc and dual arc plans. For
the plans with 2 single arcs or dual arc, a maximum delivery time of 90 sec
was used for each arc. For the 1 arc plans, maximum delivery times of 90,
120 and 180 sec was tested for the first two patients. As some improvement
in plan quality was seen when the delivery time was increased to 120 sec, but
the actual time used remained around 120 sec even if longer delivery times
were allowed, 120 sec was chosen as the maximum delivery time for all 1 arc
plans.
As the plans made with 2 arcs were satisfactory, configurations with 3
arcs were not tested.
3.2.4 Beam and optimization settings
Unless otherwise stated, the following settings were applied:
• Beam energy: 6 MV (department practice).
• Leaf motion constrained to 0.5 cm/deg (department practice).
• Iterations before conversion: 7 (default).
• Intermediate and final dose computed automatically.
• Optimization tolerance: 1.000E-6.
3.3 Treatment plan evaluation
The following parameters were considered when evaluating the quality of the
treatment plans:
• How many clinical goals could be achieved.
• The number of monitor units (MU) required to deliver the plan.
• QA measurements according to department protocol for VMAT treat-
ment plans (see next section).
25• Clinical evaluation: Two medical physicists examined a selection of the
treatment plans and evaluated if the dose distributions were clinically
acceptable.
• Work flow: Fluency and efficiency of the treatment plan creation, and
potential resources required for implementation in the clinic.
3.3.1 QA measurements
Evaluation of the treatment plans included delivery to a Delta4 PT phantom
(by ScandiDos AB, Uppsala, Sweden). The conformity of the delivered dose
to the planned dose was evaluated as described in section 2.6.
26Chapter 4
Results
Each of the 5 patients included in this study had 1-4 positive lymph nodes. 4
patients had positive nodes in the true pelvis only and 1 also had a positive
common iliac lymph node. The mean total target volume (PTV 45) was
1853 cm3 and the mean nodal boost volume was 145.0 cm3 . A summary of
the tumor characteristics for each patient is given in table 4.1.
Table 4.1: Characteristics for each of the 5 patients included in the study.
The total target volume is the volume of the PTV 45, and the total boost
volume is the volume of the sum of all PTV-N’s.
Patient LNs in LNs outside Total target Total boost
true pelvis true pelvis volume [cm3 ] volume [cm3 ]
1 2 1 1849 128.6
2 2 - 1874 81.0
3 2 - 1532 116.7
4 1 - 1450 25.9
5 4 - 2561 372.8
The following margins had been used for nodal targets: GTV-N to CTV-
N margins of 5 mm for 4 patients and 10 mm for 1, and CTV-N to PTV-N
margins of 7-8 mm, giving total GTV-N to PTV-N margins of 12-18 mm.
Patient 5 had both the largest margins and the highest number of positive
lymph nodes, resulting in a very large nodal boost volume.
274.1 Creation of auxiliary structures
An example of the dose gradient inside a lymph node target volume with
CovP planning is shown in figure 4.1. Achieving a sharp gradient around
the lymph node PTVs proved challenging, resulting in high doses to large
areas surrounding the PTV-N’s. To amend this, ring structures were created
around the PTV-N’s as follows: After removing the PTV-N(’s), the remain-
ing PTV 45 was split into two separate auxiliary structures; a gradient (ring)
volume, PTV Grad, consisting of a 1 cm thick ring around the PTV-N(’s),
and PTV Help45 which includes the remaining parts of the PTV 45 (figure
4.2). Thus, objectives could be customized to the two separate regions within
the PTV 45. The effect on the dose distribution is illustrated in figure 4.3.
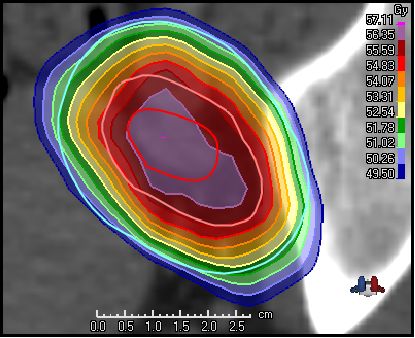
Figure 4.1: Illustration of the dose distribution in and around a lymph node
target volume with CovP planning. Dose levels ≥90% of the prescribed LN
dose (55 Gy) are shown in color wash. The contours are red for GTV-N 55,
light pink for CTV-N 55 and cyan for PTV-N 55.
Other approaches that were tested but found less effective for this purpose
28included:
• Dose-volume objectives for PTV 45 only (such as 48.15 Gy to max 10%
of the volume).
• A dose fall-off objective for the entire PTV 45 structure.
• A max dose objective of 46.5 Gy for an auxiliary structure equal to
PTV 45, but with PTV-N’s with a 5 mm margin subtracted + a dose
fall-off objective with a low dose level of 45 Gy in the 1 cm closest to
the PTV-N’s.
Figure 4.2: Auxiliary structures used in the treatment planning. PTV Grad
in blue, PTV Help45 in dark red/maroon, NormalTissue in grey and GTV-T
+ 10 mm in purple. Other structures shown are GTV-T (red), PTV-N# 55
(cyan), PTV 45 (pink), bowel (dark green), rectum (brown) and body (olive).
29Figure 4.3: Dose distributions showing the improved conformity around the nodal PTVs
(cyan) and PTV 45 (pink) after introducing the PTV Grad (blue) and NormalTissue
(grey) ring structures (panel b). In panel a), dose-volume objectives for PTV 45 are used
in an attempt to limit high doses ’leaking’ around the lymph node PTVs, and a dose fall-
off objective on External is used to limit high doses in normal tissue outside the delineated
structures. Other structures shown are bowel (dark green) and sigmoid colon (light green).
30To achieve a sharp gradient from the PTV 45 to the adjacent normal
tissue, two approaches were tested; a dose fall-off objective for External (body
+ table), or dose-volume objectives for a structure called NormalTissue,
consisting of a 3.5 cm thick region (ring) starting 0.5 cm outside the PTV 45
(see figure 4.2). The NormalTissue structure made it easier to control the
dose distribution and limit high doses outside the PTV 45 (see figure 4.3),
and was therefore preferred in the further work.
For one patient, neither approach worked satisfactorily as significant hot
spots in normal tissue remained. This could be improved using a combination
of both NormalTissue objectives and a dose fall-off on External.
As no CTV-T HR was delineated, the ”CTV-T HR + 10 mm” struc-
ture suggested in the EMBRACE II protocol to control the dose in parts of
OARs receiving a significant brachytherapy dose could not be created. In-
stead, GTV-T + 10mm was used. To avoid conflict with the LN target
coverage, PTV-N’s with a 5 mm margin were removed from the structure
(see figure 4.2). It turned out that the max dose aim of 103% of 45 Gy for
this region could not be achieved in any of the plans. Inspection of the dose
distributions revealed that the highest doses occurred near the edge of the
structure towards the PTV-N’s, as shown in figure 4.4.
A list of auxiliary structures used in the optimization process and details
on how they were derived can be found in appendix A.1.
4.2 Selection of OAR objectives
Two plans were created for each of the 5 patients, one where the dose fall-off
function was used for bladder, bowel, rectum and sigmoid, and one where
a detailed set of dose-volume objectives were defined for each OAR and its
corresponding out-volume (see section 3.2.2 and figure 4.5).
A summary of the parameters used for evaluation of the plans is pre-
sented in table 4.2, and details for each plan are listed in appendix C. The
ability to achieve the clinical goals was similar for the two approaches; only
for one out of the 120 evaluated goals did the plans differ (the max dose
aim for bowel was achieved in the dose fall-off plan only for patient 4). The
PTV 45 coverage was slightly higher in all the plans with dose-volume objec-
tives, although the differences were small (0.04-0.23 %) and all values were
satisfactory (>98.9%). The dose distributions were evaluated by two medical
physicists, who did not find any significant differences and concluded that
31You can also read