Business Performance Report 2021 - Amazon AWS
←
→
Page content transcription
If your browser does not render page correctly, please read the page content below
Business Performance Report 2021

Contents
TOTAL GROUP PERFORMANCE BP–02
ON FARM BP–14
GROUP OPERATIONS BP–18
SUMMARY OF REGIONS BP–26
ASIA PACIFIC BP–28
AMENA BP–34
GREATER CHINA BP–38
Fonterra uses several non-GAAP measures when discussing financial performance. utilised by all companies. Accordingly, these measures may not be comparable with
These measures include normalised profit after tax, normalised EBIT, EBIT, similarly titled measures used by other companies. Non-GAAP financial measures NEW ZEALAND MILK BP–42
normalised earnings per share, normalisation adjustments and total Group measures. should not be viewed in isolation nor considered as a substitute for measures
Total Group measures present the combined financial performance of the Group’s reported in accordance with NZ IFRS. Non-GAAP measures are not subject to audit DISCONTINUED OPERATIONS BP–45
continuing and discontinued operations. Non-GAAP financial measures are not unless they are included in Fonterra’s audited Financial Statements. Please refer
defined or specified by NZ IFRS. Management believes that these measures provide to the Non-GAAP Measures section in Fonterra’s 2021 Annual Review for further HISTORICAL SUMMARY BP–46
useful information as they provide valuable insight on the underlying performance information about non-GAAP measures used by Fonterra, including reconciliations
of the business. They are used internally to evaluate the underlying performance of back to NZ IFRS measures. Definitions of non-GAAP measures used by Fonterra can GLOSSARY BP–53
business units and to analyse trends. These measures are not uniformly defined or be found in the Glossary in the Business Performance Report.
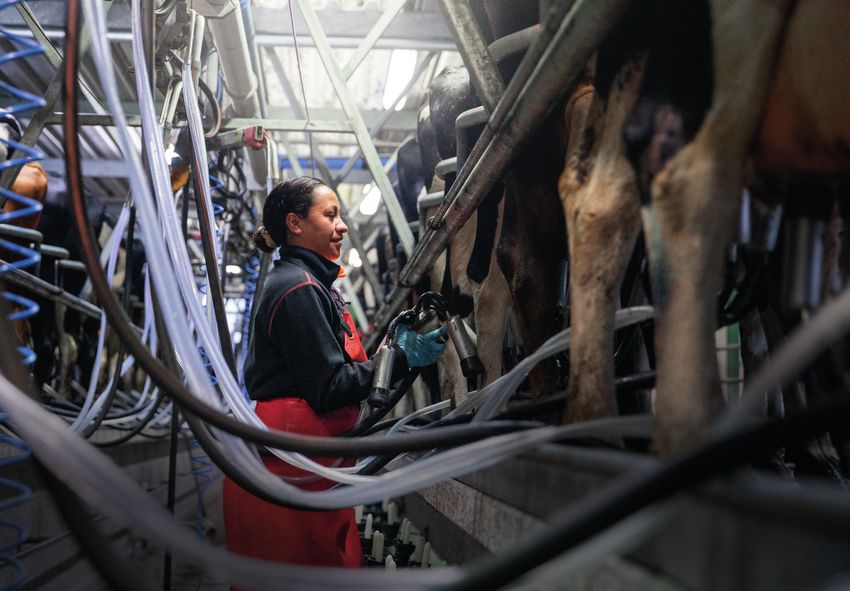
IMAGE: COVER IMAGE:
Aiesha, Bay of Plenty Harepaora, Lana & Greg, Bay of Plenty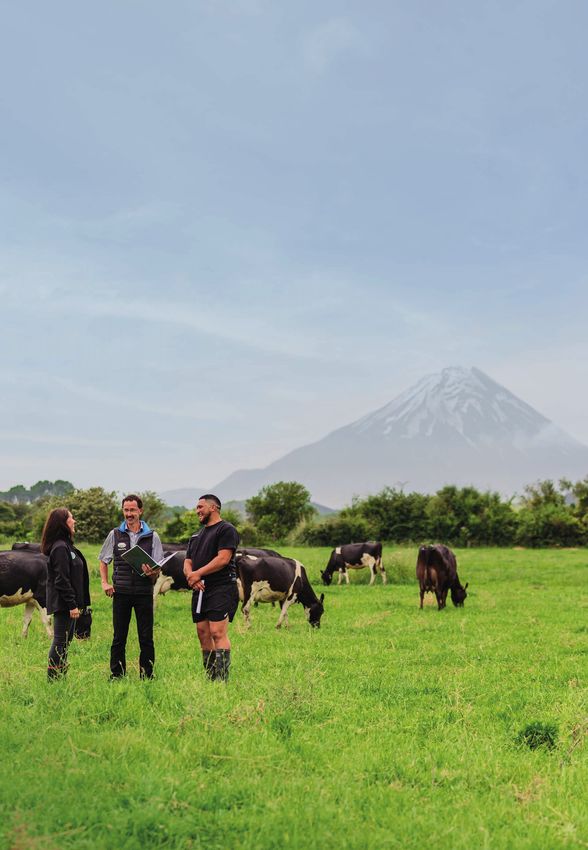
BUSINESS PERFORMANCE REPORT 2021                                                                                                                                                                                                                                                           BUSINESS PERFORMANCE REPORT 2021

                                                                                                                                            Our reported profit after tax of $599 million is $60 million lower than

Total Group                                                                                                                                 last year, with the prior year benefiting from larger gains from the sale of
                                                                                                                                            non-core assets.

Performance                                                                                                                                 2020 Financial Year (FY20)
                                                                                                                                            Normalised to Reported Profit After Tax1
                                                                                                                                                                                                        – DPA Brazil impairment
                                                                                                                                                                                                                                                      2021 Financial Year (FY21)
                                                                                                                                                                                                                                                      Normalised to Reported Profit After Tax1

                                                                                                                                                                                                        – China Farms impairment                        – Ying and Yutian
                                                                                                                                                                                                        – Falcon China Farms                              China Farms sale
We have continued to build on last year’s solid performance with     Total Pay-out1                                                                                                                       JV impairment                                 – China Farms
                                                                                                                                    $7.74      – DFE Pharma sale                                        – Strategic review impacts                        impairment reversal                       – DPA Brazil impairment
another strong result in the 2021 Financial Year. On average we                                                             $7.19
returned $7.54 for every kilogram of milk solids our farmer                $6.52                $6.79                               0.20       – FoodspringTM sale                                      – Sale of Beingmate shares                      – Falcon China Farms JV sale                – Sale of Beingmate shares
                                                                                                                $6.35       0.05
owners supplied us. Combined with an increased dividend of                                       0.10
20 cents per share, we have delivered a Total Pay-out of $7.74 per          0.40
kgMS. We have continued to improve our operating performance
and underlying earnings, which combined with our continued
focus on financial discipline and the divestment of non-core                                                                                                                                        (232)
assets, has seen our net debt reduce by a further $872 million                                                                                                               493                                                                                                 95               (84)
and our key leverage metrics improve.
                                                                                                                                                                                                                              659                              588                                                   599
                                                                            6.12                 6.69           6.35        7.14    7.54             398
                                                                            2017                 2018           2019        2020    2021
                                                                                                                                             FY20 normalised             Asset sales           Net impact of    FY20 reported                            FY21 normalised     Asset sales      Net impact of    FY21 reported
                                                                                                                                              profit after tax                              other normalisation profit after tax                          profit after tax                 other normalisation profit after tax
                                                                               Farmgate Milk Price               Dividend

                                                                     1. Refer to the Glossary for definition.                               1. Normalised and reported profit after tax includes amounts attributable to non-controlling interests.

02
BP/

                                                                                                                                                                                                                                                                                                         03                       BP/
BUSINESS PERFORMANCE REPORT 2021 BUSINESS PERFORMANCE REPORT 2021
Our normalised profit after tax of $588 million increased $190 million Overall, Fonterra milk collections are up.
on last year - after removing the impact of the gains on asset sales and other Our milk collections are dominated by our New Zealand sourced milk.
normalisations, our underlying performance has improved on last year.
MILK COLLECTIONS FROM MAIN REGIONS
FY20 to FY21 Normalised Profit After Tax1 (LITRES, MILLION) 2020 2021 Change
Fonterra New Zealand 1
16,876 17,121 1.5%
Higher other operating
Prior year incurred income and non-recurrence Fonterra Australia2 1,393 1,362 (2.2)%
several impairments of adverse items Fonterra Chile3 448 483 7.8%
that were not normalised Total 18,717 18,966 1.3%
Lower average debt
Down 3% due to and interest rates
increased milk costs
47
70 588 Fonterra milk collection market share in New Zealand1
86
398 (94) 81
81.7% 80.8% 80.0%
FY20 Gross profit Operating Other items Finance costs Tax FY21 79.0% Fonterra milk collections for the season were up in New Zealand
normalised expenses normalised by 1.5%, reflecting the overall good growing conditions across
profit after tax profit after tax New Zealand in the second half of the season.
Our market share in New Zealand has continued to decline as
1. Normalised profit after tax includes amounts attributable to non-controlling interests.
other processors have built additional processing capacity.
2018 2019 2020 2021
The higher milk price tightened our gross margin over the last half of the Looking at our continuing operations by region:
financial year, particularly in the final quarter. However, throughout the year
– Asia Pacific normalised EBIT increased 28% to $305 million, Fonterra milk collection market share in Australia2
we have remained focused on allocating milk into products that generate the
due to significant improvements in our Foodservice and Consumer channels
best overall returns to Fonterra and our farmer owners. This can be seen in our
21.6%
results with the improvement in our underlying earnings driven by our – Greater China normalised EBIT increased 10% to $403 million,
diversified portfolio across our three channels and regions, coupled with lower driven by the strength of the Foodservice channel, China’s continued
economic recovery from the impact of COVID-19 and its increasing 18.3%
interest expense from lower average debt and interest rates.
demand for dairy Our Australian milk collections were down slightly despite favourable
On a continuing operations basis, our Consumer channel normalised EBIT 15.8% 15.4% on-farm conditions stabilising milk production in Australia. This was due
increased 196% to $290 million and our Foodservice channel normalised – AMENA normalised EBIT was down 28% to $336 million, due
to a conscious decision to optimise milk purchases focused on higher
EBIT increased 51% to $369 million. The improved performances in the to lower sales volumes and the impact of pricing lags on longer-term
value returns.
Consumer and Foodservice channels were offset by the tighter margins in contracts. Lower sales volumes were a result of milk being allocated to 2018 2019 2020 2021
our Ingredients channel, which had lower normalised EBIT of $385 million, Greater China and parts of Asia Pacific where demand was the strongest.
down 47%. However, we have seen improvements in our AMENA Foodservice and
Consumer channels, including a turnaround for our Chilean business
Fonterra milk collection market share in Chile3
21.2%
20.6%
20.2%
19.3% We continued to regain market share in Chile, with milk collections up 7.8%
on the prior year. This was achieved through increased farmer engagement
and a competitive and consistent milk price policy. The increased collections
have supported the strong demand in our Chile Consumer business this year,
covered in more detail in the AMENA section.
2018 2019 2020 2021
1. Fonterra New Zealand market share and collections are for the period 1 June - 31 May.
2. Fonterra Australia market share and collections are for the period 1 July - 30 June.
3. Fonterra Chile market share and collections are for the period 1 August - 31 July.
04
BP/
05 BP/
BUSINESS PERFORMANCE REPORT 2021 BUSINESS PERFORMANCE REPORT 2021
Breakdown of Total Group Performance Despite challenges created by COVID-19, we have been successful in selling Our Total Group gross profit reduced $94 million relative to last year, due
and shipping our products to our customers. Sales volume for the year was to lower gross margins in the second half, in particular in the fourth quarter,
FOR THE YEAR ENDED 31 JULY 2020 31 JULY 2021 up 33,000 metric tonnes on the previous year to 4.1 million metric tonnes. across all regions - AMENA, Asia Pacific and Greater China. Our Total Group
Furthermore, it was our highest shipping volume on record out of gross margin was impacted in the second half of the financial year due to our
NORMALISED BASIS CONTINUING DISCONTINUED CONTINUING DISCONTINUED New Zealand, with a total of 2.59 million tonnes shipped. in-market pricing not increasing as quickly as the cost of milk. The impact can
NZD MILLION OPERATIONS1 OPERATIONS1 TOTAL GROUP OPERATIONS1 OPERATIONS1 TOTAL GROUP
be seen between the two periods, with gross margin of 17.4% in first half and
Sales volume (‘000 MT) 3,842 227 4,069 3,874 228 4,102 12.4% in the second half.
Revenue 20,282 693 20,975 20,565 559 21,124
Cost of goods sold (17,236) (531) (17,767) (17,581) (429) (18,010) Our Foodservice and Consumer channels had improved performances in all
Gross profit 3,046 162 3,208 2,984 130 3,114
Gross Profit - Product Channel three regions, predominantly driven by changing consumption trends during
COVID-19.
Gross margin (%) 15.0% 23.4% 15.3% 14.5% 23.3% 14.7%
Operating expenses2 (2,194) (129) (2,323) (2,153) (89) (2,242) FOR THE YEAR ENDED 31 JULY The Ingredients channel was adversely impacted across all three regions
mainly due to the use of longer-term pricing contracts increasing the impact
Other2,3 (5) (1) (6) 65 15 80 NORMALISED BASIS (NZD MILLIONS) 2020 2021 CHANGE¹
the quickly rising cost of milk had on our gross margin.
Normalised EBIT 847 32 879 896 56 952 Ingredients 1,472 1,104 (25)%
Normalisations4 435 (167) 268 (9) 16 7 Foodservice 538 677 26% Our business is diversified across regions and product channels. This allowed
EBIT 1,282 (135) 1,147 887 72 959 Consumer 1,032 1,154 12% us to reduce the impact of the higher milk cost by continuing to allocate milk
Unallocated costs and eliminations 4 49 1,125% into the products that generate the best overall returns.
1. Refer to Note 1a and 2c of the FY21 Financial Statements.
2. Impairments of intangible assets not included in the strategic review for the 2020 Financial Year ($55 million) have been reclassified from ‘other’ to operating expenses. Continuing Operations 3,046 2,984 (2)% – Greater China normalised gross profit
3. Consists of other operating income, net foreign exchange gains/(losses) and share of profit or loss on equity accounted investees. increased 7% to $836 million
4. Refer to the Non-GAAP Measures section of the Annual Review 2021. Discontinued Operations 162 130 (20)%
Total Group gross profit 3,208 3,114 (3)% – Asia Pacific normalised gross profit
decreased 1% to $1,195 million
1. Percentages as shown in table may not align to calculations of percentages based on numbers in
the table due to rounding of figures. – AMENA normalised gross profit
decreased 14% to $904 million
Gross Margin - Product Channel
FOR THE YEAR ENDED 31 JULY 2020 2021
Ingredients 10.7% 8.1%
Foodservice 20.1% 22.9%
Consumer 26.3% 28.4%
Continuing Operations 15.0% 14.5%
Discontinued Operations 23.4% 23.3%
Total Group gross margin 15.3% 14.7%
06
BP/
07 BP/
BUSINESS PERFORMANCE REPORT 2021 BUSINESS PERFORMANCE REPORT 2021
Total Group normalised operating expenses are $81 million, or 3%,
lower than last year.
Of this decrease, $41 million relates to the Group’s Continuing Operations.
The prior year’s operating expenses for Continuing Operations included
$55 million of impairments.
Globally we invested $110 million in research and development this year,
up from $98 million the prior year. The majority is reported in our operating
expenses which increased 30% relative to the comparative period, and the
remainder is within our cost of goods sold.
Operating Expenses1
FOR THE YEAR ENDED
The $86 million improvement in ‘Other’ relative to last year, was largely due to – The sale of our investment in the Falcon China Farms joint venture was also
NORMALISED BASIS NZD MILLION 31 JULY 2020 31 JULY 2021
higher other operating income and the non-recurrence of adverse items in the completed during the year with $88 million of cash received from the sale.
Costs allocated to regions previous period. Total Group normalised EBIT increased 8%, or $73 million, A gain on sale of $40 million, including an impairment reversal of
Selling & marketing 636 656 to $952 million, due to the reduction in operating expenses and increase in $15 million, was included in Total Group EBIT
Distribution & storage 539 543 ‘Other’. Total Group EBIT decreased 16%, or $188 million, to $959 million.
– During the year we completed the sale of the remaining shareholding in
Administrative expenses 619 574 Normalisation adjustments for the year were $7 million, a reduction of
Beingmate, marking a full exit of our investment in the company. The
$261 million on the prior year which included gains on sale from DFE Pharma
Research & development 63 82 impact of selling the shares in the year ended 31 July 2021 was a loss of
and foodspringTM. The normalised items in 2021 Financial Year reflect gains
Other expenses 96 75 $49 million. We received cash proceeds of $110 million from the sale of the
from the sale of the Ying and Yutian China farming hubs and the Falcon China
shares in the year ended 31 July 2021 and total cash received from the sale
Total allocated operating expenses 1,953 1,930 Farms joint venture but offset by realised losses on the sale of Beingmate
of all shares was $241 million
Unallocated costs 241 223 shares and a further impairment of the carrying value of DPA Brazil.
Operating expenses from Continuing Operations 2,194 2,153 – A further impairment of $39 million pre-tax, $35 million post-tax, was
– The sale of the China farming hubs, in Ying and Yutian, was completed
recognised for DPA Brazil based on an assessment of the fair value of the
Operating expenses from Discontinued Operations 129 89 during the year and resulted in a gain on sale of $32 million. This gain is in
business. The sale of DPA Brazil is progressing but has been made
Total Group operating expenses2 2,323 2,242 addition to an impairment reversal of $23 million. The total impact to our
challenging by the impacts of COVID-19
Total Group EBIT was $55 million
1. Does not align to FY21 Financial Statements, predominately due to additional categories.
2. Impairments of intangible assets not included in the strategic review for the 2020 Financial Year ($55 million) have been reclassified from ‘other’ to administrative expenses category within Total Group
operating expenses.
Innovation is a key part to our strategy. Our central research and development – New launches across our Anlene range, including Anlene 5X™, a functional Our Total Group net finance costs reduced $70 million, or 21%, due to
facility, based in Palmerston North, is supported by eight in-market application nutrition product providing benefits across five key areas – strong bones, lower levels of debt and reductions in global interest rates.
centres which together deliver new products for customers, consumers and energy, strong muscles, flexibility and movement
chefs around the world.
– Our core Ingredients channel has seen continued success with NZMPTM Total Group Performance1
Even with the in-market challenges from COVID-19, it has been a good year NutriWhite, a fortified dairy blend powder that delivers to the ever-
for new product launches: increasing need for accessible nutrition, driven by strong market demand FOR THE YEAR ENDED
across the Middle East, Africa and South East Asia
– The launch of seven new cream products for Foodservice through NZD MILLION 31 JULY 2020 31 JULY 2021 CHANGE2
AnchorTM Food Professionals that includes two new ambient creams and – In China we also continued to launch novel new consumer products, like EBIT 1,147 959 (16)%
the launch of Cheese-Pro Cream™, a deliciously rich and smooth cream cheese lollipops, a cream cheese-based snack that is growing in popularity
Net finance costs (332) (262) 21%
with more than 18% natural cheese, delivering a premium tea macchiato across Asia
topping. Tea macchiatos are well established in China and growing in Tax expenses (156) (98) (37)%
We have also focused on commercialisation of our intellectual property
popularity across South East Asia Reported profit after tax 659 599 (9)%
with some significant opportunities confirmed during the year through our
– A new range of Individually Quick Frozen (IQF) Mozzarella with enhanced AMENA region. One example of this is our arrangement with Land O’Lakes in Normalisation adjustments3 (268) (7) (97)%
functional performance for at-home delivery, leveraging continued high the USA to leverage Fonterra’s intellectual property in Foodservice products Tax on normalisation adjustments 7 (4) –
demand globally alongside Land O’Lakes’ excellent sales and distribution network to sell, Total normalised profit after tax 398 588 48%
distribute and promote UHT creams into the USA Foodservice channel. (Profit)/loss attributable to non-controlling interests 27 (21) –
– The ongoing roll-out of Fonterra’s premium probiotic ingredients continues
to generate value and investment is targeted at unlocking the next Normalisation adjustments attributable to non-controlling interests (43) (17) (60)%
generation of “better for you” probiotics as we continue our focus on Normalised profit after tax attributable to equity holders of the Co-operative 382 550 44%
wellness and nutrition Normalised earnings per share (cents) 24 34 42%
Full Year dividend per share (cents) 5 20 300%
1. Includes Continuing and Discontinued Operations.
2. Percentages as shown in table may not align to calculations of percentages based on numbers in the table due to rounding of figures.
3. Refer to the Non-GAAP Measures section in the Annual Review 2021.
08
BP/
09 BP/
BUSINESS PERFORMANCE REPORT 2021 BUSINESS PERFORMANCE REPORT 2021
Our sources and uses of cash Free Cash Flow1 ($ million)
Total Group free cash flow for the year was $1.4 billion, reflecting the strong less $0.6 million of capital invested. The free cash flow of $1.4 billion has been
underlying performance for the year combined with the proceeds of asset used to pay interest of $0.3 billion, dividends of $0.2 billion (5 cents from last
sales. It is made up of $1.2 billion from operating activities and $0.2 billion year’s final dividend and this year’s interim dividend of 5 cents) and reduce
Total Group capital invested was $608 million, comprising of $545 million
from investing activities – which comprised $0.8 billion from divestments debt by $0.9 billion.
in capital expenditure and $63 million of other capital invested. The capital
1,828
1,417 expenditure of $545 million comprised $466 million for essential projects
1,095 to maintain and improve existing assets and $79 million for discretionary
Cash flow and change in net debt1
670 600 projects to drive future growth. The increase on the prior year is in part due to
deferred projects planned for the prior year being delayed due to COVID-19.
$(0.6bn) 2017 2018 2019 2020 2021 In addition, capital expenditure has increased in response to increasing
Capital expenditure
1. Refer to the Glossary for definition.
regulatory requirements on wastewater treatment, reducing emissions from
and other
thermal fuel sources and also maintaining integrity and reliability across our
network of processing assets.
$0.8bn $0.2bn
Cash from Net cash flow Capital Invested1 ($ million) Across New Zealand, we continue to progress our annual truck and trailer
divestments investing activities replacement programme and on-farm milk vat replacement programme.
and asset sales 1,022
$(0.1bn) 161
In addition to these annual programmes, the roll out of our milk vat telemetry
Tax payments technology was largely implemented this year and will be completed next year.
724
$1.5bn $1.2bn $(0.5)bn 461 124
525
608
63
We are continuously working through a capital expenditure programme to
keep our processing sites fit for purpose. Key projects included refurbishment
Net cash Interest, dividend 260 106 79
Cash generated of the powder 3 and 4 buildings at Whareroa, wastewater upgrades at
from operations flow from and other 37
$(0.2bn) operating
activities
400 340 382
466 Whareroa and Te Awamutu, and the commencement of a biomass boiler
installation at the Stirling site to replace coal.
Net movement
in working capital
$1.4bn $0.9bn 2018 2019 2020 2021
Free cash Reduction in
flow net debt Essential Discretionary Other
1. Refer to Glossary for the definition. capital expenditure capital expenditure capital invested
1. Refer to the Glossary for definition of capital invested and capital expenditure
Free cash flow for the year of $1.4 billion was $0.4 billion lower than last year – An increase in cash spent on the acquisition of property, plant and
which reflects: equipment. Significant projects are included below under Capital Invested
– A $298 million reduction in cash flow from operating activities which – $31 million increase in intangible asset spend to enhance the Group’s
included an increase in the working capital funding as a result of the higher security systems and customer facing capability technology
milk price and higher milk collections for the year, and lower gross profit
for the year Working capital days throughout the year have increased by 5.8 days Working Capital Days Drivers
compared to the previous year.
The key drivers of this were: DAYS 2020 2021
Cash flow and change in net debt
– The increase in inventory is a result of the higher cost of milk and higher Receivables 30.9 29.4
average inventory volume throughout the year as a result of supply Payables (28.5) (30.4)
FOR THE YEAR ENDED chain challenges Inventory 82.4 91.6
NZD MILLION 31 JULY 2020 31 JULY 2021 – Receivable days are favourable and the reduction in average receivable Total 84.8 90.6
Cash generated from operations1 1,671 1,449 days is due to improved customer collection management. Overdue
Net change in working capital (106) (171) debtors have also reduced
Working Capital Days1
Net tax paid (73) (84) – Higher average payables days due to increased capital expenditure
A. Net cash flows from operating activities 1,492 1,194
Cash flows from investing activities
Divestments and asset sales 827 782
Capital expenditure and other2 (491) (559)
90.6
B. Net cash flows from investing activities 336 223 82.7 82.8 84.8
75.1
Free cash flow (A+B) 1,828 1,417
Interest, dividend and other (444) (452)
Non-cash changes in net debt and other3 (294) (93)
2017 2018 2019 2020 2021
Reduction in net debt4 1,090 872
1. Refer to the Glossary for definition.
1. Includes EBIT and non-cash and non-operating adjustments made to EBIT to determine cash generated from operations.
2. Capital expenditure presented in this table is different to capital expenditure reported primarily due to treatment of livestock and accruals.
3. Includes adjustment for disposal groups held for sale.
4. Net debt excludes amounts attributable to disposal groups held for sale.
10
BP/
11 BP/
BUSINESS PERFORMANCE REPORT 2021 BUSINESS PERFORMANCE REPORT 2021
Our net debt levels have continued to decrease year-on-year, Net Debt1 ($ billion) A summary of our key metrics shows that we have improved in many areas
down $872 million. that are important to us. It shows the benefit of the focus we have put in over
the last three years to reset the business – by focusing our strategy of
Strong operational earnings combined with the $748 million in proceeds from
maximising the value of our New Zealand milk, moving to a customer-led
the sale of the two China farming hubs, Ying and Yutian, the Falcon China
operating model and strengthening our balance sheet.
Farms joint venture, the Agrifeeds joint venture and the remaining Beingmate
shares allowed us to reduce net debt by $872 million during the year.
The reduction in net debt was achieved despite the increased working capital 6.2 Key metrics1
5.6 5.7
requirements resulting from the higher milk price and the additional volume 4.7
3.8
in inventory. NZD 2020 2021
Both leverage metrics have also improved as a result of the lower net debt and Total number of New Zealand farms 9,011 8,827
2017 2018 2019 2020 2021
higher earnings and are within our long-term target ranges. The gearing ratio New Zealand milk solids collected (million kgMS)2 1,517 1,539
is within the 30-40% target range and the debt to earnings ratio of 2.7x is Total Pay-out 7.19 7.74
1. Net debt excludes amounts attributed to disposal groups held for sale. Refer to Glossary for
within the 2.5 to 3.0x target range. definition. Farmgate Milk Price (per kgMS) 7.14 7.54
Dividend (per share) 0.05 0.20
Return on capital3, 4 (%) 6.6% 6.6%
Return on capital is unchanged Return on Capital (%) Debt to EBITDA3,5 3.3x 2.7x
Our average capital employed was stable year-on-year. The impact of ENIBD gearing ratio6 (%) 41.4% 35.5%
divestments in the current and prior year reduced our average capital 13,439 13,469 13,419 Adjusted net debt gearing ratio7 (%) 44.2% 38.5%
employed, but this was offset by the increase in average working capital 12,313 12,281
1. Refer to the Glossary for definition of the metrics displayed in the table.
in the current year. 8.0% 2. Based on the 12-month milk season of 1 June – 31 May.
The increase in our normalised EBIT has been offset by an increase in the 6.6% 3. Calculation of metric includes amounts relating to Continuing and Discontinued Operations.
6.6% 4. For the 2021 Financial Year the notional tax charge was set to 16.1% (2020 Financial Year: 8.4%). The 2021 return on capital would be 7.2% if calculated with the prior year notional tax charge. In 2021 the
notional tax rate applied to normalised EBIT.
6.2% methodology to calculate return on capital was updated to align the definition of debt with the adjusted net debt used in the debt to EBITDA ratio and exclude hedge reserves from total equity. The prior
years have been restated for consistency with current period.
5.6% 5. Prior years’ debt to EBITDA have been restated for consistency with the current period. Previously, adjusted net debt included a further cash adjustment for 25% of cash and cash equivalents held by the
parent.
1,155 902 812 879 952 6. Economic net interest-bearing debt gearing ratio. Excludes amounts attributed to disposal groups held for sale.
7. Going forward, we will change the way we measure net debt so that the net debt (adjusted net debt) included in the gearing ratio and debt to EBITDA will be on the same basis. This aligns with certain credit
2017 2018 2019 2020 2021 rating agency methodology. Under the new methodology net debt for the 2021 Financial Year would be $4.3bn.
Total Group Average Return on
normalised EBIT1 capital employed1 capital1,2 (%)
($million) ($million)
1. Refer to the Glossary for definition.
2. For the 2021 Financial Year the notional tax charge was set to 16.1% (2020 Financial Year: 8.4%).
The 2021 return on capital would be 7.2% if calculated with the prior notional tax charge. In 2021
the methodology to calculate return on capital was updated to align the definition of debt with the
net debt used in the debt to EBITDA ratio and exclude hedge reserves from total equity. The prior
years have been restated for consistency with the current period.
Dividend Calculation
The strong result for the year and Fonterra’s strengthened balance sheet have
put us in a position to return an increased dividend to shareholders and unit NZD CENTS PER SHARE 2020 2021
holders. Fonterra’s dividend policy is a payout ratio of 40 to 60% of reported Normalised earnings¹ 24 34
profit after tax, excluding abnormal gains. Distributions of any abnormal gains
Add: normalisations 19 2
are considered separately. For the year ended 31 July 2021 abnormal gains
included the normalised gains from the sale of China Farms and the China Reported earnings¹ 43 36
Farms joint venture, and totalled six cents per share. Less: abnormal gains (32) (6)
Net earnings for dividend payment² 11 30
Our total dividend for the year of 20 cents per share includes an interim
dividend of 5 cents per share and a final dividend of 15 cents per share. 3 cents Dividend payment percentage (%) 45% 57%
of the final dividend of 15 cents per share reflects the addition of abnormal Dividend based on attributable earnings 5 17
gains, including the reversal of previous impairment of our China Farms. Dividend based on abnormal gains³ - 3
Total dividend 5 20
Interim dividend - 5
Final dividend 5 15
1. Attributable to equity holders of the Co-operative, excludes non-controlling interest.
12 13
2. Represents net earnings as specified in the Dividend Policy and is calculated as reported profit
after tax less abnormal gains.
3. Includes the reversal of previous impairment of our China Farms.
BP/ BP/
BUSINESS PERFORMANCE REPORT 2021 BUSINESS PERFORMANCE REPORT 2021
Our New Zealand supplier base and owners
On Farm Composition of our supplier base
82 126 As at 31 July, the Co-operative collected milk from 8,581 shareholding
133 155 246 farms and 246 non-shareholding supplying farms around New Zealand.
The decline in supplying farms over time has been due to increased
competition from other processors, consolidation of farm ownership and
174,397 changes in land uses.
168,361
We believe having a strong dairy co-operative makes a real 158,696
165,014
155,733 The increase in non-shareholding farms is due to the growth in new farms
difference to our farmer owners, and to New Zealand. Our scale
opting to supply MyMilk as part of their pathway to becoming a Fonterra
and diversity allow us to move our farmer owners’ milk into the
shareholding supplier. The 59% increase in non-shareholding farms from 2020
most valuable products and markets. This helps mitigate some
to 2021 was driven by MyMilk becoming available to eligible suppliers in the
of the risk for farmers that comes when demand for certain
North Island.
products or markets softens. 9,715 9,358 9,095 8,856 8,581
While the trend of increasing production per farm over time has generally
2017 2018 2019 2020 2021 been driven by the increasing size of supplying farms, herd genetics and the
advancements in farm management – this year’s growth has also been driven
Shareholding Non-shareholding Average production
farms farms per farm (kgMS)
by higher milk prices supporting milking later in the season.
Share Capital
As at 31 July, the Co-operative had 1,613 million shares on issue, with shares over three seasons in accordance with Fonterra’s constitution. Share
1.1 million shares being issued in October 2020 as part of Fonterra’s Standard compliance obligations were also put temporarily on hold for those
Dividend Reinvestment Plan. farmers who have not yet met their compliance obligations for the current
2020/21 Season. This is so that no farmers are required to trade for
At 31 July, supplying farmers were required to hold 1,403 million shares in
compliance purposes during the temporary cap and until a date that is
aggregate to meet their Share Standard compliance obligations. Farmers
to be advised.
used 41 million vouchers to meet their shareholding requirement.
The increase in the aggregate minimum shareholding requirement was
Therefore, there are 251 million shares that are considered tradeable Dry
primarily due to the lift in the three season rolling average production, with
Shares, of which 107 million are currently held by the Custodian. For every
the 2020/21 total production of 1,539 million kgMS, being 34 million kgMS
Dry Share the Custodian holds, there is a corresponding unit in the Fonterra
more than the season it is replacing in the three season average – this being
Shareholders’ Fund (the Fund).
the 2017/18 total production of 1,505 million kgMS.
On 6 May 2021 the Fund was temporarily capped by suspending shares in the
Vouchers have reduced over time due to not being transferable between
Fonterra Shareholders’ Market being exchanged into units in the Fund while
shareholders. As shareholding farmers cease supplying milk to Fonterra any
Fonterra consults with its shareholders on the capital structure of the
vouchers held by the farmer are cancelled. The reduction in vouchers does not
Co-operative. At the same time, Share Standard compliance obligations for the
impact total shares on issue or directly impact the Fund size.
2021/22 Season were put temporarily on hold for all supplying farmers
holding a minimum of 1,000 shares and for exiting farmers that are selling
SHARE CAPITAL (MILLION) 2017 2018 2019 2020 2021
Total Shares on Issue 1,607 1,612 1,612 1,612 1,613
Aggregate Minimum Shareholding Requirement 1,419 1,391 1,391 1,392 1,403
Dry Shares 188 221 221 220 210
Vouchers counting to Aggregate Minimum Shareholding Requirement 47 45 43 43 41
Total Dry Shares 235 266 264 263 251
Dry Shares held by Shareholding Farms 109 155 161 158 144
Dry Shares held by Custodian (equal to units in Fund) 126 111 103 105 107
Dry Shares = Total Shares on Issue less Minimum Aggregate Shareholding Requirement plus vouchers
1,613 million less 1,403 million plus 41 million = 251 million
Dry Shares = Dry Shares held by Shareholding Farms plus Dry Shares held by Custodian
Lana & Harepaora, Bay of Plenty
144 million plus 107 million = 251 million
14
BP/
15 BP/
BUSINESS PERFORMANCE REPORT 2021 BUSINESS PERFORMANCE REPORT 2021
Fonterra’s New Zealand Milk Production New Zealand Farmgate Milk Price (per kgMS)
For the 2020/21 season production from Fonterra farmers in New Zealand However, a more settled end to the summer, with a mix of rainfall and warm
increased to 1,539 million kgMS, up 1.5% compared to the prior season. weather, meant improved pasture quality. This drove a strong recovery in
North Island production from February to May.
The 2020/21 season had a good start, driven by favourable mild conditions NZD/USD Spot Rate FX Hedging
that supported good pasture growth. The stronger production later in the season was also supported by increased Fonterra's quarterly smoothed conversion rate
use of supplementary feed due to the rising milk price over the course of The FX season-on-season impact is because the hedge rate increased as a result
From October through to January, increasingly dry conditions and poor soil Illustrative future 18 month hedge profile¹ of the New Zealand dollar strengthening over the two seasons. The average
the season.
moisture levels across the country impacted peak collections. 0.75 hedge rate increased from NZD/USD 0.6638 last season to NZD/USD 0.6677.
Fonterra hedges the FX risk progressively over an 18-month period, therefore
0.70 the FX conversion rate for the Farmgate Milk Price for a specific season is
largely based on the weighted average spot rate over the previous season.
8 Season Milk Solids Produced 0.65
2020/21 1,539m kgMS This hedging approach means changes in the New Zealand dollar will still
7 2019/20 1,517m kgMS impact the Farmgate Milk Price, but it will impact at a later date and we can
0.60
2018/19 1,523m kgMS estimate with greater certainty what the impact of that change will be. As a
6 result, hedging provides increased certainty on what the FX conversion rate for
0.55 the season will be and means a narrower range on the forecast Farmgate Milk
kgMS (millions)
5 Aug-17 Aug-18 Aug-19 Aug-20 Aug-21 Aug-22 Price relative to not hedging.
4
3
2 Higher product prices
1 70% of the Farmgate Milk Price revenue was from WMP sales volume.
The average WMP price in the 2021 Season was 6.9% higher at $3,323 per
– metric tonne compared to $3,110 per metric tonne the prior season.
June July Aug Sep Oct Nov Dec Jan Feb Mar Apr May
Increased milk supply
Lower fixed cost recoveries due to
increased milk supply.
$0.46 $(0.08) $0.01
$0.01
$7.14 $7.54
2020 Volume Product Foreign Cash 2021
Farmgate prices exchange costs Farmgate
Milk Price Milk Price
Revenue
Karla, Taranaki 1. The future conversion rate is only an estimate because forecast USD receivables are only partially hedged over the forecast 18 month period and the hedges include options so the final conversion rate can vary.
16
BP/
17 BP/BUSINESS PERFORMANCE REPORT 2021 BUSINESS PERFORMANCE REPORT 2021
Milk Collection Summary
Group Operations Litres and milk solids collected
17,051 16,932 17,123 16,876 17,121
Group Operations is comprised of the functions that the Chief optimise our business by connecting customers with our assets,
Operating Officer (COO) has responsibility for (including farmers and markets to make our New Zealand milk into the most
New Zealand milk collection and processing operations and valuable products. It includes optimising the New Zealand milk pool, This season we collected 17,121 million litres of milk from the Co-operative’s
assets, global supply chain, digital and information technology, in-market product pricing support for the regions, managing farmer owners, which equated to 1,539 million kgMS.
sustainability and innovation); Farm Source™ retail stores; and Fonterra’s dairy and non-dairy product price risk, as well as Around 11 litres of milk produces 1kg of milk solids, or about 9% of milk
the Central Portfolio Management (CPM) function. CPM’s goal is to providing customer and farmer price risk management tools. 1,526 1,505 1,523 1,517 1,539 collected is solids, the rest is fluid.
2017 2018 2019 2020 2021
Litres collected kgMS collected
(million) (million)
On-farm we have rolled out milk vat monitoring technology. This has Cost of collecting milk
improved the quality of milk supplied to our processing sites through
better temperature management and assessment of milk quality to 2.4 2.4 2.4
product specification requirements. 2.3
2.3
This also has enabled efficiencies in milk collection scheduling through
visibility of on-farm milk conditions and volumes.
2017 2018 2019 2020 2021
Collection costs (cents/litre)
Collection ‘in full on time’ measures how well we have performed in Timeliness of collecting milk
collecting our farmer owners’ milk within our planned collection windows 98.6%
and is important for farmer engagement and milk processing. Performance
97.8%
has continued to improve year-on-year with reliable pick-up on-farm, despite
97.1% 97.1%
unplanned weather events including South Island flooding, while also 96.9%
improving milk collection costs.
2017 2018 2019 2020 2021
Collected in full on time
A critical enabler of improving fuel efficiency is transparency of metrics and Fuel efficiency when collecting milk
benchmarking tools. As an example, the use of data analytics to provide a view
of fuel efficiency by tanker and driver against targets and the prior year has 50.0
seen a continued improvement over the past couple of seasons. 49.3 49.4
49.0 48.9
2017 2018 2019 2020 2021
Fuel burn (litres/100km)
18
BP/
19 BP/BUSINESS PERFORMANCE REPORT 2021 BUSINESS PERFORMANCE REPORT 2021
Milk solids available to process and where we allocated them The 2020/21 Season started with the overhang of global economic concerns Monthly Milk Prices1
driven by the ongoing impact of the COVID-19 pandemic, along with the
(NZ$)
global supply chain issues impacting pricing and supply to customers. At the
We process around 98% of all the milk we collect in New Zealand. Milk solids processed and bulk liquid sales same time, farmers also faced revenue uncertainty due to potential 9.5
In some instances, we choose to enter into commercial agreements to (million kgMS) movements in the Farmgate Milk Price.
5
provide bulk liquids to other processors in New Zealand and under the DIRA 3 4 5 This market uncertainty led to strong customer demand for both security of
3 31 8.5
raw milk regulations (effective as of 1 June 2021) we are required to provide 37 32 30 supply and price certainty. During the first half of the season, non-reference
up to 600 million litres of milk each season to eligible independent third-party 30
product prices (cheese and proteins) were selling at favourable prices relative
processors (including Goodman Fielder) at the regulated price. Goodman to reference products (powders and cream). Early season trading conditions of 7.5
Fielder is entitled to buy up to 350 million litres of the overall eligible reference products suggested a milk price mid-point in the low $6.00 per
independent processor entitlement. kgMS range, as reflected by our opening Farmgate Milk Price range.
6.5
The regulated price for eligible processors (other than Goodman Fielder) is By selling long dated fixed price sales to customers and then matching these
Fonterra’s Farmgate Milk Price plus the reasonable costs of transporting the sales with Fixed Milk Price contracts and NZX Milk Price futures, we
milk to the processor. The regulated price for Goodman Fielder is Fonterra’s successfully met customer and farmer demand for increased certainty, 5.5
1,486 1,472 1,487 1,482 1,503 Jun Sep Dec Mar
Farmgate Milk Price plus reasonable costs of transporting the milk to by locking in favourable margins for non-reference products and reducing
Goodman Fielder and, for supply on or after 1 June 2021, an additional charge Fonterra’s exposure to future ingredient price volatility. Monthly Milk Price 2019/20 Season
of 10 cents per kgMS. Prior to 1 June 2021, Fonterra did not have the right to Monthly Milk Price 2020/21 Season
As the season progressed, reference product prices firmed at a faster rate than
recover additional costs over and above transport costs. The additional charge
non-reference prices which adversely impacted price relativities. However by
enables Fonterra to recover a contribution to the overall costs of milk sourcing 1. The weighted average of the monthly milk prices are equivalent to $7.14 and $7.54 for 2019/20
selling forward to customers and hedging our input prices, we reduced the and the 2020/21 season, respectively.
and the costs of providing Goodman Fielder with a “flat supply curve” of milk
impact on Ingredients’ margins.
across the season.
The strong increase in reference prices from January 2021 pushed the cost of
With the 1,503 million kgMS we processed, we continue to focus on allocating Price Relativities
milk above $9.00 per kgMS on a monthly basis, and significantly impacted our
milk into the products that generate the best overall returns to Fonterra and 2017 2018 2019 2020 2021
Ingredients and Foodservice product margins and bulk liquid milk margins in
our farmer owners. We do this through our Central Portfolio Management
the last quarter of the financial year. The strong demand for dairy over the last (US$/MT) FY21 H1 FY21 H2
(CPM) function. CPM’s goal is to optimise our business by connecting Fonterra DIRA Bulk Liquid Other Bulk Liquid
half of the year lifted the Farmgate Milk Price from its initial low $6.00 per 5,000
customers with our assets, farmers and markets.
kgMS forecast to a final price of $7.54 per kgMS.
New Zealand volume allocation Relative to the prior year, the lower reference and higher non-reference
Sales volumes in the Ingredients channel were flat year-on-year overall.
(000’s metric tonne) product sales volumes reflect growing demand in our Foodservice and 4,000
However, due to rising prices and continuing strong demand out of Greater
Consumer channels, with increased sales volume predominantly driven by
China for WMP, there was a shift in volume of Ingredients from AMENA to
by product channel by region Cheese, UHT Cream and Cream Cheese products.
Greater China. Our Foodservice channel sales volume grew the most, largely
driven by the demand out of Greater China and Asia Pacific. 3,000
2,200 2,200
Regionally, Greater China had the largest increase in sales volume,
predominantly due to increases in WMP and UHT milk and cream as our 2,000 2,000
Foodservice channel continues to grow. Fonterra has a large global sales
1,800 1,800 2,000
network, which enables it to take advantage of demand and pricing Aug Nov Feb May
opportunities that change from year-to-year. 1,600 1,600
GDT Cheddar shipment price¹ (non-reference)
1,400 1,400 GDT WMP shipment price¹ (reference)
1,200 1,200 1. The shipment price for the month in which the sale would be deemed for financial reporting
purposes to have been completed, and will normally be the month in which the sale is invoiced
1000 1000 and the product is shipped. The shipment prices presented are a weighted average of GDT
contracts 1-5 months prior to the date of shipment.
800 800
600 600
400 400
200 200
– ts ce r –
ien rvi su me Asia Pacific AMENA Greater China
d se
In gre od C on
Fo
20
BP/
21 BP/BUSINESS PERFORMANCE REPORT 2021 BUSINESS PERFORMANCE REPORT 2021
New Zealand sourced Ingredients’ product mix Milk processing performance
Within our New Zealand Manufacturing operation, milk utilisation (the operational stability. This continues a positive trend over the last five years,
2020 2021 proportion of milk solids made into product) improved from 96.2% to 96.4% where this measure has gone from 90.9% to 95.0%, which is equivalent to a
Sales Volume (‘000 MT)1 over the past five years; this improvement represents an $18 million lift in $35 million improvement over the period.
value to the business. This year our processing efficiency maintained a good
Reference products 1,820 1,817 Similarly, our cost of quality measure, one of the key indicators of the
level of performance, especially as our manufacturing mix was directed into
Non-reference products 794 884 effectiveness of our manufacturing activity, has maintained the trend of
higher value products, which are typically more complex to manufacture.
improvement seen over previous years. This year saw stable performance on
Revenue1 $ billion $ per MT $ billion $ per MT This outcome was delivered by improving process control and plant stability.
the previous year, however over five years the measure has improved by
Reference products 9.5 5,192 9.4 5,162 A focus on scheduling and optimal use of by-product streams also
$42 million from $100 million. This is reflected in reduced product rework,
Non-reference products 4.8 6,006 5.1 5,780 helped utilisation.
complaints and exception stock holding costs.
Cost of Milk This year also saw an improvement in the rate of product made ‘right first
Improvements across these areas have been made using a risk-based quality
Reference products (7.2) (3,959) (7.4) (4,069) time’ from 94.0% to 95.0%. This measure tracks the product that passes
management programme, better process control and plant stability supported
Non-reference products (2.8) (3,562) (3.3) (3,678) grading tests once the product is manufactured. A lift of 1.0% from an already
by capital investment.
high base reflects the ongoing focus on quality, improved use of data and
1 Excludes bulk liquid milk. Bulk liquids for the year ended 31 July 2021 was 72,000 MT of kgMS equivalent (the year ended 31 July 2020 was 69,000 MT of kgMS equivalent).
Note: Figures represent Fonterra-sourced New Zealand milk only. Reference products are products used in the calculation of the Farmgate Milk Price – WMP, SMP, BMP, Butter and AMF. Milk solids used in the
products sold were 1,019 million kgMS in reference and 442 million kgMS non-reference (previous comparable period 1,023 million kgMS reference and 404 million non-reference).
Portion of milk solids made into product Product made right first time
95.0%
Our average, reference product sale price declined year-on-year, despite the Our average non-reference product sale price per metric tonne declined 94.0%
Farmgate Milk Price increasing from $7.14 to $7.54 per kgMS. This is because slightly more than the average reference product sale price year-on-year, due
not all of our reference product sales inform the Farmgate Milk Price, most to the price for non-reference products declining more during the peak period 96.4% 96.4% 96.4%
notably our quarterly priced contracts and longer dated contracts that are not of contracting sales, being September to December. 91.9%
considered standard contracts at the prevailing market price. Therefore, our 96.2% 96.2% 91.4%
90.9%
reference product sale prices in longer dated contracts lagged the strong
increase in the market prices of reference products in the second half of the
financial year.
$100 $95 $90 $58 $58
2017 2018 2019 2020 2021 2017 2018 2019 2020 2021
Milk Utilisation Cost of quality (NZDm) Product made right first time
Note: Product mix may impact this measure as product groups have different utilisation factors
Supply Chain and Logistics
Over this last financial year, we faced immense challenges in our global supply In response, we were able to leverage both our strategic relationship with our
chain, including for Kotahi (our ocean freight partnership with Silver Fern logistics partners to secure additional shipping capacity and the commitment,
Farms) and Coda (New Zealand domestic land freight partnership with Port adaptability and deep operational understanding of our people to deliver this
of Tauranga). Despite these challenges, Fonterra was able to ship a record record result.
2.59 million tonnes of nutrition, at a ‘cost to serve’ in line with the prior year.
The cost to serve, excluding ocean freight, was in line with the prior year.
The key challenges faced during the year included disruption of global This was achieved by rationalising the distribution centre network with an
shipping and severe international port congestion, driven largely by exit from the aged Mount Maunganui coolstore, reduction in land freight
COVID-19, together with port strikes in Australia impacting container supply costs driven by road and rail routing and load optimisation, as well as
to New Zealand. This resulted in a reduction in shipping schedule integrity increased productivity with the application of digital tools and automation.
from a long-term average of 80% to below 35%, and a 350% increase in the
number of sales and shipping orders that required rework.
22
BP/
23 BP/BUSINESS PERFORMANCE REPORT 2021 BUSINESS PERFORMANCE REPORT 2021
Upper North Island
• Kauri
– Invested in our powder
packing line assets
Kauri
Central North Island
• Tirau and Edgecumbe Waitoa
Capital Expenditure – Invested in whey permeate Tirau Group Operations’ Attribution to Regional Segments
concentration related assets
Capital expenditure in Group Operations to remove managing process Edgecumbe In broad terms, Group Operations collects and processes New Zealand milk base, the impact of longer-term pricing commitments, product mix and the
increased on the prior year in response to into the optimal products that are then sold to our customers by the regional impact of price relativities between reference and non-reference
risk of ethanol Te Rapa
increasing regulatory requirements on Hautapu business units. The segment reporting, within the Financial Statements, is ingredient products.
wastewater treatment, reducing • Te Awamutu prepared based on the regional business units, with the income statement of
– Upgrades to our Te Awamutu When attributing the results of Group Operations to the regions, the principle
emissions from thermal fuel sources and Group Operations attributed between the three regional business units. This
infrastructure to better is for the end-to-end margin to reflect the underlying transaction between
also maintaining integrity and reliability attribution enables the results of both the regional business and product
manage our wastewater Fonterra and the customer where possible. If costs are not directly linked to
across the network of processing assets. channels to be presented on an end-to-end basis.
transactions, such as overheads, attributions are activity based where
Across New Zealand, we continue to – Waitoa When products are transferred between Group Operations and the regions, appropriate e.g. Information Technology and Research and Development.
progress our annual truck and trailer – Improved asset capability on the internal prices are determined by market-based commodity reference If none of these principles applies, the attribution uses a volume-based
replacement programme and on-farm specialty ingredient prices (e.g. GDT and other external benchmarks) and include charges where allocation.
milk vat replacement programme. In products appropriate to reflect the additional costs of producing non-commoditised
addition to these annual programmes, Overall, the Group Operations’ EBIT has reduced $288 million compared to
Whareroa products. The internal pricing is reviewed weekly for Ingredients products and
last year. Key drivers of this are an adverse movement in the gross margin on
the roll out of our milk vat telemetry
either quarterly or monthly for Consumer and Foodservice products.
technology was largely implemented this bulk liquids and the lagged impact of longer-term pricing arrangements in
year and will be completed next year. We The Group Operations performance (that is attributed to the three regions) sales contracts. In addition, there were some changes in the internal pricing
are also continuously working through a includes movements in the capital charge on the notional Milk Price asset principles as the new operating model was implemented and refined.
capital expenditure programme to keep Pahiatua
our processing sites fit for purpose and
below is a sample of such projects
across the country.
Group Operations’ Attribution
Sites displayed are not a full representation
of all Fonterra factories FOR THE YEAR ENDED 31 JULY
Lower North Island NORMALISED BASIS
EBIT NZD MILLION TOTAL ASIA PACIFIC AMENA GREATER CHINA
• Whareroa
– Improved our supply chain facilities 2020 2021 2020 2021 2020 2021 2020 2021
to maintain product integrity
Group Operations’ attribution to regional segments 170 (118) 47 (3) 39 (99) 84 (16)
– Invested in milk evaporation
efficiency and reducing energy and
carbon emissions
Darfield – Improved powder dryer building
integrity to manage product
quality risk
Clandeboye
South Island
• Stirling
– Commencement of works on biomass
boiler to replace coal
Stirling • Clandeboye
Edendale – Invested in additional capacity for
specialty ingredients, to allow greater
optionality in optimising our product mix
• Clandeboye and Darfield
– Invested in water management capability
24 25
across multiple sites
BP/ BP/BUSINESS PERFORMANCE REPORT 2021 BUSINESS PERFORMANCE REPORT 2021
EBIT Contribution of Regions and Product Channels1
Summary FOR THE YEAR ENDED 31 JULY
of Regions
NORMALISED BASIS UNALLOCATED COSTS
EBIT (NZD MILLIONS) TOTAL ASIA PACIFIC AMENA GREATER CHINA AND ELIMINATIONS
2020 2021 CHANGE2 2020 2021 CHANGE2 2020 2021 CHANGE2 2020 2021 CHANGE2 2020 2021
Ingredients 727 385 (47)% 148 44 (70)% 400 211 (47)% 179 130 (27)% – –
Foodservice 245 369 51% 27 79 193% (5) 15 – 223 275 23% – –
The Group’s reportable segments are the three regional business units; Our AMENA region has a large Ingredients channel, which accounted for 63% Consumer 98 290 196% 64 182 184% 70 110 57% (36) (2) 94% – –
Asia Pacific, AMENA and Greater China, and are inclusive of their of AMENA’s EBIT and 55% of our overall Ingredients channel EBIT. AMENA’s
Unallocated costs (223) (148) 34% – – – – – – – – – (223) (148)
respective attribution of Group Operations. This provides a full end-to-end EBIT decreased $129 million to $336 million, due to reduced gross margins
and eliminations
view of the performance for each customer-facing regional business unit. and lower sales volume in the Ingredients channel. AMENA’s Foodservice and
Continuing 847 896 6% 239 305 28% 465 336 (28)% 366 403 10% (223) (148)
Additionally, insights are provided by showing a breakdown of the three Consumer channels’ EBIT increased, with a particularly strong performance by
Operations
main product channels – Ingredients, Foodservice and Consumer. our Consumer business in Chile. Our Consumer business in Chile increased
both value and volume share, contributing to the gross margin and sales Discontinued 32 56 75% – – – 21 22 5% 11 34 209% – –
Our regional performance and commentary in this section and the Operations
volume growth in the Consumer channel.
subsequent sections on individual regions are prepared on a normalised
Total Group EBIT 879 952 8%
Continuing Operations basis unless stated otherwise. Our Greater China region contributed to our improved earnings with a 10%
increase in EBIT to $403 million. The Greater China region has a strong 1. Regional performance is prepared on a Continuing Operations basis. Comparative information has been restated for consistency with the current period attribution.
Our business is diversified across both regions and product channels, allowing
Foodservice channel, which accounted for 68% of its EBIT and 75% of our 2. Percentages as shown in table may not align to calculations of percentages based on numbers in the table due to rounding of figures.
us to allocate our milk into the products that generate the best overall returns
overall Foodservice channel EBIT. The increase in Greater China’s EBIT was
to Fonterra and our farmer owners.
predominantly due to the strong performance of the Foodservice channel,
Our Asia Pacific region contributed to our improved Group earnings with a driven by continuous innovation and a customer centric approach which has
28% increase in EBIT to $305 million. The Asia Pacific region has a strong shifted sales volume into higher margin products. Gross margin growth within
Consumer channel, which accounted for 60% of its EBIT and 63% of our the Foodservice and Consumer channels was offset by reduced gross margins
overall Consumer channel EBIT. The Consumer channel is supported by a in the Ingredients channel. Overall, demand for dairy has been strong across
strong brand presence across our key markets and have benefited from the As a key part of our strategy, all three regions are prioritising growing our that support our strategy of prioritising New Zealand milk and allocating it
all three channels in the Greater China region is supported by the Chinese
COVID-19 initiated stay-at-home culinary trend. Gross margin growth within portfolio of specialty ingredients and solutions. We see plenty of growth into higher margin products.
Government endorsing consumption of dairy during COVID-19.
the Consumer channel was a significant contributor to Asia Pacific’s earnings opportunities in this portfolio going forward, and will be focused on the areas
performance. The Ingredients channel was impacted by reduced bulk liquid
margins, offsetting gross margin growth in both the Consumer and Specialty Ingredients1
Foodservice channel.
FOR THE YEAR ENDED 31 JULY
Summary of Regional Performance1 NORMALISED BASIS
NZD MILLION TOTAL PAEDIATRICS SPORTS AND ACTIVE MEDICAL AGEING
FOR THE YEAR ENDED 31 JULY 2020 2021 CHANGE 2
2020 2021 CHANGE 2
2020 2021 CHANGE 2
2020 2021 CHANGE2
NORMALISED BASIS UNALLOCATED COSTS AND Sales volume (‘000 MT) 237 226 (5)% 124 103 (17)% 54 61 13% 59 62 5%
NZD MILLION TOTAL ASIA PACIFIC AMENA GREATER CHINA ELIMINATIONS
Revenue 1,798 1,786 (1)% 760 611 (20)% 593 674 14% 445 501 13%
2020 2021 2020 2021 2020 2021 2020 2021 2020 2021 1. Speciality Ingredients performance is prepared on a Continuing Operations basis.
Sales volume (‘000 MT)2 3,842 3,874 1,406 1,386 1,433 1,352 1,021 1,176 (18) (40) 2. Percentages as shown in table may not align to calculations of percentages based on numbers in the table due to rounding of figures.
Revenue 20,282 20,565 7,074 7,110 7,874 7,304 5,374 6,312 (40) (161)
Costs of goods sold (17,236) (17,581) (5,867) (5,915) (6,817) (6,400) (4,596) (5,476) 44 210
COVID-19 has driven changing consumption trends and accelerated consumer Other highlights include:
Gross profit 3,046 2,984 1,207 1,195 1,057 904 778 836 4 49
demand for more proactive nutrition offerings, supporting immunity and
Gross margin 15.0% 14.5% 17.1% 16.8% 13.4% 12.4% 14.5% 13.2% – – – We launched our New Zealand Milk Products (NZMP™) Milk Phospholipids
healthy ageing growth. We have seen the benefit of this in our Medical Ageing
range that helps with stress management. This is Fonterra’s first foray into
Operating expenses (2,194) (2,153) (967) (889) (585) (605) (401) (436) (241) (223) and Sports and Active categories.
mental health propositions for adult nutrition
Other3 (5) 65 (1) (1) (7) 37 (11) 3 14 26 We have seen particularly strong growth in Korea where we have cemented
EBIT4 847 896 239 305 465 336 366 403 (223) (148) – New launches across our Anlene™ range, including Anlene GOLD 5X™,
our position as a leading supplier of dairy ingredients into medical and
a functional nutrition product providing benefits across five key areas –
healthy ageing products. The New Zealand provenance story has also
Includes EBIT attribution 170 (118) 47 (3) 39 (99) 84 (16) – – strong bones, energy, strong muscles, flexibility and movement
resonated strongly in this market, highlighting the value of New Zealand
from Group Operations5 – The ongoing roll-out of Fonterra’s premium probiotic ingredients
sourced milk solids.
EBIT excludes 32 56 – – 21 22 11 34 – – continues. Supported by our cross functional teams in China and
Discontinued Operations New Zealand, we were able to add a line of probiotic enhanced and
1. Regional performance is prepared on a Continuing Operations basis. Comparative information has been restated for consistency with the current period attribution.
lactoferrin enhanced milk powders within 12-months
2. Includes sales to other segments.
3. Consists of other operating income, net foreign exchange gains/(losses) and share of profit or loss on equity accounted investees.
4. This includes EBIT attribution from Group Operations.
5. Drivers of movements in the Group Operations attribution is detailed further in each region’s performance section.
26
BP/
27 BP/You can also read