Our Plan 2020-24 Working together to sustainably improve water services - SA Water
←
→
Page content transcription
If your browser does not render page correctly, please read the page content below
Our Plan 2020-24 Working together to sustainably improve water services

Our Plan 2020-24 (Our Plan) is                                                                                                             Along with ESCOSA, the intended audiences
                                                                                                                                           of this document are customers, customer
                                                                                                                                           representative groups and other stakeholders.

SA Water’s regulatory business                                                                                                             Our Plan provides an overview of the key elements
                                                                                                                                           influencing business planning and operation

proposal for the period from
                                                                                                                                           and should be read in conjunction with the more
                                                                                                                                           detailed documents appended.
                                                                                                                                           Unless otherwise noted, all dollar figures shown in

1 July 2020 to 30 June 2024,                                                                                                               Our Plan are indicative and in real terms (excluding
                                                                                                                                           inflation) expressed in December 2018 dollars and

submitted to the Essential
                                                                                                                                           relate to financial years.
                                                                                                                                           Our Plan does not take into consideration the
                                                                                                                                           outcome of the Government inquiry into

Services Commission of South                                                                                                               the regulated asset base.

Australia (ESCOSA), in keeping
with the regulatory framework set
out under the Water Industry
Act 2012 and Essential Services
Commission Act 2002.

Copyright and Disclaimer

                                                                                                                                                                                                                                                                                     0038P11910
Copyright in this material is owned by or licensed to SA Water Corporation. Permission to publish, modify, commercialise or alter this material must be sought directly from SA Water. Reasonable endeavours have been used to ensure that the information contained
in this document is accurate at the time of writing. However, SA Water, its officers and shareholders give no warranty and accept no liability for any loss or damage incurred in reliance on this information. Forecasts, projections and forward looking statements included
in this document are subject to change and amongst other things, reflect information, data, methodologies, legislation, regulatory guidance, assumptions, prevailing market estimates, assessments, standards, and factors current at the time of publication.

SA Water Our Plan 2020-24                                                                                                                                                                                                                                                        2
Contents

 1.0   Our Plan 2020-24: Working together to sustainably improve water services              04   6.0   Our Plan will help keep prices low and stable                                39

 2.0   Delivering world class water services for a better life                               08
                                                                                                  6.1   Customers will see a price decrease                                          40

 2.1   Providing water and sewerage services to more than 1.7 million South Australians      09   6.2   The revenue required to deliver Our Plan                                     43

 2.2   We are a corporation owned by the people of South Australia                           09   7.0   ESCOSA reviews Our Plan to ensure our expenditure is prudent and efficient   44
 2.3   Robust legal and regulatory frameworks guide our operations                           09   Appendices
 3.0   Customers are at the heart of our business and have shaped our plans for the future   10   A     Our legal and regulatory responsibilities
 3.1   Our most extensive customer engagement program confirmed customer priorities          11   B     Customers shaping the future
 3.2   Working with customers                                                                12   C     Our Plan Customer Engagement
 3.3   New service standards were developed together with our customers                      13   D     Required revenue
 3.4   Business planning processes reflect customer priorities and our service commitments   14   E     Regulatory Rate of Return and Financial Viability
 3.5   Infrastructure and technology plans balance acceptable risk with service outcomes     16   F     Pricing
       for customers                                                                              G     KPMG audit of regulatory models
 4.0   Our business is efficient and we seek continuous improvement                          18   H     ACIL Allen Demand model audit
 4.1   Operating expenditure will decrease                                                   21   I     Service standards and performance
 4.2   We will seek further efficiency across operating, capital and IT expenditure          22   J     Service standards measures
                                                                                                  K     KPMG Opex Benchmarking Report
 5.0   Investing to sustainably maintain reliable services, improve customer experience,     23
       and enable economic, social and environmental outcomes                                     L     KPMG IT Benchmarking
 5.1   Meeting our external responsibilities                                                 25   M     KPMG IT Plan Review Summary Report
 5.2   Investing to sustain reliable water and sewerage services                             28   N     Capital Delivery
 5.3   Improving to deliver better experiences for our customers                             31   O     30 year asset planning
 5.4   Expanding to enable positive growth and change                                        33
 5.5   Investing in efficiency                                                               35
 5.6   Improving our digital services                                                        36

SA Water Our Plan 2020-24                                                                                                                                                                 3
1.0
Our Plan 2020-24: Working
together to sustainably
improve water services
SA Water customers across the      Informed by our most extensive customer
                                   research and engagement program to-date,
                                   Our Plan outlines the way we will run our

state will benefit from improved   business over the next four years.
                                   More than 12,000 people shared their time

water services as we implement
                                   and insights with us over the past two years,
                                   in engagement processes that have set a new
                                   benchmark for public participation in regulatory

Our Plan 2020-24 and deliver       business planning, with the inclusion of direct
                                   negotiation on investment plans with customer
                                   representatives for the first time.

sustainable change initiatives     Through rigorous planning and evaluation
                                   processes we have then balanced the regulated

shaped by customer priorities.     responsibilities we must meet to ensure public
                                   health, environmental, economic, technical and
                                   safety outcomes, while stretching beyond these
                                   to deliver the sustainable service and operating
                                   improvements that our customers have identified
                                   as important to them.
                                   Over the next four years, we will invest $1.8 billion
                                   in capital infrastructure and $143 million
                                   in IT infrastructure and use $1.9 billion in
                                   operating expenditure to meet basic regulated
                                   responsibilities, drive efficiencies in the way we
                                   do things, and maintain, improve and expand
                                   our assets so our customers can continue to rely
                                   on the services we provide.

SA Water Our Plan 2020-24                                                                  5
We will do more for less, while                        We will continue investing to further                 We will implement measures that further
delivering a price reduction.                          reduce the impact of water main                       improve the ways we protect and enhance
Our customers have consistently told us that           breaks and leaks and temporary                        the natural environment.
low and stable prices are important to them.           supply interruptions on our customers.                Our customers prioritise minimising the impact of
Through our ongoing focus on achieving                 Our customers value service reliability and efforts   our operations on the environment. The sewerage
sustainable operational efficiencies and smart         that minimise interruptions to water supply. In       network exists to protect public health and the
approaches to maximising the productivity of           addition to ongoing investment in the renewal         natural environment by keeping waste material
our assets, we have been able to contain the           of water reticulation mains, trunk mains and          contained and taking it away for safe treatment.
costs of an expanded capital program that              major pipelines, we will increase our focus on        We will invest to ensure the sewerage network
delivers more for our customers, and forecast a        smart approaches to managing the network.             continues to perform this vital community function
bill saving of $26 for the average metropolitan        Expansion of our world-leading predictive smart       and reduce the incidence and impact of sewer
residential customer.                                  networks of sensors, installation of more valves to   overflows by upgrading pump stations and
                                                       reduce isolation areas, and pressure management       equipping critical locations with back-up power
We will invest in programs that improve                techniques, will deliver long-term sustainable        supplies, as well as the expansion of our successful
the taste of drinking water in Adelaide                decreases to the number of customers who              predictive smart network of sensors within the
and the quality of some regional supplies.             experience multiple interruptions during a 12         sewerage network.
Our customers told us they would like to see, and      month period, at no additional cost to customers.     We will hold ourselves accountable to a new set
are willing to pay for, water treatment upgrades                                                             of commitments that we make to our customers,
that improve the taste of drinking water. By           We will invest to increase the amount of              covering the reliability of our services, the way we
upgrading the Happy Valley Water Treatment Plant       water we recycle for a productive second              respond and resolve issues, and satisfaction with
and completing changes to the vital disinfection       life, and contribute to economic growth               our customer service. These service commitments
processes used across the metropolitan region,         and improved urban liveability.                       were shaped around customer feedback and
we will achieve a significant and sustainable          Our customers told us they value water security,      tested throughout our engagement processes to
improvement to the taste of tap water.                 measures that protect the natural environment,        ensure they align with our customers’ expectations.
Our customers also demonstrated a very strong          and want to see more water recycled. Already          Regular and ongoing engagement with our
sense of fairness and prioritised measures that        the second largest recycler of water in Australia,    customers is now business as usual and continuing
would improve the quality of supplies in regional      we are expanding schemes like the Glenelg to          to work together in this way will ensure we
areas that currently have aesthetic challenges like    Adelaide Pipeline. We will conduct investigations     constantly adapt the way we do things to keep
saltiness or hardness, as well as wanting 19 small     into how we can increase the amount of water we       pace with changing expectations and needs,
non-drinking systems to be progressively upgraded      recycle from 28 to 50 per cent. Working together      and enhance the long-term sustainability of
to drinking quality. The wide-reaching impact of       with metropolitan councils to substitute drinking     our business.
upgrading these regional water supplies will deliver   quality water with more fit-for-purpose climate-
broad benefits for these communities including         independent water will help green the city to
their liveability, and population and economic         improve liveability, and enhance the sustainability
sustainability.                                        of our water sources.

SA Water Our Plan 2020-24                                                                                                                                           6
Our Plan 2020-24 meet regulatory requirements such as those under the…
South Australian Water Corporation Act 1994 South Australian Public Health Act 2011
Proposed revenue and prices to be collected from our customers... Public Corporations Act 1993 Work, Health and Safety Act 2012
Water Industry Act 2012 Environment Protection Act 1993
Average annual combined water and sewerage bill reduction 2020-21
Safe Drinking Water Act 2011 Natural Resources Management Act 2004
Residential Non-residential Commercial
Metro $26 $325 $138 To read more about our legal and regulatory responsibilities refer to Appendix A.
Country $23 $299 $94 and invest in assets…
Maximum allowable revenue of $4.63 billion, 2.2 per cent lower for water and 0.5 per cent lower for
sewerage than the 2016-2020 regulatory period. Capital expenditure of $1.8 billion on water and sewerage infrastructure in 2020-24.
December 2018 dollars
to operate the business…
Operating expenditure of $1.9 billion, on average $16 million lower per year than 2016-20.
$144 $124 $91 $78 $11
Seawater
million million million million million
retawaeS
699,738
)sretem cni( snoitcennoC retaW
Water Metropolitan Dam safety Eyre Peninsula Glenelg to
837,996
laitnediseR
Water Connections
(inc meters) 6,344
Ground water Residential Connections reticulation water quality upgrades water security Adelaide
network improvement Pipeline
187
443,6
781
Bores
management expansion
retaw dnuorG
seroB
ssenisuB
snoitcennoC
Business
32 271
snoitatS pmuP retaW
Seawater
Surface water Reservoirs
Water Connections (inc meters)
172
Water
…to deliver reliable, high-quality water and wastewater
23
& weirs
699,738
Residential
Pump
services to more than 1.7 million South Australians, every day.
sriew & sriovreseR
Stations
retaw ecafruS
noitagirrI
Irrigation
42
6,344
187
Water
89
Ground water
Treatment Water service
Bores
Plants
697 527,436 372 km
Business
Connections
Chlorine restoration
Safe, clean water
24
Water service Internal sewer
Water Pump Stations
Booster Wastewater Sewerage Recycled timeliness
mk 273
98
271
Stations interruption overflow
stnalP tnemtaerT retaW
Pump Stations Connections Water First contact
32
compliance
snoitatS retsooB enirolhC
Mains
27,066 km 514 frequency 99% frequency resolution
Reservoirs & weirs
snoitcennoC egareweS
634,725
29
Surface water
sniaM retaW delcyceR
snoitatS pmuP
Irrigation
Water Mains Storage Tanks
retawetsaW
with the Safe
796
8,977 km Wastewater
Treatment Plants Drinking Water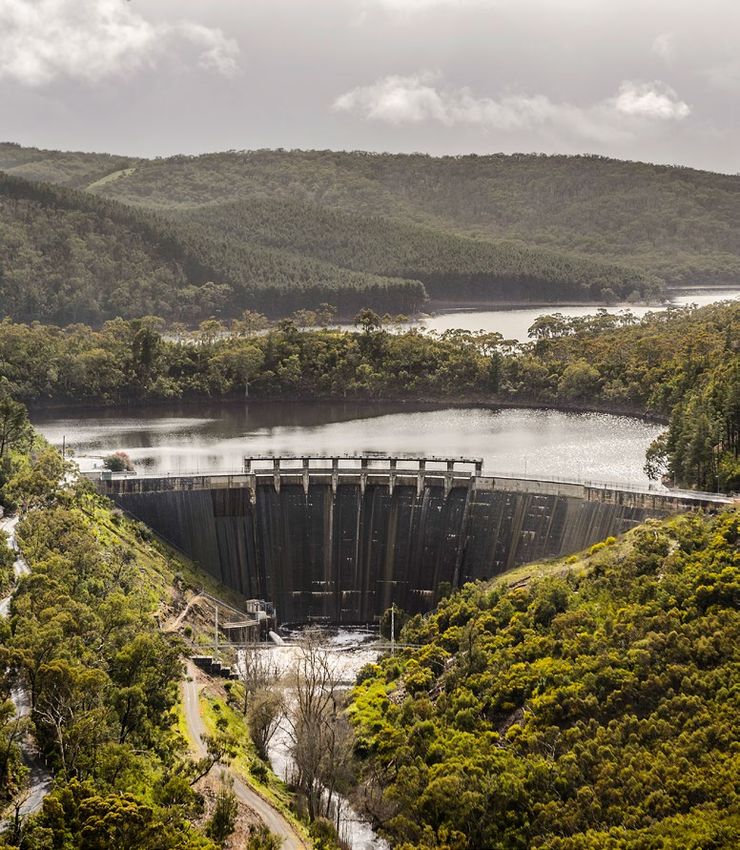
2.0
Delivering world
class water services
for a better life

2.1 Providing water and sewerage                     With a long history of innovation, we continue        2.3 Robust legal and regulatory
                                                     to improve the way we work and the services we
services to more than 1.7 million                    deliver for our customers. The use of smart network   frameworks guide our operations
South Australians                                    technology in our water and sewerage networks is      Legal and regulatory frameworks establish
                                                     leading the way in the water industry in Australia    the basics and guide the way our business
We are South Australia’s leading                     and internationally, and by embracing new ideas       operates, and we remain focused on meeting
provider of water and sewerage                       we are supporting the state’s economy, such as        these responsibilities as well as delivering what
                                                     our support for a trial of molten silicon energy      is important to our customers. Our regulatory
services for more than 1.7 million                   storage. These are just two examples of how we        responsibilities include, but are not limited to:
people. For more than 160 years                      are fostering and developing new approaches
                                                                                                           • Protecting public health – we ensure our water
                                                     and applications of technology for the benefit
we have been working together                        of our customers and the community.
                                                                                                             is safe to drink and our sewerage services are
                                                                                                             dependable to protect the community from the
with South Australians to ensure
                                                     2.2 We are a corporation owned                          germs and diseases carried in sewage.
a reliable supply of safe, clean
                                                     by the people of South Australia                      • Keeping our people and the community safe
water and a dependable                                                                                       – we support our people to work safely so they
                                                     As a statutory corporation we report to                 return home in the same condition they arrived
sewerage service.                                    an independent Board and balance the                    at work. Likewise, we take the safety of our
                                                     delivery of services in a competitive market            customers and the community seriously.
With the aim of keeping prices as low and stable     with our responsibility to provide a return to
as possible for our customers, we strive to make                                                           • Protecting the environment from harm when
                                                     our shareholder.
smart, long-term investments, and best use of                                                                operating, including the sourcing of water
                                                     We are included in the portfolio of the Minister        supplies – we work to protect the environment
new technologies, and to deliver on our
                                                     for Environment and Water and work closely              for future generations, a value we share with
commitment to efficiency.
                                                     with a number of South Australian government            our customers.
Of all Australian water utilities, we have the       agencies including:                                   • Meeting technical industry regulations
longest water mains supply network at more than
                                                     • Department of the Premier and Cabinet                 – for the construction, operation and
27,000 kilometres. In addition, we manage nearly
                                                     • Department of Treasury and Finance                    maintenance of our infrastructure.
9,000 kilometres of sewerage mains and the
longest recycled water network in the country,       • Department for Environment and Water                • Revenue and customer service standards –
of more than 370 kilometres.                                                                                 the revenue a utility can earn in South Australia
                                                     • SA Health
                                                                                                             for water and sewerage services and service
Through this large network of pipes, pump            • Environment Protection Authority                      standards for customers are set and monitored
stations and treatment plants across the state                                                               for compliance by the Essential Services
                                                     • Office of the Technical Regulator
we supply around 200 billion litres of water every                                                           Commission of South Australia (ESCOSA).
year and remove and treat used water through         • The Essential Services Commission
our sewerage network.                                  of South Australia.
                                                                                                           Our legal and regulatory responsibilities are
                                                                                                           summarised in Appendix A.

SA Water Our Plan 2020-24                                                                                                                                        9
3.0
Customers are at the
heart of our business
and have shaped our
plans for the future
3.1 Our most extensive customer                           Figure 1: Our Plan engagement phases as part of the regulatory process                        1 In phase one we explored the data and
                                                                                                                                                          feedback we already had and further
engagement program confirmed                                                                                                                              developed our understanding of the services
customer priorities                                                                                                                                       most important to our customers and the areas
                                                                                                                                                          we needed to maintain, improve or reduce.
Customer engagement activities                                                                                                                          2 Phase two gave our customers the opportunity
undertaken for Our Plan are                                                                                                                               to have their say about certain services we
the most extensive we have ever                                                                                                                           provide and how they would value increases
                                                                                                                                                          or decreases in service levels. We collected this
undertaken, both in the breadth
of methodologies we used and                                                                      Water                                                   data through a choice modelling survey, What
                                                                                                                                                          matters to you?

reach to South Australians
across the state.                                               Explore                           Talks                                                 3 As part of our internal planning processes,
                                                                                                                                                          phase three included sharing and discussing
                                                                                                                                                          with our Customer Working Group the data
                                                                                                                                                          collected from the What matters to you? survey.
From 2017 to 2019, we engaged with more than                     PHASE 1
                                                                                                                                                          These discussions centred on how the service
12,000 customers online and face to face about                                                                                                Deliver     level priorities from the survey were being
what matters most to them when it comes to                                                                                                                interpreted and used in our business planning.
the water and sewerage services we deliver.                                                                                                   PHASE 6     Feedback was also sought on our proposed
This engagement was done over four phases                                                                                                                 service standards.
(Figure 1), with the results and feedback                                   Test
                                                                                                                                                        4 Phase four involved a contingent valuation
gathered through this engagement process                                                                                                                  survey, Would you invest in this?, that gave
informing our business planning.                                           PHASE 2                                                                        our customers the opportunity to have their
                                                                                                                                   Approval               say on five improvement initiatives proposed
Two robust willingness to pay approaches have
been used to prioritise the services we should plan                                                                                                       for inclusion in Our Plan. The findings were
to improve from 2020, and to identify the initiatives                                    Plan                                       PHASE 5               used as part of our discussions with the
customers are willing to pay for through their combined                                                       Validate                                    Customer Negotiation Committee, and to
water and sewerage services bill. Engagement with                                       PHASE 3                                                           prepare Our Plan.
our Customer Working Group was paramount to                                                                                                             Phases five and six are yet to occur at the time
                                                                                                              PHASE 4
validating and challenging our ideas.                                                                                                                   of submission and will form part of the ESCOSA
Our integrated customer engagement and                                                                                                                  determination process.
business planning process is explained in more
detail in Appendix B and the engagement
activities and their outcomes are detailed in
Appendix C along with independent
consultant reports on the results.

SA Water Our Plan 2020-24                                                                                                                                                                                  11
Stage 1 customer insights were The What Matters to you? survey tested with 3.2 Working with customers • consider our cost allocation method to
customers possible changes in level of service understand how this links to allowable
analysed and, in addition to and the price impact associated with change. Aligned with requirements of the regulatory revenue and pricing
determination process and following this
low and stable pricing, most Customers told us they are willing to pay the
significant engagement with our customers,
• review proposed expenditure and whether
reasonable costs of:
important to our customers are: we worked together with the Customer
it is prudent and efficient
• reducing the number of sewage overflows • consider what is an appropriate rate of return
Negotiation Committee to discuss and
Safe water. Quality water. to the environment
negotiate our draft plan. • review our proposed demand and customer
The water we provide is safe to drink • upgrading regional properties from growth numbers (refer to Appendix D to
Comprising three customer representatives
and the quality of the water is right non-drinking to drinking water supply understand how this links to allowable
recruited by ESCOSA, the committee was tasked
for their needs. • increasing the volume of recycled water use revenue and pricing).
to negotiate with us and advocate on behalf of
Reliable water and • improving drinking water quality for the all customers.
Where these could be negotiated between
sewerage services Adelaide metropolitan area
Former Under Treasurer and ESCOSA
We provide water and sewerage
us and the Customer Negotiation Committee,
• improving the taste, smell and colour of Commissioner, John Hill, led the committee. ESCOSA decided they did not need to perform
services that are always available, drinking water in regional South Australia. Mark Henley from Uniting Communities provided a regulatory review. ESCOSA intends to reserve
both now and in the future.
experience in utility negotiation and customer its regulatory review to:
Protecting the environment We then tested these in more detail in the advocacy, with a special interest in advocating
Would you invest in this? survey. • matters referred by the Customer Negotiation
We care for the environment in the for customer groups with special needs, while Committee or which could not be agreed
supply, treatment, discharge and Based on this feedback from customers, service Meg Clarke from our Customer Working Group between us and the committee
reuse of water, sewage and waste. changes were incorporated into Our Plan. represented all customers.
• form of price regulation
Support, fairness and Customers also told us they did not want any The Customer Negotiation Committee was
• regulated asset values, regulatory depreciation,
great customer service of the service levels tested to be reduced. extensively briefed on how a water utility operates
tax and return on working capital (refer to
We are respectful, we listen, respond and our operating environment in South Australia,
Appendix D to understand how this links to
quickly, make it easy and communicate including economic regulation and the legal
allowable revenue and pricing).
about our work. framework we are required to work within.
In particular, the committee was tasked by These discussions with the committee formed an
ESCOSA to: important part of our business planning process
• review evidence of customers’ views, priorities and are covered further in Appendix B, including
and preferences the outcome.
• review proposed service standards and
how we plan to hold ourselves to account
• review any other consumer protections we
proposed or which the committee considered
necessary
SA Water Our Plan 2020-24 123.3 New service standards Table 1: Proposed service standards 2020-24
were developed together Service area Measure 2018-19 performance 2016-20 target Proposed
with our customers against 2016-20 targets 2020-24 target
Customer service Customer satisfaction New measure New measure 93%
We will hold ourselves Telephone responsiveness 86% within 30 seconds 85% within 30 seconds 85% within 50 seconds
accountable to a new set of for fault calls
commitments that we make First contact resolution New measure New measure 85%
to our customers, covering the Complaint responsiveness 96% (written complaints) 95% (written complaints) 95% (all complaints)
reliability of our services, the Complaint escalation 11.2% New measure3.4 Business planning processes During this planning process the customer research
program outlined in Figure 3 (overleaf) informed
reflect customer priorities our decision making. This process identified the
and our service commitments following priorities for the future:
Our business planning and budgeting processes • meeting external responsibilities – our base
have evolved to balance the various legal and legal and regulatory requirements
regulatory requirements we must meet, with • providing reliable services – keeping our
challenges and opportunities that arise, and business running and infrastructure performing
the insights our customers have shared with us. at current levels of service customers expect
These equally important elements are integrated • improving services – where customers have
through a structured process that ensures told us it is important to them, and they are
customer priorities are overlayed at multiple willing to pay
stages, detailed in Figure 2.
• meeting growth – servicing new water
and sewerage customers or increasing the
services available to existing customers
• becoming more efficient – investing to deliver
resource savings which reduce the cost of
services over time for our customers.
Figure 2: Planning process
How we
Strategy, performance, Planning for infrastructure, Working with the
developed our context, future technology, operational Review, prioritisation
Customer Negotiation Finalise proposal
Our Plan budgets and our people and rationalisation
customer needs Committee
How customers
‘Customer Values’ research Customer Working Group engagement sharing,
informed our for our strategy discussing and deliberating results
decisions ‘Explore’ research
for Our Plan ‘What Matters To You?’ research ‘Would You Invest In This?’ research
SA Water Our Plan 2020-24 14Figure 3: Customer research program
• Customer survey • Residential and business,
• 1,600 customers per year regional and metropolitan,
Brand health and customer segments
• Twice weekly data collection
perceptions research
ONGOING
• Phone, online and paper surveys
Customer experience • 12,000+ customers per year
tracking • Daily measurement
• Community engagement • Customer workshops
• Stakeholder engagement and focus groups
Our Plan engagement • Willingness to pay study
PROJECT SPECIFIC
• Customer surveys
Targeted customer • Customer journey mapping • Customer workshops
• In-depth interviews and focus groups
research
• Customer surveys • Third party research
• Market sizing
External research
With a clear idea of what we need to deliver for our customers, and how to manage our risks and
create operational efficiencies for our business, the operating expenditure plan, asset management plan,
and digital plan were brought together and considered holistically before informing Our Plan. Our draft
expenditure proposals and business plan went through an intensive prioritisation and governance process
set out in Appendix B.
SA Water Our Plan 2020-24 153.5 Infrastructure and technology Figure 4: How we derived our digital plan
plans balance acceptable
risk with service outcomes
for customers
To determine what we need to spend on our
statewide network of assets, we adopted a
Look to the future Identify our Define digital Develop investment Finalise plan
bottom-up approach assessing the age, condition,
customer and capabilities business case
growth profile, current performance, required
business needs for the future
performance and likely impact on service levels
and legal and regulatory responsibilities. • Customer focused • Understand customer • Identify the technology • Determine the cost to • Prioritise investment
strategy and vision insights gap between current deliver, operate and according to customer
Knowing that low and stable prices are important
for the future • Define digital capabilities and future state maintain technology outcomes, risk, benefit
to our customers, we reviewed our plans to • What will our future required to support • High level system • Assess residual risk • Digital plan that delivers
determine where we could take a slightly higher customers expect customer and business solutions from investment value for money
level of risk and save money, where it is unlikely to from us needs into the future • IT asset life-cycle • Asset investment in customer outcomes
impact service levels or the environment. • Future technology • Synergies between assets management (invest, terms of outcomes for
These decisions have not been made lightly or trends and risks and technology, for maintain or retire) our customers, cost
• Look for opportunities example smart networks • Security and cyber and benefit
in isolation. Alternatives were considered, such
where technology can • Look for opportunities controls
as spending more money on routine cleaning of mitigate risks where technology can • Maintain system
sewer mains to avoid blockages and breaks that mitigate risks operability, resilience
may occur otherwise, which is included in our and recovery
operating expenditure proposal to ensure we can
meet our customers’ expectations at the least cost.
By making risk-based trade-offs and using other
ways to mitigate infrastructure malfunction, we
were able to revise our asset capital plans down
from $2 billion over the four year regulatory period
to $1.8 billion (comprising $1.220 billion for water
assets and $534 million for sewerage assets).
A comprehensive digital planning process was
undertaken to determine the digital services and
internal support needed to operate our business
and deliver what is important for our customers.
This process is outlined in Figure 4.
SA Water Our Plan 2020-24 16The three key drivers for the development In addition to delivering for our customers, we
of this digital plan were: actively manage a number of risks including cyber
1 what our customers value threats, recovery of business critical systems, data
loss, and loss of infrastructure control. All the while,
2 operational efficiencies our level of risk, cyber threats and wider regulatory
3 risk management. landscape continue to evolve.
The digital expectations of our customers are Digital capabilities have great capacity to generate
steadily increasing and investment is needed operational efficiencies and cost savings. This
to meet customer needs now and into the comes in the form of better data, integration,
future (Figure 5). automation and analysis across the business
so we can continue to leverage opportunities.
Figure 5: Customer experiences that will be enhanced by improved digital capabilities
Tell me what's
Understand me Solve my issue
happening
Doing what Keeping
Making Being
Listening we say we’ll customers Being fair
things easy skilled
do informed
SA Water Our Plan 2020-24 174.0 Our business is efficient and we seek continuous improvement
Through our ongoing efforts                               The outcome of the most recent independent              Figure 6: Total operating costs benchmarked using CLD analysis
                                                          benchmarking study conducted by KPMG in 2019
to drive efficiencies across                              (see Appendix K) is set out in Figure 6, with each of
                                                                                                                                       1,400,000

our business, we maintain low                             the grey dots representing one of our peer utilities.
                                                          KPMG used a transparent normalising technique
operating costs compared with                             called CLD for a better comparison with water                                1,200,000
our peers, despite working in                             utilities given the differences in the number of
                                                          customers, size of networks and demand for service.
conditions more challenging                               For example, small water networks servicing large
than those faced by like utilities                        numbers of customers will normally be more efficient                         1,000,000
in Australia.                                             than large water networks servicing smaller customer
                                                          numbers. KPMG based its benchmarking on publicly

                                                                                                                  (2016-17) ($’000s)
                                                          available data from the Bureau of Meteorology’s

                                                                                                                     Total Opex
Our statewide water network spans more than
                                                          National performance report. KPMG’s report                                    800,000
27,000 kilometres, necessitating high use of
electricity to pump water vast distances. Being           (Appendix K) shows we compare strongly using CLD
at the end of the Murray-Darling Basin, we often          analysis, as well as on operating costs per customer.
manage challenging water quality in our primary           The benchmarking shows we are leading the                                     600,000
water source, which can increase our chemical             efficiency frontier in Australia for total operating
and treatment costs.                                      costs. This includes all costs to deliver water
There are some fluctuations in expenditure across         and sewerage services in South Australia and
the years driven by changing rainfall, temperature        means we are performing better and with lower                                 400,000
and customer demand for water, which increases            operating costs, than expected from our industry.
our operating costs. For example, in 2016-17 we           It also shows that since the benchmarking was
experienced high rain and low water sales, resulting      first done in 2013-14, the average efficiency for
                                                          our peer group has improved, and we have                                      200,000
in lower expenditure and in 2018-19 we had low rainfall
and high water use which increased expenditure.           outperformed our peers by improving efficiency
                                                          by a greater amount.
To continually assess our performance and
                                                                                                                                              0
improve, our operating costs are independently                                                                                                     5,000        10,000     15,000            20,000    25,000   30,000
benchmarked providing a comparison with
our peers.                                                                                                                                                                            CLD

                                                                                                                                                      Average efficiency            Peer utilities
                                                                                                                                                      2013-14                       SA Water 2017-18
                                                                                                                                                      Average efficiency            SA Water 2013-14
                                                                                                                                                      2017-18
                                                                                                                  Source: KPMG OPEX Benchmarking report.

SA Water Our Plan 2020-24                                                                                                                                                                                                19
Comparing what we spend in operating costs Figure 7: Operating costs benchmarking using water operating costs per customer (2014-18)
per water customer (Figure 7), we are the fifth
Density
lowest cost utility out of the 13 largest utilities in 1,000 100
Australia, and we are the lowest when looking 900 90
at sewerage operating costs per customer
(number of customers served per km of water mains)
(Figure 8). Considering we have a huge 800 80
network to operate and fewer water customers 700 70
than the more highly populated states, the
benchmarking shows we are successfully 600 60
Opex ($)
keeping our operating costs down. 500 50
This efficient operating cost is important as 400 40
it sets the starting, or base, operating costs
which will form part of setting 2020-24 revenue. 300 30
200 20
100 10
0 0
Hunter Barwon Water Sydney SA Water Icon Water Yarra South East City West Unitywater Logan Gold Coast Queensland
Water Water Corp. Water Ltd Valley Water Ltd Water City Council City Council Urban
Corp. Perth Corp. Water Utilities
Figure 8: Operating cost benchmarking using sewerage operating cost per customer (2014-18)
Density
600 120
(number of customers served per km of water mains)
500 100
400 80
Opex ($)
300 60
200 40
100 20
0 0
SA Water Water Barwon Sydney Unitywater Queensland Logan South East Yarra Valley Gold Coast Hunter Water Icon Water City West
Corp. Water Water Urban City Council Water Ltd Water City Council Corp. Limited Water
Perth Corp. Utilities
Average opex per customer Median average opex per customer Customer density (average number
of customers served per km of water main)
Source: KPMG OPEX Benchmarking report.
SA Water Our Plan 2020-24 204.1 Operating expenditure will decrease
We will use $1.9 billion to operate our business As the base operating cost has already been The proposal adjustments to operating costs 3 Improving to deliver better experiences for
over 2020-24. assessed as efficient, the operating expenditure are discussed in more detail below. our customers – where customers have told
While our operating costs are among the for the 2020-24 regulatory period is set by considering Expenditure for our infrastructure and operations us it is important to them for improvements to
lowest in Australia, we continue to drive efficiency the adjustments to this efficient base cost. Figure is presented in five categories: be made, and they are willing to pay for them.
through our business, looking for new ways to 10 details the movement from the base operating This includes enhancements to water quality for
cost in terms of increases and savings. 1 Meeting our external responsibilities – these people currently receiving a non-drinking water
decrease costs. are the costs of meeting all our legal and
Starting from the efficient base expenditure, supply, improvements to the taste, odour and
This has resulted in a 2018-19 base year operating regulatory requirements, including compliance physical properties of our water and extending
cost of $479 million. This amount has been normalised additional costs have been allowed to ensure for drinking water quality, protecting the
we can meet external regulatory obligations, our community support model to customers in
to adjust for water demand volumes and other environment, safety and many others. regional areas.
abnormal operating, climate and external factors maintain and improve service levels based on
what is important to our customers, and a small 2 Investing to sustain reliable water and 4 Expanding to enable positive growth and
in 2018-19. Climate and market factors resulted in sewerage services – maintaining the level
allowance for the costs of servicing new customers. change – these are the costs associated with
higher than normal electricity volumes combined of service customers currently receive. This
This is an average increase of $40 million per year. servicing new water and sewerage customers
with higher market prices which led to an extra includes operating and maintaining current or increasing the services available to existing
$16 million spent on energy costs in 2018-19 This increase in future operating costs is more than infrastructure, replacing it when necessary, customers.
compared with our forecasts. offset by the additional savings we are planning to providing an experienced Adelaide-based
deliver through our zero cost energy future initiative 5 Investing in efficiency – these are investments
The 2018-19 normalised base year (Figure 9) Customer Care Centre to answer phone calls
(energy savings) and planned ongoing operational that will deliver savings and reduce the cost
sets the foundation for our operating expenditure with field-based crews able to attend and
efficiencies, with an average annual saving of to deliver services to our customers.
when planning for 2020-24. From this figure, we restore temporary service interruptions.
then add what is needed to achieve outcomes $56 million (12 per cent). This results in an average
for our customers and subtract the savings we net operating cost saving of $16 million per year
expect to make. on average over the 2020-24 regulatory period.
Figure 9: Base year normalisation (2018-19) Figure 10: Average operating costs per annum 2020-24
520 3 (47)
9
506 12
500 500
16
(11)
480 (5) 479 479 (9)
(10) (2) 463
460
450
440 Combined ongoing
efficiency
420
400 400
2018/19 Volume Electricity One off Other Efficient Efficient Sustain External Improve Enable Energy Ongoing Our Plan
actual adjustments price reductions baseline base year base year services responsibilities services growth savings efficiency proposal
reductions adjustments
Figure 9 and 10: December 2018 dollars.
SA Water Our Plan 2020-24 214.2 We will seek further efficiency across operating, capital and IT expenditure
Our proposal is to save an additional 0.5 per cent Key improvements to deliver our efficiency A 5 per cent capital delivery efficiency target
per year of operating costs (excluding external fees), target are: is also proposed for IT investments and will be
compounding to 2 per cent by 2024. Combining • early on-boarding of a client organisation delivered through:
this with planned procurement savings of partner to support the planning, market • consolidating IT systems enabling increased
$5 million per year, this equates to an additional approach, evaluation, award and specialisation of internal resources and
cost saving of $37.2 million over the regulatory implementation of contracts increasing efficiency
period.
• re-evaluation of our supplier agreements • partnering with our supply chain and
These savings initiatives, along with other identified for materials, equipment and services establishing common goals for efficiency
savings (below), provide an overall average reduction • workforce planning • improving our supplier, vendor and contract
in our operating expenditure of 12 per cent or
• scope prioritisation modelling management
$56 million a year on average, totalling $224 million
over the regulatory period (Table 2). • improved scope definitions using Front • more efficient delivery methodologies for:
End Engineering Design services increasing and refining use of agile delivery
Having met an efficiency target of 5 per cent in
the 2016-20 regulatory period on capital delivery, • improved project controls techniques
we have locked in this saving by using lower • improved systems and processes, including using Scaled Agile Framework to support
capital infrastructure delivery costs to estimate a competitive target outturn cost development, better coordination across the delivery
lower unit cost for delivering infrastructure during value for money work practices, work allocation portfolio
the 2020-24 regulatory period. To continue saving practices, performance management, and • increasing use of software as service solutions,
on the cost of delivering capital infrastructure, reporting and governance. reducing delivery times and costs by using
we propose a further 5 per cent capital delivery cloud-hosted solutions.
efficiency target for the 2020-24 period.
This additional cost saving will be achieved
through a new delivery and commercial model
that draws on lessons learnt in the 2016-20
regulatory period and will drive improved
customer outcomes.
Table 2: Operating costs savings from 2018-19 base year
Summary of efficiencies 2020-21 2021-22 2022-23 2023-24 Average
$million real $million real $million real $million real $million
0.5% ongoing efficiency target (1.7) (3.3) (5.0) (6.6) (4.2)
Procurement contract savings (5.1) (5.1) (5.2) (5.2) (5.1)
Energy savings (including revenue)* (46.7) (47.2) (47.2) (45.8) (46.7)
Total annual savings (53.5) (55.7) (57.4) (57.6) (56.0)
% of total annual operating costs (12%) (12%) (12%) (12%) (12%)
Total opex less efficiencies 445 461 470 476 463
December 2018 dollars
*Zero Cost Energy Future
SA Water Our Plan 2020-24 225.0 Investing to sustainably maintain reliable services, improve customer experience, and enable economic, social and environmental outcomes
We will invest $1,220 million Figure 11: Water investment by category Figure 12: Sewerage investment by category Figure 13: Information technology investment
by category
in our water infrastructure, $73,000 $31,000
$10,600
$534 million in our sewerage $42,000 $132,000
$34,200
$256,000
infrastructure and $143 million $187,000
$53,500
in information technology over
2020-24. $111,000
Total: Total: Total:
This expenditure has been grouped $1,220 million $534 million $143 million
in five categories:
$108,000
1 meeting our external responsibilities $221,000
2 investing to sustain reliable water and $593,000 $45,100
sewerage services
3 improving to deliver better experiences
for our customers
External responsibilities Sustain services Enable growth Improve services Efficiency
4 expanding to enable positive growth
and change All dollars in December 2018 dollars, unless otherwise stated $k’s.
5 investing in efficiency.
Figure 14: Capital expenditure by year and category
The level of capital expenditure by these
categories is summarised in Figures 11, 12, 13 250
and 14 and discussed in more detail below.
Our planned efficiency initiatives in water and 200
sewerage will be carried out in 2020-21, after
that our efficiency targets of 5 per cent per
year for capital delivery and 0.5 per cent for 150
operating expenditure (rising to approximately
2 per cent) will deliver further efficiency savings
in the remaining years. 100
50
0
2020-21
2021-22
2022-23
2023-24
2020-21
2021-22
2022-23
2023-24
2020-21
2021-22
2022-23
2023-24
2020-21
2021-22
2022-23
2023-24
2020-21
2021-22
2022-23
2023-24
External responsibilities Sustain services Improve services Enable growth Efficiency
Water Sewerage Information technology
All dollars in December 2018 dollars, unless otherwise stated $k’s.
SA Water Our Plan 2020-24 245.1 Meeting our external Safety
responsibilities The safety of our people and the community
is a critical priority across a wide range of work
As a responsible water utility, environments, infrastructure and equipment.
To ensure our people and community are safe,
we invest to meet our legal we assess safety risks and prioritise investment to
and regulatory responsibilities. achieve best effect. In 2020-24 we are investing
$29 million in our water infrastructure and
$32 million in our sewerage infrastructure to
Dam safety enable safe working environments and outcomes.
Dam safety guidelines set by the Australian To ensure we meet new requirements for asbestos
National Committee on Large Dams will see us removal, we are budgeting an additional
upgrade structures at Mount Bold, Baroota and $0.7 million per year in operational costs.
Hindmarsh Valley. This work will further protect
downstream communities by reducing the likelihood Water licences
of dam structure failures from floods or earthquakes. Working together with the Murray-Darling Basin
In 2020-24 there is an investment of $91 million in Authority and Department for Environment and
capital expenditure and $0.4 million per year in Water, we ensure water resources are used
operating expenditure. By spreading the upgrades sustainably. This includes holding the appropriate
across several regulatory periods the impact to licences and allocations to extract water from
customers’ bills has been partially mitigated. underground and surface waters such as rivers
and reservoirs. We will spend $14 million to meet
Water quality risk management these requirements.
To meet our external responsibilities in 2020-24 we
will invest $29 million to manage potential water Eyre Peninsula water security
quality risks through required upgrades to tanks, To address water security and supply issues on the
treatment plants and network stations. This work Eyre Peninsula and protect the long-term viability
will ensure we meet our responsibilities set out in of groundwater resources in the Uley Basin, we
the Australian Drinking Water Guidelines (2011). will construct a seawater desalination plant. This
investment also supports liveability and economic
potential for the region. The capital expenditure
to complete construction in the 2020-24 period
is $78 million of a total investment of $95 million.
Ongoing operating costs are budgeted at an
additional $5.1 million per year on average over
the regulatory period.
SA Water Our Plan 2020-24 25Sewage treatment plant licence Environmental improvement plans
compliance Where it makes sense to do so, we look to treat
To manage the environmental impact of used water for reuse as recycled water, providing
our operations, a $22 million investment is a valuable, climate-independent water resource
necessary to upgrade sewage treatment plants that reduces discharge to the environment.
and networks, and an additional $1.2 million per Recycling water is a cost effective way to reduce
year in operating budget to improve sewage our impact on the environment, while bringing
treatment plant performance. Our responsibilities additional customer benefits of water security, and
are set out in the Environment Protection Act 1993 supporting development and economic growth
and in regulations and licences issued by the in the state. Working together with the EPA, we
Environment Protection Authority (EPA). identify and implement environmental improvement
plans as needed. The priority locations in 2020-24
Reliable power supply are sewage treatment plants in Hahndorf, Millicent
An investment of $8 million will increase the reliability and Port Augusta East at a cost of $11 million in
of our sewage treatment plants through power capital expenditure and an additional $0.8 million
supply redundancy. Most of this investment will be in operating expenditure. Where feasible, we will
at Bolivar, which receives and treats 60 per cent of recycle water.
the sewage from the Adelaide metropolitan area.
Northern Adelaide Irrigation Scheme
Odour reduction This scheme is designed to reduce discharge by
To reduce the impact of odour for the community redirecting 12 gigalitres of clean, treated used
we will invest $20 million in priority areas of our water to support food production. By reducing
sewer network. An additional $1 million per year releases, we decrease the environmental impact.
will be spent in operating costs to optimise this In partnership with the Department of Primary
investment and/or fund operational solutions Industries and Regions South Australia, an
where they will be more effective than an innovative irrigation area has been created and
infrastructure solution. will transform the Northern Adelaide Plains into
a national leader in intensive, high-tech food
production. This development enables South
Australia to be competitive in the export market,
and drive employment growth, attracting new
skills and talent to the state.
SA Water Our Plan 2020-24 26An investment of $150 million (with $51.6 million Security Table 3: Proposed expenditure to meet external responsibilities
of this provided by Federal government funding) For the safety of communities and our people,
is being made to construct this scheme, most CAPEX CAPEX Average
and to reduce temporary service interruptions, water sewerage additional
of which will be complete before the 2020-24 we will invest $11 million in physical security such (four years) (four years) OPEX (per year)
regulatory period. During 2020-24, we will invest as fences, CCTV and alarms. Unauthorised access
$24 million in capital expenditure and $2.8 million Dam safety $91 million - $0.4 million
to our facilities has the potential to cause damage
per year in operating expenditure to complete the and lead to the contamination of water supplies Water quality risk management $29 million - -
scheme and deliver the service to our customers. or the environment, risking the safety of our Safety $29 million $32 million $0.7 million
The operating expenditure will be offset by people, customers and the community. In addition,
revenue generated as customers connect to Water licences $14 million - -
intruders can be exposed to hazards present at
this climate-independent water source. our sites. Eyre Peninsula desalination $78 million - $5.1 million
Sewerage treatment plant performance - $22 million $1.2 million
Sewer network infiltration management Water industry licence saving for licence compliance
To reduce the amount of stormwater and Offsetting the cost of these investments is a
groundwater that enters our sewer network, Reliable power supply - $8 million -
$2.4 million per year saving in operating costs as
known as infiltration management, we will invest a result of a reduction in our water industry Odour reduction - $20 million $1.0 million
$10 million in our sewer network infrastructure. licence fee. Environmental improvement plans (including recycling) - $11 million $0.8 million
This will help reduce the number of sewer
overflows to the environment from our network. Northern Adelaide Irrigation Scheme - $24 million $2.8 million
Improved infiltration management enables Sewer network infiltration management - $10 million -
more reliable plant performance and reduces
Accommodation $7 million $2 million -
the amount discharged after treatment. As an
additional benefit, we can use this extra capacity Security $8 million $3 million $0.1 million
to service more customers, deferring upgrades. Water industry licence fee reduction - - ($2.4 million)
Total $256 million $132 million $12.1 million
Accommodation
With a large number of owned and leased Total OPEX saving ($2.4 million)
facilities supporting the delivery of services to Net OPEX $9.7 million
customers across the state, we are investing December 2018 dollars
$9 million to establish and maintain these to the
regulated standards. This ensures the safety of
our people, contractors, customers and the
community.
SA Water Our Plan 2020-24 275.2 Investing to sustain reliable water and sewerage services To provide and sustain reliable services for our customers, we plan ahead and invest where needed. Ongoing investment in our network ensures: • delivery of safe, clean drinking water • minimal interruptions • environmental protection • great service and support for our customers. Water network management In 2020-24, we are proposing to spend $144 million on our water reticulation networks which is approximately the same amount as the 2016-20 regulatory period. Customers value minimal interruptions and have a small willingness to pay for an improved level of service for customers who experience multiple temporary interruptions in a 12-month period. Through innovative planning and new technologies, we are looking to achieve this outcome for customers without any bill impact. By investing in targeted upgrades, installing more valves to isolate smaller areas, and using predictive technologies and pressure management, we expect the number of customers interrupted more than three times in 12 months will decrease from the current 2,758 to
Major pipelines and trunk mains                        Third party works                                     Adelaide Desalination Plant                             Technical training
Major pipeline and trunk main renewals require a       At times, we bring forward investment in our          The Adelaide Desalination Plant is critical state       Our skilled and professional field-based teams
$128 million investment. This work includes parts of   infrastructure to better coordinate with other        infrastructure providing a climate independent          will continue to attend and safely restore services
the Morgan to Whyalla pipeline, a critical supply      government departments or organisations, and          source of water. It guarantees water security for       with the same timeframes customers experience
network for many regional communities. To ensure       we expect to spend $45 million to achieve these       the Adelaide metropolitan area and supports             now, with additional investment of $1 million per
we are investing wisely in our pumping mains, we       outcomes. An example is major road construction       regional areas, where connected, while also             year to ensure our people are trained in technical
are investing $0.4 million per year in operating       where we may replace pipes sooner than planned        providing us with significant operational flexibility   disciplines and to build capabilities, particularly
expenditure to conduct condition investigations        or we may be required to move our infrastructure.     to respond to water quality in Adelaide and the         to support the adoption of new and emerging
and refurbish valves and other ancillary assets        Costs are shared with the third party.                ability to defer capital expenditure in other network   technologies.
as required.                                                                                                 areas. The operating contract allows for a slight
                                                       Major and minor plant                                 increase in costs during the regulatory period to       Wage increases
Water network and facilities renewal                   Our people use a wide range of equipment and          replace parts that are ageing.                          Wage increases across Australia continue to rise
An investment of $172 million will enable renewal      machinery to do their job, such as earth moving                                                               at greater than 0.5 per cent above CPI and this is
of our water network and associated facilities,        machinery, mobile pumps and testing equipment.        Sewer network and facilities renewal                    a long-term trend. Facing the same cost pressures
including pipes and connections, bores to extract      Making sure we have the right plant and keeping       An investment of $79 million and an additional          as other business, we need to allow for wage
groundwater, pump stations, tanks and controls.        it in safe working order will cost $34 million.       $0.5 million per year in operating costs will renew     increases. This will be offset by the 0.5 per cent
                                                                                                             our sewer network and associated facilities,            efficiency measure we will apply to our operating
Water treatment plant renewal                          Cathodic protection                                   including pipes and connections to reduce               cost each year so we effectively allow for wage
To ensure the ongoing efficient operation of           Cathodic protection reduces corrosion of              blockages and the risk of collapses, as well as         increases aligned with CPI.
water treatment plants, we will invest $63 million     infrastructure in particular soil types and we will   structures at pump stations, siphons, access
on renewals including mechanical and electrical        be investing $12 million to install and upgrade       chambers, vents, covers, connections and valves.        Support for customers in financial hardship
components and upgrades, as well as chemical           where needed.                                                                                                 Support for residential customers experiencing
treatment systems to ensure efficiency and                                                                   Sewage treatment plant renewal                          short or long-term financial difficulty will continue
performance.                                           Asset inspections                                     Sewage treatment plants will be supported with          with no additional cost impact to customers.
                                                       An increase of $3.2 million per year in operating     a $115 million investment, including for mechanical     We will continue to provide:
SCADA                                                  costs for inspections and major maintenance on        and electrical components, filtration and aeration      • a payment matching program to help
SCADA is a system used to control our assets,          our water infrastructure will enable us to better     systems, concrete structures, tanks and walkways,         customers reduce their debt
monitor performance and resolve issues before          understand asset condition and performance so         including replacing the membranes at Glenelg.
                                                                                                                                                                     • free home audits that help find ways for
they affect customers. To keep this system             we can maintain service levels and make prudent                                                                 customers to safely reduce their water use
performing, we will invest $14 million in capital to   investment decisions.                                 Recycled water network renewal
                                                                                                                                                                       and costs
renew and install components where needed to                                                                 Renewal of our recycled water network will
                                                                                                                                                                     • referrals to independent financial counsellors
maintain quality, reliability and dependability of                                                           be supported with $2 million for pipes and
                                                                                                                                                                       to help customers over the longer term.
water and sewerage services. Our investments in                                                              connections, network ancillary renewals, and
the digital support for this system is included                                                              reliable and flexible services for customers            Our ongoing customer research program will
under integrated operations digital capability.                                                              through access to more than one water source.           continue to grow our understanding of what is
                                                                                                                                                                     important to our customers, and what they
                                                                                                                                                                     expect from us into the future.

SA Water Our Plan 2020-24                                                                                                                                                                                                    29
You can also read