South West Water Resources - A Review of Future Trends - Department of Water April 2007
←
→
Page content transcription
If your browser does not render page correctly, please read the page content below
South West Water Resources
— A Review of Future Trends

 Department of Water
 April 2007
South West Water Resources – A Review of Future Trends

Level 4, 168 St Georges Terrace
Perth Western Australia 6000

Telephone +61-8-6364 7600
Facsimile    +61-8-6364 7601
For more information about this report, contact the Strategic Water Planning
branch on +61- 8-6364 7600.

April 2007

                                                                                      2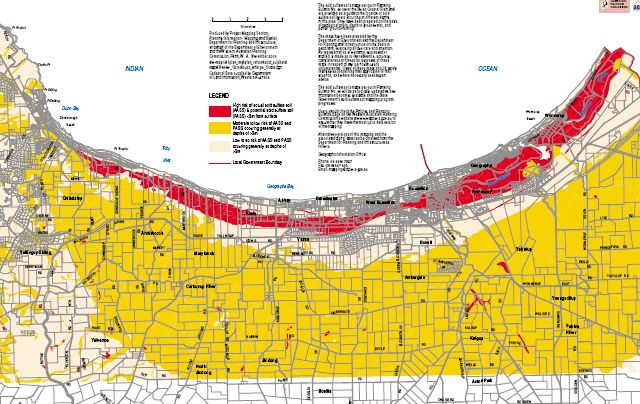
South West Water Resources – A Review of Future Trends

Contents

Purpose of this paper .......................................................................................... 4

   Groundwater systems......................................................................................... 6

   Surface water systems ....................................................................................... 6

   Alternative water sources ................................................................................. 11

Influences on future water supply .................................................................... 12

   Climate trends and impacts .............................................................................. 12

   Salinity recovery catchments ............................................................................ 14

   Acid sulfate soils............................................................................................... 17

Future conflict over source protection planning............................................. 20

   Recreational activities....................................................................................... 20

Future water demand......................................................................................... 25

   Population growth............................................................................................. 25

   Agriculture ........................................................................................................ 29

   Mining ............................................................................................................... 32

   Industrial use .................................................................................................... 33

Other water-dependent industries.................................................................... 35

   Tourism ............................................................................................................ 35

   Forest management ......................................................................................... 36

   Tree plantations................................................................................................ 37

   Inland freshwater fisheries................................................................................ 40

References……………………………………………………………………………...43

                                                                                                                          3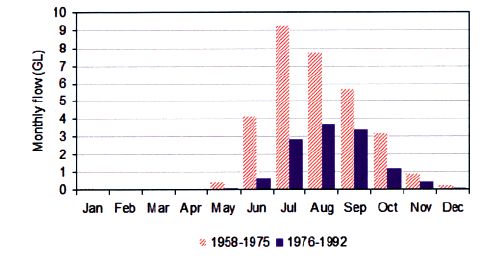
South West Water Resources – A Review of Future Trends

Purpose of this paper
The information in this paper aims to provide an indication of future trends in water
resource availability and demand in the south west. This will help determine what
major strategic issues lay ahead for the management of the water resources and
services in the area.

It should be read in conjunction with:

   •   The South West Water Plan – an invitation to participate

   •   South West Water Resources: A Regional Overview; and

   •   South West Water Resources: Water Policy Overview.

There will be a number of opportunities for public and stakeholder input into the
South West Water Plan at all stages of the development process. The Invitation to
Participate paper provides details on how community members can register their
interest in community workshops that will occur as a part of the development of
the South West Water Plan

Because water demand is influenced by so many volatile social and economic
factors, it is difficult to provide exact figures for potential increased demand for
various industries, including agriculture.

Various assumptions about the underlying drivers have been made for the
different industries that may not be valid for longer than several years after the
prediction was made. The figures we have supplied for increased demand also
tend to assume that water use for the future will be in addition to current use. In
some cases this might be correct; but in other cases, new industries will replace
old ones and therefore water uses will be replaced rather than added to.

What is evident is that residential urban expansion will continue along the Swan
Coastal Plain, particularly in the local government areas of Capel, Bunbury,
Busselton, Harvey and Dardanup. This will continue to place pressure on
available resources for domestic consumption as well as having implications for
drainage, flood plain management, sewerage services, and environmental
management of rivers, wetlands and waterways.

The Swan Coastal Plain is also expected to be the location of potential expansion
in the mining sector and the industrial sector in Kemerton.

The main potential regions for expansion in agriculture (as well as changing
industries) are along the Leeuwin Ridge between Busselton and Augusta, the
Scott Coastal Plain and the Manjimup region.

                                                                                        4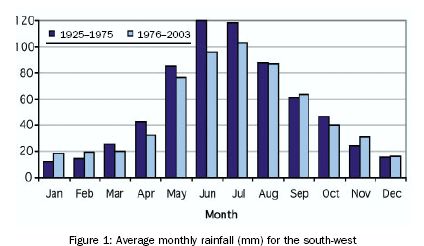
South West Water Resources – A Review of Future Trends

The ability of existing ground and surface water resources to meet increased
demand is difficult to quantify for several reasons. Firstly, decreased rainfall has
resulted in decreased streamflow and impacted on groundwater levels. The full
extent of this is yet to be adequately investigated and realistic sustainable yield
figures set as a result. Secondly, environmental water needs have not been set for
many systems, which again makes it difficult to estimate the realistic water
available for consumption by other users.

                                                                                       5
South West Water Resources – A Review of Future Trends
Future water supply sources
Groundwater systems
Abstraction by Water Corporation of 45 GL/yr from the South West Yarragadee
aquifer is planned if regulatory approvals are obtained. A State Government
decision on the proposal is expected in 2007.
The Collie Groundwater Area (GWA) and Busselton-Capel GWA are divided into
sub-areas for management purposes. Both these groundwater areas have sub-
areas where some aquifers are currently over-allocated. The Department of Water
(the Department) is currently reviewing the allocation limits for aquifers within the
Bunbury, Blackwood, and Busselton-Capel groundwater areas as part of
preparing a groundwater management plan for this resource.
The Collie GWA is over-allocated as a result of water being used to dewater open
cut coal mines and for power generation. Groundwater abstraction at rates
significantly greater than recharge is likely to continue well into the future. Mining
the groundwater resources is allowed under a State Agreement Act (Collie Coal
Agreement 1979). The current rate of recharge is such that it will take several
decades for groundwater levels to recover after extraction ceases. In the
meantime, exposed sulphides will oxidise and groundwater acidity may rise
(CSIRO 2005).
The future availability of groundwater will depend upon allocation limit reviews and
studies being conducted to determine sustainable yields of regional aquifers which
consider environmental water needs for dependent ecosystems, such as the
Blackwood River.
Surface water systems
In the south west, there is currently a greater volume of water licensed for
extraction from surface water systems than from groundwater systems. It is
difficult to obtain an accurate picture of surface water extraction because of the
lack of licensing in some catchments.
This makes predictions of future surface water availability in many areas difficult to
predict, particularly in light of rainfall trends. Potential yield figures for many
surface water systems also need to be updated based on recent changes to
average rainfall, which would alter the amount of water that could potentially be
extracted.
Environmental water needs would also need to be established accurately for
many river systems, which would affect how much water might then be considered
available for any other consumptive purposes.
6South West Water Resources – A Review of Future Trends
There are several drainage basins within the South West Region. They include
the Harvey, Collie, Preston, Busselton Coast, Donnelly, Blackwood, Warren and
Shannon River basins. Some of the following options presented for the basins are
only potential technical options to increase extraction from these systems. The full
technical, social, and economic feasibility of many of these has not been
assessed.
Harvey River Basin
With the possible exception that licensing of some winter diversions from coastal
plain streams could be approved, no new large diversions from the hills are
considered likely.
Harvey Water has proposed permanently trading 17 GL/yr of water from its
irrigation cooperative to Water Corporation. This volume reflects recent efficiency
gains resulting from the piping of irrigation supply channels in the Waroona and
Harvey Irrigation Districts. Trade by water users with drinking water providers is
limited by the water quality of the dams (Harvey, Waroona and Drakesbrook). Any
trades out of these dams would also require the construction of additional
pipelines and treatment facilities into the Stirling Trunk Main. It would also entail
catchment management changes to ensure that dams could meet Public Drinking
Water Standards.
Collie River Basin
Water may also be available in the medium-term from efficiency improvements in
the Collie Irrigation Area, along with salinity problems in the Wellington Reservoir
being overcome (CSIRO 2005). Further investment in on-farm efficiency could see
additional water available for trade in the longer-term.
Wellington reservoir is the largest dam storage in the south west with a 186
gigalitre capacity and an annual sustainable yield of 85 GL/yr. As with all south
west surface water storages, reduced rainfall and run-off has meant the actual
storage has been below average in recent years. Of the 85 GL/yr available from
Wellington reservoir, 68 GL/yr has been licensed to Harvey Water for irrigation
use in the Collie River Irrigation District. The remaining 17 GL/yr is part of an
application for a license by the Water Corporation. Of this, 5 GL/yr would be for
use as cooling water in power generation in the Collie Coal Basin.
Currently the Wellington Reservoir is not connected to the IWSS, but a connection
may be a possibility if salinity levels are reduced. New infrastructure would be
required to transfer any water to the IWSS. The amount currently available is 12
GL/yr, given the 5 GL/yr nominally allocated for power generation. Detailed
assessment of the viability of connecting Wellington reservoir to the IWSS will
occur if salinity levels can be reduced. Substantial planning would be needed to
address the volumetric capacity of trunk mains, and catchment management
issues.
7South West Water Resources – A Review of Future Trends
A $30 million program is underway to tackle salinity in Wellington catchment by
diverting highly saline water from the east tributary of the Collie River. This
program is funded jointly by the State and Commonwealth governments. Water
source protection requirements would also need to be managed before the
resource could be used for public drinking water.
Additional water may also be accessible from the lower reaches of the Collie River
downstream of the Wellington National Park. The availability of this water would
in-part be dependent on piping of irrigation supplies to the Collie River Irrigation
District (CSIRO 2005). There are a variety of logistical and economic factors (geo-
technical, land, and water treatment costs) that would need to be considered prior
to this. Consideration would also need to be made of potential impacts on
environmental water supplies and downstream impacts on the Leschenault
Estuary.
The Collie Wellington Basin Water Source Options Steering Committee was
convened by the Government in 2006 and is to provide advice in 2007 on:
• best productive uses of water in the Collie Basin
• a range of water source development options in the Collie Basin, the
outstanding issues and uncertainties associated with each and the timeframe
required for the option to begin delivering water; and
• best prioritisation of projects to deliver water to required standards.
CSIRO (2005) suggests that there may also be additional water available from the
Brunswick River. However, this is an unlikely scenario because of the importance
of the Brunswick River to the Leschenault Estuary. A thorough assessment of
environmental water needs, the impact of existing use, and the economic and
technical feasibility of accessing water from the Brunswick would need to occur
before any further development could be considered. There are also issues
relating to the potential cumulative effect on the Leschenault Estuary of proposed
diversions on both the lower Collie and lower Brunswick Rivers.
Preston River Basin
Dam sites on the Ferguson River and Thompson Brook could each yield over 10
GL/yr and Joshua Brook about four GL/year. However, these sources are unlikely
to be developed to this level as current self-supply licensed use, either from
existing surface water diversions or groundwater bores, is providing sufficient
supplies to maintain current agricultural production in the area. It is unlikely,
therefore, that large developments of five to 10 GL/yr will be required for irrigation
purposes.
Development as potential public drinking water sources is possible but of low
priority relative to alternatives because of size, location and the cost of water
treatment.
8South West Water Resources – A Review of Future Trends
Busselton Coast Basin
In the short-term, further expansion of viticulture in the region may see a growth in
self-supply use. Sufficient water is available in the basin to support this growth,
although difficulties in finding sufficient storage within properties and managing
competition for water on specific tributaries must be managed.
In the short to medium-term, the Margaret River Town Water Supply is expected
to be expanded to serve other centres in the Cape to Cape region. The supply is
currently based on Ten Mile Brook, a tributary of the Margaret River, and is
designed to be augmented by a pump-back facility from Margaret River. This is
likely to meet demand for at least five to ten years. In the longer-term, there is
potential to establish a large storage on the Margaret River (~40 GL/yr) to supply
the Cape to Cape region and demand further north. The full technical, social, and
economic feasibility of such a proposal has yet to be assessed. Any such
development is unlikely to proceed before the sustainable draw is taken from the
South-West Yarragadee groundwater and surface water developments in the
Blackwood and Donnelly River basins. The boundary for the new Bramley
National Park has been defined to exclude the potential reservoir area from the
park (CSIRO 2005).
Donnelly River Basin
The Donnelly River is the largest undeveloped fresh surface water resource in the
south of the State. Between 70 and 74 GL/yr of high quality surface water is
potentially divertible from the Donnelly River (CSIRO 2005). This includes the
potential for a 60 GL/yr diversion at Dam Site 40. The recent creation of the
Greater Beedelup National Park in the area was done with regard to its future
potential as a water source. However, due to the high conservation values in the
area, obtaining the necessary approvals for such an undertaking would be difficult,
require long lead times and contain considerable uncertainties (CSIRO 2005). If
environmental factors precluded a major dam in the main valley, small pipehead
dams in State Forest on the lower Donnelly River and Barlee Brook (combined
sustainable yield of about 40 GL/yr) might provide an alternative. There is
potential for a further five GL/yr to be allocated for further small farm dams on
private land in the basin.
Blackwood Basin
In the short-term, Water Corporation may develop new storages on Gregory Brook
and Camp Creek, which are small tributaries of the Blackwood River (CSIRO
2005). These will establish a more reliable regional water supply scheme to
service the towns of Bridgetown and Boyup Brook east and extend the scheme
north to include Greenbushes, Balingup, Hester and Kirup. These developments
would provide a yield increment of two to three GL/yr. The boundary of the new
Dalgarup National Park was adjusted to accommodate the potential development
of Gregory Brook.
9South West Water Resources – A Review of Future Trends
Water Corporation is also assessing the potential of developing St John’s Brook
as a pipehead dam (yield of ~15 GL/yr) to complement its proposed development
of the South-West Yarragadee aquifer. The pipehead proposal could be brought
forward if significant constraints were identified that limited the sustainable
diversion limits of the South-West Yarragadee aquifer. The St John’s pipehead
development is located in the new St John’s Brook Conservation Park.
Negotiations with the Department of Environment and Conservation (DEC) are
proceeding to ensure that the management plan for the new park makes provision
for the development.
Developments on other tributaries of the Blackwood River, upstream from St
John’s Brook, are more remote. The Scott River pipehead, while having a high
nominal yield of over 20 GL/yr, is even more remote from known centres of
demand. In the short to medium-term it is likely to be developed only if mineral
processing associated with sand mining occurred in the area.
Warren River Basin
There is sufficient surface water available for some small scale dam
developments on private land in the basin. However, sustainable limits have been
reached on some tributaries.
While remote from current demands and existing services, the large undeveloped
resources of the Warren River Basin remain strategically important to meet
medium to long-term water demand growth in the Perth to Busselton region
(CSIRO 2005). It is likely that their development would occur only after the
available surface water resources of the Donnelly River Basin were developed.
Development could be phased with the Dombakup Brook Dam and the lower
Warren River pump-back most likely to be constructed first. The capacity of the
pump-back could be increased progressively as demand grows to reach a
maximum of 70 to 80 GL/yr. The combined scheme would provide about 100 to
110 GL/yr before the upstream dam on the main Warren River would be required.
Development of a Dombakup Brook reservoir would impact on small areas (75-
200 ha) of the new Greater Hawke National Park. Approval of the Minister for the
Environment and Parliament would be required to excise the areas from the
national park.
Shannon River Basin
As these resources are remote from current centres of demand, it is unlikely that
they will be developed for many years, if at all. However, if new demands develop
in the region (eg related to mineral processing or industries based on the timber
industry), they would become important. The only potential development with
sufficient storage to meet such demands is on Boorara Creek, although the
reservoir from this development would flood about 15 ha of the new Boorara
Gardner National Park. Environmental approval and excision of the inundation
10South West Water Resources – A Review of Future Trends
area from the National Park would be required before this development could
proceed.
The Walpole River is not a reliable source of supply to Walpole Town in dry years.
Insufficient base flows are available through the last months of summer and
autumn to maintain the supply. While sufficient water is available from the
resource, additional storage (and better catchment management to protect water
quality) is required to improve the security of this supply.
Alternative water sources
Alternative water sources include water that is:
• Harvested – from roofs or other hard surfaces for use;
• Recycled and treated in some form from industrial, agricultural, urban, or
domestic waste waters;
• Recovered from sources that are currently unusable due to poor water
quality; and
• Re-used – where water (without additional treatment) is used several times
before being disposed of.
Future trends in the availability of water from these non-traditional sources are
difficult to predict. Limited information currently exists on how much alternative
water is used in the region in place of accessing traditional surface or groundwater
supplies.
Various options have been suggested for the region, including the potential for de-
salination of various dams, including Wellington, to recover water to drinking water
quality. No definite proposals for de-salination plants, inland or on the coast, are
currently planned for the South West Region.
There are many factors that influence the establishment and use of alternative
water sources at domestic, town and regional levels. However, as is the case for
most of Western Australia, it is clearly possible for use of these sources to
increase in the future and reduce demand upon traditional surface and
groundwater sources.
11South West Water Resources – A Review of Future Trends
Influences on future water supply
Water for domestic, industrial, agricultural, mining and other uses is currently
sourced predominantly from surface or groundwater systems. There are various
factors that influence how much water is available for extraction from these
systems. Future water planners need to be aware of the potential positive and
negative influences on water availability occurring from environmental trends, land
use changes or human activities.
Climate trends and impacts
Climate trends can have potentially significant impacts on water availability.
Historically the south west has had hot, dry summers and cool, wet winters.
Around 75 per cent of the annual rainfall occurs between May and September.
Winter rainfall in the region has decreased substantially since the mid-20th
century. The winter rainfall decreased sharply in the mid-1970s by about 15-20
per cent. Climate change modelling (IOCI, 2002) suggests further reductions in
rainfall and increases in temperature for the south west.
Most likely, both natural climate variability and the enhanced greenhouse effect
have contributed to the rainfall decrease. Average May-October rainfall in the
south west in the last 25 years has been only about 85-90 per cent of the
preceding 50-year average. Average monthly rainfall (mm) for the south west both
pre- and post-1975 is displayed in Figure 1.
Figure 1. Average monthly rainfall (mm) for the south-west
The climate of the south west will continue to exhibit wet and dry periods
throughout the 21st century due to natural climate variability, overlaid by changes
expected from enhanced greenhouse conditions (ie climate change) (IOCI 2005).
CSIRO modelling of emission scenarios suggest that by 2030 rainfall in the region
may have decreased by as much as 20 per cent relative to 1990. By 2070, this
could be by as much as 60 per cent (CSIRO 2001).
12South West Water Resources – A Review of Future Trends
Day-time and night-time temperatures have increased gradually but substantially
over the last 50 years, particularly in winter and autumn. The warming in the south
west is believed to be largely the result of the enhanced greenhouse effect.
Looking across a range of future greenhouse gas emission scenarios, CSIRO
Atmospheric Research has predicted temperature rises averaging between 0.1 to
0.65°C per decade in the south of WA, with the strongest projected rises in
summer.
Climate change affects how much rain falls, when it occurs, and where it falls.
Temperature and evaporation rates can also change. When overall temperatures
rise, or the number of hot days in a season increases, this can result in greater
water needs for crops and an increase in evaporation from waterways. These all
contribute to changes in groundwater recharge, surface water runoff, and water
needs for crops, animals, humans and vegetation. These factors will affect how
much water is available from different sources.
Impact on stream flows
Only a small proportion of rainfall becomes stream flow. In the south west,
average annual stream flow generally ranges from three per cent to 20 per cent of
rainfall. The reduction in winter rainfall and the absence of very wet years has
resulted in greatly reduced runoff and recharge. Annual stream flow in the south
west has generally been below the long-term mean annual flow for the last two
decades. The reduction in stream flow is variable, with the greatest change
observed in the higher rainfall areas. Rivers also start flowing later and flow for
less time than previously observed. Figure 2 provides a comparison of the median
monthly flows for the Harris River near Collie before and after 1975.
Figure 2. Median monthly flows for the Harris River before and after 1975
The reduction in rainfall, along with lower and less frequent stream flows, is likely
to have major implications for the structure of rivers, in-stream ecology, riparian
vegetation and stream salinity (IOCI 2005). The surface water available for
consumptive use has been considerably reduced with some reservoirs no longer
13South West Water Resources – A Review of Future Trends
reaching their storage capacity. If the enhanced greenhouse effect causes further
rainfall decrease in the region, a higher percentage decrease in stream flow will
occur.
Currently it is not possible to predict the exact level of change on stream flow from
either climate variability or climate change. The CSIRO (2005) has noted that
setting appropriate Environmental Water Provisions (EWPs) for surface water
sources in the south west will “prove a difficult challenge if streamflows continue to
decline” (p.24).
Impact on groundwater
Groundwater levels can also be affected by climate. Superficial or unconfined
aquifers are quite sensitive to changes in rainfall. With a continuation or further
decrease of the low average rainfall, the groundwater levels in some superficial
aquifer systems will decline further. Sustainable conditions in associated wetlands
and in abstractions for water supply, horticulture and industry will be affected by
any further changes in rainfall.
Confined aquifers are relatively unresponsive to changes in rainfall. Potentiometric
heads (the level to which water rises in a borehole) in the confined deeper
aquifers of the coastal plain are not immediately affected by changes in rainfall
(IOCI 2005).
Impact on salinity
Dryland salinity is driven by excess water in the landscape resulting from clearing
of perennial vegetation. The decrease in winter rainfall and absence of ‘wet
winters’ has caused a slowing in the process of salinisation, and in some cases
groundwater levels have fallen. The reduced incidence of wet winters since the
mid-1970s has almost certainly resulted in a slowing in the rate of salinisation in
many parts of the agricultural area (IOCI 2005).
More than half of the rivers in the south west are now marginal in quality, brackish
or saline. Stream salinity is still rising in many of the rivers across the south west
because of reduced fresh runoff which, in wet years, dilutes the saline
groundwater discharge.
Salinity recovery catchments
Wellington Reservoir
The Collie River catchment covers almost 3,000 km2 and includes the Wellington
Reservoir. The reservoir has long been viewed as a potential drinking water
resource but currently the water is too salty for drinking. An estimated 75 per cent
of the salt load into Wellington Dam originates from three tributaries – Collie River
East, James Well and Collie River South. The State Salinity Strategy (1996) set a
14South West Water Resources – A Review of Future Trends
salinity target of 500 mg/L by 2015 for the Wellington Reservoir. This would meet
the drinking water standard for salinity (ie 500 mg/L).
Streamflow salinity from the Collie River catchment began to increase before 1960
as a result of clearing of native forest for pasture. To halt the increase in salinity,
the State Government legislated to control the release of Crown land in 1961,
followed by legislation to control the clearing of native forest in 1976. Despite
these actions, the salinity of the Collie River upstream of the Wellington Reservoir
continued to increase as a legacy of previous clearing.
A State Government program of reforestation has resulted in 6,740 ha of land
being purchased and planted with trees. There are 9,500 ha of private plantations
in addition to the Government plantations. The increase in salinity has been
halted, but the salinity of water flowing into the Reservoir is now averaging nearly
900 mg/L, far higher than the 500 mg/L target (Mauger et al 2001).
The Collie Recovery Team was formed in 1995 to help restore fresh water into the
Wellington Reservoir. The Collie Salinity Situation Statement (Mauger et al 2001)
indicated it was technically possible to restore the catchment waters and
Wellington Dam to potable levels. Management options that would either attain, or
substantially attain, the target of drinking water quality in Wellington Reservoir are:
• A mix of upland and lowland plantations.
• A series of deep groundwater extraction bores could be constructed where
deep groundwater discharge would otherwise occur.
• Streamflow from the most saline tributaries could be intercepted by a dam
and transported out of the catchment by a pipeline.
A stakeholder workshop in 2002 evaluated the options to restore Wellington Dam
waters to an average salinity level of 550 to 600 mg/L by 2015 or sooner (WRC
2002). Participants recommended that the best option to pursue in the short to
medium-term (ie 10 to 30 years) is diverting the saltiest waters from tributaries in
the catchment into mine voids. The next most preferred option was diverting the
waters at James Crossing into a dam, coupled with groundwater pumping in the
South Branch to stop these highly saline waters being fed downstream into
Wellington Dam. In the longer-term, the stakeholders said that a more sustainable
option should be sought, possibly involving a combination of more perennial
vegetation and engineering means, such as groundwater pumping.
In January 2006, the Department of Environment reported that a two-month trial
involving the partial diversion of salty water from the East Collie River to a former
coal mine void had shown a significant drop in salt levels (DoE 2006).
Currently the Wellington Reservoir is not connected to the Integrated Water
Supply Scheme (IWSS) but this connection is proposed if salinities can be
reduced and trihalomethanes (THM) generation problems are addressed. Water
15South West Water Resources – A Review of Future Trends
source protection requirements, including placing limits on recreational use, would
also need to be met before the water could be used for drinking (CSIRO 2005).
The Lake Kepwari recreation area is being developed at a former open-cut coal
mine, 10 km south-east of the town of Collie. Part of a mining lease rehabilitated
by Wesfarmers Premier Coal, the two kilometres long and one kilometre-wide
Lake Kepwari void was formerly known as Western Five. A variety of water-based
recreational amenities (eg water skiing) are being developed for this new
recreation area.
Warren River
The Warren River catchment (with an area of 4000 km2) is recognised as having
one of the largest water resources in the south west. However, by the 1960s, the
salinity of the water in the Warren River had exceeded 500 mg/L TDS (Smith et al
2006). The average salinity in the period 1990-2001 was 895 mg/L TDS.
Extensive clearing of native vegetation in the upper sections of the catchment
during the 1950s and 1960s led to increases in stream salinity in the 1970s. An
estimated 60 per cent of the salt load comes from the Perup River and Tone River
sub-catchments. In response, the State Government introduced clearing control
legislation in 1978 and tree planting commenced during the 1990s in the Tone and
Perup River sub-catchments. For the Warren River, the State Salinity Action Plan
set a water quality target of potable water (500 mg/L TDS) by 2030.
In 1997, the Water and Rivers Commission established a local Recovery Team to
encourage full stakeholder involvement and foster partnerships between State
Government agencies, natural resource management groups, local government,
industry, research institutions, local community groups and catchment landholders
to achieve the water quality target.
The introduction of clearing controls and extensive areas of tree plantations have
had a positive impact on salinity levels in the Warren River. Salinity is still rising,
but significantly more slowly in recent years. In the absence of additional
intervention it is predicted that salinity levels of the Warren River at the Barker
Road Crossing gauging station will stabilise at 805 mg/L TDS (Smith et al 2006). It
is estimated that if plantations had not been established during the 1990s, the
salinity of the Warren River may have risen to over 950 mg/L TDS. However,
much more intervention is needed if the target salinity level is to be met.
Modelling of management options (Smith et al 2006) indicates that each of three
options could achieve the water quality target (500 mg/L TDS):
• Replanting 70 per cent of the current pastured land with non-commercial
trees (415 mg/L TDS).
• Pumping 13 GL a year of groundwater (1,625 bores) from the Tone and
Perup sub-catchments would reduce salinity to 500 mg/L TDS.
16South West Water Resources – A Review of Future Trends
• Diverting all the water (31.3 GL) from the Tone River into a nearby river
outside the Warren River catchment (380 mg/L TDS).
The next step for the Warren Recovery Team is the evaluation of the modelled
management options. In this step, water quality objectives are defined and, in
consultation with key stakeholders, scenarios to meet these objectives are
evaluated. Social, economic and environmental aspects will be considered and
more detailed modelling will be applied.
Acid sulfate soils
Acid sulfate soils are naturally occurring soils that contain iron sulfide minerals,
predominantly as the mineral pyrite. They are most likely to occur in coastal
regions of the State, but can also be associated with dryland salinity in some
inland agricultural areas (DoE 2004).
These soils do not pose a significant risk to human health or the environment
when undisturbed. However, the disturbance of these soils and oxidation of pyrite
by drainage, dewatering or soil excavation can cause:
• Significant environmental and economic impacts including fish kills;
• Damage to estuarine fisheries and loss of biodiversity in wetlands and
waterways;
• Contamination of surface and groundwater resources by acids, arsenic,
heavy metals and other contaminants;
• Loss of agricultural productivity; and
• Corrosion of concrete and steel infrastructure by acidic soil and water.
Western Australia has not suffered from major acid sulfate soils problems until
recently. This is attributed to the State’s relatively low population and that, until
recently, most development had taken place in sandy areas where there was little
occurrence of these soils. However, development pressure is increasing in low-
lying swampy areas due to increasing land values, particularly in wetland areas
near major urban centres and in foreshore areas of major estuaries, such as the
Leschenault Estuary. This development pressure will increase the risk of acid
sulfate soil-related environmental problems occurring unless the disturbance of
these soils is carefully managed (DoE 2004).
The Western Australian Planning Commission released Planning Bulletin 64 –
Acid Sulfate Soils in 2003. It identifies the main impacts in Western Australia
associated with acid sulfate soils as:
• Wetlands degradation.
• Localised reduction in habitat and biodiversity.
• Deterioration of surface and groundwater quality.
• Loss of groundwater for irrigation.
17South West Water Resources – A Review of Future Trends
• Increased health risks associated with arsenic and heavy metals
contamination in surface and groundwater, and acid dust.
• Risk of long-term infrastructure damage through corrosion of sub-surface
pipes and foundations by acid water.
• Invasion by acid tolerant water plants and dominance of acid tolerant
plankton species causing loss of biodiversity.
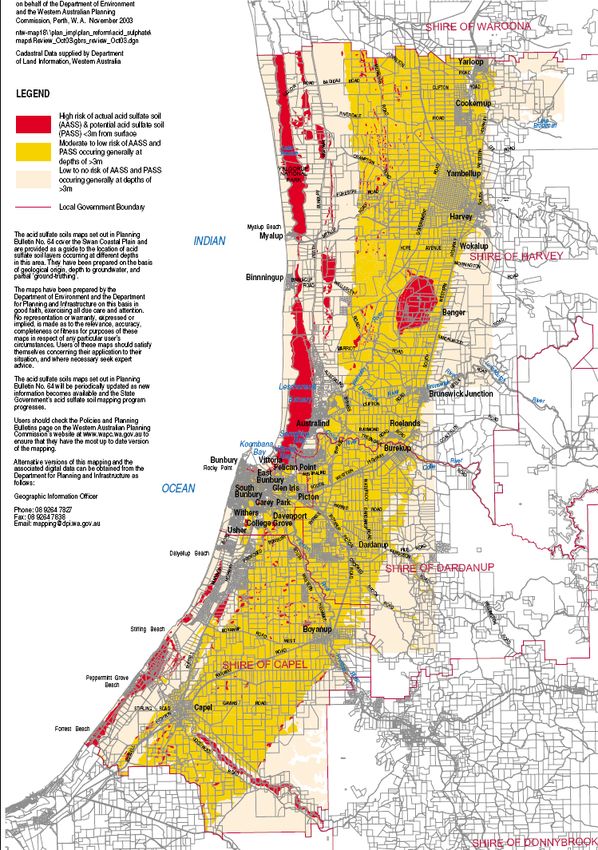
In the south west, acid sulphate soils are likely to be found in, though not limited
to, the Scott River Plain and estuarine, floodplain and wetland areas between
Perth and Busselton. Currently there is a poor understanding of the distribution of
these soils. The DoE has compiled a preliminary acid sulfate soil risk map for the
Swan Coastal Plain between Gingin and Busselton, but additional field
investigations are required to provide more certainty about the distribution of acid
sulfate soils (Figures 3 and 4).
Figure 3. Greater Bunbury Region Scheme Acid Sulfate Soils
18South West Water Resources – A Review of Future Trends
Figure 4. Dunsborough – Busselton Acid Sulfate Soils
19South West Water Resources – A Review of Future Trends
Future conflict over source protection planning
The Department of Water is responsible for the protection of water sources used
for public drinking supply. A ‘catchment to consumer’ multiple barrier approach is
used in the management of drinking water quality in Western Australia. Catchment
management for protection of the water source (held in storage in surface dams or
underground aquifers) is considered the first important barrier.
The agency has defined three levels of priority classification (P1, P2, P3) for
public drinking water supply areas (PDWSAs). It has prepared the Water Quality
Protection Note – Land Use Compatibility Table in PDWSAs to provide guidance
on the type of land uses appropriate within P1, P2 and P3 areas (DoE 2004).
Priority 1 (P1) source protection areas are defined to ensure there is no
degradation of the water source. P1 areas are declared over land where the
provision of high quality public drinking water is the prime beneficial land use.
These areas typically include land under public ownership, but may in a limited
number of cases include private land.
Priority 2 (P2) areas are managed in accordance with the principle of 'risk
minimisation. Only limited conditional development is supported. P2 areas are
declared over land where low-intensity development (such as rural) already exists.
Protection of public water supply sources is a high priority relative to other land
use values in these areas.
Priority 3 (P3) areas are defined where it is practical to manage the risk of
pollution to the water source, and where water supply sources need to co-exist
with other generally existing land uses such as residential, commercial and light
industrial developments. Protection of P3 areas is achieved through management
guidelines rather than restrictions on land use.
Recreational activities
In recent years, there has been an increase in pressure to pursue recreational
interests in PDWSAs. As populations grow there is a similar increase in the
demand for leisure opportunities. There is also growing pressure to convert some
irrigation dams to public drinking water sources. Both of these factors increase the
potential for conflict between recreational interests and public drinking water
source protection.
The recent Logue Brook Dam case demonstrates how these values can come into
conflict. Harvey Water proposes to trade 17.1 GL of water to the Water
Corporation for the Integrated Water Supply Scheme, of which 5 GL would come
from Logue Brook . The proposed use of Logue Brook Dam is as a 'drinking water'
supply. The problem is that recreation is not compatible in a drinking water supply
area and Logue Brook Dam is currently used for both irrigation and recreation. If
approved, the use of Logue Brook Dam could change from 'irrigation and
20South West Water Resources – A Review of Future Trends
recreation' to 'irrigation and drinking water'. The Minister for Water Resources has
yet to make a decision about the future of Logue Brook Dam at this time.
To protect drinking water sources from contamination, the Water and Rivers
Commission published the Policy and Guidelines for Recreation within Public
Drinking Water Source Areas on Crown Land (State-wide Policy No. 13) (WRC
2003). The primary aim of the policy is to protect the ‘drinking water’ value of
PDWSAs on Crown land in the interest of public health. This is to be achieved by
protecting drinking water sources from contamination that may be caused by
inappropriate recreational activities.
Recreation, as defined under the policy, refers to a wide range of leisure, pastime
or entertainment pursuits, including bushwalking, orienteering, swimming, boating,
fishing, camping, horse-riding and four-wheel driving.
Under the policy, water-based recreational activities are not permitted on drinking
water supply reservoirs and feeder rivers and streams unless specific permission
has been obtained from the WRC. The WRC may permit certain recreational
activities in circumstances where:
• Assessment indicates that water quality will not be compromised;
• The quality of the water is assured by other existing protection measures;
• Historical and traditional uses have existed; and/or
• Conditional approval has been recommended in a water source protection
plan.
Tables 1 and 2 display the compatibility of various water and land based
recreational activities within proclaimed or proposed P1 PDWSAs.
21South West Water Resources – A Review of Future Trends
Table 1. Compatibility of water-based recreational activities
Activity Proclaimed P1 Proposed P1
PDWSAs PDWSAs
Boating (non-motorised)
Canoeing Incompatible* Conditional
Model boating Incompatible* Conditional
Rowing/sailing Incompatible* Conditional
Windsurfing Incompatible* Conditional
Boating (motorised)
Jet skiing Incompatible Incompatible
Power boating (fuel powered) Incompatible Incompatible
Power boating (low powered electric) Incompatible Conditional
Skiing Incompatible Incompatible
Public and animal access
Horse riding Incompatible Conditional
Other animal trails Incompatible Conditional
Training/exercising domestic animals Incompatible Conditional
Fishing
Fishing Incompatible* Conditional
Marronning Incompatible* Conditional
Introduction of fish/aquatic species Incompatible* Conditional
Swimming
Swimming/wading Incompatible Conditional
Scuba diving Incompatible Conditional
* May be allowed if activity has been approved historically and the risk to the resource is accepted
following community consultation. It is unlikely that recreational activities will be allowed in
undeveloped catchments.
22South West Water Resources – A Review of Future Trends
Table 2. Compatibility of land-based recreational activities
Activity Proclaimed Proposed
P1 PDWSAs P1
PDWSAs
Vehicular access
Coach tours/nature-based tourism Conditional Conditional
Off-road driving Incompatible Incompatible
Pleasure/scenic driving Conditional Conditional
Public access
Abseiling/rock climbing Conditional Conditional
Abseiling, search and rescue training Conditional Conditional
Amateur astronomy Conditional Conditional
Barbecue/picnicking Conditional Conditional
Bird watching Conditional Conditional
Bush skills and navigation exercises Conditional Conditional
Bushwalking/hiking Conditional Conditional
Horse riding (except on public roads and designated Incompatible Conditional
trails)
Military training Conditional Conditional
Mountain bike riding Conditional Conditional
Orienteering Conditional Conditional
Photography/painting Conditional Conditional
Research/environment study Conditional Conditional
Riding of animals (except on public roads or designated Incompatible Conditional
trails)
Rogaining Conditional Conditional
Sightseeing Conditional Conditional
Training/exercising domestic animals (including dogs) Incompatible Conditional
Camping/overnight stay
Backpacking with overnight stay Incompatible# Conditional#
Camping/caravanning Incompatible Conditional
Timber cutting or gathering of wood or other
materials
Firewood gathering Conditional Conditional
Native flora removal Conditional^ Conditional^
Prospecting Conditional Conditional
Soil/rock/gravel removal Conditional Conditional
Hunting
Recreation hunting/shooting Incompatible Incompatible
Introduction of game animals Incompatible Incompatible
Rallying and racing
Established, approved motorsport (recreational, Conditional* Conditional*
competition and events such as Rally Australia)
New motorsport (recreational, competition/events) Incompatible Incompatible
^ Commercial wildflower picking is permitted under CALM licence.
* Conditional upon the development and implementation of an environmental management plan.
# Except in designated areas
23South West Water Resources – A Review of Future Trends
Drinking Water Source Protection Plans (DWSPP) are a key component of the
‘catchment-to-consumer’ protection strategy for Western Australia’s drinking water
supplies. A DWSPP identifies existing and potential threats to a drinking water
source and provides risk management strategies and programs for the ongoing
management/protection of that source. The planning process may result in some
land use/activity restriction in order to achieve a safe, good quality drinking water
supply.
According to the State Water Strategy for Western Australia (Department of
Premier and Cabinet (2003), water source protection plans should be completed
for all public drinking water supply catchments throughout the State. Currently,
only a small proportion of public drinking water supply areas in the south west
have source protection plans in place (DPC 2006).
24South West Water Resources – A Review of Future Trends
Future water demand
Increasing demand for access to water supplies is likely as the south west
continues to grow both economically and in population. This section outlines some
of the projections for growth in different sectors.
Population growth
Projections
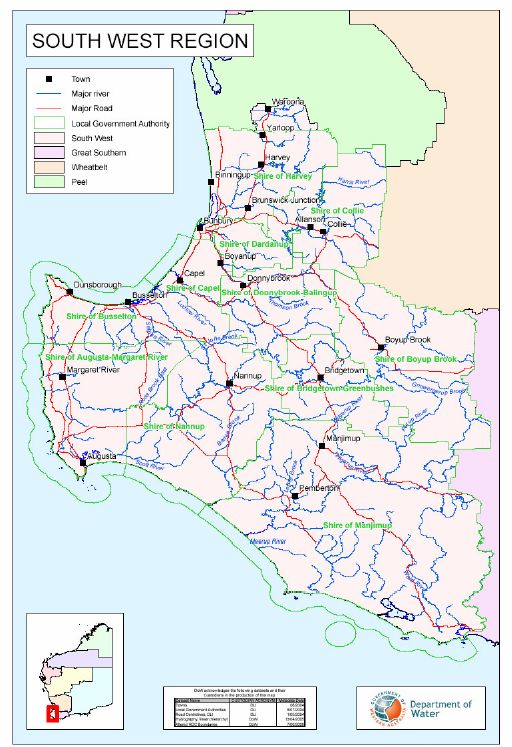
The area covered by the South West Water Plan is shown in Figure 5.
Figure 5. Boundary of the South West Water Plan
Population projections to 2021 are shown in Table 3 for each of the 12 local
government areas in the South West Water Plan area. Future population growth is
centred on the Greater Bunbury area, the Bunbury to Busselton coastal area and
the Shire of Augusta-Margaret River.
25South West Water Resources – A Review of Future Trends
Table 3. Projected population growth in local government areas (WAPC
2005)
Local Government 2006 2011 2016 2021
Bunbury 31,700 32,500 33,400 34,000
Capel 10,700 13,300 15,200 16,200
Collie 9,000 9,000 8,900 8,700
Dardanup 10,300 12,700 14,900 17,000
Donnybrook-Balingup 4,800 5,000 5,300 5,500
Harvey 19,100 20,900 22,600 24,000
Augusta-Margaret River 11,900 13,400 15,000 16,600
Busselton 26,800 30,100 33,300 36,500
Boyup Brook 1,600 1,500 1,500 1,400
Bridgetown-Greenbushes 4,100 4,100 4,100 4,000
Manjimup 10,000 10,100 10,000 9,900
Nannup 1,200 1,200 1,200 1,200
Total South West 141,200 153,800 165,400 175,000
The Western Australian Planning Commission (WAPC) (2005) has assigned each
of the State’s local government areas to one of five growth categories. These
categories are defined as follows:
• High growth local governments will exhibit higher than average growth for
the period of the projections. The growth will slow down during this time.
• Typical growth local governments will exhibit growth similar to that
experienced by Western Australia over the last 20 to 30 years. This modest
growth will continue even when the overall growth is beginning to decline.
• Slight growth local governments exhibit small amounts of growth.
Changes in population happen but are not immediately evident in day-to-
day observation.
• In stable population local governments, migration in balances out those
who leave. In some country areas this will be a balancing between young
people leaving the area with new families moving into the area.
• Local governments in the decline then stabilising category are those
where there are insufficient new migrants to replace migrants who have
moved out.
Within the South West Water Plan area, only the Shire of Capel falls into the high
growth category for the period 2004-21 (Figure 6). Typical or modest growth is
predicted for the shires of Dardanup, Busselton and Augusta-Margaret River.
The shires of Harvey and Donnybrook-Balingup and the City of Bunbury are
expected to display only slight population growth. Although the City of Bunbury is
predicted to experience only slight population growth, much of the growth in the
Capel and Dardanup shires will be the result of growth in the Greater Bunbury
area.
26South West Water Resources – A Review of Future Trends
The populations of the shires of Collie, Bridgetown-Greenbushes, Nannup and
Manjimup are predicted to remain stable. Some decline is expected in the Shire of
Boyup Brook.
Figure 6. Type of population change (2004-2021) (WAPC 2005)
1 Augusta-Margaret River 7 Collie
2 Boyup Brook 8 Dardanup
3 Bridgetown-Greenbushes 9 Donnybrook-Balingup
4 Bunbury 10 Harvey
5 Busselton 11 Manjimup
6 Capel 12 Nannup
In its analysis of population growth, the WAPC noted that many local shires in the
south west have a more optimistic forecast of population growth in their own
jurisdictions (WAPC 2005).
The regional planning schemes for the study area identify areas of potential
residential growth. The most significant potential lies in the Greater Bunbury area.
The Greater Bunbury Region Scheme identifies several townsites with urban
deferred land (WAPC 2000). These are areas where land is suitable for future
urban growth but requires planning, servicing and environment issues to be
addressed before urban growth can proceed. The areas with the potential for
growth based on urban-deferred zoning are: Capel townsite, Boyanup, Burekup,
Australind and Dalyellup Beach.
Town supplies and urban water uses
Three licensed water service providers supply drinking water to towns in the study
area. These are Busselton Water, Aqwest (Bunbury), and Water Corporation
(WC). Aqwest and Busselton Water are licensed to supply potable water for
domestic consumption and town needs, such as light industry and commerce.
Both draw groundwater from the Yarragadee Formation for town water supplies.
Aqwest has a licensed allocation of 11.2 GL/annum plus a reserve allocation of
3.6 GL/annum to meet the demand from future population growth (Table 4).
27South West Water Resources – A Review of Future Trends
Currently Aqwest is using 6.4 GL/annum or 43 per cent of its 14.8 GL/annum total
allocation (Economics Consulting Services 2003).
Busselton Water uses 3.6 GL/annum or 60 per cent of its 6.0 GL/annum of current
licensed allocation. However, the Board also has a large reserve allocation of 12
GL/annum to meet future demand (ECS 2003). Thus it is currently using only 30
per cent of its total allocation.
Table 4. Water Allocations and Future Reserves
Water Scheme Current Draft Reserve Total Current
Licensed Allocations Allocations Allocations Use
Allocations (GL/a) (GL/a) (GL/a) (GL/a)
(GL/a)
Aqwest 9.2 2.0 3.6 14.8 6.4
Busselton Water 6.0 0 12.0 18.0 3.6
Capel 0.4 0 0.07 0.47 0.34
Dalyellup 1.0 0 0.9 1.9 0.87
Dardanup 0.075 0 0.025 0.1 0.05
Eaton/Australind 4.76 0 2 2.76 4.4
Dunsborough 1.450 0 0 1.450 1.30
Water Corporation supplies drinking water to 42 towns in the study area. These
include the major towns of Augusta, Boyanup, Capel, Cowaramup, Dalyellup,
Dardanup, Donnybrook, Dunsborough (including Yallingup), Australind/Eaton,
Nannup, Pemberton and Manjimup.
The Corporation draws water from the Harris Dam in the Collie catchment to
supply water to the Great Southern Towns Water Scheme. This scheme supplies
about 11 GL/yr to Collie, towns located in the Upper and Lower Great Southern
and nearby farmland. The demand for town supply has stabilised in recent years
and is not expected to grow significantly (CSIRO 2005).
Future demand
Based on the work undertaken for the South West Yarragadee proposal (ECS
2003), demand in town water supply in the Preston/Bunbury subdivision is
forecast to rise from a 2000 figure of 25 GL/a to 46 GL/a by 2021 (Table 5). This
increase will be driven by population growth in the Greater Bunbury area.
Table 5. Projected demand for town supply (GL/a)
Location 2000 2006-08 2010-11 2015-16 2020-21
Preston/Bunbury 25.5 30.3 34.3 39.2 46.3
Vasse 7.0 8.5 10.1 12.0 14.3
Blackwood 2.7 2.7 2.7 3.3 3.3
Total 35.2 41.5 47.1 54.5 63.9
The tourism sector and population growth will drive demand for town water supply
in the Vasse region (ie Margaret River and Busselton). Consumption is expected
28South West Water Resources – A Review of Future Trends
to double to 14.3 GL/annum in the period 2000-21. In the short to medium-term,
Margaret River Town Water Supply is expected to be expanded to serve other
centres in the Cape to Cape region. The supply is currently based on Ten Mile
Brook, a tributary of Margaret River, and is designed to be augmented by a pump-
back facility from Margaret River. This is likely to meet demand for at least five to
ten years (CSIRO 2005). The potential for increased groundwater abstraction from
the Leederville aquifer at Cowaramup is also being investigated by the
Department
The Blackwood statistical area is forecast to grow at a slower rate, with urban
water use projected to increase by 22 per cent to 3.3 GL/a by 2021. Total urban
water use in the South West Water Plan area is projected to rise by 28.7 GL
(82%) in the same period.
The South West Development Commission (SWDC) has also projected the
demand for urban water in the south west. The SWDC believes an additional 45
GL will be needed by 2025. Its calculations are based on the following
assumptions: Aqwest and Busselton Water requiring an additional 17.6 GL to
meet annual residential growth of 2.9 per cent; an additional 9.6 GL for other
urban use; and WC growth projections of 4.7 per cent over 30 years (14 GL).
Greater Perth Area
In addition to the demand for surface and groundwater resources generated within
the South West Water Plan area, demand will also come from population growth
in the Greater Perth area (Metropolitan Perth, Mandurah and Murray). This area
had a population of 1.46 million in 2001. It is expected to grow to 1.99 million by
2021 and 2.22 million by 2031 (WAPC, 2004). In other words, the Greater Perth
area is expected to grow by the equivalent of an Albany or half a Bunbury each
year (CSIRO 2005).
Agriculture
Water demand by statistical subdivision
The Preston/Bunbury area has a significant dairy industry around Harvey-
Waroona and horticulture in the Donnybrook area. Dairy processing plants
operate at Harvey and Brunswick. Water use is dominated by irrigated agriculture,
mainly for dairy pastures. The National Land Water Audit (2001) projected a
reduction in water use in the period 2000-20 of around nine per cent in the
Preston statistical subdivision (Table 6). This is based on an expectation of dairy
industry rationalisation, water trading out of dairying to higher value enterprises,
and slower population growth (ECS 2003).
29South West Water Resources – A Review of Future Trends
Table 6. Project Water Use in Agriculture (GL/a)
Region 2000 2006-08 2010-11 2015-16 2020-21
Preston/Bunbury 136.0 132.7 129.3 126.7 123.3
Vasse 29.2 36.5 42.0 48.4 56.1
Blackwood 26.0 32.0 35.5 40.0 45.5
Total 191.2 201.2 206.8 215.1 224.9
The Vasse statistical subdivision has a large agricultural sector focused on
intensive horticulture and wine grape production stretching from Busselton to
south of Margaret River. In 2000, grapevines accounted for just under 40 per cent
of the irrigated area with both vegetables and other horticultural enterprises each
making up 26 per cent. Since 2000, the area under grapevines has expanded
dramatically (ECS 2003). In 2003, demand for water was predicted to increase in
the Vasse subdivision by 92 per cent over a 20-year period to 2021 (Table 4).
The National Land Water Audit identified substantial potential for increased
irrigation in the Blackwood statistical subdivision. This is predominantly in the
Manjimup area, with potential at Pemberton (ECS 2003). Vegetable production at
Manjimup has been rising for some years with a growing export trade in
cauliflowers and carrots. Wine production has been increasing in the Warren area.
In the Blackwood subdivision, water demand for agriculture is forecast to increase
by 75 per cent in the period 2000-21 (Table 6).
Demand by agriculture sector
The following sections examine the growth potential and future water demand for
key agricultural sectors including dairy, viticulture and horticulture. Growth in some
forms of agriculture may represent a change in type of agricultural production on a
property, although this is not accounted for in the demand estimate. Thus the
actual water demand may be somewhat less than that predicted below.
Dairy
Water use by the dairy sector is projected to increase by 30 GL/a from current
levels (Table 7) (Primary Consulting Services 2003). The study assumed irrigation
of an additional 4,590 hectares of land for pasture.
Table 7. Dairy Industry Expansion
Area Milk Milk Long- Milk Irrigation Water
2000 Change Term Irrigation Area
M litres M litres M litres M litres Hectares GL/a
Armadale-Coolup 32 -12 20 0 0 0
Waroona-Bunbury 129 +60 189 70 0 SWIA
Boyanup-Busselton 153 +42 195 47 1,470 13
Capes 67 +20 87 20 625 4
Scott River 3 +80 83 80 2,500 13
Albany-Walpole 28 -2 26 0 0 0
Total 412 188 600 217 4,590 30
30You can also read


