Customer satisfaction research in Pyhä Ski Resort - Tomi Turunen - Bachelor's Thesis Degree Programme in Hospitality, Tourism & Experience ...
←
→
Page content transcription
If your browser does not render page correctly, please read the page content below

Customer satisfaction research in Pyhä Ski Resort

Tomi Turunen

                                         Bachelor’s Thesis
                                         Degree Programme in
                                         Hospitality, Tourism &
                                         Experience
                                         Management
                                         2018
Abstract

                                          15 November 2018

Author(s)
Tomi Turunen
Degree programme
Hospitality, Tourism & Experience Management
Report/thesis title                                                        Number of pages
Customer satisfaction research in Pyhä Ski Resort                          and appendix pages
                                                                           42 + 18
This Bachelor’s Thesis is a Customer satisfaction research in Pyhä Ski Resort, conducted
between December 2017 and November 2018 and commissioned by Pyhätunturi Ltd. The
objective of this thesis is to identify, how visitors experience the services offered by Pyhä Ski
Resort. The research question of this thesis is, how satisfied are visitors with their visit and
the services of Pyhä Ski Resort that they’ve used. A sub-target is to recognize with the use of
service quality gaps, which services work well, and which ones have areas of improvement.
Theoretical basis for this thesis consists of information on the commissioning company, cus-
tomer satisfaction & service quality, service quality gaps and service quality model.

With a quantitative research with 481 participants, statistics of customer satisfaction in Pyhä
Ski Resort were formed. The results of the survey showed, that most visitors in Pyhä Ski Re-
sort are satisfied with their visit, with an overall average of 4.33 out of 5 on structured ques-
tions and 99% of the respondents saying they would recommend visiting Pyhä Ski Resort.
Relying on theoretical framework, recommendations for future development were given to
increase customer satisfaction in the future. The recommendations included further training of
staff, investing in new lifts, continuing the improvement of slopes, signs, guidance and snow
parks, focusing on environmental issues, keeping the visitors well informed, improving ser-
vice in rental shops and in the restaurant, establishing new products and developing the
whole Pyhätunturi area in order to make it more efficient for the visitors.

The survey shows, that the biggest area of improvement in Pyhä Ski Resort is, that the visi-
tors don’t feel that they are being recommended additional services enough in a way that it
would be beneficial for them. Recommendations for future research include improving the
questionnaires, adding in-depth interviews and continuing an on-going customer satisfaction
research through oncoming years.
Keywords
Customer satisfaction, service quality, ski resort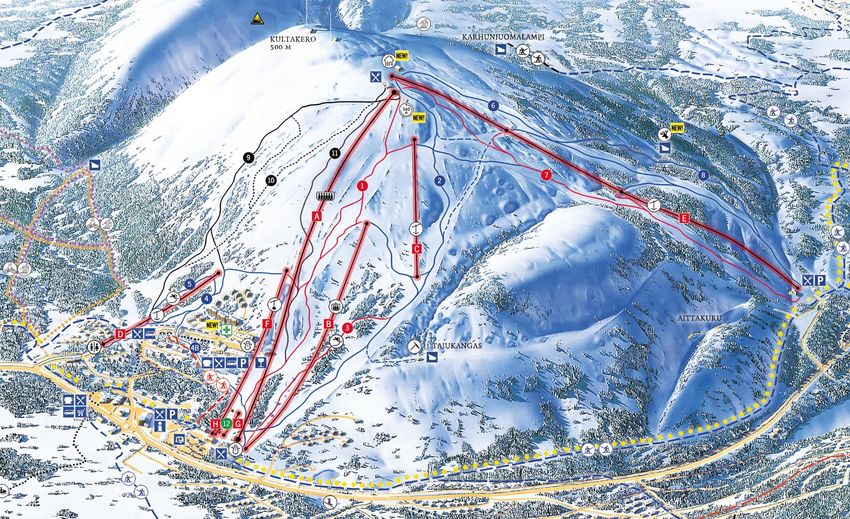
Table of contents

1      Introduction ..................................................................................................................1

2      Measuring customer satisfaction in Pyhä Ski Resort ..................................................3

    2.1 Commissioning party – Pyhätunturi Ltd ..................................................................3

    2.2 Pyhä Ski Resort ......................................................................................................4

    2.3 Role of Pyhä Ski Resort in Pyhätunturi area ...........................................................6

    2.4 Customer satisfaction ..............................................................................................7

    2.5 Defining quality ........................................................................................................7

    2.6 Why measuring customer satisfaction and quality is important ..............................9

    2.7 Service quality gaps and Service Quality Model ...................................................10

    2.8 Determinants of service quality .............................................................................12

    2.9 Five-step model to implementing service quality program within a company .......15

3      Research ...................................................................................................................16

    3.1 Research methods ................................................................................................16

    3.2 Data gathering process .........................................................................................16

    3.3 Reliability of the research and limitations ..............................................................17

    3.4 Questionnaires used .............................................................................................17

    3.5 Demographics of attendants .................................................................................18

    3.6 Results of the structured questions .......................................................................18

    3.7 Results based on the language the survey was taken ..........................................23

    3.8 Open questions .....................................................................................................27

4      Conclusions and recommendations ..........................................................................32

5      Recommendations for future research ......................................................................40

References .........................................................................................................................41

Appendices ........................................................................................................................43
1 Introduction
The topic of this thesis is a customer research, measuring customer satisfaction in Pyhä
Ski Resort during the winter season of 2017-2018. The research has been conducted
through a quantitative survey answered by the visitors.
The main focus of the thesis lies in the ski slope operations ran by Pyhä Ski Resort, but
additional focus is also on the supporting services in the area, which are either managed
by– or operate in a close relationship with Pyhätunturi Oy.
The objective of this thesis is to identify through research how visitors experience the ser-
vices offered by Pyhä Ski Resort. The services are ski resort operations including the
slope area, ski lifts, rental shops and ski school. In addition to those, restaurant operating
in Hotel Pyhätunturi, Colorado Bar&Grill is also a part of the research.
Figure 1: The research environment
Based on the findings of the research, the goal is then to improve the customer satisfac-
tion rates for oncoming years by recommending solutions and ideas for the management
to implement. The thesis is based on a quantitative research conducted by gathering 481
filled customer feedback forms from visitors during winter season 2017-2018 in the ski
resort.
1The research question of this thesis is, how satisfied are visitors with their visit and the
services of Pyhä Ski Resort that they’ve used? A sub-target is to recognize with the use of
service quality gaps, which services work well, and which ones have areas of improve-
ment.
The research and the thesis have been conducted between November 2017 and October
2018 in Pyhätunturi and Oulu, Finland.
Gathering data based on customer reviews is really important for a company when con-
sidering future development. In order to be able to improve service quality and customer
satisfaction, the management of the company has to have a clear idea of where the com-
pany is now, how satisfied are the customers and how they perceive high service quality.
The data presented along with the recommendations will be offered as a guideline when it
comes to developing the ski resorts operations in a way that they match the expectations
of the visitors even better in the future. Satisfied visitors that feel that they have received
high quality service are more likely to return to the destination, to spend more money and
to recommend products and services for other people. This results for example a greater
return of investment, lower costs in marketing and increased profitability. (Gerson &
Machosky 1993, 5)
22 Measuring customer satisfaction in Pyhä Ski Resort
In this section I will introduce the key concepts on measuring customer satisfaction in Py-
hä Ski Resort. The theoretical framework will form the basis for supporting the research,
findings and recommendations of the thesis.
The theoretical framework of this thesis consists of background information of the com-
missioning party Pyhätunturi Ltd, definitions of customer satisfaction, service quality and
service quality gaps, presentation of a service quality model and implementation of ser-
vice quality program within a company.
2.1 Commissioning party – Pyhätunturi Ltd
The commissioning party for this thesis is Pyhätunturi Ltd. Pyhätunturi Ltd is a subsidiary
company of Rukakeskus Ltd. Together these companies form a ski resort corporation
called Rukakeskus Corporation. Rukakeskus Ltd and Pyhätunturi Ltd have been in charge
of management of the ski resort operations in Ruka since 1973 and in Pyhätunturi since
1987. The CEO of Rukakeskus Corporation is late founder Juhani Aho’s son, Ville Aho.
The ski resort corporation is a part of Aho Group. (Rukakeskus Ltd 2018.)
Aho Group is a family owned business, which in addition to ski resort business operates in
the field of private medical- and laboratory services. The CEO of Aho Group is Tuomo
Purola. The management and administration of these companies is located in Keilaniemi,
Espoo. (Rukakeskus Ltd 2018.)
Rukakeskus Corporation also includes TuottoOmistus Ltd, which is another subsidiary of
Rukakeskus Ltd. It is in charge of renting and maintenance of private-owned cottages and
apartments. The group corporation includes PyhäBooking Ltd, which operates as a central
booking agency of the holiday cottages in Pyhätunturi area and Hotel Pyhätunturi, which
is in charge of the hotel business. The restaurant business functions in both Ruka and
Pyhä were transferred to Tunturimax Ltd in October 2014. Tunturimax Ltd is owned by
Rukakeskus Ltd and Restamax, with Restamax owning 65% and Rukakeskus 35% of the
company. (Pyhätunturi Ltd, 2018.)
3Figure 2. Structure of Aho Group
Rukakeskus Corporation is one of the leading businesses in the field of travel industry
businesses in Finland. It is the market leader within the ski resort business sector with
20% of total ski pass sales. These companies operate all-year-round with the main focus
in the slopes. Rukakeskus Group employs around 200 persons with a turnover of approx-
imately 26 million euros. (Rukakeskus Ltd 2018.)
Rukakeskus Ltd and Pyhätunturi Ltd are family-owned businesses, owned by the family of
Espoo-based physician Juhani Aho. The operations have been running by the second
generation since 1999, and the company plans on remaining as a family-owned business
also in the future. (Pyhätunturi Ltd, 2018.)
2.2 Pyhä Ski Resort
Pyhätunturi Ltd is in charge of Pyhä Ski Resort’s ski slopes and ancillary services. In addi-
tion to ski resort operations it also is responsible for accommodation services, rental ser-
vices and bar- and restaurant services with co-operation of supporting companies. (Py-
hätunturi Ltd, 2018.)
Figure 3. Customer journey through different services included in the research
4Pyhä Ski Resort is located in Pelkosenniemi in eastern Lapland in Finland, right at the
border of Pelkosenniemi and Kemijärvi. The ski resort is located right next to Pyhä-Luosto
National Park. It is approximately 133 kilometres, a bit under two-hour drive from the city
of Rovaniemi. Easiest ways to arrive to Pyhätunturi are by taking a plane to Rovaniemi or
a train to Rovaniemi or Kemijärvi. Both train stations and the airport have good ski bus
services to Pyhätunturi. Whether arriving by car or public transportation, Pyhätunturi is
easy to reach despite its remote location. (Pyhätunturi Ltd, 2018.)
Pyhä Ski Resort differs from many other resorts in Finnish Lapland. Although in Py-
hätunturi there is also a wide range of activities available just like in any other ski resort,
the main emphasis of Pyhä Ski Resort compared to other resorts is especially is in provid-
ing excellent skiing conditions not just in the slopes but also outside the marked slopes in
the off-piste area. There are seven different peaks within a close radius, providing excel-
lent conditions for free skiing on a national level. (Pyhätunturi Ltd, 2018.)
Most frequent visitors in Pyhätunturi are active skiers and snowboarders, families, training
groups, sports enthusiasts, people who’d rather focus on activities during daytime than
partying in the night and those who are in the search of untouched snow and natural ter-
rain. The characteristics of this customer segment influences the nature of the ski resort.
Pyhä Ski Resort is strongly focused in taking care of the environmental responsibility and
have been operating with an Environmental Program since 2008. (Pyhätunturi Ltd, 2018.)
Other important themes are sharing experiences and spending time with friends and fami-
ly, stepping into an adventure in a safe way (Pyhätunturi Ltd 2018.) and experiencing the
Lappish wilderness and the feeling of peace through serenity and open space. (Py-
hätunturi Ltd, 2018.)
Pyhä Ski Resort’s slope area is situated right next to Pyhä-Luosto national park, which
gives the area it’s spectacular location and it’s typical East-Lappish -scenery.
In Pyhä Ski Resort there are 15 slopes and 9 different lifts, ranging from beginner-friendly
magic-carpet lifts to PyhäExpress detachable 6-seat chair lift that takes visitors from base
of the front slope to the top. Peak of Pyhä Ski Resort reaches 500 meters from the sea
level, and the biggest elevation is 280 meters.
Longest slope is 1,8 kilometres long, and the complete lift capacity is 11 200 skiers per
hour. Due to loosely situated groomed slopes, Pyhä Ski Resort has plenty of untouched
5terrain, which makes Pyhä Ski Resort an exceptional place for free skiers. (Pyhätunturi
Ltd, 2018.)
Figure 4. Map presenting Pyhä Ski Resort’s slopes, lifts, services, attractions and marked
routes. (HS-visual Art Ky, 2018.)
2.3 Role of Pyhä Ski Resort in Pyhätunturi area
In Pyhätunturi, there is a wide variety of smaller companies that have based their opera-
tions on serving the visitors that arrive to the area. Although these companies are individ-
ual operators, they all have a common goal which is attracting visitors and having them
arrive to the destination. That is why co-operation between the companies is important in
order to create a well-working business environment, where visitors feel that there are
multiple activities available and that they receive high quality service and experiences that
provide them value for their money.
Pyhä Ski Resort acts as the biggest operator in Pyhätunturi area and that is why it’s im-
portant for the ski resort to also keep visitors well-informed on what is available for them in
the area. Keeping visitors informed on what types of services are available both increases
the attraction of the area generating more inbound tourists for the ski resort but also pro-
vides customers for smaller companies. This means, that within the ski resort it’s im-
portant for the staff to know about other services in the area, but also important for smaller
companies to know enough about each other, so they can effortlessly recommend other
6services in the area. This is mutually beneficial for all parties involved, since visitors tend
to consume multiple different services during their stay.
2.4 Customer satisfaction
According to Richard F. Gerson and Brenda Machosky (1993, 5), customer satisfaction is
the number one thing that counts in business. If the clients aren’t satisfied with the com-
pany, they will quit doing business with said company and they will proceed to take their
business elsewhere. Giving excellent customer service or offering quality products doesn’t
matter, unless the customer does not end up feeling satisfied.
But how can customer satisfaction be defined? Gerson defines customer satisfaction as
the customer’s perception whether their expectations have been either met or exceeded
(Gerson & al. 1993, 5). The customers have certain expectations when they purchase a
product or a service and not being able to reach those expectations ends up being bad for
the customer satisfaction; people demand value for their money.
Keeping the customers satisfied is essential for businesses, simply put a satisfied cus-
tomer is more likely to do business with the company more often. As Gerson puts it, the
link between sales, service, satisfaction and profits is direct. (Gerson & al. 1993, 5.) As
customer’s satisfaction increases, the more they will spend, resulting in increased sales
and thus increased profits.
“Customer satisfaction: When a product meets or exceeds a customer’s expectations, the
customer is usually satisfied” (Gerson & al. 1993, 7).
2.5 Defining quality
Unlike satisfaction, giving simple definition for quality is a bit more difficult. According to
Gerson & al. (1993, 7), quality is strongly dependant on a significant company and its cus-
tomers, meaning that quality for one company is exactly how its customers perceive it.
This means, that in order to understand quality and customer satisfaction within a compa-
ny, measurement and research need to be implemented in order to find out how that spe-
cific company’s customers perceive quality and how they define satisfaction.
“Quality: Whatever the customer says it is” (Gerson & al. 1993, 7).
7Inability to provide good quality is not only unpleasant for the customers but it is also cost-
ly for businesses in many ways and providing poor quality for customers will end up in not
only losing current customers, but to making attracting future customers more difficult. In
their book Measuring Customer Satisfaction Gerson and Machosky (1993, 10) give four
factors that help to identify the cost of poor quality:
1. Performance cost: the cost of doing everything right the first time, meaning that the
cost comes from creating services or products well from the beginning. This may
be more expensive at first, but it will result in that they don’t need to be redone.
2. Rework or failure cost: the cost of having to do something again or repairing the
existing product in a way that the result is actually good quality. Coming back to
processes already done and repairing them is costly, creating directly new costs
and also indirect costs due to having to compensate customers due to bad quality.
3. Detection costs: the costs of searching for the problems in quality in order to then
fix them.
4. Prevention costs: somewhat connected to the detection costs, prevention costs
mean costs that come from having to identify factors causing poor quality before a
quality inspection. A well-trained and dedicated staff that is able to also manage
their own work is in the core of decreasing the prevention costs.
According to Gerson & al. (1993, 10) providing good quality does not cost a company, but
it pays back even though providing it can be more expensive. The cost of providing good
quality can be narrowed down to five different areas:
1. Price: Providing higher quality products or services allows the company to charge
more.
2. Profitability: when a product or a service is served in a way that the customers
deem good quality leads to saving of costs and in-creased sales, thus increasing
the profit the company makes, especially when it’s combined with higher prices.
3. Market share: providing higher quality tends to lead in a bigger market share. Peo-
ple are looking for value for their money, and if the value is high and matches the
price, more clients will ensue.
84. Cost: as quality is high, need for recreating same things over and over again de-
creases, thus the cost of it is also smaller. Also providing bad quality that doesn’t
meet the expectations of customers often results in having to compensate in order
to maintain those customers.
5. Marketing and advertising: good quality helps to maintain existing customer base,
which decreases the costs of gaining new customers. Satisfied customers are also
more likely to recommend other people the products and services they’re pleased
with, which decreases the need to attract customers through advertising.
2.6 Why measuring customer satisfaction and quality is important
There is a clear connection between quality, customer service and satisfaction. According
to Gerson, it is even more clear when it’s understood that quality and service are whatever
the customer says they are, and satisfaction is their view on how well company meets
those customers’ expectations. When the company provides the customer good quality
and service, satisfaction will ensue. (Gerson & al. 1993, 12.)
The measurement of customer satisfaction among other customer-related experiences is
important, because it can give the company important information. When a company can
see a measurable number to connect with their behaviour, it is easy to see how that be-
haviour then affects the performance of said company. As Gerson & al. put it in a straight-
forward way, asking the customers to give ratings regarding levels of quality, service and
satisfaction practically guarantees that the company will then develop their actions in
those particular areas. As meeting of customer’s expectations is in the core of customer
satisfaction, measuring is essential in order to be able to improve in the critical points.
(Gerson & al. 1993, 6.)
Customer satisfaction measurement helps to learn about the perceptions of the custom-
ers: what they wish to receive from a company, why they chose specifically that company
over a competitor, how they perceive service quality performance and what needs to be
done in order to maintain them as customers. (Gerson & al. 1993, 24.) Measuring satis-
faction allows the company to identify the specific needs the customers are looking to fulfil
and what they look from service and sales encounters. It also allows to identify and close
gaps in service quality between the service provider and the service user. (Gerson & al.
1993, 26.)
9Measuring satisfaction also gives a clear view for the service provider on where the com-
pany is now, what the goal is and how it can be reached when it comes to improving ser-
vice quality and customer satisfaction (Gerson & al. 1993, 29).
As a result of a customer research, the company then knows where it stands and thus it is
easier to start planning future goals and to start achieving those goals, based on the re-
sults of the measurement. Since the steps towards reaching customer satisfaction were
formed during researching the customers, no matter whether the expectations were met,
exceeded or failed to meet it gives good pointers on how to develop in the future. In order
to understand what needs to be done in the future, information on where the company is
right now is crucial. Constantly doing customer research allows the company to continue
evolving in order to maintain long-term customer relationships. (Gerson & al. 1993, 30.)
Gerson and Machosky (1993,31) explain the benefits clearly with five main pointers:
1. When customer satisfaction is measured, it gives employees sensations of
achievement, which will then turn into providing better customer service.
2. Measuring customer satisfaction gives the employees performance standards and
a sense of realizing where they are now and where they could be when realistic
expectations are met.
3. It offers immediate feedback.
4. It allows the customers to tell directly what kind of actions need to take place in or-
der to improve quality and customer satisfaction.
5. It enhances employee motivation and productivity.
2.7 Service quality gaps and Service Quality Model
According to Lewis & Booms (1983, in Parasuraman, Zeithaml & Berry 1985, 42), service
quality measures how well the level of service matches the expectations of a customer.
Being able to provide quality service requires conforming to the expectations of the cus-
tomers.
According to various researches conducted by e.g. Anderson & Zeithaml in 1984 and Phil-
lips, Chang & Buzzel in 1983 (in Parasuraman & al. 1985, 41) putting emphasis on quality
creates larger market share and thus ends up creating greater return of investment. Good
quality also lowers manufacturing costs and improves productivity. Measuring quality is
10important in order to be able to perfect it. But since services are more like performances
instead of tangible goods, measuring their quality is much more complex.
Parasuraman, Zeithaml & Berry (1985, 44) presented a model in their article published in
1985 in the Journal of Marketing which helps service providers to understand how cus-
tomers perceive their services and service quality and what affects it.
According to their research (Parasuraman & al. 1985, 44.), there are consistent patterns
which were used in the development of the model of service quality. By doing executive
interviews and focus group interviews they recognized gaps in the perception of service
quality between providers and consumers. These gaps in the understanding of service
quality can exist between the service provider and the customer but also within the com-
pany itself, and they can become big issues for companies when they try to provide high
quality services for their customers.
The Service Quality Model (Parasuraman & al. 1985, 44.) consists of five gaps:
Gap 1: The gap between consumer expectations and management perception of quality.
This gap means the difference in between what consumers expect and how management
perceives consumers’ expectations. This gap will affect the consumers’ evaluation of the
quality of service.
Gap 2: The gap between management perception and service quality specification. This
gap in between of perception of management and the service quality specifications of the
company affect how the customers experience service quality.
Gap 3: The gap between service quality specifications and service delivery. This gap be-
tween the company’s service quality specifications and how the service is actually deliv-
ered to customer affects service quality from the consumer’s point of view.
Gap 4: The gap between service delivery and external communications. This gap between
how the service is actually delivered and how external communications about the service
(e.g. sales, marketing) are conducted affects the perception of service quality from the
consumer’s point of view.
Gap 5: The gap between expected service and perceived service is the gap between what
the customer expected and what they got.
11Figure 5: Service quality model (Parasuraman & al., 1985, 44). Service quality model
shows the gaps in service quality and how they are related to each other
2.8 Determinants of service quality
According to the research, the way that the consumers understand service quality de-
pends on how big is gap number five and how it’s directed: towards expected service or
perceived service meaning whether the expectations have been met or not. The size and
direction of gap number five in turn depends of the former gaps related to design, market-
ing and delivery. (Parasuraman & al. 1985, 48.)
Gap5 = f (Gap 1, Gap 2, Gap 3, Gap 4)
12These five gaps that Parasuraman & al. formed based on their research form the basis for
the model that portrays the determinants of service quality as the clients perceive it. The
research showed, that despite the company the consumers have quite similar criteria
when they evaluate the service quality, and this criterion can be divided into ten different
categories, which then form the ten different determinants (Parasuraman & al. 1985, 48).
Figure 6: Determinants of service quality (Parasuraman & al. 1985, 48.)
The explanations for the determinants go as following (Parasuraman & al. 1985, 47):
1. Access: how difficult the company is to approach and get in contact with, e.g. ser-
vice hours and location.
2. Communication: how well customers are kept informed with a language that they
can understand.
3. Competence: whether the company has the skills and know-how to operate.
4. Courtesy: manners, politeness, and friendliness and appearance.
5. Credibility: whether the company is trustworthy, honest and professional.
136. Reliability: consistent performance in behalf of the company, accuracy and prom-
ise keeping.
7. Responsiveness: willingness of the employees to provide service on time and ac-
curately.
8. Security: physical- and financial safety.
9. Tangibles: facilities, appearance, equipment.
10. Understanding/knowing the customer: going for the extra mile in order to under-
stand customer’s needs and requirements, treating customer as an individual.
These ten determinants can be then divided into three different categories: search proper-
ties, experience properties and credence properties.
Search properties are those, that customer can get to know beforehand, before purchas-
ing the service: tangibles and credibility. These are the easiest to evaluate, yet these exist
more rarely within service companies.
Majority of the determinants would fall under experience properties, which the customers
can evaluate after they have already done business with the company. Experience prop-
er-ties would be access, courtesy, reliability, responsiveness, understanding/knowing and
communication. In service companies these are the most usual ones.
Final two determinants would be credence properties that are hard for the consumer to
evaluate despite doing business with the company: competence and security.
Since within companies that provide services there are just a few search properties, con-
sumers typically form their idea of the company and the service quality through evaluation
of the experience properties. The research implies, that the way consumer perceives the
quality of the service depends on the difference between expectations and perceived ser-
vice. (Parasuraman & al. 1985, 48.)
Parasuraman & al. also provide a simplified explanation for perceived quality:
(a) When ES (expected service) > PS (perceived service), perceived quality is less
than satisfactory and will tend toward totally unacceptable quality, with increased
discrepancy between ES and PS; (b) when ES = PS, perceived quality is satisfacto-
ry; (c) when ES < PS, perceived quality is more than satisfactory and will tend to-
ward ideal quality, with increased discrepancy between ES and PS. (Parasuraman &
al. 1885.)
14Parasuraman & al. (1985, 48) state, that plenty of these determinants overlap each other
and it is really dependant of the company how these attributes can be categorized. Never-
theless, this theory gives a good breakdown on different attributes that can be used in the
evaluation of quality within service-providing companies. (Parasuraman & al. 1885.)
2.9 Five-step model to implementing service quality program within a company
There are different ways to implement various service quality programs within different
companies, but in most places the principles are the same. In the book Measuring Cus-
tomer Satisfaction, Gerson & al. (1993, 19) present a 5-step program that helps in the pro-
cess. The commitment of the staff that is directly in contact with the customers is in the
core of providing excellent customer service. The 5 steps go as following:
1. Add value: top the customers’ expectations by giving them something that’s not
expected.
2. Train staff accordingly: staff has to be able to recognize where the problems are in
the service process and to be able to react accordingly in the situation so, that the
customer doesn’t notice any mistakes.
3. Keep in contact: communicate with the customers regularly in order to create a
stronger bond. This helps in maintaining existing customers despite unfortunate
incidences within service or product quality.
4. Implement a reward program: provide additional gifts and benefits to loyal, long-
term customers or to those who make large purchases.
5. Create strategic partnerships with the clientele: engaging customers either mental-
ly or financially gives them a higher meaning and allows them to participate in the
development of the company. Provide personal service to have them emotionally
attached to the company.
153 Research
3.1 Research methods
The research method used in this thesis is a quantitative research made by gathering pa-
per feedback forms from visitors in Pyhä Ski Resort. The feedback forms were gathered
during the winter season and it was participated by 481 customers during the winter sea-
son. The majority (78%) of participants were Finnish, when the rest of the participants
were foreign visitors (22%).
The feedback forms used were offered in two languages, both in Finnish and in English.
The feedback forms were already being in use by the time of my arrival, and I did not have
a part on creation of the feedback forms. Similar types of feedback forms were also al-
ready being used in Pyhä’s accommodations and in Ruka.
The participants of the survey consisted of various groups of visitors: seasonal tourists,
locals, active visitors of Pyhä Ski Resort, those who go to ski resorts regularly and those
who have less experience in visiting them, domestic tourists and foreign visitors, inde-
pendent travellers and those who booked their trip through an agency.
Majority of the feedback was gathered by me, by meeting the visitors within the ski resorts
area in restaurants, cafeterias, bars and other places where the visitors take breaks.
Feedback forms were also gathered in the hotel reception, rental shops and the Colorado
Bar & Grill restaurant by the staff. All of these forms were then filled in to the system Pyhä
Ski Resort uses to analyse customer feedback, Laatuverkko.com. Laatuverkko.com is
managed by Perho (Perho Liiketalousopisto 2016).
3.2 Data gathering process
I started gathering feedback by meeting with visitors upon my arrival to Pyhätunturi mid-
December 2017 and continued until leaving in the end of April. Prior and after that the
feedback forms were also gathered passively in the hotel, restaurant and rental shops.
The data was gathered by me almost daily, focusing on peak times like during Christmas
and New Year’s, winter holidays and Easter. The data was also collected during more
quiet times of the season, but due to having less visitors during the slower periods of the
season most of the feedback has been gathered during peak season.
16After collecting feedback on paper printed feedback forms, I took the filled forms and filed
them into the data gathering system of Laatuverkko.com in larger quantities around every
other week. The amount of feedback was quite large, which gives a wide base of data to
be used in this research.
3.3 Reliability of the research and limitations
The number of attendants of this research was 481 visitors. These visitors also come from
different backgrounds, giving this research quite a large and trustworthy base. Biggest
concerns about the research are about the questionnaires and more specifically the ques-
tions used and whether people understand them somewhat similarly. Also, some con-
cerns are about the fact that respondents were allowed to leave some questions unan-
swered and to answer just to those that they feel like answering, which can give more
reliable results for some sections and less reliable for others.
Also, the use of Laatuverkko.com and the fact that the Finnish and English feedback
forms weren’t 100% similar causes a bit of difficulties when comparing the results based
on the language of the respondents. Despite all this, I feel that the large number of partici-
pants and a wide variety of data makes this research reliable and allows it to be used as a
valid guideline when considering customer satisfaction levels and company development
processes in the future.
3.4 Questionnaires used
The questionnaires were offered to visitors in two languages, in Finnish and in English.
The feedback forms consist of three parts: structured questions, open questions and in-
formation of the participant. Structured questions are graded with a scale of 1 to 5 with 1
being the lowest and 5 being the highest grade. Respondents were also allowed to leave
a question unanswered, if they didn’t have any experience of that specific matter.
The questions were categorised in the following ways: general feedback of Pyhä Ski Re-
sort, skiing services in Pyhä Ski Resort in general feedback on one specific service of
their own choice (lower rental shop, upper rental shop, ski school, Colorado Bar&Grill),
feedback about the Pyhä Ski Resort’s slope-experience and whether they would recom-
mend Pyhä Ski Resort for their friends.
The structured questions were followed by open questions, requesting for comments
about Pyhä Ski Resort’s slope experience, development proposals and other feedback.
17The last part is about demographics of the participants: their gender, age and contact in-
formation. Feedback forms in both languages are included in the appendices.
3.5 Demographics of attendants
Altogether, the questionnaire was answered by total of 481 people during the timespan of
1. November 2017 and 1. May 2018.
Out of those participants, 375 people (78%) filled the survey in Finnish and 106 (22%) in
English. Out of everyone, 408 people informed their gender and 403 their age.
Majority of participants declaring their gender were female, total 217 out of 408 (53%) and
191 were male (47%). The rest of the participants (73 people) did not mention their gen-
der while filling the questionnaire.
The biggest age group of people attending was those in the age of between 31 and 50,
189 people (47%). The next biggest group was those between 18 to 30-year-old (28%),
followed by those between 51 to 65-year-old. The second smallest participant group was
those between ages of 12 and 17 (8%), and the least participants were in the group of
those over 65 years old (4%). Below is the full breakdown of the demographic of the par-
ticipants based on their age.
Table 1. Attendants of the survey by their age
Age Number of answers Percentage
12-17 34 8%
18-30 112 28%
31-50 189 47%
51-65 54 13%
Over 65 17 4%
All choices 403 100%
3.6 Results of the structured questions
In this next part, I will present the complete results of the survey. After the results of each
section, I will then give explanations.
18The averages of each section are colour-coded, with green meaning that the value is ex-
cellent (over 4.2 out of 5), yellow means it’s satisfying (over 3.7, less than 4.2 out of 5)
and red means it requires extra attention (under 3.7 out of 5).
Table 2. Pyhä in general
Part 1: General feedback of Pyhä No. of answers Average
a) Customer service 468 4.43
b) I felt welcome 469 4.54
c) I found the service I wanted easily 460 4.42
d) Staff recommended other services in area 251 3.46
e) General rating of Pyhä 467 4.42
f) Pyhä is family friendly 404 4.49
g) Information about events and services 405 3.8
h) Consideration for the environmental matters 375 4.16
i) General rating of Pyhä cross-country tracks 242 4.36
When looking at the results about general feedback of Pyhä Ski Resort, it can be seen
that feedback is mostly positive. The customer service average is 4.43 which means that
visitors feel, that level of customer service is already on a remarkably good level. Feeling
of welcomeness is rated 4.54, accessibility to services 4.42, Pyhä. Ski Resort’s general
rating 4.42 and family-friendliness 4.49 which means that Pyhä Ski Resort is seen as a
great destination for families. Also, users of cross-country tracks in the area feel that gen-
eral rating of tracks is good with a rating of 4.36.
According to the visitors, information about events and services could be easier to find
since the rate is only 3.8. Also, the visitors feel, that consideration of environmental mat-
ters in the area could be better (4.16). Only aspect that requires special attention, is that
the visitors don’t feel that they receive enough recommendations from the staff in Pyhä
Ski Resort regarding other services in the area and that area is given just a rate of 3.46.
The total average rate for this part is on an excellent level, scoring 4.23 out of 5.
Table 3. Slopes & slope-related services and facilities
Part 2: Your opinion of the ski slopes, related ser- No. of answers Average
vices and Pyhä ski facilities
a) Condition of slopes 422 4.5
b) Skiing services in Pyhä in general 24 4.83
c) I felt welcome 429 4.52
19d) Ski lifts, quality & comfort 426 4.34
e) Tidiness of slopes 421 4.64
f) Beginners’ ski areas 315 4.39
g) Polar Madness 189 4.17
h) Guidance & information 399 4.12
i) Customer service at the lifts 320 4.26
j) Value for money 393 3.85
Considering the slopes and services related to ski slope operations, customers feel that
condition of the slopes (4.5), skiing services in general (4.83) and them feeling welcome
(4.52) are overall excellent. Ski lifts and their quality along with comfort are seen as they
work well (4.32), slopes are tidy (4.64) and there are good areas suitable for beginners
(4.39). Also, staff working at the lifts are seen as customer friendly, providing good service
and they’ve been given a rating of 4.26.
On this part, areas of improvement are Polar Madness snowboard- and free skiing park
(4.17), guidance and information in the slopes (4.12) and the feeling of receiving the value
for their money (3.85). When it comes to the slopes and related services, there are no
things that are especially poorly managed and that would have a rating under 3.7 out of 5.
The total average rate for this part is on an excellent level, scoring 4.362 out of 5.
Table 4. Feedback on additional services
Part 3: Feedback on a specific service, all No. of answers Average
additional services together
a) Customer service 394 4.52
b) I felt welcome 395 4.52
c) Availability and efficiency of services 396 4.44
d) Quality of products and services 375 4.45
e) I was recommended additional service or product 262 3.54
This table presents how visitors experience all additional services together. In base rental
shop, upper rental shop, Colorado Bar & Grill and in ski school visitors perceive customer
service (4.52), feeling of welcomeness (4.52) and availability and efficiency of services
(4.44) along with quality of products and services (4.45) excellent.
20Only area requiring extra attention is recommendation of additional services or products
with a rate of 3.54. All additional services scored an average rate of 4.294 out of 5, impli-
cating excellent results.
Table 5. Feedback regarding the rental shop at the base of the hill
Part 3.1: Feedback on a specific service - No. of answers: Average
Base rental shop 144
a) Customer service 4.47
b) I felt welcome 4.44
c) Availability and efficiency of services 4.43
d) Quality of products and services 4.43
e) I was recommended additional service or product 2.99
This table presents how the base rental shop performed according to visitors. As the table
shows, customer service (4.47), feeling of welcomeness (4.44), availability and efficiency
of services (4.43) along with quality of products and services (4.43) are excellent. In base
rental shop recommending additional services or products is on poor level with a rating
just under 3 (2.99), which requires extra attention. The total rate for base rental shop is
good, averaging 4.152 out of 5.
Table 6. Results of the upper rental shop
Part 3.2: Feedback on a specific service: No. of answers: Average
Upper rental shop 126
a) Customer service 4.54
b) I felt welcome 4.58
c) Availability and efficiency of services 4.48
d) Quality of products and services 4.61
e) I was recommended additional service or product 3.77
Upper rental shop performs quite similarly as the base rental shop, although in upper
rental shop all areas received higher ratings compared to base rental shop. In upper rental
shop recommending of additional services or products is on satisfactory level with a rating
of 3.77, making a clear difference to base rental shop. Customer service (4.54), visitors
feeling welcomed (4.58), availability and efficiency of services (4.48) and quality of prod-
ucts and services (4.61) are on an excellent level. The total average rate for upper rental
shop is on an excellent level with a rate of 4.396 out of 5.
21Table 7. Results from Colorado Bar&Grill
Part 3.3: Feedback on a specific service: No. of answers: Average
Colorado Bar & Grill 90
a) Customer service 4.48
b) I felt welcome 4.44
c) Availability and efficiency of services 4.27
d) Quality of products and services 4.11
e) I was recommended additional service or product 3.68
Visitors of Colorado Bar & Grill feel, that customer service in the restaurant is good (4.48),
along with feeling welcome (4.44) and availability and efficiency of services (4.27). Quality
of products served could be improved (4.11), and the visitors don’t feel that the staff of the
restaurant recommends additional services or products (3.68). The total average rating for
the restaurant is on good – almost excellent level with a rating of 4.196 out of 5.
Table 8. Feedback for Pyhä Ski School
Part 3.4: Feedback on a specific service: Ski No. of answers: Average
school 36
a) Customer service 4.74
b) I felt welcome 4.81
c) Availability and efficiency of services 4.72
d) Quality of products and services 4.71
e) I was recommended additional service or product 4.04
Out of all additional services, ski school receives the best ratings. Customer service is
seen exceptional with a rating of 4.74, visitors feel extremely welcome with a rating of 4.81
and they feel that ski school services are easily available (4.72). The quality of teaching is
also perceived as excellent (4.71). Only area of improvement is again in recommending
other services, but ski school still managed to do well on also this part (4.04). The total
rating for Pyhä Ski School is excellent with 4.604 out of 5.
Table 9. Results on the slope-experience
Part 4: Feedback about the Pyhä slope- No. of answers Average
experience
a) Friendly 412 4.49
b) Authentic 402 4.57
c) Easy 397 4.44
22d) Individual 297 4.07
e) Exciting 399 4.08
f) Magical 386 4.07
This table presents, how visitors feel about their slope-experience. This part is mostly
about the feeling the visitors get while being in the slope area. The concepts of this sec-
tion are a bit abstract and everyone may have a bit unique perception on how they view
these terms.
The visitors feel, that their slope-experience is friendly (4.49), authentic (4.57) and that
everything went easily (4.44). Still they feel, that Pyhä could embrace its individuality
(4.07), they could feel a bit more excited (4.08) and the feeling of “magical” could be high-
er (4.07). In this section, overall performance is really good with an average of 4.287 out
of 5.
When all the results of each question are combined, the final average for the survey is
4.33 out of 5. This is an exceptionally good average, which implicates that visitors in Pyhä
Ski Resort feel really satisfied with their visit.
Table 10. Recommending Pyhä as a destination
Part 5: Would I recommend Pyhä Ski Resort to No. of answers Percentage
my friend?
a) Yes 409 99%
b) No 5 1%
Total: 414 100%
When asked whether the visitors would recommend Pyhä Ski Resort as a destination for
their friends, the results are quite unanimous. Out of 414 people that answered this ques-
tion, 409 (99%) would recommend visiting Pyhä Ski Resort and only 5 (1%) wouldn’t.
3.7 Results based on the language the survey was taken
In this next part, I will present the results of the survey based on the language that the
participants filled the forms in. I will emphasize the differences that foreign and domestic
visitors experience. Due to some minor differences in the feedback forms, some data
that’s available from those who took the survey in English does not exist from those that
took the survey in Finnish. The results following are similarly colour coded like in the pre-
vious section.
23Table 11. General feedback of Pyhä sorted by language
Part 1: General feedback of Pyhä English Finnish
a) Customer service 4.66 4.37
b) I felt welcome 4.76 4.47
c) I found the service I wanted easily 4.65 4.35
d) Staff recommended other services in area 5.0 3.41
e) General rating of Pyhä 4.49 4.41
f) Pyhä is family friendly 4.57 4.47
g) Information about events and services 4.03 3.72
h) Consideration for the environmental matters 4.48 4.07
i) General rating of Pyhä cross-country tracks 4.46 4.33
In the general feedback of Pyhä Ski Resort, visitors feel that most areas are well covered,
providing excellent rates on almost every aspect. Still, some differences and areas of im-
provement can be seen.
The foreign visitors feel that the customer service they receive is better (4.66) compared
to how Finnish visitors perceive it (4.37). Foreign visitors also feel more welcome with a
rate of near perfect 4.76 compared to domestic visitors’ 4.47. A bit surprisingly, foreign
visitors also feel that they find the services they’re looking for easier (4.65) than Finnish
visitors (4.35). General rating of Pyhä Ski Resort is overall really good (foreign visitors
4.49, domestic visitors 4.41). Pyhä Ski Resort is seen as family friendly (foreign 4.57, do-
mestic 4.47) and cross-country tracks receive good ratings also (foreign 4.46, domestic
4.33).
When it comes to information about events and services, both domestic (3.72) and foreign
(4.03) visitors feel that information could be better available. Especially Finnish visitors
feel that the information isn’t available clearly enough. Also, the Finnish visitors feel, that
consideration of environmental matters requires more attention (4.07 compared to 4.48).
A bit surprisingly, the biggest difference between Finnish and foreign visitors is, that in
general feedback section Finnish visitors feel that they receive not enough information
about other services in the area (3.41), whereas all foreign visitors that answered this
question gave this question a five, landing it an average of five. The total average for this
part is 4.567 out of five for foreign visitors and 4.178 for domestic visitors.
24Table 12. Opinions of the slopes by language
Part 2: Your opinion of the ski slopes, related ser- English Finnish
vices and Pyhä ski facilities
a) Condition of slopes 4.75 4.44
b) Skiing services in Pyhä in general 4.83
c) I felt welcome 4.78 4.45
d) Ski lifts, quality & comfort 4.46 4.31
e) Tidiness of slopes 4.64 4.64
f) Beginners’ ski areas 4.64 4.33
g) Polar Madness 4.33 4.11
h) Guidance & information 4.31 4.07
i) Customer service at the lifts 4.26
j) Value for money 4.12 3.78
Nearly all visitors felt, that in Pyhä Ski Resort the slopes are in good condition (foreign
4.75, domestic 4.44) and the foreign visitors feel that skiing services in general work ex-
ceptionally well (4.83). Ski lifts are of good quality (foreign 4.46, domestic 4.31), and
slopes are being kept tidy (both 4.64). Also, beginners feel that there are easier areas
suitable for them (foreign 4.64, domestic 4.33).
The biggest, most significant differences between foreign and Finnish visitors is, that Finn-
ish visitors see that they don’t get as much value for their money (foreign 4.12, domestic
3.78). Also, a bit surprisingly the Finnish visitors feel that the guidance and information
provided are a bit insufficient (foreign 4.31, domestic 4.07). Finnish visitors give lower rat-
ings to the snow park area (foreign 4.33, domestic 4.11), which may be due to majority of
park users being Finnish visitors. The total average for this part is 4.512 out of five for
foreign visitors and 4.266 for domestic visitors.
Table 13. Feedback regarding rentals, ski school and Colorado Bar&Grill
Part 3: Feedback on a specific service: English Finnish
All additional services together
a) Customer service 4.69 4.48
b) I felt welcome 4.72 4.46
c) Availability and efficiency of services 4.63 4.38
d) Quality of products and services 4.61 4.39
e) I was recommended additional service or product 4.23 3.35
25Out of additional services, nearly all values are on an excellent level, except that Finnish
visitors don’t seem to get as much recommendations from the staff about additional ser-
vices or products (foreign 4.23, domestic 3.35). Customer service is rated high (foreign
4.69, domestic 4.48), visitors feel welcomed (foreign 4.72, domestic 4.46), services are
well available and efficient (foreign 4.63, domestic 4.38) and quality is good (foreign 4.61,
domestic 4.39). The total average for all additional services together is 4.576 out of five for
foreign visitors and 4.212 for domestic visitors.
Table 14: Slope-experience and the differences between foreign and domestic visitors
Part 4: Feedback about the Pyhä slope-experience English Finnish
a) Friendly 4.71 4.44
b) Authentic 4.68 4.55
c) Easy 4.46 4.43
d) Individual 4.07
e) Exciting 4.44 3.98
f) Magical 4.45 3.96
When analysing differences on how visitors feel about Pyhä Ski Resort’s slope-
experience, it can be seen that the Finnish visitors are more difficult to impress than for-
eign ones. Although both these values are either excellent or good, it is worth mentioning
that especially tourists who arrive to Pyhä Ski Resort from abroad seem to find Pyhä Ski
Resort even exciting and magical, at least more than their Finnish counterparts.
Visitors deem their experience as friendly (foreign 4.71, domestic 4.44), authentic (foreign
4.68, domestic 4.55) and easy (foreign 4.46, domestic 4.43). Foreign visitors deem the
experience quite individual (4.07) and they feel that it was more excited and magical for
them than their domestic counterparts (exciting 4.44 versus 3.98, magical 4.45 versus
3.96). Averages for slope-experience were 4.468 out of 5 for foreign and 4.272 out of 5 for
domestic visitors.
Altogether, the breakdown of feedback based on the nationality of the respondents shows
that when it comes to providing high-quality skiing services and memorable experiences,
the foreign visitors are easier to please than the Finnish ones. This may be related to the
fact, that people coming from abroad are already out of their typical setting and may find
the Lappish nature and way of life so exotic already, that they tend to rank their experi-
ences higher than those that are travelling inside their own country. The total averages
26based on language of the feedback forms were both on excellent levels, foreign visitors
giving a total rate of 4.532 out of 5 and domestic 4.229 out of 5.
3.8 Open questions
In the end of the survey, there were two open questions for the participants: comments
about the Pyhä Ski Resort’s slope experience and development proposals or other feed-
back for Pyhä Ski Resort.
Altogether, for question one I received 42 comments from people that filled the feedback
forms in English, and 157 from those that answered in Finnish. On question 2’s develop-
ment proposals I received 22 proposals in English and 146 in Finnish.
This means, that out of all participants taking the survey in Finnish, 42% gave comments
about the Pyhä Ski Resort’s slope experience and 39% gave development proposals or
other feedback. Out of all the people that took the survey in English, 39% gave comments
about the slope experience and 20% gave development proposals and other feedback. In
the following part, I will go through the main points and the most frequent subjects that
came up from the whole open feedback section. The full, unedited list of all open com-
ments and feedback can be found in the appendices (Finnish & English).
3.8.1 Open questions answered by foreign visitors
The comments regarding Pyhä’s slope-experience given in English were almost entirely
positive, reflecting the feedback the foreign visitors gave Pyhä Ski Resort in the structured
questions.
Majority of the comments regarding slope-experience mentioned slopes being in good
condition and well groomed, overall atmosphere in the resort being welcoming, lovely and
magical, variety of different slopes for different skill-levels being wide enough and the
scenery being beautiful.
Some things came up that could have been more well-adjusted or that could have benefit-
ted the visitors, for example a shuttle bus service taking people from the hotel-level to the
bottom of the hill or Piste number 2 being too difficult to be presented as a blue slope.
Some felt that variety of slopes wasn’t wide enough leaving not difficult enough slopes for
experienced skiers and not enough more mellow slopes for unexperienced ones especial-
27You can also read