WAT ERL OO CAT HOL IC DIST RICT SCHOOL BOA RD BUDGET REPORT 2018-2019 - wcdsb
←
→
Page content transcription
If your browser does not render page correctly, please read the page content below

WAT ERL OO CAT HOL I C DI ST RI CT SCHOOL BOA RD
                               BU DGET REPORT
                                      2018- 2019
                       1
2

2018-2019 Bu dget

    Waterloo Catholic District School Board
                            35 Weber St. W.
                  Kitchener, ON N2G 4G2
                             www.wcdsb.ca

          Prepared by: Corporate Services
       Presented to Trustees: June 4, 2018

3
TA BL E OF CONT ENT S

Introduction
Message from the Chief Financial Officer............................................................................                          8
About Our Board.....................................................................................................................         10
Our Priorities............................................................................................................................   12
Board of Trustees and Senior Administration.....................................................................                             14
Executive Summary.................................................................................................................           16
Challenges and Risks...............................................................................................................          18
Budget Process and Consultation.........................................................................................                     20
Revenue and Expenditure Reports.......................................................................................                       22
Revenue Details and Enrolment............................................................................................                    24
Expenditure Details and Staffing...........................................................................................                  26
Accumulated Surpluses and Deferred Revenues................................................................                                  28
EQAO Results and Graduation Rates....................................................................................                        30
International Education and Program Highlight: French Immersion................................                                              32

Budget Summaries
Dashboard Report and Ministry of Education Compliance Report...................................                                              36
Revenue and Expenditure Comparative Summaries..........................................................                                      38

Planning Area Reports
Planning Area Summary.........................................................................................................               42
Capital Budget: Sources and Uses of Funding.....................................................................                             44
Capital Budget: Utilization, Age and Facility Condition Indexes........................................                                      46

                                                                                       4
Operating Budget: Summary and Board Administration...................................................                         48
Operating Budget: Student Transportation and Operations and Maintenance..............                                         50
Operating Budget: Learning Services: Summary and Program Services..........................                                   52
Operating Budget: Learning Services: Student Services and Continuing Education......                                          54
Operating Budget: Learning Services: School Budgets and Information Technology.....                                           56

Appendices
Appendix I: Board Policy IV007 : Financial Planning/Budgeting........................................                         60
Appendix II: Planning Assumptions......................................................................................       61
Appendix III: Budget Consultation Survey Results..............................................................                62
Appendix IV: Capital and Debt Detail....................................................................................      67
Appendix V: Student Transportation Detail.........................................................................            67
Appendix VI: Board Administration Detail............................................................................          68
Appendix VII: Program and Student Services Detail...........................................................                  68
Appendix VIII: Facility Services Detail....................................................................................   69
Appendix IX: Technical Paper Analysis..................................................................................       70
Appendix X: Glossary of Commonly Used Terms................................................................                   78

                                                                              5
6

I NT RODU CT I ON

Message from the Chief Financial Officer (CFO)
About Our Board
Our Priorities
Board of Trustees and Senior Administration
Executive Summary
Challenges and Risks
Budget Process and Consultation
Revenue and Expenditure Reports
Revenue Details and Enrolment
Expenditure Details and Staffing
Accumulated Surpluses and Deferred Revenues
EQAO Results and Graduation Rates
International Education and Program Highlight: French Immersion

                                                   7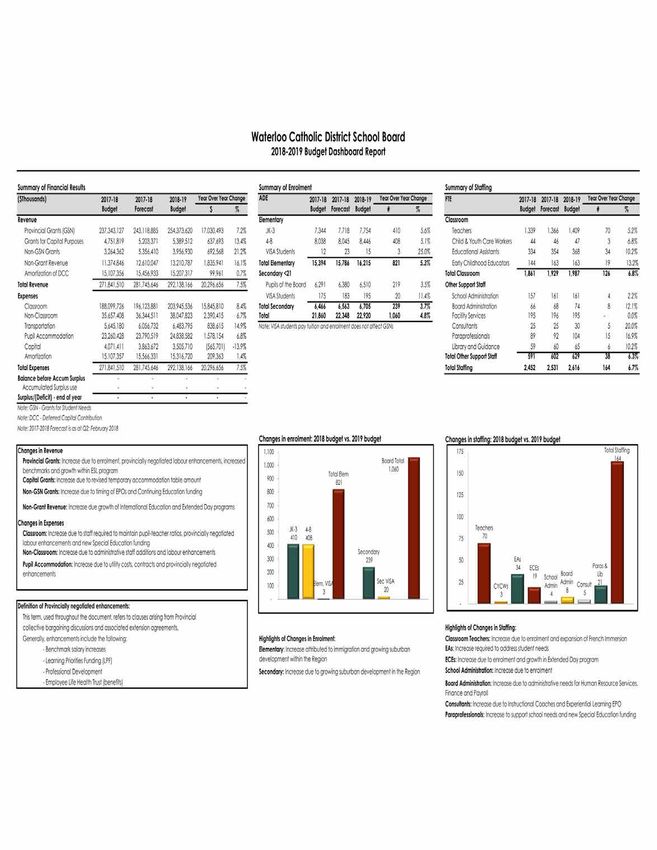
M ESSAGE FROM T HE CFO

Dear Parents, Students, and Catholic School Supporters,
On behalf of the Finance team led by Laura Isaac and Renée King, I am pleased to provide you with details
on the proposed 2018-2019 school year budget.
As always, the budget preparation process was full of exciting turns and twists with unexpected (but
welcomed) investments into areas the Provincial government deems a priority, the details of which we are
still receiving. Enrolment continues to grow in Waterloo Region?s Catholic Schools, increasing on average by
3% per year over the past four years. With growth comes a need for additional teaching staff, learning
resources, technology investments, and a carefully managed approach to adding temporary
accommodations at many of our schools.
I am pleased to report that the proposed budget is balanced, meets all legislative and regulatory
requirements, fulfills contractual requirements, and addresses local priorities in the areas of:
   -   Encouraging well-being for students and staff
   -   Improving graduation rates
   -   Implementing a new pastoral plan
   -   Promoting equity throughout the system
   -   Investing in 21st century technologies and promoting global competencies for students
As we move into 2018-2019, a focus will be placed on the development of a new multi-year strategic plan
which will be underpinned by the priorities outlined above.
While the balance of this document contains a summary of the plans and investments for the next school
year, I would like to highlight the following ambitious initiatives and program changes being proposed:
   -   Special Edu cat ion : The Ministry of Education has made new and significant investments into support
       staff in the area of special education. Included in the budget is a new multi-disciplinary team and
       other support staff including a psychologist, social workers, behavior analysts, and communication
       disorder analysts. In addition to this cadre of new supports, the Ministry will be providing funding to
       assist the Board in reducing the wait-times for special education assessments. It is hoped that these
       new supports will enhance the educational experience of our most vulnerable students.

                                                      8
-   In st r u ct ion al Coach es: As part of collective efforts to ensure best practices are taking place in our
       schools with respect to instruction, four new instructional coaches are being added for the fall of
       2018. These positions are being added in response to a limited supply of daily occasional teachers
       which has impeded our ability to deliver professional development for teachers using the traditional
       workshop model. It is also hoped that the coaching model will be more effective and responsive to
       the specific needs of schools and teachers.
   -   En er gy Con ser vat ion : As all home and business owners will be aware, the cost of utilities has
       continued to increase and far outpace the consumer price index (CPI). The Board, through its Energy
       Conservation and Demand Management Plan has set ambitious goals to reduce energy usage by
       1.0% per year as well as greenhouse gas emissions by 20.0% by 2024. To support the achievement of
       these goals, strategic investments are being made into the renewal of key building components
       (heating systems, windows, doors, and roofs). When combined with proactive preventative
       maintenance programs and evolving building occupant behavior, it is hoped that our goals will be
       reached and utility costs contained.
   -   ESL Teach er s: As new Canadians move into the Region, changes in the level of supports available for
       students have been necessary. The proposed budget includes the addition of 2.5 new ESL teachers.
       This area will continue to be monitored, and will be re-assessed in the fall to ensure sufficient levels
       of staffing exist to meet student demand.
   -   In f or m at ion Tech n ology: Significant increases in technology investments have been included in the
       budget including new Chromebooks, laptops, PCs, projection units, and all of the associated
       infrastructure to support secure, fast, and reliable networks for students and instructors.
On a final note, in the fall parents and students will see a full refresh of bike racks, scooter racks, and storage
for skateboards at each site (and even some new Buddy Benches!). We are hopeful that more students will
choose to travel to school in active ways instead of being driven to school. There are significant benefits to
active travel including an increase in general happiness and health, improved levels of concentration in class,
greater levels of independence, and it?s even kind to our environment.
Thank you for choosing Waterloo Region?s Catholic Schools, a place where all children belong.

                                                                                                      Shesh Maharaj
                                                        9                                                 MBA,CPA,CGA
A BOU T OU R BOA RD

    "It is a privilege and an honour to
     work with the staff and broader
  community at Waterloo Catholic. Our
        schools are the Heart of the
   Community, providing success for
  each and a place for all...and for that,
  they are truly worthy of celebration."
              ~Loretta Notten
            Director of Education

                                                   1836                                 1990
                                    St. Agatha and St. Boniface          Waterloo Catholic District School
                                    Elementary Schools are founded       Board ranks as the 8th largest
                                    in the villages of St. Agatha and    Catholic school board in Ontario.
                                    Maryhill.
                                                                                        2010
                                                   1864                  The Ministry of Education
                                    St. Jerome's High School was         announces a 5 year plan to roll out
                                    founded in St. Agatha and later      Full Day Kindergarten for 4 and 5
                                    moved to Berlin in 1866.             year olds.
       OUR M ISSION
   As disciples of Christ,                         1930                                 2015
      we educate and                St. Mary's High School for girls     Board elementary enrolment
    nurture hope in all             opened in Berlin.                    begins to increase for the first time
  learners to realize their                                              in 10 years. French Immersion
      full potential to                            1969                  programming is offered at 2 sites.
  transform God?s world.            Independent Catholic School          Secondary enrolment remains
                                    Boards, operating within the         stable.
                                    Region, were amalgamated into the
        OUR VISION                  Waterloo County Separate School
                                                                                        2018
                                    Board. John Sweeney becomes the      Board growth remains steady and
   Our Catholic Schools:
                                    first Director of Education.         the Board makes plans for 9 new
         heart of the                                                    schools.
        community --                               1984
                                    Ontario Legislature announces full
                                                                                        2019
     success for each, a
        place for all.              funding for Catholic schools to      Board will begin development of a
                                    Grade 13.                            new Multi-year Strategic Plan and
                                                                         Pastoral Plan.

                                                      10
Waterloo Region has the 8th highest
proportion of immigrants in Ontario.
In 2015, Waterloo Region had the 9th
highest median household income in
Ontario.
At 5.5%, the Region's 2016 growth
rate was higher than both the
national and provincial averages.
The connection between the Board and the community we serve is important to ensure we learn from our
past, embrace the future and make decisions that benefit all.
11OU R PRI ORI T I ES
The Multi-year Strategic Plan
concluded in 2017-2018. A new
strategic plan is being drafted which
will envelop the priorities previously
articulated. The 2018-2019 budget
has been built upon these
foundations and the Board's
commitment to follow them through.
Pastoral Plan
The 2017-2018 school year marked the third and final year of
the Board's Pastoral Plan, with the transition to People of Faith. The
pilgrimage cross was launched at that time and will continue its journey to all
schools until the end of this liturgical year. A renewed Pastoral Plan is in
development and will continue to embody the spirit of our faith, the priorities
of the strategic plan, and the engagement of the school community. The Plan
will allow the Board to continue to celebrate and nurture our Catholic faith,
which includes both staff and students, while proclaiming our message to the
Broader Waterloo Region community.
Equity
The Equity, Diversity and Learning Committee is engaged in the
development and implementation of activities that build staff capacity to
increase equity-based and inclusive practices. Further, the committee seeks to
improve academic outcomes for all students, but especially those who are
most vulnerable. This important lens will continue to be reflected to ensure
fair consideration is given when decisions are made.
Graduation rates
The Board continues to focus on graduation rates by engaging
with students in danger of not graduating. Through enrolment at Continuing
Education, Independent Learning Courses, and via St. Don Bosco, the Board
provides opportunities for all learners to succeed. These strategies compliment
the new Ministry vision for grade 7 and 8 Pathways, which supports the
identification of students at-risk and those in need of assistance.
12?These (new digital) technologies are
truly a gift to humanity and we must
endeavour to ensure that the
benefits they offer are put at the
service of all human individuals and
communities, especially those who
are most disadvantaged and
vulnerable.?
~ Pope Benedict XVI
Investment in technology
The Information Technology Plan for 2018-2023 outlines the direction for the Board to
maintain current technology needs and address upcoming needs. Through the guidance of the Information
Technology Governance Committee, projects are selected that align with the multi-year strategic plan and
available resources. This alignment is key to accomplishing goals strategically and efficiently. Ministry
provided technology funding has not kept pace with the changing 21st Century landscape which means that
the Board must fund investments in technology at the cost of other initiatives. The Board recognizes that a
commitment to current technology is key for student learning and success in their post-graduation
endeavors.
Well-being
The Mental Health and Well-Being Strategy defines
the enhancement of programs and supports to
provide students with resiliency, strengths-based education,
social and emotional learning, and behavioural competence
within the context of Catholic education and our Catholic
community. The Strategy reminds us that each student has
unlimited potential. The Board earned a national award for its
contributions and commitment to mental health education and
anti-stigma activities last year. This work continues to be a
priority for the Board and the Ministry to ensure staff and
students are healthy in mind, body, and spirit.
13BOA RD OF T RU ST EES
The Board of Trustees is responsible
for governing the school system in
the best interests of all students in its
jurisdiction and on behalf of the
community it serves. As
democratically elected officials,
Trustees are accountable to their
constituents.
Wendy Price - Chair Cambridge/North Dumfries
Bill Conway - Vice Cambridge/North Dumfries
Joyce Anderson Kitchener/Wilmot
Manuel da Silva Cambridge/North Dumfries
Jeanne Gravelle Waterloo/Wellesley/Woolwich
Greg Reitzel Kitchener/Wilmot
Brian Schmalz Kitchener/Wilmot
Melanie Van Alphen Waterloo/Wellesley/Woolwich
Vacant Kitchener/Wilmot
Kate Jamieson Student Trustee
Meghan Nemeth Student Trustee
14SENI OR A DM I NI ST RAT I ON
The role of Senior Administration is
to oversee the day-to-day operations
of the Board. This includes carrying
out the committment in the strategic
plan and ensuring compliance with
legislation.
Loretta Notten Director of Education
Gerry Clifford Superintendent of Learning
Jason Connolly Superintendent of Human Resources
Chris Demers Chief Information Officer
Laura Isaac Senior Manager, Financial Services
John Klein Superintendent of Learning
Shesh Maharaj Chief Financial Officer
Judy Merkel Superintendent of Learning
Richard Olson Superintendent of Learning
Terri Pickett Senior Manager, Facility Services
John Shewchuk Chief Managing Officer
Laura Shoemaker Superintendent of Learning
15EX ECU T I V E SU M M A RY
Management is proposing a balanced
budget for the 2018-2019 school year
of $292.1M.
This report is intended to help
stakeholders understand Ministry
requirements, while drawing
connections between the budget and
the commitment to student
development.
Provincial Perspective
The Ministry of Education Special Education will receive
announced the Grants for over $170.0M over the next
Student Needs (GSNs) on three years to support
March 26, 2018. increased programs and
services. The most
Sector funding significant of these
investments is additional
increases by 2.6%
staff to form a
multi-disciplinary team and
Total funding is expected to
mental health workers for
increase to $24.5B for
secondary students.
2018-2019.
This increase is slightly less Focus on student
than the 3.8% increase in achievement
the prior year. The Ministry
continues to support the The Ministry has also
centrally negotiated labour committed $140.0M over
agreements, as well as prior the next three years to
commitments such as the ensure grade 7 and 8
Renewed Math Strategy and students are better
class size reductions. equipped to explore career
pathways earlier to promote
The Ministry also announced
success in high school.
several new multi-year
investments which focus on
well-being for both staff and
students.
16Management has a fiduciary
responsibiility to prepare
conservative enrolment projections.
Enrolment directly drives revenues
and staffing which, if inaccurate, is
difficult to adjust in-year.
Enrolment
Projected: 22,710
% of revenues: 94.1%
Importance: Generates revenues and determines staffing
Driver: Families choosing faith-based education
Mitigating factors: Collaborative projection methodologies
Budget Advisory Committee engagement
Conservative and pragmatic projections
Staffing
Projected: 2,616
% of expenditures: 82.0%
Importance: Largest expenditure of the Board
Maintaining class size ratios
Adequate and appropriate staffing
Honouring collective agreements
Driver: Enrolment, administrative, and special needs
Mitigating factors: Review and analysis of staffing
Adjustments made as required
Legislation
Importance: Adherence to Education Act
Respond to changing needs
Driver: Advancement of student achievement
Mitigating factors: Financial oversight and accountability
Regular reporting to Ministry
Board Policy
17CHA L L ENGES A ND RI SKS
Management mitigates known
challenges and risks by ensuring that
the budget is built upon a solid
foundation.
The following PESTEL analysis highlights known elements that the Board has considered during budget
development:
? COM PA NY CEO
18Management makes calculated
assumptions in order to control
pressures. Monthly monitoring, as
well as quarterly reporting to the
Audit Committee and Trustees helps
to keep the Board on-track
throughout the year.
Labour agreements and legislation
The Ministry continues to fund the labour extension agreements and benefits, which have
now fully transitioned to the respective Trusts. As part of the labour extension agreement, the Ministry
continues to provide Local Priorities Funding to address a range of local education issues. The Fund
supports additional staff and encourages dialogue between boards and unions to determine where needs
exist. The Board is also implementing wage changes as directed through Bill 148 which commenced January
2018. Known impacts have been built into the budget while the Board and unions continue to work through
further details.
Changes in government
It is important to note that a Provincial election will be held on June 7, 2018. A change in
government could trigger a shift in priorities as relates to funding for education. While there is little that can
be done to anticipate what changes may take place and when, it is important to be aware that budgets may
need to be shifted at the direction of the Provincial government during the 2018-2019 school year. The
Board of Trustees will be provided with timely information if and when it becomes available.
Implementing new programming
The Ministry has invested significant funds into Special Education initiatives this year. While
this funding is good news, currently there is a lack of clear direction surrounding these funds. It is
anticipated that there will be a shortfall of, and local competition for, qualified professionals to fulfill this
mandate.
Ongoing challenges
Projecting enrolment - key to Board funding and overall planning
Classroom staffing shortfalls - key to student achievement and programming
Utility volatility - key to managing costs which are beyond Board control
19BU DGET PROCESS A ND CONSU LTAT I ON
Senior administration is responsible
for budget preparation. This
collaborative process is necessary to
ensure compliance with legislation,
Board policies and procedures.
The Board is expected to incorporate
Ministry changes, as announced
through the GSN, into the budget.
Budget Process
The budget process for 2018-2019 engaged budget holders starting in January 2018. This timing helps to
reduce decision-making bottlenecks and allows for more thoughtful analysis earlier in the process.
The process included a budget kick-off with senior administration to ensure transparency and to assess
opportunities for efficiencies.
The Elementary and Secondary Enrolment Committees continued to meet and review projection
methodologies. This approach has been successful and allows the Board to present well-rounded
projections to the Budget Advisory Committee for decision making.
Management struck a Budget Steering Committee in order to assist with budget balancing. Senior
administration and trustees were kept informed on budget progress with weekly and monthly updates. This
allowed for timely management review and changes as required.
20Board Policy IV007: Financial
Planning/Budgeting requires the
Board to consult with stakeholders
during the budget process. This
consultation helps the Board
re-affirm identified priorities and
determine pathways to achieving
goals.
Budget Consultation
The Board utilizes the expertise of a Budget Advisory Committee which is comprised of trustees, community
members, senior administration and principal representatives. This committee is primarily responsible for
approving the on-line public consultation survey questions and determining enrolment.
The on-line public survey is a joint effort between senior administration and the Budget Advisory
Committee. The challenge faced by the Board during consultation is that there are very few discretionary
funds available, resulting in little flexibility within the budget.
This year, the survey focused on the key priorities identified previously, as well as areas for improvement
and enhancements.
The Board received 517 responses (2017-2018: 603) to the survey. The full results can be found in Appendix
III.
21REV ENU E REPORT
The Board is financially dependent
upon the Ministry of Education for
funding through the Grants for
Student Needs (GSNs). The GSN is
made up of individual grants that
each serve a distinct purpose
towards carrying out Ministry goals
and mandates for the education
sector.
Nurturing Our Catholic Student Engagement, Building Capacity to Lead,
Community Innovation & Achievement Learn and Live Authentically
The Board's total estimated funding for the 2018-2019 school year is $292.1M as compared to $271.8M
for 2017-2018.
2015-2016 2016-2017 2017-2018 2018-2019
Act u al Act u al Est im at es Est im at es
Grants for Student Needs $ 186,211,744 $ 194,066,246 $ 204,040,282 $ 222,121,925
Local taxation 52,954,222 52,417,893 53,162,021 52,848,524
Targeted grants (EPOs) 2,910,392 2,345,923 1,283,239 1,795,260
Other revenue 12,656,192 13,030,011 13,355,868 15,372,457
Tot al r even u e $ 254,732,550 $ 261,860,073 $ 271,841,510 $ 292,138,166
Reven u e by plan n in g ar ea
Learning Services $ 232,510,168
Facility Services 25,733,920
Capital and Debt 18,822,430
Board Administration 8,368,947
Student Transportation 6,702,701
22EX PENDI T U RE REPORT
Expenditures are based on legislative
requirements, contractual
obligations, Board policy and known
infrastructure needs. In some cases,
best estimates are required and then
adjusted in-year once better
information becomes available.
People of People of People of
Love Hope Faith
The Board's total estimated expenditures for the 2018-2019 school year is $292.1M as compared to $271.8M
for 2017-2018.
2015-2016 2016-2017 2017-2018 2018-2019
Act u al Act u al Est im at es Est im at es
Salary and benefits $ 208,816,468 $ 214,067,609 $ 222,093,303 $ 239,445,599
Capital and debt 18,009,206 17,915,801 19,178,768 18,822,430
Student transportation 4,910,891 5,651,128 5,645,180 6,483,795
Other expenditures 22,411,079 23,408,389 24,924,259 27,386,342
Tot al expen dit u r es $ 254,147,643 $ 261,042,927 $ 271,841,510 $ 292,138,166
Expen dit u r es by plan n in g ar ea
Learning Services $ 233,673,922
Facility Services 24,838,582
Capital and Debt 18,822,430
Board Administration 8,319,437
Student Transportation 6,483,795
23REV ENU E DETA I L S
Local taxation funds are received
through property tax collections
where Catholic support is indicated.
Regardless of local taxation
collection, the Ministry "tops-up"
Board funding based on enrolment.
These funds are collected quarterly
from Municipalities and can create
cash flow pressures due to timing.
Grants for Student Needs
The year over year change of $18.1M or 8.9% in Grants for Student Needs is due to the
following:
- Increased enrolment
- Funding of the labour extension agreements
- Increased Ministry benchmarks and table amounts
- Investment in Special Education
- Increase in non-staffing portion of Operations and Maintenance
Targeted grants (EPOs)
The Ministry announces additional funding based on government priorities. Some EPOs are
released accompanying the GSN, but more funds typically are available throughout the year. Currently, the
Board is aware of $1.8M in targeted grants that are available for specific purposes. Of these, a grant for
Mental Health Workers in secondary schools is new for 2018-2019. The Ministry also moved several Special
Education targeted grants into the GSN which can be an indication of permanent funding.
Other revenues
These revenues comprise a small part of the Board's overall budget, and are not a guaranteed
source of funding. The Board makes certain assumptions, based on contracts or historical trending, in order
to reasonably estimate. The year over year increase of $1.5M or 10.8% increase over prior year is due to the
following:
- Expansion of the Extended Day program
- Anticipation of additional International students
- Increased Continuing Education funding through Language Instruction for Newcomers
to Canada (LINC)
24ENROL M ENT
Enrolment is the main driver for
Board funding. For this reason, the
Board must be conservative. The
enrolment committees provide key
analysis and insight as projection
methodologies continue to be
refined each year.
Total day school enrolment for 2018-2019 is projected to be 22,710 (2017-2018: 21,673). This is an increase
of 1,037 full time students over the projection from last year. While a 4.8% increase may seem high, the
Board is expected to end 2017-2018 with 22,143 students, which makes the estimated projection 2.6% over
the current level.
2016-2017 2017-2018 2017-2018 2018-2019
Act u al Est im at es For ecast Est im at es
Junior kindergarten 1,416 1,324 1,470 1,405
Senior kindergarten 1,434 1,465 1,570 1,533
Grades 1-3 4,524 4,555 4,678 4,816
Grades 4-8 7,827 8,038 8,045 8,446
Tot al elem en t ar y 15,201 15,382 15,763 16,200
Grades 9-12 6,254 6,291 6,380 6,510
Tot al en r olm en t 21,455 21,673 22,143 22,710
25EX PENDI T U RE DETA I L S
Salary and benefit expenditures
constitute 82.0% of the Board
budget. These are governed largely
by Ministry ratios, collective
agreements, legislation and student
needs. Due to these restrictions,
managing changes effectively and
efficiently can prove difficult.
Salary and benefits
The year over year increase of $17.3M or 7.8% in salaries and benefits can be attributed to:
- Adjusted pupil-teacher ratio due to increased enrolment and class size reductions
- Collectively bargained labour agreements
- Staff to support new Ministry and Board initiatives
- Additions to administrative staff
Capital and debt
The change over the prior year is a result of the following:
- Additional funding for Greenhouse Gas Reduction Fund
- Computer and other equipment
- Completion of St. Vincent de Paul and St. Brigid schools
- Timing of land purchases
Student transportation
The change over the prior year is a result of the following:
- Bus operator contract increases
- Additional staff to support school travel planning grant received
- Routing refinements
Other expenditures
Other expenditures are comprised mostly of operational costs such as facility operating costs,
program related resources and administrative costs outside of salaries and benefits. The year over year
change is a result of the following:
- Rising utility costs
- Expansion of the Extended Day program
- Purchase of French Immersion and French as a Second Language resources
- Purchase of religion resources
26STA FFI NG
Staffing is the largest component of
the budget and is the responsibility
of Human Resource Services. The
greatest challenge is managing
staffing costs while maintaining
Ministry ratios, honouring collective
agreements and servicing the needs
of students.
Total staffing expenditures for 2018-2019 is projected to be $239.4M (2017-2018: $222.1M). This is an
increase of $17.3M, which represents an increase of 164 full time staff over the same period last year.
2015-2016 2016-2017 2017-2018 2018-2019
Act u al Act u al Est im at es Est im at es
Teachers 1,289 1,309 1,339 1,409
Child and Youth Care Workers 47 41 44 47
Educational Assistants 309 323 334 368
Early Childhood Educators 133 144 144 163
Tot al classr oom st af f 1,778 1,817 1,861 1,987
School and Board administration 218 223 223 235
Facility Services 192 190 195 195
Other support staff 163 166 173 199
Tot al su ppor t st af f 573 579 591 629
Tot al st af f in g 2,351 2,396 2,452 2,616
27ACCU M U L AT ED SU RPLU SES
Accumulated surpluses are amounts
from prior years which have no
external restrictions. Most amounts
are apportioned internally, but all are
available for use by the Board.
The Ministry assesses board health
based on the amount of accumulated
surpluses maintained.
2015-2016 2016-2017 2017-2018 2018-2019
Act u al Act u al Est im at es Est im at es
Opening balance $ 4,261,513 $ 5,590,327 $ 6,003,273 $ 5,750,999
Contributions 1,466,107 781,519 - -
Draws (137,293) (368,573) (252,274) (252,274)
Closin g balan ce $ 5,590,327 $ 6,003,273 $ 5,750,999 $ 5,498,725
The anticipated draws are composed of previously encumbered amounts which are drawn down annually.
Com posit ion of Accu m u lat ed Su r plu s
Operating surplus $ 2,844,412
Network infrastructure 700,000
Early Learning resources 200,000
Administrative capital 531,978
Insurance 150,000
WSIB* 30,921
Sinking fund interest* 596,755
Committed capital* 440,559
Transportation* 4,100
* encumbered
Draws on surpluses are limited to 1.0% of operating revenue.
Amounts beyond 1.0% require Ministry approval.
28DEFERRED REV ENU ES
Deferred revenues are amounts
resulting from unused funds which
are required to be held for future
use, and are restricted by external
criteria. Most amounts are related to
deferral of capital funds which will be
drawn upon dependent on project
timing.
2015-2016 2016-2017 2017-2018 2018-2019
Act u al Act u al Est im at es Est im at es
Opening balance $ 18,810,560 $ 18,595,000 $ 24,529,047 $ 24,543,642
Contributions 14,373,722 17,646,753 89,595 14,722,637
Draws (14,589,282) (11,712,706) (75,000) (16,963,087)
Closin g balan ce $ 18,595,000 $ 24,529,047 $ 24,543,642 $ 22,303,192
The anticipated draws are mostly due to recognizing EDC revenues to offset land purchases and
International student tuition fees which are received one year in advance of student arrivals.
Com posit ion of Def er r ed Reven u e
Proceeds of Disposition $16,148,044
Other Third Party: Operating 4,292,358
Ministry of Education grants: Operating 1,758,992
Other Third Party: Capital 103,798
Board Policy requires management to balance within available funds in order to retain our
accumulated surpluses for future, non-recurring needs.
29EQAO RESU LT S
Education Quality and Accountability
Office (EQAO) testing is designed to
provide key information to interpret
achievement in the context of the
school, board and province. The
EQAO is an independent body
responsible for providing clear and
objective information about student
achievement.
High ligh t o f 2016-2017 resu lt s
El em en t a r y : Grad e 3 m at h , read in g, an d w r it in g exceed ed t h e Provin cial average by
5%, 2% an d 2% resp ect ively. Grad e 6 m at h an d w r it in g exceed ed t h e p rovin cial average by
2% an d 1% w h ile read in g sco res m et t h e p rovin cial average.
Seco n d a r y : Ap p lied m at h exceed ed t h e p rovin cial average by 11% w h ile acad em ic m at h
m et t h e p rovin cial average. Grad e 10 OSSLT fin ish ed sligh t ly u n d er t h e p rovin cial average
by 2%.
"EQAO scores are one of many tools we use to judge our progress as a school system. But they are just one snapshot in time and,
recognizing the uniqueness of every school and each cohort of students, they need to be analyzed carefully. We are particularly
pleased this year to note that where we have had the opportunity to provide intensive or increased support through the Renewed
Math Strategy, we are seeing positive gains. We hope to learn from the efforts in these schools in order to continue improving our
results across all schools in the region. We are proud of our staff who work diligently to bring all our students to success and we
will continue building on our foundation of strong results in Waterloo Catholic. Our students deserve nothing but excellence in
their classrooms, and we realize there is much more work remaiing to be done."
~ Loretta Notten, Director of Education
30GRA DUAT I ON RAT ES
Graduation rates reflect the work
done with students from Junior
Kindergarten through to Grade 12. All
schools work hard to ensure each
child reaches their full potential. This
requires a comprehensive
consideration of the needs of all
learners and an understanding of the
supports they require to succeed.
The anticipated five-year graduation rate as of August 2017 for students starting grade 9 in 2011-2012 is
preliminarily estimated to meet or exceed the Provincial average. However, this has not yet been confirmed
by the Ministry.
Both the Ministry and Board investments into the Student Success Strategy and Student Re-Engagement are
contributing factors to the overall success achieved.
Looking ahead, the Ministry
is hoping that further investment into
grade 7 and 8 Pathways will better
prepare students for high school, which
will help them succeed earlier. Research
shows that students who achieve all required
credits in grade 9 have a higher likelihood
of graduating than those who do not.
The Ministry publishes school board and
Provincial graduation rate averages annually.
The goal is to ensure that parents, teachers,
and school boards have access to data that
can help inform efforts to improve overall
student achievement.
* Note: At the time of publication, 2016-2017 five-year graduation rates are preliminary figures only
?There are many reasons a student might find themselves in danger of not graduating. Our job as educators is to determine the
root causes of each individual situation and then drill down via individualized support to provide the assistance the student needs
to succeed. The data indicates our re-engagement strategies are working, and that success, coupled with our strong EQAO
performance (at or above the provincial average in ALL measures), bodes well for the future success of our students. But a lot of
work remains to be done ? and we look forward to continuing our steady progress in positioning our students to graduate.?
~ Loretta Notten, Director of Education
31I NT ERNAT I ONA L EDU CAT I ON
The Board offers a wide variety of
educational programs to
international students in our schools
and through strategic partnerships.
International education and global
classrooms are strategies being
implemented by governments to
prepare students for opportunities in
the 21st century.
2015-2016 2016-2017 2017-2018 2018-2019
Act u al Act u al Est im at es Est im at es
Elementary 13 10 12 15
Secondary 189 162 175 195
Tot al 202 172 187 210
Revenue $ 4,095,661 $ 3,455,560 $ 4,635,200 $ 4,954,750
Expenditures 2,730,237 2,529,083 3,759,934 3,700,693
Net con t r ibu t ion $ 1,365,424 $ 926,477 $ 875,266 $ 1,254,057
The following map shows the current home
country of our International students:
Use of n et con t r ibu t ion s
Instructional oaches
Researcher
Religion and FSL resources
Computer technology
32PROGRA M HI GHL I GHT : FRENCH I M M ERSI ON
The Board's French Immersion
program operates as a dual track
system whereby students take
subjects in both French and English.
Registration in this popular program
is based on a lottery system.
French Immersion
In 2015-2016 the Board began offering French Immersion, starting in Grade 1, at Sir Edgar Bauer and St.
Anne (K) based upon available space, demand, geography, and considerations for equity. Our Lady of Fatima
was added in 2016-2017 as the program further demonstrated demand.
The Board conducted a French Immersion review in 2017-2018 as demand for the program was increasing,
and grade expansions posed difficulties at current sites. The review also considered challenges with
operating the program such as the ability to attract French teachers, registration, transportation and future
boundary reviews.
The recommendation of the committee was to continue current processes with respect to registration,
transportation and staffing, but to offer the program at St. Luke and Holy Rosary starting in 2019-2020, if
viable.
Not e:
2015-2016: grade 1: SEB, St. Anne
2016-2017: grades 1-2: SEB, St. Anne; grade 1: OLOF
2017-2018: grades 1-3: SEB, St. Anne; grades 1-2: OLOF
2018-2019: grades 1-4: SEB, St. Anne; grades 1-3: OLOF
3334
BU DGET SU M M A RI ES

Dashboard Report and Ministry of Education Compliance Report
Revenue and Expenditure Comparative Summaries

                                                 35
36
37
38
39
40
PL A NNI NG A REA REPORT S

Introduction
Planning Areas
2017-2018 vs. 2018-2019 Estimates by Planning Areas

Capital Budget
Capital and Debt

Operating Budget
Board Administration
Student Transportation
Operations and Maintenance
Learning Services

                                                  41
PL A NNI NG A REA S
The Board presents revenues and expenditures separated into capital and operating components, as
required by the Ministry and Board Policy. This separation is necessary since the funding sources each
have specific rules for use, and reporting requirements.
Capital Budget
Capital and Debt
- Interest on long-term debt and amortization of capital assets
Operating Budget
Board Administration
- Staff and departmental costs for support staff, senior administration, trustees
Student Transportation
- Staff, departmental and bus/taxi operator costs for Board share of Student Transportation Services
of Waterloo Region (STSWR)
Facility Services
- Custodial, maintenance, and construction staff, departmental costs and general facility operating
costs such as utilities for all sites
Learning Services
- Staff, department and resource costs for academic instruction and related programming including
Program Services, Student Services, Continuing Education and school budgets
4243
CA PI TA L BU DGET

The capital budget is comprised of interest on long term debt and amortization of capital assets. The cost
of assets are reflected on the balance sheet, and is not reported for budgeting purposes. Instead,
amortization of assets is shown as the expenditure over the expected life of the asset.

92.9% of debt principal and interest payments are supported by the Ministry through the GSN. The
remaining 7.1% relates to projects that are internally supported through draws on accumulated surpluses.
In 2016, the Ministry changed the way capital projects are funded, ending the requirement for school
boards to seek out debt for capital projects. Because of this, all boards will see reduced interest costs as
each year passes and debt expires.
The Financial Administration Act requires boards to match capital revenues with amortization costs.
Because of this, the cost of depreciation in most cases is net zero for budgeting purposes. As construction
and renovations continue, so too will capital revenues and amortization costs.

                                                      44
There are several sources of capital funding available to the Board. The Long Term Accommodation Plan
(LTAP) plays a key role in determining upcoming projects based on needs. Occasionally, the Ministry
provides targeted capital funding which helps the Board to undertake projects which were not planned.
The Ministry is continuing its
investment in school renewal by
maintaining its commitment to
invest a total of $1.4B in both the
2017-2018
and 2018-2019 school years.
The Ministry will invest $1.0B per
school year under the School
Condition Improvement (SCI)
program, which includes $200.0M
to support a new Greenhouse
Gas Reduction Fund (GGRF), and
another $40.0M per school year
to supplement the School
Renewal Allocation.
Acronyms:
EDC: Education Development Charges
FDK: Full Day Kindergarten
Hubs: Community Hubs
45CA PI TA L BU DGET
The age of schools, facility condition and school utilization rates help to prioritize Board projects. The
Ministry also uses these factors in allocating capital funding to boards.
Lan d Bu ildin g Ot h er Tot al
Huron Brigadoon and St. Boniface $ 4,635,514 $ 15,479,777 $ - $ 20,115,291
East Kitchener and Doon South 13,230,000 - - 13,230,000
Renewal and SCI projects - 10,299,346 - 10,299,346
St. Francis renovation - 2,141,980 - 2,141,980
Vehicles and other equipment - - 1,531,000 1,531,000
Community Hubs and GGRF - 1,407,211 - 1,407,211
Various construction projects - 835,709 - 835,709
Tot al expen dit u r es $ 17,865,514 $ 30,164,023 $ 1,531,000 $ 49,560,537
Utilization of facilities
reflect enrolment
compared to a
school's on the ground
capacity. It is evident
from the graph that
enrolment does not
equal capacity at most
schools. Management
uses this information
to plan for portables,
renovations, and
future capital requests
to the Ministry.
46The Board currently operates 48 elementary and secondary schools with an age range of less than 1 year
old to 120 years old.
Facility condition assessments, which determine the Facility Condition Index (FCI) are completed every 5
years by the Ministry to assess building components and systems. During the assessments, estimates are
made in terms of the timing of the replacement cost of each component. The FCI is calculated based on the
5 year renewal needs compared to the cost to replace the entire school. A high FCI indicates a high renewal
need. The formula is:
FCI = 5 Year Renewal Needs
Building Replacement Cost
Note: FCI is dependent upon
performed assessments. Due
to timing of work completed
and assessment quality, the
FCI's shown may not reflect a
building's actual condition.
? COM PA NY CEO
47OPERAT I NG BU DGET
The operating budget reflects the day-to-day operating costs of the Board for which the main driver for
funding is enrolment. The Ministry places restrictions on the use of certain funding, such as Special
Education, but the Board is able to exercise some discretion in the delivery of programs within funding.
The Board plans expenditures based on legislative requirements, contracts, Board policy and known
infrastructure needs. Management reviews annual spending by planning area to ensure funding can
adequately support initiatives.
2015-2016 2016-2017 2017-2018 2018-2019
Act u al Act u al Est im at es Est im at es
Learning Services $ 202,932,936 $ 208,749,029 $ 216,456,708 $ 233,673,922
Facility Services 21,331,766 21,994,253 23,260,428 24,838,582
Capital and Debt 18,009,205 17,915,802 19,178,768 18,822,430
Board Administration 6,962,844 6,732,715 7,300,426 8,319,437
Student Transportation 4,910,892 5,651,128 5,645,180 6,483,795
Tot al expen dit u r es $ 254,147,643 $ 261,042,927 $ 271,841,510 $ 292,138,166
48BOA RD A DM I NI ST RAT I ON
Board administration is comprised of staff and department costs for Financial Services, Human Resource Services,
Information Technology Services, Internal Audit and Supply and Administrative Services. The Director 's Office,
Supervisory Officers and Trustees are also captured here.
Number of administrative The Director of Education reports 2 student trustees are elected to
staff: 74 to the Board of Trustees represent their peers
2015-2016 2016-2017 2017-2018 2018-2019
Act u al Act u al Est im at es Est im at es
Board Administration $ 5,326,903 $ 5,043,705 $ 5,543,062 $ 6,481,285
Director and Superintendents 1,420,819 1,461,047 1,525,053 1,600,006
Trustees 215,122 227,963 232,311 238,146
Tot al Boar d Adm in ist r at ion $ 6,962,844 $ 6,732,715 $ 7,300,426 $ 8,319,437
Ch allen ges an d oppor t u n it ies
Su ppor t st af f :
The budget reflects additional staff for finance,
payroll, and human resource services in order
to respond to increased demands. Many
recent legislative changes have become
administratively intensive due to centralized
bargaining, benefits, and requirement for
better controls, continuity and reliability.
Ben ch m ar k in cr eases:
The budget supports collectively negotiated
increases, including an anticipated Trustee
honorarium adjustment expected in the fall.
Syst em s u pgr ades:
Several software implementations are
expected in the upcoming year to assist with
departmental efficiencies. Some computer and
telephone upgrades have also been built into
the budget.
49ST U DENT T RA NSPORTAT I ON
Student transportation for all students in the Region is co-ordinated through a joint consortium, Student
Transportation Services of Waterloo Region (STSWR). The budget represents the Board portion of staff and
departmental costs as well as bus and taxi operator costs to safely transport students from home to school.
Students transported via Students transported via Students transported to
yellow bus: 10,691 Grand River Transit: 46 Provincial Schools: 6
2015-2016 2016-2017 2017-2018 2018-2019
Act u al Act u al Est im at es Est im at es
Direct transportation $ 4,406,435 $ 4,732,069 $ 5,087,904 $ 5,497,188
STSWR administration 504,457 902,583 537,910 951,920
School travel planning - 16,476 19,366 34,687
Tot al St u den t Tr an spor t at ion $ 4,910,892 $ 5,651,128 $ 5,645,180 $ 6,483,795
Key st at ist ics:
Students transported: 34.5%
Average ride time:OPERAT I ONS A ND M A I NT ENA NCE
Operations and maintenance envelops the Facility Services department which is comprised of custodial, construction
and maintenance staff and department budgets. They are responsible for the structural condition, operation and
cleanliness of facilities. A welcoming, clean and safe environment contributes to the well-being of staff and students.
Number of custodians: 145 Number of temp custodians: 7 5,632 Community Use permits
Number of maintenance staff: 25 Administrative support: 10 granted for 9,383,818 hours
2015-2016 2016-2017 2017-2018 2018-2019
Act u al Act u al Est im at es Est im at es
Salaries and benefits $ 11,420,069 $ 11,848,518 $ 12,173,536 $ 12,686,303
Utilities 5,323,153 5,388,731 6,390,600 6,931,715
Contracts and supplies 4,547,014 4,722,148 4,539,392 4,739,764
Other 41,530 34,856 156,900 480,800
Tot al Oper at ion s & M ain t en an ce $ 21,331,766 $ 21,994,253 $ 23,260,428 $ 24,838,582
Key st at ist ics:
Number of facilities supported: 58
Total square footage supported: 11,587,406
Number of work orders annually: 8,262
Ch allen ges an d oppor t u n it ies
Ut ilit ies:
Rising utility costs require management. The
Energy Conservation plan assists the Board
with goals to reduce consumption and provide
savings; however controlling costs is difficult.
Veh icles an d equ ipm en t :
The budget supports replacement of
equipment and vehicles which are at the end
of their useful lives.
Ot h er :
The budget includes changes related to the
implementation of a Service Quality System for
Facility Services
51L EA RNI NG SERV I CES
Learning Services covers teaching and support staff and resources for academic instruction of the Boards' learners.
As expected, it is the largest component of the operating budget and includes program services, special education,
continuing education and school budgets.
Nurturing Our Catholic Student Engagement, Innovation Building Capacity to Lead, Learn
Community and Achievement and Live Authentically
2015-2016 2016-2017 2017-2018 2018-2019
Act u al Act u al Est im at es Est im at es
Salaries and benefits $ 191,855,407 $ 196,476,247 $ 203,860,525 $ 219,950,455
Textbooks and resources 6,724,368 6,750,169 5,972,045 6,605,225
Contracts and services 2,498,007 2,292,930 4,095,529 3,408,752
Staff development and other 1,855,154 3,229,683 2,528,609 3,709,490
Tot al Lear n in g Ser vices $ 202,932,936 $ 208,749,029 $ 216,456,708 $ 233,673,922
52L EA RNI NG SERV I CES: PROGRA M SERV I CES
Program Services is comprised of salary and benefit costs for teachers, support staff and consultants who directly
impact day school operations. They are responsible for curriculum training and must adhere to Ministry guidelines
and Board priorities. This can present challenges given many initiatives and limited resources.
Number of sites that offer Anticipated number of Extended The Extended Day program
Extended Day program: 37 Day students: 1,150 operates on a cost recovery basis
2015-2016 2016-2017 2017-2018 2018-2019
Act u al Act u al Est im at es Est im at es
Salaries and benefits $ 155,771,578 $ 159,401,727 $ 165,561,792 $ 178,079,108
Textbooks and resources 3,005,746 3,216,045 2,251,926 2,566,173
Contracts and services 2,113,680 2,058,073 3,770,440 2,942,629
Staff development and other 1,154,768 2,601,514 2,065,749 3,231,094
Tot al Pr ogr am Ser vices $ 162,045,772 $ 167,277,359 $ 173,649,907 $ 186,819,004
Ch allen ges an d oppor t u n it ies
In st r u ct ion al Coach es:
The budget reflects increased instructional
coaches to provide greater opportunities for
in-class professional development for teachers.
En glish as a Secon d Lan gu age (ESL):
Elementary ESL learners have increased by
72.7% over the prior year. Staffing to assist
with transitioning students has been reflected
in the budget.
Resou r ces:
The budget continues to support the plan for
upgrading French as a Second Language and
religion resources as part of a multi-year
curriculum renewal.
53L EA RNI NG SERV I CES: ST U DENT SERV I CES
Student Services is comprised of salary and benefit costs for teachers, support staff and consultants who support
special education programming. The Board believes that all children are capable of learning, understanding that each
child develops, and learns differently based on their own strengths and needs.
Number of Spec Ed Equipment SEAC advises and makes CCAT is administered in grade 4
(SEA) claims supported: 77 recommendations to Trustees to identify exceptionalities
2015-2016 2016-2017 2017-2018 2018-2019
Act u al Act u al Est im at es Est im at es
Salaries and benefits $ 28,620,688 $ 29,584,885 $ 30,652,163 $ 33,909,219
Textbooks and resources 191,179 187,812 248,692 267,386
Contracts and services 282,362 128,664 196,400 326,707
Staff development and other 686,339 619,054 449,110 456,646
Tot al St u den t Ser vices $ 29,780,568 $ 30,520,415 $ 31,546,365 $ 34,959,958
Ch allen ges an d oppor t u n it ies
M en t al Healt h Wor ker s:
Finding qualified professionals may present a
challenge for Ministry funded secondary mental
health workers.
Assessm en t s:
Targeted grant announced to address wait times
will be based on application process and is not
yet built into budget.
M u lt i-Disciplin ar y Team s (M DT):
The Ministry has provided support for staff to
build capacity and a deeper understanding of the
unique needs of students.
Pr edict ive m odellin g:
Management will launch a new High Needs
Verification process in 2018-2019 which will better
track where supports are needed and how they
are used.
54L EA RNI NG SERV I CES: CONT I NU I NG EDU CAT I ON
Continuing Education is comprised of staff and operational costs to operate one of the largest programs in the
province. Programming caters to learners over 18 focusing on language development for new Canadians, academic
credit courses and specialized certificate programs. The Board requires that the overall operations are break-even.
13,060 students with 24 course Secondary Day School credit is Offers 5 in-take terms and
offerings at 5 sites by 500 staff the core offering selected summer programming
2015-2016 2016-2017 2017-2018 2018-2019
Act u al Act u al Est im at es Est im at es
Salaries and benefits $ 7,463,143 $ 7,489,635 $ 7,646,570 $ 7,962,128
Contracts and supplies 1,011,796 943,832 1,078,516 1,149,518
Tot al Con t in u in g Edu cat ion $ 8,474,939 $ 8,433,467 $ 8,725,086 $ 9,111,646
Teacher shortages and increasing costs remain a challenge to run program offerings effectively. Growing
wait lists for ESL ensures program viability while secondary day school credit enrolment continues to
decline. Planning for relocating the main Kitchener campus in 2020 continues with program reviews to
ensure sustainability.
Key st at ist ics:
Year opened: 1988
OSSD graduates: 444 annually
Successful college applicants: 916
Successful university applicants: 268
International languages taught: 18
Number of elementary students in ESL: 2,100
PSW graduation rate: 85.0% for 140 students/year
Percentage entering workforce: 98.0%
55L EA RNI NG SERV I CES: SCHOOL BU DGET S
School budgets are allocated largely based on enrolment. It is the responsibility of the Principal to allocate funds as
needed for the school community. The funds are used to run the day-to-day operations of the school from classroom
resources to furniture and office supplies. These are separate and distinct from School Generated Funds.
Newest school: EcoSchool Certifications: Oldest school:
St. Brigid (2018) 27 Gold, 5 Silver, 2 Bronze St. Boniface (1898)
2015-2016 2016-2017 2017-2018 2018-2019
Act u al Act u al Est im at es Est im at es
Elementary $ 1,511,738 $ 1,530,702 $ 1,516,208 $ 1,603,694
Secondary 1,119,919 987,086 1,019,142 1,179,620
Tot al Sch ool Bu dget s $ 2,631,657 $ 2,517,788 $ 2,535,350 $ 2,783,314
Modified Social Risk Index (MSRI) provides a snapshot of socio-economic vulnerability within the Region. In
2018-2019, the Board invested funds into elementary schools with a high MSRI. This intentional investment
is to assist identified schools to address issues that they may face in the communities they serve.
Key st at ist ics:
Elem en t ar y
Base budget allocation: $92.00/student
Small schools (600 students): 3
MSRI impacted schools: 15
Secon dar y
Base budget allocation: $162.00/student
Small schools (1,501): 1
56L EA RNI NG SERV I CES: I NFORM AT I ON T ECHNOL OGY
Information Technology plays a central role to all areas within Board. Staff must be able to respond swiftly to changes
in order to remain current and keep students engaged. It is a constant challenge to adequately address emerging
technology trends due to both financial and human resource limitations.
Number of staff: 27 21st Century Learning invites Average age of devices:
Number of BYOD devices: 15,800 new pedagogies using technology 5 years old
2015-2016 2016-2017 2017-2018 2018-2019
Act u al Act u al Est im at es Est im at es
Computer replacement and repair $ 1,781,829 $ 2,267,349 $ 2,466,229 $ 2,334,371
Phone and internet fees 426,301 569,955 639,894 654,638
Software fees and licenses 276,248 280,769 363,444 406,275
Network fees 392,392 182,925 381,092 510,375
Professional fees and other 222,012 345,036 314,975 679,396
Tot al In f or m at ion Tech n ology $ 3,098,782 $ 3,646,034 $ 4,165,634 $ 4,585,055
Key st at ist ics:
Elem en t ar y
Student to computer ratio: 1:16
Student to Chromebook ratio: 1:3
BYOD: 353.0% increase since 2013
Printing devices: 260.0% decrease since 2013
Secon dar y
Student to computer ratio: 1:3
Student to Chromebook ratio: 1:3
BYOD: 522.0% increase since 2013
Wi-Fi access points: 219.0% increase since 2013
57You can also read