What will happen after the EU milk quota system expires in 2015?
←
→
Page content transcription
If your browser does not render page correctly, please read the page content below
What will happen after the EU milk quota
LEI Wageningen UR         LEI Wageningen UR is one of the world’s leading independent socio-economic
P.O. Box 29703            research institutes. LEI’s unique data, models and knowledge offer clients insight
2502 LS Den Haag          and integrated advice on policy and decision-making in an innovative manner, and
The Netherlands
E publicatie.lei@wur.nl
                          ultimately contribute to a more sustainable world. LEI is part of Wageningen UR
                          (University and Research centre), forming the Social Sciences Group together with
                                                                                                               system expires in 2015?
T +31 (0)70 335 83 30     the Department of Social Sciences and Wageningen UR Centre for Development
www.wageningenUR.nl/lei   Innovation.                                                                          An assessment of the Dutch dairy sector

                          The mission of Wageningen UR (University & Research centre) is ‘To explore
REPORT                    the potential of nature to improve the quality of life’. Within Wageningen UR,
                                                                                                               Roel Jongeneel and Siemen van Berkum
LEI 2015-041              nine specialised research institutes of the DLO Foundation have joined forces
                          with Wageningen University to help answer the most important questions in the
                          domain of healthy food and living environment. With approximately 30 locations,
                          6,000 members of staff and 9,000 students, Wageningen UR is one of the leading
                          organisations in its domain worldwide. The integral approach to problems and
                          the cooperation between the various disciplines are at the heart of the unique
                          Wageningen Approach.
What will happen after the EU milk quota
system expires in 2015?

An assessment of the Dutch dairy sector

Roel Jongeneel and Siemen van Berkum

This report is a product from the PPS Market Outlook Agro&Food, a public private partnership with participation
from the Dutch Ministry of Economic Affairs, LEI Wageningen UR and Dutch agribusinesses.

LEI Wageningen UR
Wageningen, April 2015

                                                                                REPORT
                                                                                LEI 2015-041
Jongeneel, Roel and Siemen van Berkum, 2015. What will happen after the EU milk quota system
expires in 2015?; An assessment of the Dutch dairy sector. Wageningen, LEI Wageningen UR
(University & Research centre), LEI Report 2015-041. 26 pp.; 13 fig.; 1 tab.; 17 ref.

This report can be downloaded for free at the E-depot http://edepot.wur.nl/ or at
www.wageningenUR.nl/en/lei (under LEI publications).

© 2015 LEI Wageningen UR
P.O. Box 29703, 2502 LS The Hague, The Netherlands, T +31 (0)70 335 83 30,
E informatie.lei@wur.nl, www.wageningenUR.nl/en/lei. LEI is part of Wageningen UR (University &
Research centre).

For its reports, LEI utilises a Creative Commons Attributions 3.0 Netherlands license.

© LEI, part of DLO Foundation, 2015
The user may reproduce, distribute and share this work and make derivative works from it. Material
by third parties which is used in the work and which are subject to intellectual property rights may not
be used without prior permission from the relevant third party. The user must attribute the work by
stating the name indicated by the author or licensor but may not do this in such a way as to create the
impression that the author/licensor endorses the use of the work or the work of the user. The user
may not use the work for commercial purposes.

LEI accepts no liability for any damage resulting from the use of the results of this study or the
application of the advice contained in it.

LEI is ISO 9001:2008 certified.

LEI 2015-041 | 2271000349

Cover photo: Shutterstock
Contents

     Preface                                                                                    5

     Summary                                                                                    6

     S.1   Key findings                                                                         6
     S.2   Complementary findings                                                               6
     S.3   Method                                                                               6

     Samenvatting                                                                               7

     S.1   Belangrijkste uitkomsten                                                             7
     S.2   Overige uitkomsten                                                                   7
     S.3   Methode                                                                              7

1    Introduction                                                                               8

2    International developments at the dairy markets in the next ten years                      9

     2.1   Projections ten year ahead                                                           9
           2.1.1 Assumptions and overall results                                                9
           2.1.2 Global dairy market highlights up to 2023                                      9
     2.2   Review of 2014 market developments and short term forecasts                         11

3    Expected developments in the Netherlands                                                  13

     3.1   Recent developments in Dutch dairy                                                  13
           3.1.1 Sector structure                                                              13
           3.1.2 Milk price and milk supply                                                    14
     3.2   Drivers of Dutch milk production                                                    16
           3.2.1 Milk and feed prices                                                          16
           3.2.2 Production capacity and production factors                                    17
           3.2.3 Environmental constraints                                                     17
     3.3   Expected Dutch milk supply                                                          20

4    Expected developments in the EU and some selected Member States                           22

     4.1   EU dairy production                                                                 22
     4.2   Evolution of milk supply in selected Member States                                  23

5    Uncertainties                                                                             25

6    Conclusions                                                                               28

     References                                                                                29

                                                                         LEI Report 2015-041   |3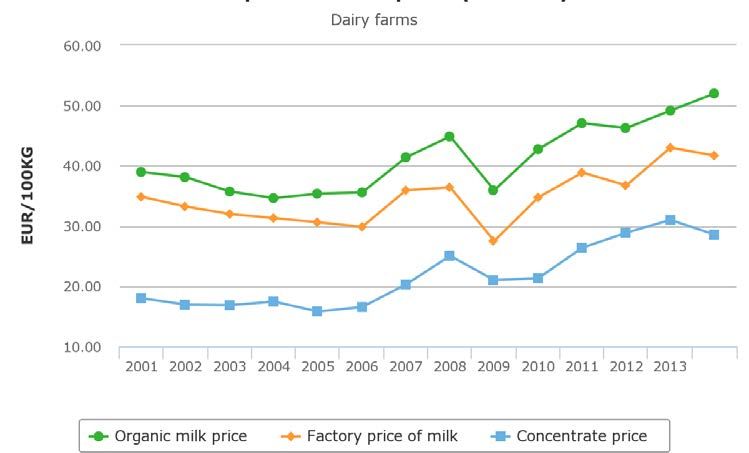
4| LEI Report 2015-041
Preface

This report presents a medium run outlook for the Dutch dairy sector. The milk quota has expired
after having been in place for more than 30 years. There is a clear interest to reflect on what the
implications will be for the Dutch dairy sector and its contribution to a still rising demand for dairy
products. This report is the product of the public private partnership project Market Outlook and
Intelligence Agro and Food (TKI-AF-12805), in which the Dutch Ministry of Economic Affairs, LEI
Wageningen UR and agribusinesses participate. The aim of the project is to provide market outlooks,
taking into account the most up to date information with respect to policy and macro-economic
developments, and also to provide information with respect to short-run developments by means of a
quarterly farm survey (agro-barometer). Within the project special attention is paid to developments
at EU member state level. By doing so the project aims to contribute to market transparency and
provide input for strategic planning in the agro-food supply chain.

Ms. L.C. van Staalduinen
Managing Director

                                                                                        LEI Report 2015-041   |5
Summary S.1 Key findings This report provides an assessment of what will happen after the EU milk quota system has expired 1 April 2015. It includes a medium term outlook, taking into account the conditions in world dairy markets as these are foreseen by the OECD-FAO in their Agricultural Outlook 2014-2023 as well as the medium term outlook for the EU published by the EU Commission December 2014. The Dutch milk supply is projected to increase by about 17 per cent in the coming decade. The increase is related to expected market conditions (e.g. milk price), but also to other drivers and structural issues characterizing the Dutch dairy sector. With the milk quota now no longer being a constraint, the challenge for the Dutch dairy farmers is to revise their production strategy to optimally and sustainably produce within environmental side conditions. S.2 Complementary findings With the milk quota no longer being in place also the milk production in the EU member states neighbouring The Netherlands is estimated to increase. More generally, milk production in northern EU (excluding Scandinavia) is expected to increase in the coming decade by about 12 million tons. S.3 Method The assessment presented in this study is based on a modelling exercise, using the AGMEMOD model. The outcomes of this have been discussed with experts inside and outside The Netherlands. The results presented in this study are a synthesis, taking into account these modelling and expert inputs. 6| LEI Report 2015-041
Samenvatting

S.1          Belangrijkste uitkomsten
Dit rapport bevat een verkenning van de impact die de afschaffing van de melk quotering per 1 april
2015 zal hebben op de Nederlandse melkproductie. Er wordt een middellange termijn projectie
gepresenteerd (tijdshorizon 10 jaar). Voor wat betreft de ontwikkelingen op de wereldmarkt en de EU
zijn de outlook-studies van de OECD-FAO (Agricultural Outlook, 2014-2023) en van de Europese
Commissie (2024 Prospects for EU Agricultural Markets) als uitgangspunt genomen. Naar verwachting
zal de Nederlandse melkproductie de komende 10 jaar een stijging laten zien met circa 17%. De
geprognosticeerde toename hangt af van de verwachte marktomstandigheden (in het bijzonder de
melkprijsontwikkeling), maar ook van andere factoren die bepalend zijn voor de structuur van de
Nederlandse zuivel. Nu de melkquotering is weggevallen wordt het de uitdaging voor de
melkveehouderijsector om haar strategie te herzien en in te zetten op een optimale en duurzame
productieontwikkeling, rekening houdend met de randvoorwaarden vanuit het milieu (mest).

S.2          Overige uitkomsten

Het wegvallen van de melkquotering beïnvloedt ook de ontwikkeling van de melkproductie in de
omringende EU lidstaten. Hun productie zal naar verwachting eveneens toenemen. Het algemene
patroon dat zich aftekent is dat melkproductie met name in het noorden van de EU (met uitzondering
van Scandinavië) zal groeien. De toename van de melkproductie in die landen wordt geschat op circa
12 miljoen ton.

S.3          Methode

De analyse zoals die in deze studie wordt gepresenteerd is gebaseerd op een kwantitatief economische
analyse, waarbij gebruik is gemaakt van de inzet van het AGMEMOD model. De uitkomsten van deze
analyse zijn daarna voorgelegd aan experts binnen en buiten Nederland. Dit is een gebruikelijke
procedure bij het maken van market outlook-analyses. De hier gepresenteerde uitkomsten zijn een
synthese die is gemaakt op basis van de modelinput en de inbreng van de experts.

                                                                                   LEI Report 2015-041   |7
1 Introduction The dairy sector is important to Dutch agriculture. Its share in the total value of agricultural production is close to 20%, where it ranks as the second most important sector, after vegetables and horticulture. The sector currently comprises about 18,600 dairy farmers, which together manage a herd of 1.6m dairy cows. The Dutch dairy system is pasture based, with dairy cows consuming the grass and roughage (in particular forage maize) coming from 1.2m hectares of pasture and fodder area (about one third of total cultivable area in the Netherlands). Alongside the roughage intake, an average Dutch dairy cow consumes about 2,000 kg of compound feed annually. The Netherlands has a mild climate which is very suitable for dairy production. While about 35% of Dutch dairy production is domestically consumed, 65% is exported, with the EU being the most important export market outlet. The more than 12m tonnes of raw milk produced is processed in about 50 processing facilities, owned by 22 dairy processing firms. With a gross production value of €6.3bn, the dairy supply chain has a share of 1.2% in the nationally produced value added, generating 60 thousand jobs in primary production, processing, wholesale and retail (ZuivelNL, 2014). 2015 will be a watershed for the EU and Dutch dairy sectors, because on 1st of April the milk quota regime has expired, after having been in place for more than 30 years. The end of the supply management regime in dairy will create new opportunities for dairy farmers to reposition their business. The abolition of the milk quota happens at a moment when prices of dairy products at world markets have been at the highest level since 2006. The demand for dairy products has been and still continues to increase, in particular because of the economic growth and expanding consumer demand in Asia. However, as has become clear, dairy product and milk prices in the EU not only have reached a higher level, they also have become more volatile as a response to the transformation of the classical price support regime of the CAP into a safety net provision, which only protects farmers against extreme downside price risks. As a result, prices for dairy products in the EU are increasingly related to world market prices, and are also affected by the volatility of these prices (Jongeneel and Van Berkum et al., 2010). This report provides an assessment of what will happen to the dairy sector and milk production in The Netherlands now the EU milk quota system has expired. In order to understand the Dutch situation, local factors (e.g. environmental regulation) will be highlighted, but also the broader context of international market developments. Because of the increasing importance of world market conditions for Dutch farmers, this report starts with an assessment of the main trends observed at the international markets (Chapter 2). This analysis is based on the most recent OECD-FAO Agricultural Outlook (released in June 2014), but also accounting for developments that occurred after this study was published. Chapter 3 discusses the background to and expected results of projections of the Dutch milk production, which is argued to increase by about 17% in the coming decade. The increase in Dutch milk supply is related to expected market conditions (e.g. milk price), but also to other drivers and structural issues characterising the dairy sector. The expected developments at EU level and details for a group of selected EU member states are discussed in Chapter 4. Chapter 5 highlights a number of uncertainties underlying the analysis, and Chapter 6 closes with concluding remarks. 8| LEI Report 2015-041
2               International developments at the
                dairy markets in the next ten years

2.1             Projections ten year ahead1

2.1.1           Assumptions and overall results

The OECD-FAO Outlook is presented as a baseline scenario that is considered plausible given a range
of conditioning assumptions. These assumptions portray a specific macroeconomic and demographic
environment which shapes the evolution of demand and supply for agricultural and fish products. Key
macroeconomic assumptions underlying the projections refer to population and GDP growth, inflation
and exchange rates, and energy (oil) prices. The assumptions are:
      •    A return to more sustainable economic growth, assuming an average annual GDP growth of
           2.2% for OECD countries. The non-OECD area will grow faster, although growth rates will be
           below the previous 10-year average in China and India, whereas the EU15 growth rate will be
           less than the OECD average.
      •    Inflation rates in OECD remain moderate, yet problematic in many emerging economies.
           Inflation differentials drive exchange rates. The assumptions on exchange rates during the
           next decade are characterised by a stronger US Dollar compared to other currencies in line
           with the recovery of the US economy. This implies, for instance, that Brazil’s competitiveness
           increases.
      •    World oil prices are assumed to continue to increase over the outlook period (2.8% annually
           in nominal terms) to reach USD147 per barrel, encouraging further biofuel production.
      •    Policy assumptions. Basically known and relevant policies in early 2014 are assumed to
           continue. Projections for the US are based on the 2008 Farm Act (not on the Agricultural Act,
           signed in February 2014) which was assumed to be extended and remain in effect through the
           period. For the EU, the baseline reflects only in part the reform of the common agricultural
           policy (CAP) towards 2020: expiry of the milk quota as of 2015, expiry of the sugar quota
           system as of 2017, budget ceilings for decoupled single farm payment and coupled payments
           are expected to stay at the current level.

The Outlook indicates that global food consumption continues to increase but at a slower rate than in
the previous decade. Growing incomes and urbanisation result in a shift in diet from a cereal-based to
protein-rich diet, with more processed and prepared foods. Population growth and changing dietary
preferences drive the demand for dairy (and meat) products, which requires an expansion of livestock
production. The latter also implies a greater demand for feed grains and oilseeds. The rate of
production growth is constrained by different factors, including increasing costs of production, limited
expansion of agricultural land, environmental concerns and changes in the policy environment. These
factors are relevant in most countries but with different weight and hence impacts on a country or
regional scale. As in the past decade, projected production growth through the outlook period will be
led by Latin America, Sub-Saharan Africa, Eastern Europe and parts of Asia, with production growth in
Western Europe increasing only marginally. Developing regions will account for more than 75% of
additional agricultural output over the next decade.

2.1.2           Global dairy market highlights up to 2023

Figure 2.1 below summarises the expected developments of per capita consumption of dairy products.
In developing countries dairy is mostly consumed in fresh form, but consumption of cheese and milk
powder is expected to increase (respectively on average 1.9% p.a and 1.2% annually). The expansion
in demand reflects robust income growth, expanding populations and a further globalisation of diets.

1
    This section summarises projections from OECD-FAO Agricultural Outlook 2014-2023 (June 2014)

                                                                                                   LEI Report 2015-041   |9
Consumption growth figures are much lower in developed countries, but total consumption of dairy
products in milk equivalents is still considerably higher than in developing countries. The difference
stems mostly from the per capita consumption of cheese which in developed countries is more than
ten times the per capita consumption in developing ones.
kg/capita, milk equivalent
400
350
300
250
200
150
100
50
0
Europe North America North Africa Latin America and World Asia and Pacific Sub-Saharan Africa
Caribbean
Per capita consumption (PCC), 2011-13 average Per capita consumption (PCC), 2023 level
Figure 2.1 Dairy consumption projections in the world, per region
Source: OECD, Agricultural Outlook, 2014-2023
Over the next decade, world milk production growth is expected to slow down from 2.2% to 1.9% p.a.
Four out of five extra litres of milk produced will originate from developing countries, where most of
the production growth stems from an increase in the dairy herd, compared to yield growth. India is
expected to outpace the EU and will become the largest milk producer in the world (see Figure 2.2
below). In their Agricultural Outlook, the OECD-FAO project only sluggish growth in EU milk production
over the coming decade (0.5% p.a., however see Chapter 4 for a more recent estimate of the EU
Commission). According to the OECD-FAO, the milk quota abolition is likely to have little impact on the
overall milk production in the Union although some regional concentration is expected to occur. EU’s
slow production growth is mainly explained in terms of being a response to little growth in EU
domestic demand and its relatively high production costs. The latter constrains the EU’s ability to
participate in the faster growing export markets.
European Union
India
United States
China
Pakistan
Russian Federation
Brazil
New Zealand
Turkey
Argentina
Ukraine
Australia
Mexico
Canada
Japan
Colombia
0 25 50 75 100 125 150 175 200 225
2011-13 2023
Mt
Figure 2.2 Outlook for milk production
Source: OECD, Agricultural Outlook, 2014-2023
10 | LEI Report 2015-041Reviewing the recent past, OECD-FAO note that milk and dairy product prices on the global market
increased in 2013 due to a large production shortfall in China and increasing feed costs. Also, major
exporters of cheese, butter and milk powder to the world dairy market – the United States, the EU,
New Zealand and Australia – produced less milk than in 2012. In the second half of 2013, though,
production in the major dairy exporting countries started to react to the price signals, also because
prices for feed grains declined considerably since mid-2013. Combined with an expected recovery of
the domestic milk production in China, this will likely lead to declining dairy and milk prices in the near
future, according to OECD-FAO’s estimate.
Over the medium-term, increasing incomes and globalisation of diets are expected to raise the
demand for milk and dairy products in developing countries. Most of the growth in demand will be
satisfied domestically by increasing dairy herds and rising yields. Increasing import demand
(especially by countries in Asia and Africa) will support prices of dairy products during the next
decade. Cheese prices are expected to develop the strongest over the outlook period. On the other
hand, butter prices are expected to remain below SMP prices in the next decade (see Figure 2.3).
6 000
USD/t
5 000
4 000
3 000
2 000
1 000
0
1993 1998 2003 2008 2013 2018 2023
Butter Skim milk powder Whole milk powder Cheese
Figure 2.3 Prices of dairy products
Source: OECD, Agricultural Outlook, 2014-2023
2.2 Review of 2014 market developments and short term
forecasts
The OECD-FAO Agricultural Outlook 2014-2023 has been published in June 2014 and is based on data
available until early 2014. In the meantime things have changed, notably the oil price and exchange
rate figures (see also chapter 5). This section adds a review of 2014 agricultural market and price
developments in order to update the base for our own mid- and longer term outlook of the EU dairy
market. Thereby use is made of the short-run outlook and 2024 Prospects for EU Agricultural Markets
as published by the EU Commission (2014a and 2014b).
The 2014 cereal harvest reached an all-time record of more than 2.5bn tonnes, improving world
2
stock-to-use ratios for cereals up to 25% in early 2015. As a result international prices for all cereals
declined to its lowest level since July 2010, the decline being most pronounced for wheat, followed by
2
http://www.fao.org/worldfoodsituation/csdb/en/ retrieved March 5, 2015
LEI Report 2015-041 | 113
maize. In addition to countries such as Argentina, Russia and Ukraine, the EU accounted for wheat
production gains, hitting record levels too, driving higher than average exports and allowing for
cheaper feed. The latter is expected to benefit the livestock sector. In addition, oilseeds prices also
show a downward trend since summer in anticipation of large harvests in the US (soybean) and the EU
(rapeseed). Both cereal and oilseed market developments contribute to downward price trends of all
main feed commodity compounds.
At the same time, milk and dairy markets showed declining prices throughout 2014. In response to
increasing prices in the course of 2013, milk production continued to climb in major exporting
countries for most of 2014. However, international dairy prices have plummeted due to increased
global milk production, lower import demand (especially from China), the Russian ban on imports
of dairy products from several major producers (EU, USA and Australia), and a strengthening
dollar. Businesses and experts’ expectations (at Agrimoney.com, 5 January 2015) all indicate that
dairy prices will be under pressure during 2015, whereas the speed at which they recover will
depend on drawing down stocks that will have accumulated in exporting and importing countries.
The latest EU (weighted) average milk price is available for December 2014 (pictured March 5). At
that date the average price paid to farmers was 18% less than in December 2013, with some member
states showing an further decline of prices (e.g. Netherlands: - 30% and Germany: -23%). This trend
in prices did not lead to the lowering of production: for the milk year beginning April 2014, there is a
cumulative year-on-year increase of 4.2% at EU level (Dairyco.org.uk/market- information website).
The EC explains the rather slow reaction of farmers to lowering prices by stating that milk collection
has been stimulated by very good forage availability, including during the summer, and by strong milk
4
prices (EC, 2014) . Moreover, the number of dairy cows increased because farmers have been
preparing for milk quota abolition in April 2015. For the whole year 2014, the EC projects EU milk
deliveries could reach 146.4m tonnes (+3.7% compared to 2013). In 2015, milk collection could
increase further by up to 1.6%, which is significantly less than in 2014. Three main elements will play
a role in this lower increase: a decrease in milk collection in the first quarter of the year in the Member
States bound by the quota, a rebound after the quota expires in these countries (though lower than
previously expected) and a slower supply increase in the other countries due to lower milk prices
expected next year.
The first indications of a slowdown in growth of milk production in the EU is that December 2014
showed a 1.3% production increase compared to December 2013, a growth rate that is significantly
below the overall 2014 average. Moreover, this figure includes a 16.8% drop in output in Ireland,
where producers face penalties for overproduction. With a farm gate price quoted at around or
even below €30/100 kg, penalties of €28/100 kg will be an effective incentive not to produce over-
quota milk in many countries.
With EU’s production growth slowing down and drought doing the same in New Zealand, international
dairy product prices are likely to recover in the first months of 2015. However, the signs of a price
5
rally, if any, are fragile (see Agrimoney news items for latest figures and stories). Some market
analysts are optimistic because milk price decline early 2015 was less than initially expected.
However, Fonterra, a leading dairy company, kept its forecast for the price it will pay to its farmers at
an eight year low level (28 February), although dairy commodity values had risen. Rabobank said that
‘global supply is still relatively strong in most key export regions’, although acknowledging that
‘production growth is now slowing’. And China, the top dairy importer, ‘remains mostly sidelined by
the market’ thanks to slowing growth in domestic demand. ‘A major recovery in global commodity
markets is still a few months away’, the bank said (Agrimoney.com, 28 February).
3
http://www.fao.org/worldfoodsituation/foodpricesindex/en/ retrieved March 5, 2015
4
EC, DG AGRI (2014). Short term outlook for arable crops, dairy and meat markets in 2014 and 2015. Short term Outlook
no. 10. Autumn. Data available until 15 September 2014 have been used.
5
Note that the (monthly) FAO dairy price index increased from 174 in January 2015 (lowest level since July 2010) to 182 in
February 2015
12 | LEI Report 2015-0413 Expected developments in the
Netherlands
3.1 Recent developments in Dutch dairy
3.1.1 Sector structure
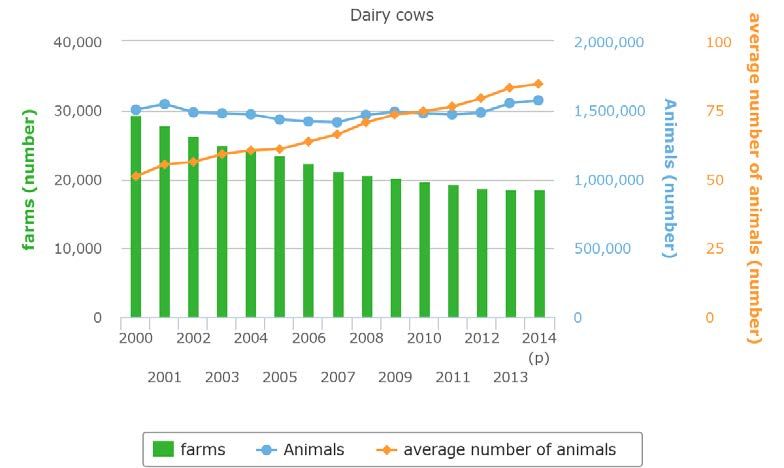
Figure 3.1 summarises the evolution of the Dutch dairy sector over the period 2000-2014. This is a
period for which the milk quota still applies. During the quota period a steady decline of the dairy cow
herd is observed: in the period 1983-2007 the total dairy cow herd declined by 41% or by of about
2.1% per annum. This decline reflects the milk yields growth per cow, as well as the quota constraint
faced by farmers. As a result of the EU’s so-called soft landing-policy strategy, over the period 2009-
2014 the milk quotas have been annually increased by 1%. In several EU member states this soft
landing strategy implied a gradual phasing out of the milk quota, viz. the milk quota constraint not
being binding anymore. In the Netherlands, though, the quotas have been effectively constraining
milk production continuously.
Figure 3.1 Evolution of the Dutch dairy sector in the period 2000-2014
Source: LEI, Agrimatie based on CBS Landbouwtelling.
Figure 3.1 also illustrates that the size of the dairy herd of the average dairy farm has increased
steadily from about 50 in 2000 to more than 80 animals in 2014. This increase in scale continued
irrespective of the quota system, although it has been facilitated by the tradability of the milk quota in
the Netherlands. As Figure 3.2. shows, the increase in herd size or dairy farm scale allows farmers to
reduce their per unit cost of milk production, or equivalently to increase their margin per litre of milk
produced. The cost of production is derived from LEI's FADN (various years). The per unit cost of
production is influenced by various factors, of which labour costs and feed costs are represented
separately. Figure 3.2 shows that the cost of production of milk declines with the increase in farm size.
This is in particular due to the decline in labour costs per kg of milk, as well as the decline of other
costs. The latter category includes a variety of costs, including the per unit costs associated with fixed
factors (e.g. buildings, equipment, machinery), which clearly show a tendency to decline with
increasing farm size. Roughly speaking each additional 15 dairy cows contribute to a decline in the per
unit cost of milk by 1 eurocent/kg (for a farm expanding from 60 dairy cows to 75 dairy cows this
LEI Report 2015-041 | 13implies a pure cost reduction gain of about €6,000). From some additional analysis it was estimated
that under the current conditions (based on 2011-2013 data), the optimal farm scale (the farm scale
6
associated with the minimum per unit cost of production) is at a herd size of about 210 dairy cows .
Note that with respect to feed costs differences in performance over different farm sizes are negligible.
This phenomenon of scale economies provides dairy farmers with a clear incentive to expand their
farms.
60 250
50
200
40
150
30
100
20
50
10
0 0
500.000 euro SO
other costs labour costs
compound feed costs number of dairy cows
Figure 3.2 Costs of production and the size of dairy farms (2011-2013 averages)
Source: LEI FADN, averages over 2011, 2012 and 2013. Note: SO = standardized output.
Based on information about the farm characteristics underlying Figure 3.2, the average milk
production per hectare is estimated to be close to 15 thousand kg, with relatively large farms having a
higher than average milk production per hectare of land (grassland and forage area). So, large farms
are using land in a more intensive way and are also using more purchased (roughage and
concentrate) feed input per cow than small farms.
As Figure 3.1 shows, the number of dairy cows has increased since 2012. This could be seen as an
anticipating response of Dutch dairy farmers to the announced milk quota abandonment on 1 April
2015. Dutch milk supply has increased also in these years (see also Figure 3.4 below), thereby leading
to production in excess the quota level.
3.1.2 Milk price and milk supply
As has been shown in the previous section, the dairy herd and the average size of a farm has
increased substantially over time, and thus also the milk output per dairy farm. The aggregate milk
supply remained roughly within the boundaries of the milk quota levels, with some minor deviation to
those levels. As can be observed from the recent past, although the milk quota system has remained
in place, milk prices in the EU have been much more volatile since 2007 (see Figure 3.3). In the
period 1982-2006 the average variability of the milk price (difference between highest and lowest
observed price) was about 4.5 eurocents/kg. This variability mainly resulted from seasonality. More
recently, this variability has roughly doubled to 9.7 eurocents/kg (average for the period 2007-2015).
The increased variability, which is equivalent to nearly 30% of the average milk price over this period,
6
The optimal farm scale is a variable that is dependent on technology and prices and as such a number that will move over
time.
14 | LEI Report 2015-041is mainly due to the increased transmission of movements in dairy product prices at world markets to
the Dutch or EU dairy market. This is the result of EU policy changes to reduce export subsidies and
lower intervention prices for dairy products.
Figure 3.3 also shows how the price support has been brought down since 2004. The intervention
price has been stepwise lowered to a level equivalent to €0.213 per kg of (standardised) milk. At this
low level, price support is offered only as a safety net in order to cope with very extreme events. Note
that after the introduction of the milk quota system in 1984 (with quota allocated applying some
formula to the 1983 deliveries) initially milk prices (measured in nominal terms) increased until about
1988, after which they have roughly been stable (except for the regular seasonal variation) until early
2000. Thereafter prices gradually declined in both nominal and real terms mainly as a result of the
declining price support following from the Midterm review of the CAP. This reform implied a stepwise
reduction of SMP and butter intervention prices by 15 and 25 per cent respectively, while also the milk
quota were stepwise increased by 1.5 percent (known as the soft landing strategy).
Figure 3.3 The Dutch milk price evolution: monthly farm gate price for raw milk
Source: DG-AGri, Milk market observatory
Figure 3.4 shows the evolution of Dutch milk production since the introduction of the milk quota in the
early 1980s. After a few quota-reduction rounds, the milk quota stabilised Dutch milk supply around
7
11m tonnes in the period 1991-2006, after which a gradual increase took place . This increase roughly
followed the gradual quota increase that was part of the EU’s so-called soft landing-strategy. In 2013
milk supply increased by about 4.7%, while the number of dairy cows increased by about 4%. In 2014
Dutch milk production showed again further increase by an estimated 2.5%. The growth in milk supply
beyond the quota level reflects how farmers were anticipating the announced milk quota
abandonment. It might also be a response to the growing uncertainty in these years with respect to
new environmental regulatory constraints that might be imposed to the sector. The total dairy cow
herd in 2014 is about 1.57m dairy cows, a number comparable to the dairy herd in 1996. For
comparison: in 1983 the total herd size amounted to 2.5m dairy cows, implying the current herd size
to be about 38% lower than that of 1983.
7
The sharp fluctuation in 2001 is related to a foot and mouth disease outbreak.
LEI Report 2015-041 | 1513500
13000
thousand ton 12500
12000
11500
11000
10500
10000
1982
1983
1984
1985
1986
1987
1988
1989
1990
1991
1992
1993
1994
1995
1996
1997
1998
1999
2000
2001
2002
2003
2004
2005
2006
2007
2008
2009
2010
2011
2012
2013
2014
Figure 3.4 Evolution of Dutch milk supply in the period 1982-2014
Source: LEI: Landbouwcijfers, various years and AGMEMOD-database
The gearing up in readiness for expansion of milk production in the quota-free period and the over-
quota production in milk year 2013/14 of about 475m kg implies that the Netherlands will have to pay
a super levy of about €140m (other countries with super-levy payments are Germany (€300m),
Poland (€160m), Ireland (€75m) and Denmark (€29m)). This is the highest super-levy bill since the
introduction of the milk quota in 1984. It is expected that the over-quota production in 2014/15 will
be more limited (see Chapter 2), but still the Netherlands will have to pay a significant levy to
Brussels. The EU Commission recently decided that EU dairy farmers may pay their super-levy bills in
three interest-free instalments, which are likely to be spread over the period 2015-2017.
3.2 Drivers of Dutch milk production
This section considers key drivers of future Dutch milk supply. Three drivers have been identified,
being the margin per kg of milk produced to dairy farmers, the production capacity at farm level and
the regulatory framework. It is assumed that all milk produced can be marketed and sold (see Chapter
5, where this issue is addressed). The demand side is therefore not separately assessed as a driver,
although its influence is recognized to be important and will affect farmers via the milk price.
3.2.1 Milk and feed prices
Two key factors determining the margin farmers make on producing milk are the farm gate milk and
feed prices. As Figure 3.5 shows, the factory price of milk and the feed concentrate price tend to move
in a similar direction. However, as also can be seen from Figure 3.5 the milk price/feed price ratio
tends to slightly worsen over time (the margin narrows) and, as was already noted before, since 2007
8
the variability of milk as well as feed prices increase. Based on the outlook at the international
markets for dairy products and the expected cereal and oilseed market developments (contributing to
a downward trend of all main feed commodity compounds; see Chapter 2) the milk/feed price ratio is
expected to increase over the coming years. However, in the Dutch dairy system for which grazing
and own roughage production (silage grass and silage maize) are important characteristics
(concentrate) feed costs is only a part of the farmer’s production costs (see Figure 3.2). The
assumption underlying the projection of future milk production follows from the modelling analysis and
implies a further decline of the output/input price ratio (see Figure 3.7 for further details), basically
indicating that labour and ‘other’ costs will become more important in milk production costs.
8
As can be derived from Figure 3.5, the milk price/concentrate price ratio tends to decline over time, although it fluctuates
from year to year. Early 2000 the milk price/feed price-ratio was about 1.9, whereas in 2013/14 it has declined to 1.4. For
a good comparison one should also account for changes in the feed efficiency per kg of milk (feed conversion rate).
16 | LEI Report 2015-041Figure 3.5 Milk and compound feed prices, 2000-2014
Source: LEI, Agrimatie based on FADN
3.2.2 Production capacity and production factors
A second factor which will co-determine future milk production is the production capacity. Dairying is a
capital intensive sector and as such expanding dairy production requires serious investments into
production factors like land, buildings, machinery and dairy herd. In the Dutch situation land is a
scarce and expensive factor (see further details below). As regards the production capacity as defined
by stables or cow sheds, the dairy sector made substantial investments in recent years, partly
renovating old buildings but also expanding its production capacity. Moreover, due to the milk quota
and the over time increasing milk yields (genetic progress) cow numbers declined, creating spare
capacity in the existing stables. It is estimated that the underutilisation of the existing stables allows
for about 10 to 15% increase of the Dutch total dairy cow herd, without needing any further
investments.
As regards the projections of future milk output, the observation presented above implies that
considerable production expansion is possible within the current capacity. Taking into account an
autonomous milk yield growth of about 1% per annum, during the next decade milk production could
expand by about 20% (10% more cows having a 10% higher yield) without needing extra investments
9
beyond the normal level of investments (replacement investments). Whether these idle capacities will
be used once the quota expires depends to a great extent on the environmental regulatory framework.
This issue is discussed in the next subsection.
3.2.3 Environmental constraints
The Dutch government wants a sustainable growth of the dairy sector, implying that the constraints as
they follow from the Nitrate Directive will be taken into account. In collaboration with the sector a plan
has been made in 2014 which has led to the law “Verantwoorde groei melkveehouderij” or Responsible
Growth Dairy Farming (RGDF) adopted December 2014 and applicable to the sector from 1 January
2015. Key elements in the RGDF law regulating the space for manoeuvre for the dairy sector are:
9
Note that this refers only to capital goods and not to land. When the production will be tied to land, increasing production
would most likely imply additional investments in land, thereby increasing the marginal costs of producing additional milk.
LEI Report 2015-041 | 17• The phosphate production from dairy cows is determined at farm level by taking the animal
numbers in 2013 and multiply these with the manure excretion standards (forfait-based) for
2015;
• The calculated phosphate output is compared to the land a farmer has in use and the 2013
application norms;
• The difference between the calculated phosphate production and the possibilities to place this
on the land in use is the so-called Phosphate reference 2013. All dairy farms having no
manure surplus get a Phosphate reference of zero. The Phosphate reference is farm specific
and non-tradable among farmers but it can be moved on the farmers’ successor (requiring a
first degree family relationship between the farmer and his successor).
• A dairy farmer having a zero Phosphate reference may expand his business utilizing still
unused placement possibilities on the land he uses. Farmers having a non-zero Phosphate
reference can produce within the existing limits (produce up to their Phosphate reference
2013), which then will usually imply that they have to find outlets for the surplus part of their
manure, i.e. placing this at other farmer’s land by making manure placement agreements.
Any growth beyond the Phosphate reference (the so-called dairy cow phosphate surplus) will
have to be compensated by either acquiring more land (including farmer to farmer contracting
of land), 100 percent manure processing or a combination of both measures (EZ, 2015a).
The RGDF-law ensures that growth of the dairy sector will take place within the limits as imposed by
the Nitrate Directive. As such this does not imply that dairying has to be tied to land. Already soon it
became clear that, from an economic point of view, expansion of dairy production combined with
100% manure processing (landless-growth) could become an attractive option (EZ, 2015a). However,
linking dairy production to land has been a broad concern that is to different degrees shared by
society, politics and also stakeholders in the sector (dairy processors, farmers union LTO). For that
reason the legislator announced already in December 2014 that additional conditions would be added
10
to the RGDF in order to preclude landless-growth of milk production in The Netherlands .
The additional conditions imposed on farmers beyond what has already been specified by the RGDF
are determined by an order in council (Algemene Maatregel van Bestuur). A draft order has been
published 30 March 2015, which indicates that, depending on their current phosphate surplus per
hectare, dairy farmers that would like to expand their production beyond 2014 levels have to acquire
additional land in order to be able to place part of the additionally produced manure on this (EZ,
2015b). Dairy farmers having a dairy cow phosphate surplus of more than 50kg per hectare and that
are further expanding production will be allowed to offer a maximum of 50% of the additional manure
for being processed. The remainder or other half has to be placed on land taking into account the legal
application standards (see Figure 3.6). Dairy farmers with a dairy cow phosphate surplus in the range
of 20 to 50kg phosphate per hectare of land are allowed, when they expand milk production, to have
75% of the additionally produced manure processed (see Figure 3.6). The remainder 25% will have to
be put on land. Farmers having a dairy phosphate surplus of less than 20 kg phosphate per hectare
face no additional restrictions when they are growing (they may, within limits, opt for landless
growth). So farmers having a dairy cow phosphate surplus of 20 kg phosphate per hectare or more,
when expanding their production, will also have to expand their land base. This can be done in non-
proportional way: a farmer expanding its milk production by x% will have to increase its land base
with less than x%. As figure 3.6 illustrates, the higher the dairy cow phosphate surplus, the more land
will have to be attracted per unit of milk production expansion. This implies that for dairy farmers that
have already an intensive way of production (have a relatively high milk production per hectare of
land) achieving additional growth has become more costly since it will require making additional costs
or investments for attracting land.
10
Several scenarios have been analysed which could strengthen the link of dairy production to land (pasture and forage
area) (see De Koeijer et al, 2014 and 2015 for details).
18 | LEI Report 2015-041Figure 3.6 Relationship between dairy cow phosphate surplus and manure processing.
Summarising, this set of rules implies that milk production becomes more closely tied to the land.
Although it more or less accepts the situation in 2014 as a status quo, additional growth beyond that
level will require additional land for all farmers having a surplus of 20kg phosphate or more. In 2013
about 75% of the dairy farms had a dairy cow phosphate surplus of less than 20kg/ha. About 14%
had a surplus in the range of 20-50kg phosphate per hectare and 12% had a surplus of 50kg or more
11
(EZ 2015a) .
Although a detailed assessment was beyond the scope of the current analysis, it is felt that the new
12
legislation still allows for considerable growth possibilities of the Dutch dairy sector . The hectares of
land the dairy sector could attract, either purchasing or renting it, or because they are able to fix
manure placement rights to land owned by other sectors (e.g. the arable sector), will determine how
much manure can be placed, which in turn determines the maximum amount of dairy cows and/or
13
milk that can be produced .
The total phosphate plafond applying to the Netherlands amounts 173m kg. Within this limit as
specific phosphate plafond for the dairy sector an amount of 84.9m kg. phosphate is sometimes
14
used . Further increase in the dairy cow herd might create a risk that the dairy specific phosphate
plafond might be hit and might even go to be exceeded. According to De Koeijer et al as compared to
the situation in 2009 a 20 percent increase in milk production will be possible within the limit of the
phosphate plafond, taking into account that the sector will take several measures to reduce the
amount of phosphate excretion (for example by developing concentrate feeds with low phosphate
15
levels) .
11
De Koeijer et al (2015) has as estimates 70, 20, 10, which is slightly different.
12
The Order in Council specifying the additional conditions was published in the same week as this study was finalized.
Moreover, assessing the implications of the new rules will require a detailed analysis at farm level, whereas the focus of
this study is at sector level. The sector model tool used for this analysis does not easily allow for inclusion of the impact of
the new legislation without having an analysis at micro-level underpinning it.
13
See for details about the manure excretion and manure application rates Remmelink et al. (2014 ).
14
Note that under the current legislation there are restrictions on the exchange or substitution of manure between sectors
(e.g. between dairy and the intensive livestock sector). There is still a slack in the total manure that can be produced
according to the plafond. See for details De Koeijer et al 2014.
15
Secretary of State Dijksma has announced that expansion of manure production beyond the phosphate plafond will lead
to additional measures for the sector.
LEI Report 2015-041 | 193.3 Expected Dutch milk supply
The expected milk supply will be co-determined by the expected milk price (see drivers discussed in
previous section). The future milk price in the Netherlands will be a derivative of the prices that can be
made for different dairy products (e.g. butter, cheese, yogurts, skimmed milk powder, whole milk
powder, whey, other dairy ingredients) at different markets (domestic and world market). Figure 3.7
provides an estimate of the projected milk price evolution, taking into account conditions at aggregate
EU and world market for dairy products, as foreseen in the latest OECD-FAO’s Agricultural Outlook
(see discussion in Chapter 2) and a further refined analysis of the responses by EU member states, as
16
derived from the EU baseline analysis with the AGMEMOD modelling tool . As Figure 3.7 shows, the
milk price in 2015 is expected to be lower than that of 2014. In 2016 a further decline in the milk
price is expected, which is mainly caused by the increase in milk supply due to the quota abolition.
Figure 3.7 also includes an index representing the input cost evolution, which includes alongside the
cost of feed also other costs, such as costs associated with energy, veterinary services and capital
costs. As can be seen from the figure the rate of increase of costs is higher than the milk price
increase, implying a worsening of the output/input price ratio over time.
40.00 120
115
35.00
110
index 2014=100
euro / 100 kg
30.00 105
100
25.00 95
90
20.00
85
15.00 80
2014 2015 2016 2017 2018 2019 2020 2021 2022 2023 2024
farm gate price of milk input cost index
Figure 3.7 The projected producer price of milk at farm level (euro/100kg, excluding VAT;
standardised at 3.7% fat and 3.5% protein) and cost index for The Netherlands
Source: based on own calculations and AGMEMOD modelling market outlook analysis
The projected Dutch milk supply, taking into account the milk price evolution as presented above, is
presented in Figure 3.8. This estimate is based on input from the AGMEMOD outlook modelling tool,
the results of which are adjusted according to expert information from and gathered by the authors.
The Dutch milk output is expected to increase to 14.9m tonnes by 2024 (+17.4% to 2014). The grey
lines provide a kind of confidence interval, emphasising the uncertainty with respect to the regulatory
constraints and their impact on the evolution of the dairy cow herd. The lower grey line (lower bound)
assumes that the dairy cow herd will not be allowed to exceed 1.6m dairy cows. Moreover, it is
assumed that the phosphate excretion per kg of milk can be reduced by innovations in the compound
feed technology. Together these assumptions approximate the estimated possible growth in milk
production under relatively strict environmental constraints (not allowing competition for manure
placement between sectors, satisfying the phosphate plafond specified for dairy). The upper bound
16
AGMEMOD is an econometric, dynamic, multi-product partial equilibrium model that allows to make projections and
simulations in order to evaluate measures, programmes and policies in agriculture at the European Union (EU) level as
well as at the Member States level. The model has been recently adjusted to improve its suitability for making market
outlook analyses. See for http://www.agmemod.eu/ for further details or Chantreuil et al (2012).
20 | LEI Report 2015-041line is the projected milk production assuming a lower input costs increase, due to assumed lower
costs for manure treatment (less strict environmental regulation, allowing for industrial processing
17
options). As Figure 3.7 indicates, the abolition of the milk quota will not lead to a big one shot jump
in milk production, but has been translated into additional growth that is smoothed out over a number
18
of years and then gradually levels off .
16000.00 5
15133 4.5
15000.00
4
14862
3.5
percentage growth
14000.00
thousand ton
14057 3
13000.00 2.5
2
12000.00
1.5
1
11000.00
0.5
10000.00 0
2012 2013 2014 2015 2016 2017 2018 2019 2020 2021 2022 2023 2024
Figure 3.8 Projected milk supply in the Netherlands for the period 2015-2024 (in 1,000 tonnes, left
axis; annual growth rates; right axis)
Source: based on own calculations/modelling analysis complemented with expert assessment
Note that in particular with respect to the longer run there are considerable uncertainties. The
evolution of the milk price (see Figure 3.8) is already relatively favourable when comparing it to crop
prices (i.e in particular cereals). In case the price evolution of root crops (sugar beet and potatoes),
which are important in the Dutch arable crop mix, would lag behind more than under the current
assumptions, new entrants might come in (e.g. arable farms that convert to dairy), which would allow
the dairy production to further grow (Jongeneel, 2014). Moreover, as regards the competition for
manure placement space, determining on its relative profitability and the flexibility included in the
manure regulation, the dairy sector could outcompete the intensive livestock sector (in particular the
pig sector). Under the current legislation competition for manure placement space between sectors is
effectively prohibited. Under more flexible conditions there is clearly a potential in the Netherlands to
end up with a future milk production that significantly exceeds 20m tonnes.
17
Taking environmental constraints into account in a sector model is not easy and is necessarily done in a rough and
approximate way. So this result should be interpreted with due care and has been mainly added to make the reader
aware of the general uncertainties associated with the environmental constraints. Another reason to use a lower cost
estimate is that the concentrate feed and energy costs might turn out to be lower than has been foreseen in the OECD-
FAO agricultural outlook (see also discussion about uncertainties in chapter 5)
18
Note that the AGMEMOD projection tool only takes into account systematic factors and sketches the trend that this will
lead to. The impact of incidental factors (such as weather conditions, external shocks in world markets such as a drought
in New Zealand or an unexpected change in the euro-dollar exchange rate) is not accounted for. As such it neglects the
volatility in prices and fluctuations in quantities that are normally observed from year to year.
LEI Report 2015-041 | 214 Expected developments in the EU and
some selected Member States
4.1 EU dairy production
The expected evolution of EU-28’s milk production is a result of what will happen in different member
states (see some further details in next section). According to the medium-run outlook of the EU
Commission of December 2014 EU milk production is expected to increase from 146.5m tonnes in
2014 to 158.3m tonnes in 2024 (+12m tonnes or equivalently +8%). The increase in 2014/15 is
expected to be about 1.6%, while the observed increase in the year before was 3.8%. The longer run
trend shows a growth rate of about 0.8% per annum. It should be noted that the projected increase in
EU milk production (+8%) is larger than the projected increase as it was accounted for in the OECD-
FAO’s Agricultural Outlook (increase about +4%; see Chapter 2). While in this analysis the world
market price evolution has been taken as given, based on the OECD-FAO’s estimate, the higher milk
increase we (and the EU Commission) obtained may impose some further downward pressure on
prices (see also discussion below).
As Figure 4.1 shows, the total dairy cow herd in the EU is expected to gradually decline, after having
shown some increase during 2014. The increase in EU milk production is driven by the favourable
expected milk price evolution. At the same time it is accounted for that different member states will
show a different evolution of their milk supply, with some member states expanding production, while
in other member states milk production might stagnate or even decline.
170 45
Milk production and deliveries (million t)
Number of dairy cows (million heads)
Milk production
40
150
Quota* Milk deliveries 35
130 30
25
110
EU-N13 20
90 15
EU-15
10
70
5
50 0
2005
2007
2009
2011
2013
2015
2017
2019
2021
2023
Figure 4.1 Projected evolution of EU milk production, deliveries and dairy cow herd
Source: DG Agri (2024 Prospects for EU Agricultural Markets; Brussels, 5 December 2014)
The EU’s increase in milk supply will be in particularly used to expand EU cheese production, for which
there is still a potential growth in consumption in the domestic market. However, given the limited
growth projections for the consumption of dairy products in the EU’s home market, most of the
additional milk supply will have to be exported to the world market in the form of various dairy
products (e.g. cheese, skimmed milk powder, whey, butter). As a result the EU’s market share in
world trade of dairy products is likely to increase, in particular for whey (about 60%), cheese (close to
about 40%) and skimmed milk powder (about 30%). This not only underlines the increasing reliance
22 | LEI Report 2015-041of the EU on world markets of dairy products for the valorisation of its milk, but also makes clear that
the developments in the EU may affect price formation at world markets.
The EU’s increased reliance on third markets will increase the sensitivity of the EU dairy sector for
shocks at these markets. Recently a significant shock was felt with the imposition of the Russian trade
ban in 7 August 2014, which can be seen as an experiment or test case to evaluate the robustness of
the new regime. Between 2011 and 2013 EU exports of dairy products to Russia accounted for 1.4%
of EU milk production (for specific member states this share could be substantially higher) and for
13% of EU exports. The Netherlands, together with France, Germany, Belgium and Denmark,
belonged to the main exporters of dairy products to Russia (measured in volume terms). As regards
specific dairy products, close to one third of the EU’s cheese exports and about 25% of the EU’s butter
exports went to Russia. As such the Russian ban on EU dairy product exports to Russia implied a
severe shock to the system. The impact of the shock has been a shift in EU exports to different market
outlets (e.g. increasing butter exports to the US, putting additional cheese on the home market in
specific member states), which required accepting lower prices in order to induce sufficient take up in
these alternative outlets. The sector has turned out to be resilient in that the negative impact of this
shock of losing such an important export market on the milk price was, in relative terms, limited
(although varying over member states), irrespective of 2014 being a year with above average
deliveries. EU milk prices stayed far beyond the safety net provision-level of €21.5/100 kg for all EU
member states.
4.2 Evolution of milk supply in selected Member States
As has been already mentioned before, the milk increase at EU level, which shows a modest growth, is
a result of developments taking place in different member states. The general pattern is that milk
production is likely to expand in a band in Northern Europe (excluding the Scandinavian member
states), where the production circumstances are relatively favourable. Estimates (in % as well as
volume terms) about the milk supply increase in selected member states are presented in Table 4.1.
Note that the projected increase of the selected member states is more than 12m tonnes. The
estimates of experts differ in particular with respect to Ireland and Poland. The estimates presented in
Table 4.1 for these countries might be still somewhat conservative (a 10 percentage points higher
increase of the milk supply for these countries is still within the range of expert estimates found for
these countries).
Table 4.1
Expected milk supply increase in period 2014-2024 for selected EU member states
Member State Milk supply change (%) Milk supply change (million tonnes)
Netherlands 17.3 2.2
Germany 9.5 3.1
Denmark 8.0 0.4
Poland 14.7 1.8
Belgium 6.1 0.2
Ireland 27.2 1.7
United Kingdom 4.5 0.6
France 8.9 2.4
Total 12.4
Source: based on own modelling calculations (PPS Market Outlook calculations February 2015), the EU medium-term outlook (December, 2014)
and experts from different member states.
EU member states that are expected to show a decline in future milk production are Spain, Italy,
Greece, Bulgaria, Hungary, Czech Republic, Slovenia, Slovakia and the Scandinavian countries Sweden
and Finland (European Commission, 2014b). In volume terms the impact of the decline in their
production on the EU-28’s total production is expected to be limited. The real impact might even be
more limited, because the EU’s prospects do not yet take into account the full implications of the CAP
LEI Report 2015-041 | 23You can also read