Journal of Agricultural & Food Industrial Organization
←
→
Page content transcription
If your browser does not render page correctly, please read the page content below
Journal of Agricultural & Food
                Industrial Organization
       Volume 5                                 2007                   Article 4

   Got Organic Milk? Consumer Valuations of
   Milk Labels after the Implementation of the
              USDA Organic Seal

              Kristin Kiesel∗                     Sofia B. Villas-Boas†

   ∗
       University of California, Berkeley, kiesel@are.berkeley.edu
   †
       University of California, Berkeley, sberto@are.berkeley.edu

Copyright c 2007 The Berkeley Electronic Press. All rights reserved.
Got Organic Milk? Consumer Valuations of
    Milk Labels after the Implementation of the
              USDA Organic Seal∗
                          Kristin Kiesel and Sofia B. Villas-Boas

                                            Abstract

     This paper investigates consumer reactions to changes in information provision regarding or-
ganic production. Quantitative analyses focus on the actual implementation of mandatory labeling
guidelines under the National Organic Program. The unique nature of the fluid milk market in
combination with these regulatory changes allows us to place a value on information sets under
different labeling regimes. Hedonic price functions provide an initial reference point for analyses
of individual responses. A random utility discrete choice model serves as the primary economet-
ric specification and allows consideration of consumer preference heterogeneity along observable
household demographics. Our results indicate that the USDA organic seal increases the probabil-
ity of purchasing organic milk. An initial hedonic price function approach, as well as simulations
within the discrete choice framework, suggests that consumers value the change in labeling reg-
ulations with regard to organic production. Our results further suggest that consumers substitute
away from milk carrying the rBGH-free label. This may indicate that consumers pay less attention
to these labels in the time period investigated compared to results found in studies that use earlier
time periods.

KEYWORDS: demand, welfare, product characteristics, organic

∗
 We thank participants at the INRA conference in Toulouse, France, Celine Bonnet and Guido Im-
bens for their suggestions. We also wish to thank Azzeddine Azzam and two anonymous reviewers
for their helpful comments. Data access and funds for this research were provided via a cooperative
agreement between UC Berkeley and the USDA-ERS. We wish to especially thank Elise Golan for
her support. The views presented in this paper are those of the authors’ and not necessarily those
of the USDA, ERS. Address: Department of Agricultural and Resource Economics, 207 Giannini
Hall, Berkeley CA 94720-3310. Emails: kiesel@are.berkeley.edu, sberto@are.berkeley.edu.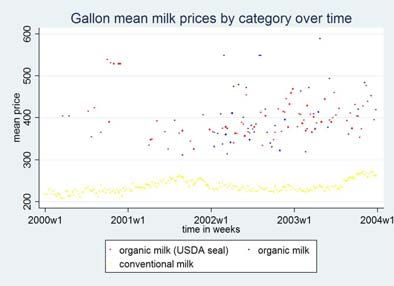
Kiesel and Villas-Boas: Consumer Valuations of Milk Labels after Organic Seal                                                    1

                    1. Introduction
                    The implementation of the USDA organic seal under the National Organic
                    Program (NOP) is just one example of health, environmental and ethical claims
                    increasingly being used in a variety of markets, both as marketing tools and
                    regulatory mechanisms. There is a current need for market research into consumer
                    demand for these specialty foods and into the effect of government labeling policy
                    on consumer demand. The widespread use of these labels might be an indication
                    that they are perceived as a successful tool of altering consumer behavior
                    however, availability of information does not necessarily ensure that it will be
                    incorporated into consumer behavior (e.g. Mathios, 2000; Ippolito and
                    Pappalardo, 2002; Jin and Leslie, 2003; Teisl, Bockstael and Levy, 2001; Ippolito
                    and Mathios, 1995). This research provides an ex post cost benefit analysis of
                    changes in labeling regulations under the National Organic Program (NOP),
                    essential for an evaluation of this program. But it might also serve as a benchmark
                    for further government regulations of the growing demand of related specialty
                    foods, such as proposed guidelines for natural products currently under
                    consideration and the ongoing debate about appropriate labeling regarding genetic
                    modification in food products.
                            The implementation of the NOP in October 2002 with its national organic
                    standard, mandatory labeling guidelines and uniform USDA organic seal has
                    created a quasi-natural market level experiment in a policy-relevant setting. This
                    change in information, isolated from consumers’ reactions to changes in product
                    attributes, allows us to provide both an empirical analysis of consumers’
                    willingness to pay for those informational changes and a comparison to the cost of
                    implementing them. By focusing on the complimentary character of product
                    labeling with actual products attributes, we can take advantage of the literature on
                    welfare analysis of new product introduction and provide an innovative approach
                    for analyzing information changes in a utility consistent framework. The specific
                    research questions addressed are threefold: (i) What is the impact of the NOP and
                    changes in information provision on consumer preferences for organically
                    produced milk? (ii) Do these effects vary across consumer segments based on
                    heterogeneous preferences and heterogeneous information costs? And finally (iii)
                    How much are consumers willing to pay for these regulatory changes and how are
                    benefits distributed across consumers?
                            Our empirical analysis is focused on the fluid milk market. Milk is often
                    considered a gateway to organic food, and the ethos of organic milk—pure
                    goodness, happy cows and small family farming—is heavily reinforced on its
                    cartons via marketing claims. Fluid unflavored milk can be viewed as a relatively
                    standardized and ubiquitously processed commodity, which permits abstracting
                    from brand and taste preferences. It allows investigating consumer preferences for

                                                                                    Produced by The Berkeley Electronic Press, 2007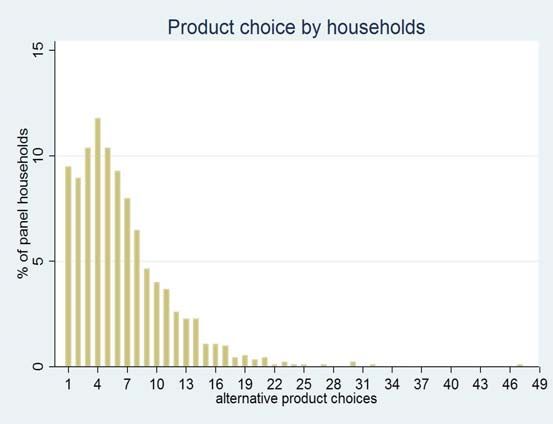
2                      Journal of Agricultural & Food Industrial Organization                Vol. 5 [2007], Article 4

    privately certified rBGH-free labeled milk 1 , third party and government certified
    labeled organic milk, and conventional milk.
             Previous empirical studies of the effects of voluntary and/or of mandatory
    product labeling in the food sector have tended to focus on the provision of
    nutritional information and exhibit mixed results regarding effectiveness of
    information provision (see, for example Ippolito and Mathios, 1990; Mojduszka
    and Caswell, 2000; Ippolito and Mathios, 1995; Mathios, 2000; Teisl, Bockstael
    and Levy, 2001). Evaluating eco-labels, Teisl, Roe and Hicks (2002) report that
    dolphin-safe labels resulted in changes in aggregate tuna consumption, and Jin
    and Leslie (2003) conclude that consumer demand is sensitive to mandatory and
    voluntary display of hygiene quality grade cards in the Los Angeles restaurant
    market. In terms of empirical studies of consumer level responses to related
    advertising, Ackerberg (2001) finds responses by inexperienced buyers.
             The existing literature on how consumers respond to labeling claims
    regarding organic and genetically modified food production is dominated by
    attitudinal surveys, choice experiments and experimental auctions (see Marks,
    Kalaitzandonakes and Vickner, 2003 for an overview; Roe and Teisl, 2007;
    Huffman et al, 2003; Batte, Beaverson and Hooker, 2003). Results range from
    substantial price premiums and distinct consumer segments to no avoidance
    behavior or detectable effects. Roe and Teisl (2007) combine differences in non-
    GMO labeling information with variation in agencies that certified these claims.
    They find that simple claims are viewed as most accurate, and labels certified by
    the US Food and Drug Administration (FDA) are perceived as more credible than
    third party and consumer organization certification. For some types of labels such
    as reduced pesticide use, USDA certified claims are viewed similarly credible.
    While Batte et al (2003) find that the willingness to pay for organic content post
    NOP varied with income and other demographics such as age and education,
    Huffman et al (2003) find that household demographics had no significant effect
    on willingness to pay for non-genetically modified products in experimental
    auctions of products displaying divergent labeling claims. Careful design and
    statistical analysis in survey responses can minimize but not eliminate strategic
    and hypothetical bias. Experimental studies rely on a much more limited range of
    items than available in actual retail stores. In addition, participants may exhibit
    what is called the Hawthorne effect, an increased bidding amount to please the
    experimenter. And finally, these approaches cannot be readily applied to a
    random sample of the population.
             Empirical studies of informational effects of the use of rBGH and organic
    production on milk demand have mainly been limited to the analysis of survey
    responses (e.g. Grobe and Douthitt, 1995; Misra and Kyle, 1998) and market
    1
     Recombinant Bovine Somatotropin, is a genetically modified version of a growth hormone that
    occurs naturally in cows and is injected to enhance milk production by 10 to 15%.

                             http://www.bepress.com/jafio/vol5/iss1/art4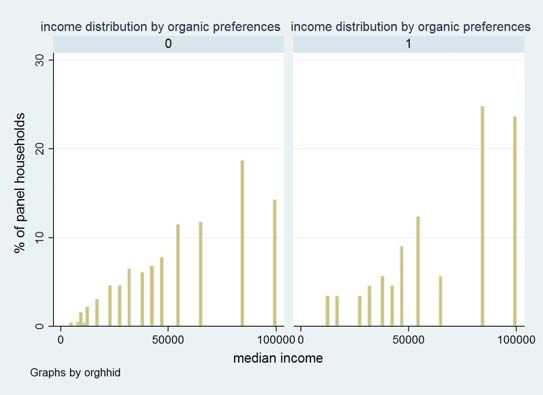
Kiesel and Villas-Boas: Consumer Valuations of Milk Labels after Organic Seal                                                               3

                    based research focuses on the actual production attributes. Aldrich and Blisard
                    (1998) utilized monthly pooled time-series and regional data for 1978 through
                    1996 to examine whether the use of rBGH and consumer concern reduced
                    aggregate fluid milk consumption, but found no evidence of such an effect.
                    Focusing on organic milk, Glaser and Thompson (2000) identified price
                    premiums as high as 103%, and high own-price elasticities for organic milk
                    products. Dhar and Foltz (2005) used a quadratic, almost ideal demand system
                    (AIDS) for differentiated milk types in combination with supermarket scanner
                    data. They found significant consumer valuation of organic milk, and to a lesser
                    extent, rBGH-free milk. Following a different approach and focusing on product
                    attribute uncertainty faced by the consumer and his/her search costs addressed in a
                    random utility framework, Kiesel, Buschena and Smith (2005) reported similar
                    findings. In addition, by identifying rBGH-free labeled and unlabeled products,
                    their results suggest that the provision of relevant information on a label might be
                    required if market segmentation is to take place. Our paper adds to the literature
                    as it provides a direct market approach and presents consumer valuation estimates
                    of different labeling regimes based on actual purchases.
                            A unique data set is utilized in this study. AC Nielsen Homescan® data
                    tracks individual purchases by participating households across all chosen food
                    channels and provides household demographics. Taking advantage of these
                    unique data we are able to access consumer valuation of the NOP in an initial
                    hedonic price function approach (Rosen, 1974), as well as in a discrete choice
                    model (McFadden, 1974; Train, 2002) approach.
                            In our analysis of information changes, we follow the literature on welfare
                    estimations of new product introductions (e.g. Bresnahan, 1997; Hausman, 1997;
                    Hausman and Leonard, 2002; leading to a variety of empirical papers such as
                    Nevo, 2003; and Kim, 2004). 2 In this context, we define product specific
                    information provision via labels as additional or differentiated product attributes.
                    We further define the consumer product as a bundle of perceived product
                    attributes, which allows us to compute consumer’s willingness to pay for
                    additional labeling information in a straightforward way. The utilized discrete
                    choice model (e.g. Berry, Levinsohn and Pakes, 1995; McFadden and Train,
                    2000; Nevo, 2000; Nevo, 2003; Swait et al, 2004) also offers flexibility in
                    incorporating consumer heterogeneity with regard to organic production. The
                    estimates of willingness to pay for the labeling change are based on counterfactual

                    2
                      In addition, a number of theoretical analyses directly address the effects of product labeling on
                    consumer demand by modeling the decision-making process using generalized Lancaster demand
                    models or hedonic (Houthakker-Theil) demand models based on product attributes (e.g.
                    Smallwood and Blaylock, 1991; Caswell and Padberg, 1992; Teisl and Roe, 1998; Teisl, Roe and
                    Hicks, 2002; Golan, Kuchler, and Mitchell, 2000).

                                                                                               Produced by The Berkeley Electronic Press, 2007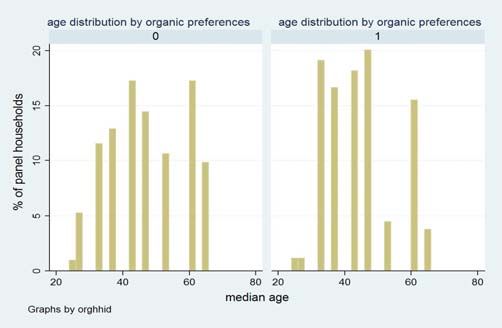
4 Journal of Agricultural & Food Industrial Organization Vol. 5 [2007], Article 4
simulations of restricted choice sets, and changes in consumer surplus are
computed (Small and Rosen, 1981).
Our findings indicate that the display of the USDA organic seal on a milk
carton increased the probability of purchase during the time period under
consideration. And both the hedonic price function approach and simulations
using conditional logit regressions suggest that consumers value the changes in
labeling regulations under the NOP. In addition, our results suggest that
consumers substitute away from milk carrying the rBGH-free label, possibly
because consumers pay less attention to these labels in the time period
investigated compared to results found in studies that use earlier time periods.
The paper proceeds as follows. In the next section, we describe the market
for organic milk and the data are described in section 3. Section 4 outlines the
econometric modeling approach, while section 5 presents the empirical results.
The paper concludes in section 6 and discusses implications for future research.
2. The Market for Organic Milk
Our empirical analysis is centered on the fluid milk market. The fluid milk market
offers a variety of differentiated products across categories, such as privately
certified rBGH-free labeled milk; third party and government certified labeled
organic milk, and conventional milk. At the same time, fluid unflavored milk is a
relatively standardized and ubiquitously processed commodity, which permits
abstracting from brand and taste preferences in general to take advantage of this
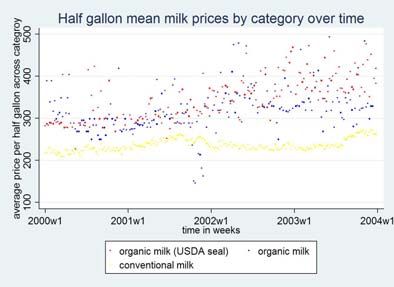
rich product differentiation, as demonstrated in Figure 1 and 2, depicting observed
product and brand choices of panel members in the data set analyzed in this paper.
Figure 1: Alternative product choice by panel members
http://www.bepress.com/jafio/vol5/iss1/art4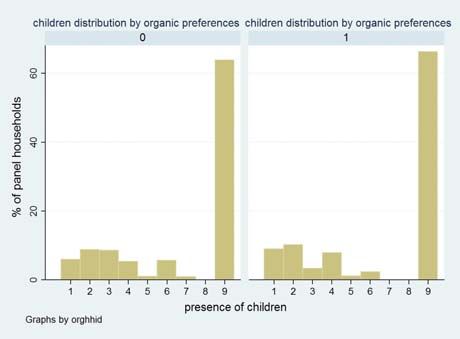
Kiesel and Villas-Boas: Consumer Valuations of Milk Labels after Organic Seal                                                              5

                                  Figure 2: Alternative brand choice by panel members

                           While still a niche market, the U.S. organic market is one of the fastest-
                    growing categories in food business. Organic products as a whole are projected to
                    reach a value of $30.7 billion by 2007, with a five-year compound annual growth
                    rate of 21.4 percent between 2002 and 2007 (according to Organic Trade
                    Association, 2006). Nearly two thirds of U.S. Consumers bought organic foods
                    and beverages in 2005, up from about half in 2004 (Consumer Reports, CR,
                    2006). Organic products sell at a significant price premium (50% on average)
                    compared to their conventional counterparts with prices often doubling for milk
                    and meat (CR, 2006). These price premiums and market trends sparked an interest
                    in organic production among large food companies in recent years.3 General
                    Mills, Kraft, Dean Foods 4 , and Dannon already market or own many of the
                    branded organic products, and some supermarkets such as Safeway, Kroger and
                    Costco offer organic store brands. Most recently, McDonald’s and Wal-Mart
                    entered the playing field in an attempt to milk the “organic cash cow” (The New
                    York Times, 11.1.2005, 11.9.2005). As organic food products went mainstream,
                    the debate over what organic really means is still ongoing. For instance, two
                    recent debates include approval of artificial ingredients and industrial chemicals
                    such as boiler additives, disinfectants and lubricants, as well as stricter
                    requirements for access to pasture in organic dairy production. This paper focuses
                    on changes in information provision that relate to the implementation of the NOP

                    3
                      One could even argue that the NOP induced this take-off, as well as overall changes in industry
                    structure.
                    4
                      For instance, Dean Foods bought out Horizon Organics in June 2003.

                                                                                              Produced by The Berkeley Electronic Press, 2007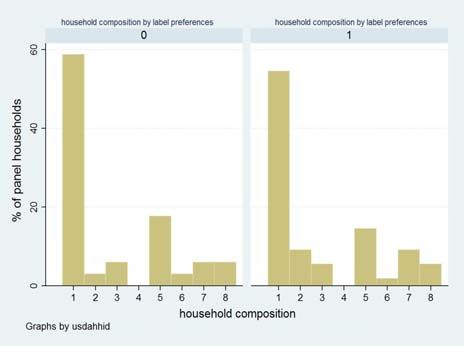
6                       Journal of Agricultural & Food Industrial Organization                 Vol. 5 [2007], Article 4

    in October 2002. The program included a uniform national standard, new labeling
    guidelines and the appearance of a USDA organic seal on organic products.
            The NOP was initiated as a direct consequence of the Organic Foods
    Production Act in the 1990 Farm Bill, calling for regulations of production,
    handling and marketing of organically produced agricultural products under the
    management of the U.S. Department of Agriculture (USDA). While the
    regulatory changes were long anticipated and the USDA considered over 275,000
    public comments after their first proposal in 1997, and over 38,000 comments
    after their revised rule in 2000, the initiation precedes much of the industry
    growth and controversy. This is especially true for organic milk. While organic
    foods trace back to the natural foods movement of the 1960’s, organic milk has
    only been available for a little more than a decade. But organic milk sales have
    been one of the fastest growing market segments ever since as “people who don’t
    buy any other organic products are purchasing organic milk” (DiMatteo, OTA in
    DuPuis, 2000). This rapid growth of organic milk is often linked to the
    controversy about the use of the genetically modified growth hormone rBGH and
    its wide media coverage (DuPuis, 2000). Ongoing health and safety concern by
    some consumers are at the heart of this controversy as approximately 35% of the
    U.S. dairy herds, about 9 million dairy cows, currently receive rBGH supplements
    that increase milk production by 10 to 15% (Monsanto, 2006). Milk from treated
    cows is not subject to any labeling requirements since the FDA has determined it
    to be safe and not significantly different from milk from non-treated cows, an
    opinion that is also shared by the Center for Disease Control. Voluntary labeling
    for milk products that come from untreated cows is used by dairy processors to
    address these concerns by consumers, but is required to be accompanied with a
    disclaimer citing the lack of scientific evidence for differences between milk
    produced with and without rBGH. This controversy was also the birth place of the
    ongoing “Milk is Milk—The Simple Truth” campaign initiated by the Center of
    Global Food Issues (CGFI) and its coalition 5 in hopes of ending the battle over
    appropriate milk labeling for hormone, antibiotic, and pesticide use in production-
    oriented claims. The campaign focuses on the many claims found on milk cartons
    today, such as: “Produced without the use of dangerous pesticides, added growth
    hormones or antibiotics,” “our cows make milk the natural way,” and “a clean-
    living cow ... makes really good milk.” The media attention regarding rBGH and
    marketing claims that still appear on milk cartons, in addition to the uniform
    USDA seal, illustrate the need of addressing policy evaluation in the context of
    other sources of information. One interesting feature of the milk market is that
    product, or brand specific advertising or marketing claims, mainly target container

    5
      The CGFI campaign is supported by the Center for Science in the Public Interest, the Federal
    Trade Commission, the National Consumers League, and the U.S. Food and Drug Administration
    (FDA).

                              http://www.bepress.com/jafio/vol5/iss1/art4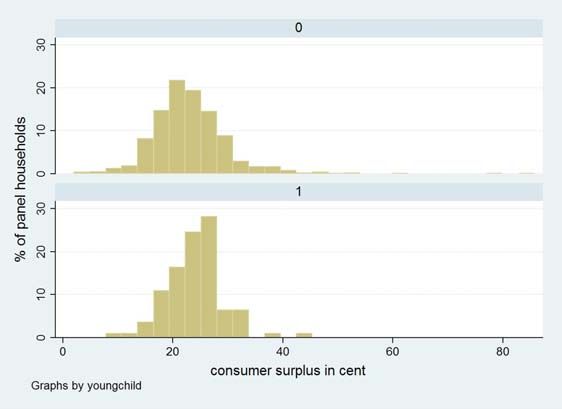
Kiesel and Villas-Boas: Consumer Valuations of Milk Labels after Organic Seal                                                               7

                    design. Comparison of organic milk containers before and after the appearance of
                    the USDA seal suggests that advertisement and marketing claims did not change
                    over the investigated time period. 6
                            In addition, we address consumer heterogeneity regarding complex
                    organic production attributes in general. “Organic food is produced by farmers
                    who emphasize the use of renewable resources and the conservation of soil and
                    water to enhance environmental quality for future generations,” (USDA, NOP,
                    2002). Therefore, it is not directly linked to other commonly analyzed food
                    demand dimensions and consumer preferences for these attributes are not well
                    understood. Some consumers buy organic products to support its producer’s
                    environmentally friendly practices, but most are trying to cut their exposure to
                    chemicals and other unwanted ingredients such as genetically modified
                    ingredients (CR, 2006). 7 Horizon Organic, the leading organic milk brand,
                    describes its consumers as “concerned about toxic pesticides, growth hormones
                    and antibiotics in their food and in the environment, and place[ing] value on
                    animal welfare and ecological sustainability.” And for the second largest brand,
                    Organic Valley, these targeted “cultural creatives” represent nearly one-quarter of
                    the population, potentially capturing a large segment of the total fluid milk sales
                    that amounts to $11 billion. But for Nobel laureate agronomist Norman Borlaug
                    and others, the claim that organic is better for human health and the environment
                    is not even worth a debate as “you couldn’t feed more than 4 billion people …
                    and would have to increase cropland area dramatically, spreading out into
                    marginal areas and cutting down millions of acres of forest…If some consumers
                    want to believe that it’s better from the point of view of their health …let them
                    pay a bit more,” (The Wall Street Journal, 8.26.2002). He is referring to the
                    conundrum that taste and health concerns are consistently determined as primary
                    purchase motivations when it comes to organic food consumption (e.g.
                    McEachern and McClean, 2002), despite missing scientific evidence on enhanced
                    nutritional value, health benefits for the consumer and animal welfare (Williams,
                    2002; Roesch, Doherr and Blum, 2005). 8 “Food is an emotional issue” says
                    Elizabeth Whelan of the American Council on Science and Health (The Wall
                    Street Journal, 10.25.2002). While “the very presence of the [USDA organic]
                    stamp is going to increase awareness that there is something different called

                    6
                      Of course, the added USDA seal could be viewed as a validation or reinforcement of these
                    claims.
                    7
                      Another often discussed consideration could be support of small farming. While support for
                    small farms is advertised on organic milk cartons, the organic dairy sector is often more
                    concentrated and vertically integrated than its conventional counterpart.
                    8
                      Some research suggests higher levels of vitamin E, omega 3 essential fatty acids and antioxidants
                    in organic milk, relative to conventionally produced milk (e.g. Soil Association, 2005), and
                    nutritionists point out that people are likely to meet their dietary needs for these nutrients by
                    consuming other foods (e.g. Nugent, British Nutrition Foundation, in BBC News, 2005).

                                                                                               Produced by The Berkeley Electronic Press, 2007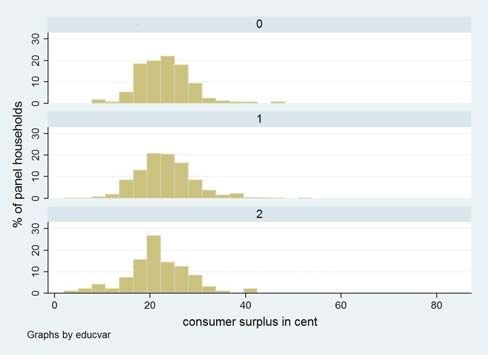
8                        Journal of Agricultural & Food Industrial Organization                       Vol. 5 [2007], Article 4

    organic,” and probably boost sales, as Horizon Organic Chief Executive Chuck
    Marcy (The Wall Street Journal, 9.11.2002) puts it, the question remains how and
    why.
    3. The Data
    The data set used in this study was extracted from AC Nielsen Homescan©
    household panel data that track household purchases in 52 markets nationwide
    over a time period of four years (2000-2003). This data set is unique in that it
    tracks individual purchases of its participating households across all marketing
    channels, and provides detailed household demographics. For any reported
    product purchase, information on price and price promotions such as sales and
    coupon use, as well as detailed product attributes, are available. The data include
    a separate indicator for organic claims and the USDA organic seal. Lactose-free
    and kosher milk products are also identifiable in the data. Information on rBGH-
    free labeling was not included in the data set and was added at the brand level
    utilizing a list of rBGH-free products provided by Rural Vermont and Mothers
    and Others combined with information regarding rBGH-free labels provided by
    the CGFI. 9
            This study focuses on fluid milk, excluding buttermilk, flavored milk, and
    non-dairy alternatives (such as soy or rice milk) to ensure comparisons of fairly
    homogeneous products. The major limitation of these data relates to the fact that
    only the actual choices by a given household are observed. Available product
    choices at a given store are not available at this point and choice sets need to be
    constructed based on observed purchases of the panel members in a given market.
    Even though demand for organic milk is one of the fastest growing market
    segments it is still a niche market accounting for about 3% of the total US milk
    sales in 2005 (The New York Times, 11.09.2005). Therefore, the analysis focuses
    on one market only which provides sufficient observed organic milk purchases to
    construct credible choice sets, as the data set is very limited with regards to
    observations of organic milk product choices. 10

    9
     This information is currently only available at the brand level.
    10
      If no organic purchases are observed, one cannot distinguish between no purchase of organic
    milk by included panel members and no availability of organic milk in a given store or market at a
    specific point in time. We are aware of the fact that the selection of a market based on observed
    organic purchases might introduce bias to our estimation results and will discuss this potential bias
    when presenting the results.

                                http://www.bepress.com/jafio/vol5/iss1/art4
Kiesel and Villas-Boas: Consumer Valuations of Milk Labels after Organic Seal 9
Table 1: Average Household demographics
Descriptive statistics (household demographics)
National population * Selected market population * Sample data Sample data
(all households) (milk consumption only)
gender (female) 50.9 49.2 66.28 69.21
median age 35.3 39.2 42** 42**
median income $41,994 $60,031 $55,000*** $55,000***
race
white 75.1 49.7 61.88 62.36
black 12.3 7.8 14.05 13.88
asian 3.6 30.8 13.79 13.4
other 10 7.4 10.28 10.37
hispanic 12.5 14.1 13.83 15.2
household composition
household size 2.59 2.3 2.49 2.64
married 51.7 33.38 52.72 57.04
with children under 18 25.7 14.5 30.09 34.4
with children under 6 7.3 4.1 4.18 4.84
number of households 1041 927
* based on 2000 census data
**median age category is 40-42 (age of children not included in derivation for data set)
***median income category is $50000-$59999
Table 1 compares average sample household demographics both for the
complete household panel of this market and the subset of households that
purchased milk over the relevant time period to market and national population
averages reported in the 2000 census. While the selected market exhibits a more
diverse race distribution, higher mean income, and fewer married couples and
household with children than the national average, the analyzed sample
approaches national averages for some of these demographics. It is also worth
noting that the sub-sample of households that buy milk does not differ
significantly from the entire household sample for this market, with the exception
of a slight increase in the number of married couples and households with
children, which seems reasonable in the case of milk consumption.
The final data set used in the analysis is restricted to brands that were purchased
20 times or more over the entire time period and stores with at least two observed
alternative products at a given month. Furthermore, only half gallon and gallon
milk containers, the most common sizes, were considered. The final data set
consists of 40.341 daily purchases by 927 households choosing among 182
different milk products (16 brands) in 21 alternative stores.
The analysis focuses on the discrete purchase decision only, although
information on purchase amounts is included in the data. 11 Whenever a household
11
This information is not utilized in a discrete choice framework such that a households
inventories and stockpiling behavior is not captured. But this limitation should be less restrictive
Produced by The Berkeley Electronic Press, 200710 Journal of Agricultural & Food Industrial Organization Vol. 5 [2007], Article 4
purchase was observed in a given store, it was assumed that this product was
available to households over the entire month at this store. The minimum
observed purchase price at the relevant store was used to construct prices for the
alternatives to actual purchases. 12 As we confine the created alternative choices
to the store in which the household purchased milk—mainly to ensure feasibility
of the data analysis—we implicitly assume that the decision of what store to go to
is made prior to deciding which specific milk product to purchase (see Swait and
Sweeney, 2000; Ackerberg, 2001 for similar approach). Store fixed effects are
included in the first stage or control function approach, however, to account for
store level unobserved constant characteristics that may affect prices. Store
dummies are also included in some of the logit specifications to account for
consumers preferences for certain stores. The resulting complete choice set
matches all alternatives purchased by all households’ at a given store in a given
month with actual choices by a specific household, inflating the data set to a total
of 449.879 observations.
Commodity trading prices at the Chicago Mercantile Exchange of nonfat
dry milk powder and whole milk powder reported in Dairy Market News were
also added to the data set. Descriptive statistics of the resulting final data set are
reported in Table 2.
for milk due to its relatively short shelf life and the fact that purchased quantities mainly reflect a
given household composition (see also Swait and Sweeny 2000, and Ackerberg 2001).
12
The minimum price rather than a mean or median price is used to capture a specific choice and
consumer preferences while accounting for possible sales on alternative milk products. Results do
not vary significantly when using either the median or maximum price instead.
http://www.bepress.com/jafio/vol5/iss1/art4Kiesel and Villas-Boas: Consumer Valuations of Milk Labels after Organic Seal 11
Table 2: Descriptive statistics of final data set
Descriptive statsistics (product charcteristics)
original choices data including created choice sets
Variable Observations Mean Std. Dev. Min Max Observations Mean Std. Dev. Min Max
choice 449879 0.090 0.286 0 1
number of choices at store by month 449879 25.057 7.585 2 40
price (in cents)
price (adjusted to gallons, using maximum price below) 40341 343.951 130.637 0 449879 448.295 166.667 0 860
price alternative choice (maximum price) 409538 458.574 166.298 0 860
price alternative choice (minumum price) 409538 431.473 174.945 0 858
price alternative choice (median price) 409538 445.701 170.626 0 858
-7 -7
residual from first stage regession 40341 2.19*10 64.950 -598.32 341.405 449879 2.46*10 75.954 -589.680 367.848
in store promotion 40341 0.213 0.410 0 1 449879 0.338 0.473 0 1
customer coupon 40341 0.007 0.084 0 1 449879 0.001 0.025 0 1
private label 40341 0.759 0.428 0 1 449879 0.538 0.499 0 1
fat content
fat free 40341 0.238 0.426 0 1 449879 0.213 0.409 0 1
lowfat 40341 0.543 0.498 0 1 449879 0.249 0.432 0 1
whole 40341 0.219 0.414 0 1 449879 0.538 0.499 0 1
package
half 40341 0.461 0.498 0 1 449879 0.577 0.494 0 1
glass 40341 0.002 0.045 0 1 449879 0.004 0.066 0 1
carton 40341 0.364 0.481 0 1 449879 0.504 0.500 0 1
labeling characteristics
lactose free label 40341 0.013 0.114 0 1 449879 0.070 0.254 0 1
no rBST label 40341 0.195 0.397 0 1 449879 0.274 0.446 0 1
organic label 40341 0.043 0.202 0 1 449879 0.159 0.366 0 1
usda label 40341 0.019 0.137 0 1 449879 0.069 0.253 0 1
unit measures (adjusted to gallons)
product units purchased (per shopping trip) 40341 1.120 0.696 0.5 22
units of non-organic milk purchased by month 40341 942.404 135.885 628 1103 449879 954.738 124.634 628 1103
units of organic milk purchased by month 40341 25.276 8.051 5.5 38.5 449879 26.084 7.645 5.5 38.5
ratio organic units purchased/non-organic units purchased 40341 0.026 0.006 0.009 0.036 449879 0.027 0.006 0.009 0.036
distribution of observations by year
2000 7286 0.181 0.385 0 1 62880 0.140 0.347 0 1
2001 11012 0.273 0.445 0 1 119398 0.265 0.442 0 1
2002 11127 0.276 0.447 0 1 138254 0.307 0.461 0 1
2003 10916 0.271 0.444 0 1 129347 0.288 0.453 0 1
4. Econometric Framework
In this section, we describe several aspects of our empirical strategy. A hedonic
price function approach provides an initial reference point for estimates of
consumer valuation of labeling changes and motivates more flexible discrete
choice models. A detailed discussion of the employed logit model and simulations
of restricted choice sets follows. And finally, controls for endogeneity of product
prices in the discrete choice demand regression specifications are described.
4.1 Hedonic Approach
The hedonic price method (Rosen, 1974) presents an approach often used when
estimating consumer valuation of goods or product attributes for which no explicit
market exists. It is based on the simple intuition that the utility of differentiated
products implicitly allows for the recovery of the contribution of each attribute to
the overall utility. The price of a given milk product mi can be written
as price mi = price( a1 ,..., a n ) , where the partial derivative of price(•), with respect to
the nth attribute ∂price / ∂a n , defines the marginal implicit price. The hedonic price
schedule is determined by interactions between consumers and producers in a
given market, such that each point of the schedule represents an individual’s
marginal willingness to pay for that attribute. We estimate an equation that relates
Produced by The Berkeley Electronic Press, 200712 Journal of Agricultural & Food Industrial Organization Vol. 5 [2007], Article 4
the price of milk to observable attributes of milk products, as well as unobserved
product attributes. Estimated parameters recover the average implicit price
gradient, or average marginal willingness to pay for each product attribute. In
particular, the average willingness to pay for changes in labeling regulations can
be estimated directly, as the USDA organic seal can be included as one relevant
product attribute. However, regression coefficients capture an average willingness
to pay only if preferences are homogeneous across the entire population (e.g.
Rosen, 1974; Chay and Greenstone, 2005). If market responses are a result of
preference heterogeneity one might only recover an average across
subpopulations that sort themselves according to their valuation of specific
product characteristics. Estimates in this approach are used only to provide an
initial reference point and robustness check for estimation results in the below
described discrete choice models that address consumer heterogeneity in more
flexible ways. In addition, comparison of estimates in these two approaches can
provide empirical support to the recent critique of the hedonic price function
approach.
4.2 Random Utility Model and Logit Specification
The unique household panel data set with household-specific purchase
information and household demographics for its panel members enables us to
consider and estimate a specification of heterogeneous preferences in econometric
discrete choice models explicitly. Starting from a random utility framework (e.g.
McFadden 1974; and Train, 2002) where both the product attributes as well as a
random term are assumed to enter linearly, the utility from consuming a certain
milk product can be described as
U i = Ai β + ri . (1)
In equation (1), the vector Ai indicates the attributes of milk product mi,
the vector β represents the weights or marginal utility placed on each of these
attributes, and ri denotes remaining randomness or uncertainty. If there are a
number of heterogeneous households (h) that choose among different milk
products (i) at different points in time (t) then we define the indirect utility as
U i ht = Ai h t βht + riht . (2)
Note that the attributes have an additional index h to address possible
heterogeneity in attribute perception across households, as in the case of organic
production. The vector Aiht therefore indicates attributes as perceived by a given
household at period t and βht indicates household-specific weights placed on
them. One deviation from the classical random utility model should briefly be
http://www.bepress.com/jafio/vol5/iss1/art4Kiesel and Villas-Boas: Consumer Valuations of Milk Labels after Organic Seal 13
mentioned. The classical model assumes that the household observes the product
attributes and knows the weights he places on them with certainty. Randomness
arises only from the standpoint of the researcher. The specification in this paper
varies in that it postulates some unresolved uncertainty in the utility derivation of
the household such that the household chooses milk product mi if :
Pr ( m it = 1) ≡ Pr (U iht > U jht ) ≡ Pr ( r jht < riht + ( Ai h t − A j h t )β ht ) , (3)
for all i ≠ j.
The product choice of a given household depends on the product attributes
as perceived by this household, as well as the marginal value assigned to them.
The remaining uncertainty about true product attributes and its potential risks and
benefits further determine the household choice. While this household specific
random component may not be empirically separable from the additional source
of randomness that arises from an econometrician's point of view, due to
unobservable household and product characteristics that could influence
household choices in the existing models, it is conceptually important. Remaining
uncertainty about true product attributes and/or its potential benefits would result
in changes in consumer behavior due to changes in information provision and
enable a utility consistent estimation of welfare effects. It is important to note that
we do not assume that changes in information result in changes in household
tastes or preferences. Rather, consumers demand a joint bundle of attributes, such
as labeling and advertisement in that these changes are directly related to models
of product differentiation and product quality. In this context, information
changes could resolve some uncertainty with respect to appropriate monetary
valuation of the relevant attributes, might change benefits through prestige or
image effects that add value to the consumer, or simply point out attributes
previously not recognized. All of these effects could increase or decrease the
utility assessment of a specific product and change its ranking relative to other
choice alternatives without changing underlying household preferences. This
conceptual extension would further allow incorporating behavioral and
informational effects such as anchoring and attention focus. Of course, this
underlying uncertainty might vary by households such that better informed
consumers are less responsive to changes in labeling information and
heterogeneity across households is potentially twofold: Households vary
according to their underlying preferences for observed product attributes, as well
as their informational background and remaining uncertainty.
Redefining the above specifications from the researcher’s point of view
would result in a replacement of riht with εiht, where εiht now incorporates both
sources of uncertainty. It relates the observable part of the stochastic decision-
making process of the household to remaining unobservable choice determinants
Produced by The Berkeley Electronic Press, 200714 Journal of Agricultural & Food Industrial Organization Vol. 5 [2007], Article 4
and data problems. Distributional assumptions about this combined error term
drive the econometric model choice, but also affect estimation results in a variety
of ways.
The logit model estimated in this paper can capture preference
heterogeneity if tastes vary systematically with respect to observed variables.
Observable household demographics, D, are used to account for preference
heterogeneity and can be incorporated into the indirect utility formulation as
follows: 13
U i ht = Ai t β + ( Ai t × Dh )γ + ε i ht . (4)
If εiht are assumed to be independently, identically extreme value
distributed (type I extreme value distribution), the following closed form solution
can be derived for the probability that a household’s product choice corresponds
to milk product mi:
it β + ( Ai t × D h ) γ
eA
Prht ( m i = 1) = J
(5)
∑e
A j t β + ( A j t × Dh ) γ
j =1
These response probabilities constitute what is usually called the
conditional logit model. The underlying distributional assumptions of this
specification have some important limitations. The most stringent restriction
relates to the independence of irrelevant alternatives property (IIA), as the relative
probabilities for any two alternatives depends only on the attributes of those two
alternatives due to the iid extreme value assumption such that the ratio of choice
probabilities stays the same after the introduction of a new alternative. Analogous
to the often used “red-bus-blue-bus” problem (e.g. Train, 2002) one would like to
compare the ratio of choice probabilities of organic versus conventional milk
before and after the introduction of the USDA organic seal. Due to the nature of
our application as a change in information rather than a change in alternatives, we
cannot directly compare these choice probabilities. The labeling change actually
did not lead to an introduction of new organic products per se, instead, some of
the existing organic milk products added the label to the milk container and some
did not. 14 Using choice probabilities of rBGH-free milk instead—often perceived
as a close substitute to organic milk—one might argue that choice probabilities of
13
Only differences in utility are identified in this model such that household demographics need to
be interacted with product attributes. Differences in attribute perceptions cannot be investigated
empirically and will enter into the error term.
14
This finding is discussed in more detail in the results section.
http://www.bepress.com/jafio/vol5/iss1/art4Kiesel and Villas-Boas: Consumer Valuations of Milk Labels after Organic Seal 15
rBGH-free milk are affected more heavily by this change in information provision
regarding organic production than choice probabilities of conventional milk. The
chosen model would impose the ratio of these choice probabilities to stay the
same, however. Nonparametrically comparing choice probabilities prior and post
NOP in 2001 and in 2003 respectively, reveals a surprisingly constant probability
ratio of 0.247 and 0.245. Related to these stringent substitution patterns imposed
by the model is the ability to address taste variation in this model, as the iid
extreme value assumption also implies that unobserved factors are uncorrelated
over alternatives, as well as having the same variance for all alternatives. This
restriction, with regard to heterogeneous consumer preferences not captured by
observed household demographics, is relaxed by clustering the estimated error
structure by individual households. Overall, we argue that the chosen logit
specification seems to be supported by our data, can capture average tastes, and
the logit formula has been shown to be fairly robust to misspecification (Train,
2002). The main motivation and advantage of this model choice is a resulting
closed-form solution enabling a straight forward overall cost-benefit analysis of
the labeling change described in the next section.
4.3 Consumer Valuation
Estimates of changes in consumer surplus (CS) can be derived through simulation
of restricted choice sets. They correspond to a household’s compensating
variation for a change in product attributes (Small and Rosen, 1981) and in our
case, a change in information provision about attributes. Given its beliefs and
available information set, a household chooses the product alternative that
provides the highest stochastic utility. Expected consumer surplus, CSnt, can
therefore be defined as
1
CSht = max j (U hjt ∀j ) , (6)
αh
where αh denotes the marginal utility of income. The negative of the price
coefficient can be used as an estimate of αh in this formulation. Since the
maximum utility is unobservable, the following expected consumer surplus
formulation from the researcher’s perspective can be specified as
E ( CSht ) = (1/ α h )E ⎡⎣ max j ( A j t β + ( A j t × Dh )γ + ε j ht ∀j ) ⎤⎦ . (7)
If each εiht is iid extreme value and utility is linear in income, then the change in
consumer surplus that results from a change in product alternatives or product
choices can be computed as
Produced by The Berkeley Electronic Press, 200716 Journal of Agricultural & Food Industrial Organization Vol. 5 [2007], Article 4
1 ⎡ ⎛ J A ⎞ ⎛ J A ⎞⎤
⎢ ln ⎜ ∑ e ⎜∑e
1
β +( A1j t × Dh )γ 0
β +( A 0j t × Dh )γ
ΔE ( CSht ) = jt
⎟ − ln jt
⎟⎥ , (8)
αh ⎣ ⎝ j =1 ⎠ ⎝ j =1 ⎠⎦
where the superscripts 0 and 1 refer to prior the change and after the change,
respectively. This measure of consumer valuation can be computed using
estimated regression coefficients and simulating the counterfactual where labeling
changes would have not taken place by restricting the choice set through an
exclusion of organic milk carrying the USDA seal. Estimated regression
coefficients for the USDA organic seal will be forced to zero in this restricted
choice set. This specification, also denoted in the literature as the variety effect
can be extended to account for possible price changes in existing products prior to
the implementation of the USDA by adding a second term (price effect) that
compares pre and post regulation prices of these products (e.g. Kim, 2004). We
do not follow this approach as prices over the investigated time period are fairly
stable as illustrated in Figure 3.
Figure 3: Mean prices across organic categories over time
4.4 Endogeneity Controls
The choice of milk products in this framework is captured as a choice of a bundle
of observable attributes including labels and price. But retailers consider all
product characteristics when setting prices and account for changes in
characteristics, as well as consumer valuation. This introduces a simultaneity
problem in that both choice probabilities and prices are affected by unobserved
attribute characteristics implying that prices are correlated with disturbances
included in the discrete choice demand regressions. Input prices for milk
production are used as instruments for prices set by the retailer as it seems
reasonable to assume that they are not correlated with unobserved product
characteristics and product choice, while raw milk prices account for 62% of
http://www.bepress.com/jafio/vol5/iss1/art4Kiesel and Villas-Boas: Consumer Valuations of Milk Labels after Organic Seal 17
retail milk prices (U.S. G.A.O., 2001). Raw milk prices cannot directly be used as
they are regulated under marketing orders, support price mechanisms, and do not
vary over time. Instead weekly commodity trading prices at the Chicago
Mercantile Exchange of nonfat dry milk powder and whole milk powder are used
as they might capture seasonality and supply shocks as well. 15 Regressing
observed milk product prices only on weekly nonfat and whole dry milk powder
trading prices, respectively, as a first test and motivation for this instrument
choice results in positive (33.19 and 31.71) and statistically significant
coefficients at the 5% and 1% significance level. As proposed in Villas-Boas
(2007), these input costs (ct) are then interacted with brand specific fixed effects
(Bi) for whole and low fat milk, respectively, to allow for cross-sectional variation
B
by fat content and brand. The resulting set of primary instruments is statistically
significant for almost all instruments individually and allows rejecting the
hypothesis of joint model misspecification or insignificance from zero at the 1%
significance value and F-statistic of 476.18. Store fixed effects (Si) are also
included in the final regression to account for varying operational costs and
services by the store and may explain variation retail prices. An indicator of
package material (carton) is further added to capture possible cost differences in
packaging. And finally, observable demand shifters other than price are included
as it is assumed that these are exogenous to weekly or monthly pricing decisions
as decisions about the offered product mix require long term investment choices.
The final regression results in an overall F-statistic of 2789.09 and an R2 of .75.
Rivers and Vuong (1988) and Villas-Boas and Winer (1999) discuss a
two-step approach and more recently Petrin and Train (2004) describe a similar
control function approach followed in this study. This procedure also leads to a
simple test for endogeneity. The first stage is specified as an OLS regression of
the price of product i in week t on the above explanatory variables
pit = Si + β1Bi ct + β1cartoni + β1Zi + ε it , and the vector of OLS first stage residuals
is then included in the second stage conditional logit estimations to correct for
potential bias of the price coefficients due to endogeneity. While this procedure
offers a straightforward way of correcting for endogeneity, it also adds another
source of scaling. Each coefficient increases in value relative to its un-scaled
counterpart, unless price is truly exogenous. 16
15
One argument would be that processors usually offer a range of dairy products, while raw milk
prices are regulated. Their prices might reflect overall variations in dairy input prices.
16
In this model, coefficients are estimated relative to the variance of unobserved factors and only
the ratio of “original” coefficients over this scaling parameter is estimated. If prices are
endogenous and the first stage residual is included in the regression, the variance of the
unobservable factors should be reduced.
Produced by The Berkeley Electronic Press, 200718 Journal of Agricultural & Food Industrial Organization Vol. 5 [2007], Article 4
5. Estimation Results
The first result of this analysis relates to the selection of the market for our
detailed analysis. Only the major markets include organic purchases with varying
frequency. While we cannot control for availability of organic milk in any of
these markets over the time period analyzed, due to unavailable accompanying
store level data, it seems to suggest that organic preferences are more developed
in urban areas and are less of a concern to households in rural areas. The selection
of the market analyzed based on observed organic purchases might also upward
bias our reported results if we generalize them for the entire population. Again,
our data set does not allow us to directly control for availability of organic milk
products.
Another initial result relates to market dynamics of organic milk products.
None of the products labeled as organic prior to the new regulations were re-
categorized after the label change. While all products need to be certified by a
State or private agency accredited under the uniform standards developed by the
USDA, unless the farmers and handlers sell less than $5,000 a year in organic
agricultural products, they do not need to display the USDA organic seal. This is
an interesting result in itself as part of the motivation of the NOP was based on
possible misuse of the term organic, and it was expected that some products
would not be able to carry the organic product specification post implementation.
Based on our sample and the fluid milk market, we do not find evidence of that.
Products only varied in their display of the USDA seal which allows us to identify
the labeling or information effect. The coding included in the data reveals
divergent strategies at the brand level regarding timing of the display of the
USDA seal. This information was verified and edited before by contacting
organic milk processors prior to our final estimation.
5.1 Hedonic Price Function Results
Table 3 summarizes estimates of average willingness to pay for product attributes
included in the hedonic price function regressions and presents robust standard
errors for those estimates clustered by brands. Three regression specifications
were estimated and results mainly serve as a robustness and consistency check for
estimation results in the more flexible discrete choice framework. The base model
specification includes an intercept, different sizes, package materials, fat content,
lactose-free product labeling, as well as the main attributes of interest with regard
to organic labeling —rBGH-free labels, organic labels and the presence of the
USDA organic seal. The second model specification additionally accounts for
time trends in organic preferences and the third model specification estimates a
log-linear functional form to transform the price changes measured in cents into
percentage price changes. All three models were estimated separately for the time
period prior and subsequent to the effective date on the new labeling standards.
http://www.bepress.com/jafio/vol5/iss1/art4Kiesel and Villas-Boas: Consumer Valuations of Milk Labels after Organic Seal 19
Products that carry a USDA seal after October 21, 2002 are also indexed in the
early time period to account for the possibility that they were preferred for other
reasons than the added labeling information.
Table 3: Hedonic price function regression results
Hedonic price function regressions
dependent variable: price (measured in cents and adjusted for size, feature and coupon)
independent variables 1 (base model) 2 (organic time trend) 3 (log price)
before NOP after NOP before NOP after NOP before NOP after NOP
intercept 264.339 *** 263.002 *** 263.970 *** 263.002 *** 5.537 *** 5.537 ***
3.692 4.349 3.680 4.349 0.012 0.015
no rBST label 22.427 *** 36.832 *** 22.320 *** 36.832 *** 0.096 *** 0.143 ***
5.411 7.561 5.428 7.561 0.016 0.021
organic label 192.310 *** 224.209 *** 153.065 *** 224.209 *** 0.394 *** 0.458 ***
20.688 13.257 18.613 13.257 0.024 0.038
organic label*year 33.094 *** 0.052 ***
6.915 0.015
USDA seal 35.639 62.984 *** 31.069 62.984 *** 0.006 0.114 ***
25.004 14.121 22.566 14.121 0.041 0.042
other controls
size (half gallon) 154.936 *** 157.346 *** 155.260 *** 157.346 *** 0.481 *** 0.491 ***
6.279 4.813 6.278 4.813 0.016 0.015
package material (carton) -8.895 11.831 -9.176 11.831 -0.015 0.022
6.788 8.613 6.776 8.613 0.015 0.018
fat free -36.119 *** -42.217 *** -35.578 *** -42.217 *** -0.123 *** -0.146 ***
4.830 5.859 4.773 5.859 0.016 0.021
low fat -3.513 2.790 -3.101 2.790 -0.012 -0.007
4.161 5.299 4.159 5.299 0.013 0.016
lactose free 307.874 *** 301.161 *** 307.783 *** 301.161 *** 0.583 *** 0.566 ***
6.389 12.708 6.389 12.708 0.012 0.022
R squared 0.6758 0.7228 0.6758 0.7228 0.6298 0.6504
Number of observations 27526 12815 27526 12815 27526 12815
Note: robust and clustered (by brand) standard errors are reported, *, **, and *** denote values that are statistically different from 0 at the 10%, 5% and 1% level.
USDA prior to organic standard just indicates the organic products that later carry the standard
NOP=National Organic Program
Overall, the estimated regression coefficients indicate that consumers are willing
to pay a premium for half gallon containers, whole fat content and lactose-free
milk, as well as for all of the labels that address health and environmental related
concerns. Depending on the regression specifications, some consumers are willing
to pay an extra 192 cents for milk labeled as organic, which increases to 224 cents
in the period following labeling changes. These price premiums correspond to a
39.4% and a 45.8% price increase as estimated in the third model specification.
Products that carry the USDA organic seal do not significantly differ in terms of
price premiums from organic milk prior to the implementation of the NOP, but
consumers are estimated to pay an extra 63 cents once the seal was added to milk
containers. This estimate is about twice as large as the estimated yearly organic
time trend in the second specification and amounts to an 11.4% price increase.
Milk that carries an rBGH-free label is estimated to sell at a price premium of 22
cents (9.6%) prior to the implementation of the NOP. This premium increases to
37 cents (14.3%) post introduction.
Produced by The Berkeley Electronic Press, 200720 Journal of Agricultural & Food Industrial Organization Vol. 5 [2007], Article 4
5.2 Logit Results
Estimation results based on logit regression specifications are presented in Table
4. Product prices that are adjusted for size, sales and coupon use, and first stage
residuals that address potential endogeneity of these prices, are added to the
product attributes used in the hedonic regressions. In relating final regression
specifications back to the comparison of random utility differences in equation
(3), it is important that the absolute level of utility is irrelevant to the household’s
choice. The choice probability depends only on differences in utility. Therefore,
not all of the parameters can be identified from the data. Only differences across
products can be investigated, such that the product specific utility of one product
is normalized to zero. In the regression specification, this reference is defined as a
private label gallon of whole conventional milk sold at the biggest supermarket
included in the data. Related to this issue is the scaling parameter implied by a
normalization of the error variance in the derivation of the underlying logit
formula. The true error variance can be expressed as a multiple of the normalized
variance, and the estimated coefficients indicate the effect of each observable
variable relative to the variance of the unobserved factors. 17 Marginal rates of
substitutions are not affected by this scaling, since the scale parameter drops out
of the ratios. Marginal effects are reported in Table 4 rather than the actual
regression coefficients and a comparison of results across specifications need to
look at ratios of these effects e.g. relative to the estimated price effect. Five
alternative model specifications that vary by inclusion of an indicator for branded
products, brand and store dummies, and organic time trends, are reported and
indicate that estimated effects persist even when we account for possible store and
brand preferences, and a general increase in preference for organic milk over
time.
17
The error variance in the logit model is not separately identified and only information about the
signs of the error terms is available post estimation.
http://www.bepress.com/jafio/vol5/iss1/art4You can also read