New Zealand Blood Service Annual Statement of Performance Expectations - 1 July 2017 - 30 June 2018 E.38
←
→
Page content transcription
If your browser does not render page correctly, please read the page content below
E.38

New Zealand Blood Service
       Annual Statement of
 Performance Expectations
        1 July 2017 – 30 June 2018

                     NZBS National Office
                     11 Great South Road
                              Epsom 1051
                       Private Bag 92 071
                      Victoria Street West
                        AUCKLAND 1142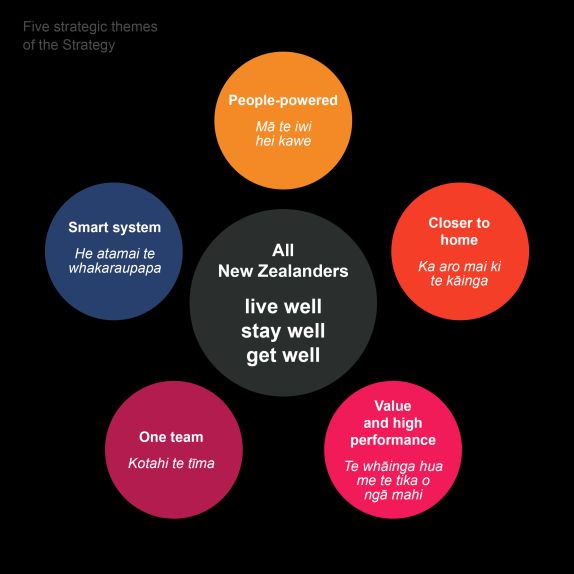
E.38
NZBS ANNNUAL STATEMENT OF PERFORMANCE EXPECTATIONS 1 JULY 2017 TO 30 JUNE 2018

                                          TABLE OF CONTENTS

         1    INTRODUCTION                                                                          1

         PART I

         2    FORECAST STATEMENT OF PERFORMANCE EXPECTATIONS:                                      10
              Period covered: 1 JULY 2017 TO 30 JUNE 2018
               2.1    Forecast Statement of Externally Focused Service Performance                 11

               2.2    Forecast Statement of Internally Focused Service Performance                 13
                      (Capability and Input Measures)

         PART II

         3    FINANCIAL PLAN                                                                       17
               3.1    Overview of Financial Plan                                                   17
               3.2    Key Assumptions                                                              21
               3.3    Forecast Financial Statements                                                27
               3.4    Statement of Accounting Policies                                             30

         Copyright ©. This copyright work is licensed under the Creative Commons Attribution 3.0 New Zealand
         licence. In essence, you are free to copy, distribute and adapt the work, as long as you attribute the work
         to New Zealand Blood Service and abide by the other licence terms. To view a copy of this licence, visit
         http://creativecommons.org/licenses/by/3.0/nz/. Please note that the New Zealand Blood Service logo may
         not be used in any way which infringes any provision of the Flags, Emblems, and Names Protection Act
         1981 or would infringe such provision if the relevant use occurred within New Zealand. Attribution to New
         Zealand Blood Service should be in written form and not by reproduction of the New Zealand Blood Service
                                                                                           NZBS National Office
         logo.
                                                                                           11 Great South Road
                                                                                           Epsom 1051
                                                                                           Private Bag 92 071
                                                                                           Victoria Street West
                                                                                           AUCKLAND 1142
             NEW ZEALAND BLOOD SERVICE
NZBS ANNUAL STATEMENT OF PERFORMANCE EXPECTATIONS 1 JULY 2017 – 30 JUNE 2018
1 INTRODUCTION
Purpose
This Annual Statement of Performance Expectations has been prepared in accordance
with the Crown Entities Act 2004 and should be read in conjunction with the July 2017 –
June 2021 NZBS Statement of Intent (SOI).
It sets out how the New Zealand Blood Service (NZBS) will organise itself and prudently
deploy resources (in line with both the July 2012 Enduring Letter of Expectations from the
Ministers of Health and State Services and the 17th February 2017 Letter of Expectation
from the Minister of Health) to ensure transparency, collaboration and value for money in
the support of New Zealand’s healthcare sector. It identifies for Parliament and the New
Zealand public what NZBS intends to achieve and how performance will be assessed, in
order to deliver on the organisation’s strategic goals1 and its single enduring Output Class
and Outcome:
Health needs of people in New Zealand are supported by the availability of safe
and appropriate blood, blood products, tissue products and related services.
Government Expectations for the 2017/18 Financial Year
This Statement of Performance Expectations has been prepared taking into account the
Minister’s 17 February 2017 Letter of Expectations for the 2017/18 financial year, requiring
NZBS to take a whole of sector view and;
Focus on keeping costs to district health boards as low as possible while continuing
to ensure the safe supply of blood and blood products as and when needed and;
Continue to innovate where appropriate to support this goal.
NZBS will also adhere to the Minister’s more general expectations of:
Ongoing fiscal discipline and prudent financial management;
Contributing as part of the team approach across the health and disability system,
to continue to improve service delivery, building on progress that has already been
made to achieve better results for New Zealanders;
Continuing the commitment to ongoing continuous performance improvement,
including publishing non-sensitive performance information on the NZBS website
to demonstrate openness, transparency and accountability;
Working constructively with the Ministry of Health and;
Demonstrating our commitment and linkage to the New Zealand Health Strategy.
NZBS Strategy
The NZBS strategy is explained in detail in the Statement of Intent. What NZBS plans to
achieve in the 2017/18 year as detailed in Part I of this document is linked to the following
seven strategic goals:
1
See Section 4 of SOI
NEW ZEALAND BLOOD SERVICE Page 1 of 37NZBS ANNUAL STATEMENT OF PERFORMANCE EXPECTATIONS 1 JULY 2017 – 30 JUNE 2018
Strategic Goal
1. NZBS builds on core capabilities to provide a range of products and
services which are appropriate to New Zealand health needs and
priorities.
2. NZBS achieves the highest possible safety and quality standards in all
that it does.
3. NZBS manages a sustainable donor population capable of supporting
ongoing product demand in New Zealand.
4. NZBS relationships with other health sector entities are mutually
supportive and productive.
5. NZBS has a sustainable, competent and engaged workforce.
6. NZBS uses international best practices and internal research and
development capabilities to improve and develop products and services
for the New Zealand health and disability sector.
7. NZBS is a financially sustainable organisation operating effectively and
efficiently.
Business Improvement Activities
In addition to maintaining a safe and secure supply of blood, blood products, tissue
products and related services at all times, NZBS’s main areas of focus for the 2017/18
year are related to the following business improvement activities:
Ensuring Appropriate Blood Product Utilisation
NZBS is a demand driven service. It works in partnership with prescribing clinicians in the
District Health Boards (DHBs) and with Hospital Transfusion Committees to ensure
clinically appropriate utilisation of blood and blood products. This is very effective, as
evidenced by the ongoing reduction in demand for Red Blood Cells (RBCs) as DHBs, with
the support of NZBS, have progressively implemented patient blood management
programmes. This reduction in RBC prescribing, whilst good medical practice and overall
reducing sector costs, does create financial challenges for NZBS with the associated loss
of production volume and product issues.
Immunoglobulin product utilisation is also closely managed and monitored, as this drives
plasmapheresis collection activity. Historically, the rate of growth in New Zealand has
been lower than that seen in other countries. For example, growth in Australia is
consistently between 11-13% per annum, whereas up until 2015 NZBS growth was on
average 6.5% per annum and since then it has reduced to between 0 – 4%.
These changes in demand are forecast to continue over the 2017/18 period therefore
NZBS will continue to flex its collection activity to align with actual demand in order to
minimise expiry levels.
Collections and Facilities
Over the period of this SPE and the associated SOI, NZBS will seek to ensure optimum
efficiency of the blood collection and processing network. This will include;
The relocation of the Dunedin collection centre in 2017 providing a modern and
future protected site capable of flexing collection mix, particularly plasma capacity
over the long term.
NEW ZEALAND BLOOD SERVICE Page 2 of 37NZBS ANNUAL STATEMENT OF PERFORMANCE EXPECTATIONS 1 JULY 2017 – 30 JUNE 2018
Establishment of processing of Haemopoetic Progenitor Cells (HPC) at the
Wellington site. This will provide support for the stem cell therapy programme in
the Central region.
The refurbishment and improvement of the main Auckland laboratory facilities. By
2020 this will provide a second processing facility (along with Christchurch)
capable of servicing the blood supply for the whole of New Zealand if required.
The Auckland site also houses the National Tissue Typing and National Reference
Laboratory. Growth and new technologies in these areas requires an update in
space and configuration over the next 2 – 3 years.
NZBS leases all of its buildings and regularly reviews its overall facility
infrastructure in response to changes in forecast collection and manufacturing
requirements. The major changes planned are to ensure that New Zealand
maintains at least two hub sites capable of processing the blood product supply for
the entire country whilst providing the most cost effective method of supply chain
management and service delivery.
NZBS will deploy process improvement programmes across our major sites,
utilising LEAN methodologies, to ensure that we can minimise the capital outlay
needed to extend and refurbish those sites. Staff will be supported to lead the
redesign of their working environments with particular focus on the Auckland hub
site which has been signalled for extension and/or refurbishment for several years.
Due to the continued decline in demand for red blood cells and the increasing cost
of facility operations we will consider the potential rationalisation of red blood cell
only collection sites. We will ensure that donors continue to have the ability to
donate locally by enhancing mobile collections.
To accommodate the introduction of Haemopoetic Progenitor Cell processing for
Capital and Coast DHB during 2017, NZBS will determine a clear position on the
capability and capacity requirements of the Wellington site. Any changes to
configuration would be implemented in the 2016/17 and 2017/18 financial years.
Process Improvement activities
Safety is the cornerstone of everything that NZBS does, therefore quality and ongoing
process improvement is embedded in the way that we work.
During 2017/18 NZBS will accelerate process improvements through our ‘Process
Excellence’ programme, aimed at implementing Lean systems and processes
across NZBS operations. This is a multi-year project based on a programme of
work which will engage and develop staff from the front-line in delivering
meaningful improvements, building on NZBS’s culture of safety and excellence. In
addition to direct process improvements, savings targets associated with these
projects have been incorporated within the financial projections.
From 2017, NZBS will be establishing a new Executive management structure.
This is acknowledging the highly specialist nature of the business and the need to
future proof key senior capability. New areas of accountability will ensure an
integrated planning and supply chain function, end-to-end planning and delivery
across the two main operational areas of donor services and technical services
and a focus on business development and future opportunities.
2017/18 will see the implementation of an information system (eTraceline)
supporting New Zealand’s 41 blood banks with efficient and safe ordering and
supply of products. This system fully integrates with the existing NZBS blood
management systems so providing complete “vein to vein” monitoring of the blood
supply as well as positioning the sector for the uptake of emerging technologies
such as ‘smart fridges’.
NEW ZEALAND BLOOD SERVICE Page 3 of 37NZBS ANNUAL STATEMENT OF PERFORMANCE EXPECTATIONS 1 JULY 2017 – 30 JUNE 2018
Sector Relationships
The critical relationship for NZBS is that with the DHBs. Over the term of this SOI, NZBS
aims to work more closely with the DHBs to collaboratively develop a strategy for blood
management in New Zealand so providing a proactive response to changing demand
patterns whilst ensuring prudent financial considerations. Addressing the overall cost to
the sector will require NZBS to focus strongly on business improvement opportunities for
cost containment, use technologies to drive efficiencies and ensure optimal skill mix
models are in place in our workforce.
As New Zealand’s national blood service we are proud and honoured to support the health
needs of New Zealanders. As a demand driven organisation, central to our purpose and
decision making is our core focus to meet the needs of patients, donors and health sector
stakeholders who utilise our services, in a safe, sustainable, high quality manner.
Customer feedback, clinical engagement, research and surveys help inform and guide our
focus on business improvement and service strategy. Over the coming year we plan to
grow our external partnerships and strategic engagements to ensure we are proactively
planning and meeting changing service demand.
We are committed to the direction of the New Zealand Health Strategy and will seek to
align our own strategic activity with that of the sector where pertinent.
Figure 6: Five strategic themes of the New Zealand Health Strategy 2016
Theme 1. People – powered
Our donors and patients are at the forefront of everything that we do. NZBS strives to
ensure information about both the donation process and our therapeutic services is
accessible and well understood. The recent introduction of our mobile donor app
allows donors to interact with NZBS in a highly effective way and remain connected
to the process of donation with ease.
Theme 2. Closer to home
NZBS operates from 8 fixed sites but also travels to over 300 unique locations around
the country allowing a wide range of eligible New Zealanders to donate conveniently.
NZBS also actively supports all 41 blood banks nationally providing a true “vein to
vein” service for all patients regardless of location.
NEW ZEALAND BLOOD SERVICE Page 4 of 37NZBS ANNUAL STATEMENT OF PERFORMANCE EXPECTATIONS 1 JULY 2017 – 30 JUNE 2018
Theme 3. Value and high performance
Our enduring focus on quality and business process improvements contribute to the
system level theme of Value and High Performance. NZBS is actively building a
culture that allows teams and individuals to use data to measure and drive
performance whilst striving for continuous quality improvement.
Theme 4. One team
NZBS is an active partner both clinically and non-clinically with the DHBs and other
stakeholders. We are actively working towards a more collaborative approach to
planning for demand changes and supporting the DHBs with blood management
programmes.
We operate the blood management information systems used by all the DHBs and
constantly seek new ways to support the wider health sector with improved
technologies and enhanced clinical products.
Theme 5. Smart system
The clinical team work closely with DHB clinicians and Hospital Transfusion
Committees to support the development and introduction of new policies and
procedures aimed at improving transfusion outcomes for patients. Initiatives
include a multi-site clinical audit programme and support for clinical transfusion
research studies.
Financial Plan
As a demand responsive service within the public health and disability sector, NZBS has
a constant focus on improving its performance, increasing efficiencies and containing
costs wherever possible. Business improvement initiatives, centred on the application of
LEAN methodologies have been incorporated in the financial forecasts covering this
planning period.
Infrastructure investment has, over the last few years, been a focus and this focus is
maintained over this 4 year planning period, albeit at a lower average annual investment
level. Such investment does introduce additional cost to the business, for example higher
depreciation charges not all of which could / can be immediately offset by savings
initiatives.
NZBS has a statutory responsibility to balance the Minister’s and DHBs’ expectation of
minimising any price increase to the sector with the Crown Entities Act 2004 obligation to
maintain financial viability. Achieving that necessary balance is a constant challenge
particularly in a period of falling or largely minimal demand growth, noting a low growth
outlook is being forecast over this 4 year planning period.
Price Setting
As an operating principle NZBS is committed to keeping any annual price increases to a
minimum in accordance with the annual Minister’s Letter of Expectation albeit that
expectation balanced against the requirement for the organisation to behave in a
financially responsible manner at all times.
Over this 4 year planning period NZBS is forecasting price increases slightly above the
forecast compound Consumer Price Index (CPI) movement which NZBS adopts as its
benchmark for price setting behaviour.
The forecast price settings, including the price settings excluding the price of imported skin
which is subject to currency fluctuation, as compared to the forecast benchmark CPI index
performance and the compound impact over the planning period, are detailed on page 6.
NEW ZEALAND BLOOD SERVICE Page 5 of 37NZBS ANNUAL STATEMENT OF PERFORMANCE EXPECTATIONS 1 JULY 2017 – 30 JUNE 2018
Heading Actual Forecast Forecast Forecast Forecast Forecast
2015/16 2016/17 2017/18 2018/19 2019/20 2020/21
NZBS Weighted Price Increase 0.40% 1.82% 1.99% 1.96% 1.97% 1.90%
excl. Imported Skin
NZBS Weighted Price Increase 0.44% 1.86% 2.05% 2.05% 2.06% 1.98%
- all Products and Services
Consumers Price Index (CPI) 0.42% 1.50% 1.50% 2.10% 1.94% 1.93%
% Movement
Compound % Comparison of
NZBS Price Increases vs CPI
(9.67%) (9.91%) (9.45%) (9.71%) (9.77%) (9.90%)
Index – June 2007 base
(0.0%) = lower NZBS Pricing
to CPI
Over the 2017/18 to 2020/21 4 year planning period NZBS is forecasting a compound
price movement (excl. imported skin) of 8.06% compared with a forecast compound CPI
movement of 7.69%.
The long run NZBS price setting behaviour over the period 1 July 2007 to 30 June 2021,
shows a 9.90% lower compound price increase (net of price rebates to the DHBs) when
compared to the compound CPI movement over the same period.
As a benchmark indicator this comparison validates the long run price setting behaviour
of NZBS as being consistently, post any price rebates, below that of the CPI movement.
DHB Prices for 2017/18
The overall price increase for DHBs, excluding skin product pricing, is a weighted 1.99%
increase with the major category price settings as follows;
Fresh Products - a 1.72% weighted increase across red cells, platelets and fresh
plasma products;
Fractionated Product - a 2.00% weighted increase; and
Services - a 2.42% weighted increase over all service categories.
Price Rebates
NZBS has a mechanism in place to provide a price rebate to the DHBs in the event there
is a level of surplus which is not required by NZBS to meet and discharge its own financial
obligations and responsibilities.
NZBS may generate additional revenue or make savings, as against budget setting, by
events such as:
increases in demand for products and services;
improved fractionation yields;
exchange rate gains; and/or
internal cost efficiencies.
There is no planned price rebate for the 2017/18 financial year. The 4 year financial
projections show no planned price rebates.
Earnings Performance Outlook
NZBS is forecasting operating deficits for the first 2 years of the planning period effectively
absorbing cost on behalf of the sector. In addition NZBS reports non-operating items that
arise from international accounting standards compliance obligations. There are two
reporting compliance items classified by NZBS as non-operating items namely;
Accrued Rent Payable which is a charge arising from the compliance
requirement to amortise the Christchurch Blood Centre lease over the
term of the initial lease. In the first half of the lease term the amortised
NEW ZEALAND BLOOD SERVICE Page 6 of 37NZBS ANNUAL STATEMENT OF PERFORMANCE EXPECTATIONS 1 JULY 2017 – 30 JUNE 2018
charge is higher than the actual lease payment. This difference is treated
as a non-operating charge to earnings with a matching liability accrual
within the Statement of Financial Position.
Unrealised Exchange gains / (losses) that arise from the requirement to
mark forward exchange contracts held by NZBS to market at a month end
or balance date.
Both these items are non-cash in nature but impact the final reported earnings surplus or
(deficit). A cumulative operating deficit of $2.53m is forecast over the 4 year planning
period, noting the latter 2 years of the planning cycle are forecasting small surpluses.
This financial forecast outlook remains consistent with the Minister’s 30 April 2012 letter
to the NZBS Chairman that clarified the expectation of ending the financial year at a
breakeven position wherein it has been further clarified as:
“The requirement to end the financial year at a break-even position does not
necessarily mean NZBS should not plan for a deficit or surplus. Rather, it reflects
the Board’s collective duty to ensure that NZBS operates in a financially
responsible manner.” (letter from Minister to NZBS Chairman dated 30 April 2012)
The earnings performance outlook is detailed below.
Earnings Performance Outlook Forecast Forecast Forecast Forecast Forecast
2016/17 2017/18 2018/19 2019/20 2020/21
EBITDA ($000s) 5,270 5,959 6,726 7,637 8,764
EBIT ($000s) 1,959 1,512 2,063 2,601 3,335
Operating surplus / (deficit) ($000s) (2,004) (1,287) (544) 643 714
Non-Operating items ($000s) (884) 568 331 628 529
Reported surplus (deficit) ($000s) (1,120) (1,855) (875) 15 185
Demonstrating Financial Sustainability
NZBS considers its financial sustainability and the ability to fund its capital programme
from within its own financial resources is best demonstrated by the following specific
measures namely;
EBITDA representing the underlying Earnings performance Before Interest
(finance and capital charges), Taxation (noting NZBS is income tax
exempt), Depreciation and Amortisation (accrued rental liability) charges
as well as any foreign exchange gains or (losses) - realised or unrealised.
Cash generated from operating activities noting NZBS is required to meet
all its capital investment requirements from its operating earnings.
Available working cash without recourse to either the term deposit
programme or external funding sources in order to assist in meeting
planned capital expenditure when that cannot be fully funded from
operating cash flows, noting that those operating cash flows are in turn
influenced by NZBS price settings.
Liquidity capability that is available over and above the working cash
position that could be utilised in a timely manner if the need arose. In the
NZBS context in addition to the available working cash balance, liquidity
capability would comprise the balance of the term deposit programme,
excluding the Adverse Fractionation Event reserve funds of $3.0m, plus the
available undrawn funds under the NZBS funding facility.
NEW ZEALAND BLOOD SERVICE Page 7 of 37NZBS ANNUAL STATEMENT OF PERFORMANCE EXPECTATIONS 1 JULY 2017 – 30 JUNE 2018
The following table sets out these key financial sustainability metrics over the planning
period.
Actual Forecast Forecast Forecast Forecast Forecast
Heading 2015/16 2016/17 2017/18 2018/19 2019/20 2020/21
EBITDA ($000s) 8,260 5,270 5,959 6,726 7,637 8,764
% EBITDA to Revenue 7.23% 4.64% 5.08% 5.53% 6.04% 6.65%
Cash Generated from Operating (968) 4,290 4,268 6,298 4,664 4,897
Activities * ($000s)
that provides for;
Capital Expenditure Programme 5,649 7,721 4,878 3,865 4,762 4,525
($000s)
% of capital expenditure funded
from operating activities 0% 55.57% 87.50% 100.0% 97.94% 100.0%
Available Working Cash at year 3,919 1,385 514 2,647 2,214 2,275
end ($000s)
Liquidity Capability within existing
arrangements ($000s) 7,000 6,000 6,000 6,000 6,000 6,000
Equity ratio % 84.80% 82.29% 81.22% 81.97% 83.07% 83.97%
Term Borrowings including finance
leases ($000s) 7,075 8,253 8,437 7,838 7,264 6,840
* In 2015/16 NZBS reported a negative cash flow from operating activities due to the payment of a
$3.55m price rebate to DHBs relating to the 2014/15 financial year combined with an increase in
inventory associated with the introduction of a second line immunoglobulin product.
The elevated capital expenditure in the 2015/16 and 2016/17 financial years reflects the
eTraceline project ($7.5m) which is an extension of the blood management system
designed to support the blood banking functions across the DHB blood banking network.
NZBS considers the financial management approach reflected in this set of financial
forecasts represents an acceptable balancing between the various competing stakeholder
expectations and the requirement to maintain a sound financial position at all times.
NZBS confirms compliance over the 4 year planning period with its credit facility banking
covenant obligations.
Note: The Financial Plan has made no allowance for the financial impact of any loss
caused by blood component contamination or major manufacturing problems where the
outcome is the responsibility of NZBS. In the 2014/15 financial year NZBS established an
Adverse Fractionation Events reserve of $3.0m to ensure a measure of financial mitigation
exists should an adverse manufacturing event occur.
While component contamination has never occurred these risks remain ever present and
if triggered would represent a significant adverse financial event for the organisation.
NZBS considers the establishment of the Adverse Fractionation Event reserve combined
with the maintaining of a sound financial position provides reasonable assurance NZBS
has the financial capacity to manage such an event out of its own financial resources.
Recourse to the process outlined in 2005 by the Ministry of Health would only occur when
NZBS financial resources proved to be inadequate2.
2
Please see Assumption 19 on page 26
NEW ZEALAND BLOOD SERVICE Page 8 of 37NZBS ANNUAL STATEMENT OF PERFORMANCE EXPECTATIONS 1 JULY 2017 – 30 JUNE 2018
Statement of Performance Expectations Structure
This Statement of Performance Expectations is structured in two parts:
Part I provides a concise tabulated explanation of how performance is to be
assessed for the period 1 July 2017 to 30 June 2018 and in more general terms
for the subsequent 3 years and consists of:
the Forecast Statement of Externally Focused Service Performance which
NZBS will report on in its Annual Report for 2017/18; and
Forecast Statement of Internally Focused Service Performance (Capability
and Input Measures) relating to internal NZBS activities;
Part II presents:
Forecast Financial Statements for the 4 years to 30 June 2021;
Supporting assumptions; and
Statement of Accounting Policies.
David Chamberlain Ian Ward Sam Cliffe
Chairman Deputy Chairman Chief Executive
Date: 19 April 2017
NEW ZEALAND BLOOD SERVICE Page 9 of 37NZBS ANNUAL STATEMENT OF PERFORMANCE EXPECTATIONS 1 JULY 2016 – 30 JUNE 2017
PART I
2 FORECAST STATEMENT OF SERVICE PERFORMANCE
ACTIVITIES - 1 JULY 2017 TO 30 JUNE 2018
NZBS has one overall Output Class, comprising three interrelated outputs related to:
Donors (and patients)
Products and Services
Supply Chain Management – aligning supply with demand
each of which collectively contributes to the achievement of the outcome below:
New Zealand Blood Service Outcome
Health needs of people in New Zealand are supported by the availability of safe
and appropriate blood, blood products, tissue products and related services
Value 2017/18
OUTPUT
$(excl. GST)
Provision of a safe and effective blood service for all New
Zealanders through supply and delivery of: Revenue $118.45m
Fresh Blood Components
Expenses $120.30m
Fractionated Blood Products
Deficit $1.85m
Other products and related services
IMPACT STATEMENT
District Health Boards (DHBs) and private health providers receive a safe and secure
supply of blood, blood products, tissue products and related services at the right place,
at the right time to meet demand at ALL times.
The following table details the external service output performance measures for 2017/18
that will be reported against in the NZBS 2017/18 Annual Report. These output
performance measures are linked to NZBS’s enduring outcome and the following two
externally focused strategic goals:
Strategic Goal 1:
NZBS builds on core capabilities to provide a range of products and services which are
appropriate to New Zealand health needs and priorities; and
Strategic Goal 4:
NZBS relationships with other health sector entities are mutually supportive and
productive.
The outputs outlined below will apply for the 2017/18 year and as forecast for the
subsequent 3 financial years to 30 June 2021.
NEW ZEALAND BLOOD SERVICE Page 10 of 37NZBS ANNUAL STATEMENT OF PERFORMANCE EXPECTATIONS 1 JULY 2017 – 30 JUNE 2018
2.1 FORECAST STATEMENT OF EXTERNALLY FOCUSED SERVICE PERFORMANCE
Performance measures relate to achievement of NZBS’s two externally focused strategic goals and will be reported in the NZBS Annual Report.
WHAT is intended to be achieved HOW performance will be assessed each year
Performance Measures 2012/13 2013/14 2014/15 2015/16 2016/17 2017/18 2018/19 2019/20 2020/21
1. External output measures related to Key Actual Actual Actual Actual Forecast Target Target Target Target
Products and Services which contribute
to achievement of NZBS Enduring
Outcome and Strategic Goal 1.
Product and Service availability
1.1 Key products and services are available at all times NOT ACHIEVED ACHIEVED ACHIEVED ACHIEVED
(24 x 7). Measure is instances when this is not 13 0 0 0 0 0 0 0 0
achieved and which could potentially have a
negative consequence for patients.
2. External output measures related to Actual Actual Actual Actual Forecast Target Target Target Target
Demand Management and the relationship
with DHBs which contribute to
achievement of Strategic Goal 4.
2.1 Planning and Communication with District ACHIEVED ACHIEVED ACHIEVED ACHIEVED
Health Boards (DHBs)
NZBS will demonstrate a productive and supportive Feedback Feedback Feedback Lead DHB CEO NZBS to receive NZBS to receive NZBS to receive NZBS to receive NZBS to receive
relationship with the DHBs consistent with received from the received from the received from the confirmed an open favourable favourable favourable favourable favourable
maintaining a strategic partnership, including Lead DHB CEO Lead DHB CEO Lead DHB CEO communication feedback from the feedback from the feedback from the feedback from the feedback from the
stated; stated; stated; process with DHBs Lead DHB CEO Lead DHB CEO Lead DHB CEO Lead DHB CEO Lead DHB CEO
proactively engaging with them through the Lead
“it would be my “NZBS has fully “NZBS has fully over price setting on maintaining a on maintaining a on maintaining a on maintaining a on maintaining a
DHB CEO to agree pricing matters in a timely and utilisation greater strategic greater strategic greater strategic greater strategic greater strategic
manner in order to inform preparation of DHB assertion that met the met the
NZBS has met its requirements of its requirements of its patterns to inform partnership and partnership and partnership and partnership and partnership and
Annual Plans. Planning and Planning and Planning and the new financial the timely and the timely and the timely and the timely and the timely and
Communications Communications Communications year. To quote: “I relevant provision relevant provision relevant provision relevant provision relevant provision
with DHBs’ with DHBs’ with DHBs’ believe you have of information, of information, of information, of information, of information,
Objective.” performance performance developed an including any including any including any including any including any
measure” measure” open partnership issue resolution issue resolution issue resolution issue resolution issue resolution
with me which will over the course of over the course of over the course of over the course of over the course of
hopefully see a the 2016/17 the 2017/18 the 2018/19 the 2019/20 the 2020/21
greater strategic financial year. financial year. financial year. financial year. financial year.
partnership
developed”.
3
There was 1 occasion in October 2012 when platelets of the right group were not supplied when requested and so were not available when required for a patient. The patient’s clinical condition required that he be
transferred to Auckland City Hospital for urgent neurosurgery and platelets were transfused in Auckland. The patient’s clinician advised that the unavailability of platelets did not contribute to the clinical decision to
transfer the patient nor did it cause any harm to the patient. Following surgery the patient made a good recovery and was transferred back to his DHB of domicile for on-going management.
NEW ZEALAND BLOOD SERVICE Page 11 of 37NZBS ANNUAL STATEMENT OF PERFORMANCE EXPECTATIONS 1 JULY 2017 – 30 JUNE 2018
Performance Measures 2012/13 2013/14 2014/15 2015/16 2016/17 2017/18 2018/19 2019/20 2020/21
2.2 NZBS Reports for DHBs Actual Actual Actual Actual Forecast Target Target Target Target
Monthly demand management reports outlining ACHIEVED ACHIEVED ACHIEVED ACHIEVED
purchase volumes by key product line are Monthly reports Monthly reports Monthly reports Monthly reports Reports are Reports are Reports are Reports are Reports are
provided to DHBs to assist them to manage local detailing product use detailing product detailing product detailing product provided to each provided to each provided to each provided to each provided to
and expiry use and expiry use and expiry use and expiry DHB by the 12th DHB by the 10th DHB by the 10th DHB by the 10th each DHB by
usage and costs.
information provided information provided information provided information provided working day of the working day of working day of working day of the 10th
to all DHBs to all 20 DHBs to all 20 DHBs to all 20 DHBs following month. the following the following the following working day of
throughout 2012/13. throughout 2013/14. throughout 2014/15. throughout 2015/16. month. month. month. the following
month.
2.3 Clinical Oversight Programme Actual Actual Actual Actual Forecast Target Target Target Target
All blood banks located in main DHB hospitals NOT ACHIEVED ACHIEVED ACHIEVED ACHIEVED
(other than the 6 DHBs where NZBS is 96% achievement of 100% achievement 100% achievement 100% achievement
responsible for blood bank provision) will receive a minimum one of a minimum one of a minimum one of a minimum one 100% 100% 100% 100% 100%
clinical visit and clinical visit and clinical visit and clinical visit and
at least 1 NZBS Clinical Oversight visit (and audit report per year to all report per year to all report per year to all report per year to all
report) per year in order to enable them to meet non NZBS managed non NZBS managed non NZBS managed non NZBS managed
the requirements of ISO15189 for IANZ blood banks in main blood banks in main blood banks in main blood banks in main
Accreditation. DHB hospitals DHB hospitals DHB hospitals DHB hospitals
Target for
2.4 Haemovigilance4 - Patient safety Target for Target for Target for
Actual for 2011 Actual for 2012 Actual for 2013 Actual for 2014 Actual for 2015 2019
(measured in calendar years) 2016 calendar 2017 calendar 2018 calendar
calendar year calendar year calendar year calendar year calendar year calendar
year year year
year
2.4.1 To promote risk awareness and best ACHIEVED ACHIEVED ACHIEVED ACHIEVED ACHIEVED
practice in transfusion, NZBS will publish an 2011 Annual 2012 Annual 2013 Annual 2014 Annual 2015 Annual 2016 Annual 2017 Annual 2018 Annual 2019 Annual
annual Haemovigilance Report for each Haemovigilance Haemovigilance Haemovigilance Haemovigilance Haemovigilance Haemovigilance Haemovigilance Haemovigilance Haemovigilanc
calendar year and will share this information Report published Report published Report published Report published Report published Report published Report published Report published e Report
with all DHBs to assist them to reduce the and distributed to and distributed to and distributed to all and distributed to all and distributed to all and distributed to and provided to and provided to published and
DHBs in November DHBs in November DHBs in December DHBs in December DHBs in December all DHBs by all DHBs by all DHBs by provided to all
incidence of adverse transfusion related Quarter 2 of quarter 2 of Quarter 2 of DHBs by
events. 2012 and posted on 2013 and posted on 2014 and posted on 2015 and posted on 2016 and posted on
the NZBS web-site. the NZBS web-site. the NZBS web-site. the NZBS web-site. the NZBS web-site 2017. 2018. 2019. Quarter 2 of
2020.
2.4.2 Number of transfusion related adverse events
occurring as a result of an NZBS “system ACHIEVED ACHIEVED ACHIEVED ACHIEVED
failure” reported to the National
Haemovigilance Programme, with a severity 0 0 0 0 0 0 0 0 0
score greater than 1 and imputability score
classified as likely/probable or certain.5
4
As part of the National Haemovigilance programme DHBs report adverse or unexpected transfusion related events or reactions in blood product recipients to NZBS. Internationally recognised Haemovigilance
classification systems are used to determine severity and imputability (definitions included in glossary). More information on the NZBS Haemovigilance Programme can be found on the NZBS website at:
http://www.nzblood.co.nz/Clinical-information/Haemovigilance-programme
5
This measure reports adverse events that have occurred as a result of NZBS “system failures” and therefore excludes adverse events resulting from a physiological reaction to the transfusion of a biological product.
NEW ZEALAND BLOOD SERVICE Page 12 of 37NZBS ANNUAL STATEMENT OF PERFORMANCE EXPECTATIONS 1 JULY 2017 – 30 JUNE 2018
2.2 FORECAST STATEMENT OF INTERNALLY FOCUSED SERVICE PERFORMANCE (CAPABILITY & INPUT MEASURES)
The following measures relate to achievement of NZBS’s five internally focused strategic goals. They could be considered “proxy output measures” in the context of
NZBS activities and are key contributors to NZBS’s success in achieving its enduring outcome and the external output measures identified in Section 4 of the SOI.
They will therefore also be reported in the NZBS Annual Report.
WHAT is intended to be achieved HOW Performance will be assessed each year
Performance Measures 2012/13 2013/14 2014/15 2015/16 2016/17 2017/18 2018/19 2019/20 2020/21
3. Internal measures related to Products Actual Actual Actual Actual Forecast Target Target Target Target
and Service Quality which contribute to
achievement of Strategic Goal 2
3.1 Donation Testing
Each donation will be tested prior to use in
accordance with the NZBS Manufacturing
Standards (as approved by Medsafe).
No product is released for issue to a patient ACHIEVED ACHIEVED ACHIEVED ACHIEVED
until it has passed all safety tests and 100% tested 100% tested 100% tested 100% tested 100% tested 100% tested 100% tested 100% tested 100% tested
associated records are maintained.
3.2 Regulatory Compliance - Medsafe
NZBS will ensure it maintains Medsafe licences ACHIEVED ACHIEVED ACHIEVED ACHIEVED
for its 6 main sites 100% of the time, to provide 100% 100% 100% 100% 100% 100% 100% 100% 100%
an assurance of GMP compliance. GMP Licensing GMP Licensing GMP Licensing GMP Licensing GMP Licensing GMP Licensing GMP Licensing GMP Licensing GMP Licensing
Compliance Compliance Compliance Compliance Compliance Compliance Compliance Compliance Compliance
maintained maintained maintained maintained
3.3 Regulatory Compliance – IANZ
(International Accreditation New
Zealand)
NZBS will ensure it maintains IANZ ACHIEVED ACHIEVED ACHIEVED ACHIEVED
accreditation 100% of the time at all of its 100% IANZ 100% IANZ 100% IANZ 100% IANZ 100% IANZ 100% IANZ 100% IANZ 100% IANZ 100% IANZ
diagnostic laboratories. accredited accredited accredited accredited accredited accredited accredited accredited accredited
3.4 Regulatory Compliance – ASHI
(American Society of Histocompatibility
and Immunogenetics)
NZBS will maintain ASHI accreditation 100% of MAINTAINED MAINTAINED MAINTAINED MAINTAINED
the time at the national Tissue Typing 100% ASHI 100% ASHI 100% ASHI 100% ASHI 100% ASHI 100% ASHI 100% ASHI 100% ASHI 100% ASHI
laboratory. accredited accredited accredited accredited accredited accredited accredited accredited accredited
Biennial Biennial on-site Biennial on-site Biennial on-site
on-site audit audit completed audit to be audit to be
completed conducted conducted
NEW ZEALAND BLOOD SERVICE Page 13 of 37NZBS ANNUAL STATEMENT OF PERFORMANCE EXPECTATIONS 1 JULY 2017 – 30 JUNE 2018
Performance Measures 2012/13 2013/14 2014/15 2015/16 2016/17 2017/18 2018/19 2019/20 2020/21
4. Internal measures related to Donors Actual Actual Actual Actual Forecast Target Target Target Target
which contribute to achievement of
Strategic Goal 3
4.1 Donor Population
NZBS maintains a donor population capable of These reported numbers represent the donor population required to meet demand and in any given year is constantly flexed to ensure demand
meeting the ongoing demand for blood and alignment in order to minimise expiry.
blood products.
Active whole blood & apheresis donor
121,167 112,744 109,158 110,746 104,868 102,715 102,280 103,456 104,590
panel.
NOTE: The NZBS active Donor population, split between whole blood and apheresis donor panels maintained at levels to support ongoing demand and therefore may be above or below the original target set.
4.2 Donor Satisfaction (old measure)
Measure of overall satisfaction with the quality
of service
Set at > 90% DISCONTINUED
Aspirational target of greater than 90% of NOT ACHIEVED NOT ACHIEVED NOT ACHIEVED NOT ACHIEVED (see new measure below)
donors surveyed state that they are either 88.3% 88.4% 87.9% 88.4% Rating score
“satisfied” or “very satisfied” with the overall
quality of service.
NOTE: From the 2017/18 reporting year a new measure has been developed that is better suited to blood donation and related activities.
4.2 Donor Satisfaction (new measure)
Measure of overall satisfaction with the quality
of service ≥90% ≥90% ≥90% ≥90%
NEW MEASURE
90% of donors give an 8 or higher score out
of 10 of their experience/satisfaction with
the service.
NOTE: This will be ascertained by internal NZBS donor survey conducted 6 monthly. This will be benchmarked against Australian Red Cross Blood Service for comparative purposes.
NEW ZEALAND BLOOD SERVICE Page 14 of 37NZBS ANNUAL STATEMENT OF PERFORMANCE EXPECTATIONS 1 JULY 2017 – 30 JUNE 2018
Performance Measures 2012/13 2013/14 2014/15 2015/16 2016/17 2017/18 2018/19 2019/20 2020/21
4.3 Targeted donor recruitment strategies Actual Actual Actual Actual Forecast Target Target Target Target
(old measure)
4.3.1 Increase percentage of Māori donors on the
ACHIEVED ACHIEVED ACHIEVED ACHIEVED Better than prior
active donor panel from the level achieved in the
prior year.
6.7% 7.7%6 9.3% 9.8% year
DISCONTINUED
4.3.2 Increase the percentage of youth donors (see new measure below)
ACHIEVED ACHIEVED NOT ACHIEVED NOT ACHIEVED
between the ages of 19 – 25 years on the active Better than prior
18.4% 18.8% 18.8% 18.8%
donor panel from the level achieved the prior year
year.7
NOTE: From the 2017/18 reporting year a new measure targeting new and reinstated donor levels is considered an improved performance monitoring metric for these particular donor categories.
4.3 Targeted donor recruitment strategies Actual Actual Actual Actual Forecast Target Target Target Target
(new measure)
4.3.1 Recruit 2,900 new and reinstated Māori donors 2,900 2,900 2,900 2,900
to the active donor panel (each year measure).
NEW MEASURE
4.3.2 Recruit 11,000 new and reinstated youth 11,000 11,000 11,000 11,000
donors between the ages of 16-25 on the
active donor panel (each year measure)8.
NOTE: For clarity, the definition of a New Donor is a donor who has made a valid blood donation for the very first time in New Zealand. The definition of a Reinstated Donor is a person who has made at least
two donations of which one blood donation was made within the last 12 months and the interval between that donation and the prior donation is more than 24 months excluding autologous or therapeutic
donations.
4.4 Raw Material (Collections) Inputs – Actual Actual Actual Actual Forecast Forecast Forecast Forecast Forecast
based on Demand Forecasts Supply Supply Supply Supply Supply Supply Supply Supply Supply
4.4.1 Total Whole Blood donations. 133,255 120,858 120,099 119,967 112,365 110,365 109,000 109,585 110,620
4.4.2 Total Plateletpheresis donations. 6,066 3,942 3,436 3,145 2,985 2,965 3,052 3,100 3,180
4.4.3 Total Plasmapheresis donations. 30,206 32,514 41,438 52,026 54,397 51,842 55,817 59,150 61,000
4.4.4 Total donations. 169,527 157,314 164,973 175,138 169,747 165,172 167,869 171,835 174,800
6
Increase in number of Maori donors as a result of focused recruitment efforts and aligning ethnicity selection to NZ Census definitions
7
Attraction of youth donors assists in future proofing the service – encouraging new donors to replace those who are retiring.
8
Attraction of youth donors assists in future proofing the service – encouraging new donors to replace those who are retiring.
NEW ZEALAND BLOOD SERVICE Page 15 of 37NZBS ANNUAL STATEMENT OF PERFORMANCE EXPECTATIONS 1 JULY 2017 – 30 JUNE 2018
Performance Measures 2012/13 2013/14 2014/15 2015/16 2016/17 2017/18 2018/19 2019/20 2020/21
5. Internal measures related to People Actual Actual Actual Actual Forecast Target Target Target Target
which contribute to achievement of
Strategic Goal 5
5.1 Annual Employee turnover. 12.4% 10.4% 8.1% 9.9% 12.0% 12.0% 12.0% 12.0% 12.0%
5.2 Employee Engagement Index Score from Better than Better than
biennial Staff Engagement Survey using the No survey 68.5%** No survey No survey 71.4% No survey the last No survey the last
JRA and Associates Survey Tool. survey survey
** NOTE: NZBS focus over the 2012/13 and 2013/14 years was on money saving initiatives to address the then decline in revenue relating to reduced clinical prescribing of blood product. The impact of this cost focus combined with
the closure of 2 whole blood collection centres during this period was considered the major contributory factor to the decline in the Employee Engagement Index Score.
6. Internal measure related to
Development which contributes to Actual Forecast Target Target Target Target
achievement of Strategic Goal 6
6.1 Auckland Facility Project PROJECT Business Key milestones Key milestones Key milestones
DEFERRED -
Successful completion of key project case and achieved by 30 achieved by 30 achieved by 30
The Board associated June 2019 in June 2020 in June 2021 in
milestones in accordance with Board approved
deferred this project plan accordance accordance accordance
project plan.
project until for the with the with the with the
2019 when No performance
Measure set for redevelopme approved approved approved
NZBS will nt of the Project Plan. Project Plan. Project Plan.
A new measure in 2015/16 occupy the 2016/17
Auckland site
whole site, facilities
enabling approved by
improved the Board no
flexibility for later than 30
refurbishment June 2018.
work
7. Internal measures related to Financial
Sustainability which contribute to Actual Actual Actual Actual Forecast Forecast Forecast Forecast Forecast
achievement of Strategic Goal 7
7.2 Financial Management Deficit Surplus Surplus Reported Deficit reported Forecast Deficit Achievement Achievement of Achievement of Achievement of
Assure cost efficiency and value for money Reported Reported of budget budget budget budget
management through maintenance of financial Actual – $2.1m Actual – $864k Actual – $4.71m Actual - $2.34m Forecast deficit of Forecast Forecast deficit Forecast Forecast
sustainability in an environment which is deficit surplus surplus deficit $1.12m. deficit of of $875k. surplus of $15k. surplus of
demand driven (i.e. changes in product $1.855m. $185k.
demand – mix and volume by the DHBs,
No Rebate Rebate paid to Rebate paid to No Rebate paid No Rebate Planned No Rebate No Rebate No Rebate No Rebate
impacts on the NZBS financial result).
paid DHBs - $2.0m DHBs - $3.55m. Planned Planned Planned Planned
NEW ZEALAND BLOOD SERVICE Page 16 of 37NZBS ANNUAL STATEMENT OF PERFORMANCE EXPECTATIONS 1 JULY 2017 – 30 JUNE 2018
PART II
3 FINANCIAL PLAN
3.1 OVERVIEW OF FINANCIAL PLAN
The 2017/18 Financial Plan has been based on the 2016/17 base year forecast, incorporating
actual results and trending demand patterns evident as at 31 January 2017.
The NZBS planning environment remains “challenging” with a demand outlook consistent
with blood management practices being constantly assessed and refined by the District
Health Boards (DHBs). Demand for primary fresh products has a mix of either declining or
generally flat demand and this trend (which is being seen globally) is reflected over this four
year planning period.
Using the benchmark of “Product issued / tests performed per 1000 head of population”
NZBS is forecasting the following trends over the planning period for its key blood products
and services.
(a) Fresh Products – 3.95% decline in issues per 1000 head of population
A decrease in fresh product usage per head of population remains a continuing trend
over the forecast timeframe. In 2012/13 fresh products per 1000 head of population
stood at 25.84 fresh product units (Red Blood Cells (RBCs), platelets and clinical
plasma for transfusion) issued per 1000 head of population. By 2015/16, usage had
dropped to 22.65 fresh product units issued per 1000 head of population, a 12.3%
decline over that 3 year period.
Continuation of this declining trend, albeit at a slower decline, is anticipated over this
planning period with fresh product demand forecast to be at 20.65 units issued per
1000 head of population by 2020/21. This represents a 3.95% decrease in issues per
1000 head of population over the planning period.
(b) Immunoglobulin Product – 8.1% increase in grams issued per 1000 head of
population
Unlike fresh blood product, Immunoglobulin product (comprising Intragam P, Evogam
and Privigen product) has generally continued to see year on year increases in
demand. Over the 8 years to 30 June 2016 immunoglobulin annual demand growth
averaged 6.2%. However in the last year the rate of annual increase has slowed
dramatically with a forecast growth in the 2016/17 financial year of just 0.62%.
For the purposes of this planning forecast NZBS has assumed a much lower average
annual growth rate for its immunoglobulin product. Over this 4 year planning period
the average annual growth rate is forecast at 3.1%.
Immunoglobulin usage in 2012/13 totalled 64.7 grams per 1000 head of population.
By 2015/16 this had increased to 76.0 grams per 1000 head of population, a 20.5%
increase over that 3 year period. This level of immunoglobulin usage is significantly
lower than what is reported internationally. As a comparison the Australian
immunoglobulin usage for 2015/16 was reported to be in the order of 206 grams per
1000 head of population.
Based on the growth assumptions inherent in this plan the use of immunoglobulin
product by 2020/21 is forecast to have grown to 81.6 grams per 1000 head of
population growth. This translates to a forecast demand increase per 1000 head of
population of 8.1% over the 4 year planning period.
NEW ZEALAND BLOOD SERVICE Page 17 of 37NZBS ANNUAL STATEMENT OF PERFORMANCE EXPECTATIONS 1 JULY 2017 – 30 JUNE 2018
(c) Services – small 0.83% increase in test volumes performed per 1000 head of
population
Testing services and related activities are forecast to have nominal growth rate over
the 4 year planning period when measured on per 1000 head of population basis. In
2012/13 overall test volumes per 1000 head of population stood at 127.6 test units. By
2015/16 the test unit rate had dropped to 118.2 representing a 7.4% decline over this
3 year period.
For the 2016/17 financial year the test volumes are forecast to have further reduced
to 116.9 test units per 1000 head of population. This current plan forecasts that by
2020/21 test unit volumes will have grown marginally to 117.9 test units per 1000 head
of population.
These mixed demand profiles require NZBS (like all members of the health sector) to work
continuously to improve operational efficiencies and reduce operational cost wherever
possible in order to maintain the delivery of an ongoing cost effective operation.
Over this planning period an ongoing focus on delivering operational efficiencies remains a
key focus in order to mitigate input cost pressures and ensure price increases to the sector
are, ideally, set below the benchmark Consumer Price Index (CPI) annual movement.
The Minister of Health’s clearly stated expectation of NZBS is to keep price increases to
DHBs to a minimum albeit balanced against ensuring the entity remains financially viable at
all times.
NZBS has set itself an average annual operational cost savings target of $630k over the
planning period. NZBS considers its active adoption of LEAN methodologies and other
business improvement techniques will act as the key catalysts to securing those operational
saving efficiencies.
Over this planning period the programme of infrastructure maintenance and renewal
continues, although the level of forecast capital spend over the planning period is forecast to
be at a lower average annual level of $4.5m compared to the average annual spend of $5.6m
in the 3 financial years, 2014/15 through 2016/17.
The major spend in the last 2 financial years ($7.5m) has related to the extension of the blood
management system with the planned addition of eTraceline, a stand-alone system designed
to support the blood banking function within the DHBs. eTraceline is planned to go-live 1 July
2017.
The capital programme over the 4 year planning period is forecast at $18.03m and compares
with a depreciation charge over that same time of $19.58m. The spend analysis by major
category over the planning period comprises;
Facilities - $9.69m. Key projects covered in this plan are;
an extension to and upgrade of the Auckland City Hospital Blood Bank
planned for 2017/18 with NZBS working in conjunction with the landlord,
the Auckland District Health Board. Capital allowance in 2017/18 of
$650k.
Establishment of a Hematopoietic Progenator Cell (HPC) processing
facility at the Wellington blood centre planned for 2017/18. Capital
allowance in 2017/18 of $400k.
Planning for the relocation of the national office during 2018/19 back to
the Auckland Blood Centre (71 Great South Road, Epsom). Once that
has taken place NZBS will have secured sole occupancy of this
important site.
Sole occupancy enables NZBS to then commence a long planned
redevelopment of the site that will ensure it is appropriately configured
to meet the foreseeable future needs of the blood service. This
redevelopment programme is being planned as a likely 3 year
NEW ZEALAND BLOOD SERVICE Page 18 of 37NZBS ANNUAL STATEMENT OF PERFORMANCE EXPECTATIONS 1 JULY 2017 – 30 JUNE 2018
programme with a capital allowance at this early stage in the planning
process of $5.1m.
Planning for the relocation of the North Shore Blood Centre to new
premises at the end of it current lease. The planned timing is for project
commencement in the 2019/20 financial year. Capital allowance of
$1.55m over the 2019/20 and 2020/21 financial years.
Business Systems and IT Infrastructure - $3.87m over the planning period with
the key areas of expenditure identified as;
NZBS Blood Management Systems - $1.50m. In this planning period
there is particular focus on improving the donor experience with, as an
example, the introduction of a self-administered health history
capability. Software upgrades/new installs are planned for donor
management, tissue, cord and stem cell management systems as well
as the piloting of smart fridges post the introduction of eTraceline.
Business Systems - $1.45m. Reflects planned upgrades to various
business systems to improve functional performance. Investment is
planned in the mobile / web applications area combined with the
ongoing investment in business intelligence capabilities.
Network Infrastructure - $0.92m. Investment required to maintain the
existing NZBS network infrastructure noting this level of planned
investment is lower than historically provided for. This is due to NZBS
planning to adopt, where appropriate, ‘software as a service’ cloud
service delivery within the current planning period.
Equipment - $4.47m. A reflection of the ongoing need to maintain all NZBS
equipment over the supply chain in suitable working order, particularly where
the supply chain is subject to GMP compliance requirements. An emerging
trend within the management of the general equipment capital programme has
been the willingness of suppliers to offer a finance leasing alternative to outright
purchase.
NZBS has and plans to continue using the finance lease option which has the
benefit of reducing up-front capital outflows, a lower capital spend in this area
reflected within this planning period.
For NZBS the finance leasing option better aligns with the NZBS ‘pay as you
go’ business model. The finance leasing option also provides improved flexibility
to effect technology driven upgrades with minimum disruption than would occur
if NZBS physically owned the equipment in question.
The Minister and sector’s expectation remains one of fiscal restraint. NZBS is required to
balance that expectation against;
The requirement to fund ongoing capital needs primarily from operational cash flows
and,
the setting of price increases at the minimum required to maintain overall NZBS
financial viability.
In that context this plan sees the projected capital spend of $18.03m being 100% covered via
depreciation charges. In terms of price increases, the price increases forecast over the 4
year planning period are a compound increase of 8.4% compared with a forecast compound
CPI % movement of 7.7% over the same period.
This slightly higher price setting compared to forecast CPI over the planning period is a
reflection of the difficult balancing act NZBS faces whithin a very low volume growth
environment. Low volume growth makes it difficult to adequately absorb increasing input
costs, maintain overall financial viability and keep prices to a minimum. While NZBS has
NEW ZEALAND BLOOD SERVICE Page 19 of 37You can also read