Fund Factsheet - June 2021 - Edelweiss Mutual Fund
←
→
Page content transcription
If your browser does not render page correctly, please read the page content below

Fund Factsheet - June 2021

OUR PRODUCT SUITE
EQUITY HYBRID DEBT PASSIVE OFFSHORE
FUNDS FUNDS FUNDS FUNDS FUNDS
EDELWEISS EDELWEISS EDELWEISS EDELWEISS ETF -
LARGE CAP FUND ARBITRAGE FUND BHARAT BOND ETF EDELWEISS
OVERNIGHT FUND
APRIL 2023 GREATER CHINA
Asset Allocation Duration Range 1 day EQUITY
Marketcap Net Equity Debt Arbitrage
OFF-SHORE
No 0-35% 65-100% FUND
Large Mid Small Open Equity
EDELWEISS EDELWEISS EDELWEISS EDELWEISS ETF -
LARGE & MID CAP FUND EQUITY SAVINGS FUND LIQUID FUND BHARAT BOND ETF EDELWEISS
APRIL 2025 US TECHNOLOGY
Asset Allocation Duration Range 0-3 months
Marketcap EQUITY
Net Equity Debt Arbitrage
FUND OF FUND
Large Mid Small 10-40% 0-35% 25-55%
EDELWEISS EDELWEISS EDELWEISS EDELWEISS
BALANCED ADVANTAGE EDELWEISS
FLEXI-CAP FUND MONEY MARKET FUND EMERGING
FUND NIFTY PSU Bond Plus
Duration Range 0-12 months SDL Index Fund 2026 MARKETS
Asset Allocation
Marketcap OPPORTUNITIES
Net Equity Debt Arbitrage
OFF-SHORE
OFF-SORE
Large Mid Small 30-100% 0-35% 0-50% FUND
EDELWEISS EDELWEISS EDELWEISS
AGGRESSIVE HYBRID EDELWEISS ETF -
MIDCAP FUND BANKING & PSU DEBT EDELWEISS
FUND BHARAT BOND ETF
FUND ASEAN EQUITY
APRIL 2030
Marketcap Asset Allocation Duration Range 1-10 yrs OFF-SHORE
Net Equity Debt
FUND
Large Mid Small 65-80% 20-35%
EDELWEISS EDELWEISS EDELWEISS ETF - EDELWEISS
SMALL CAP FUND GOVERNMENT BHARAT BOND ETF EUROPE
SECURITIES FUND APRIL 2031 DYNAMIC EQUITY
Marketcap Duration Range 1-10 yrs
OFF-SHORE
FUND
Large Mid Small
EDELWEISS
EDELWEISS
RECENTLY
FLEXI-CAPLISTED
FUND EDELWEISS
US VALUE
IPO FUND ETF - NIFTY 50
EDELWEISS EQUITY
Marketcap
ETF - NIFTY 50 OFF-SHORE
FUND
Large Mid Small EDELWEISS
ETF - NIFTY BANK
EDELWEISS
ETF - NIFTY BANK
EDELWEISS
EDELWEISS
NIFTY 100
NIFTY 100
QUALITY 30
QUALITY 30
EDELWEISS
MSCI India
Domestic & World
Healthcare 45
Index Fund
Macaulay duration range & credit profile is indicative. AAA refers to sovereign/A1+ & equivalent, AA refers to AA+/AA/AA-, A refers to A+/A/A-
Market-cap allocation range is indicative. Asset Allocation range is indicative.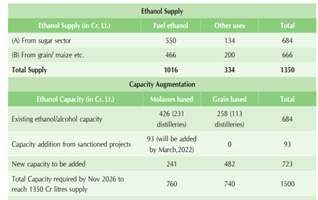
Index

 Markets & Beyond                                                     Page No.
 •   Market Insight                                                       2
 Equity Funds
 •   Edelweiss Large Cap Fund                                             4
 •   Edelweiss Large & Mid Cap Fund                                       5
 •   Edelweiss Flexi-Cap Fund                                             6
 •   Edelweiss Mid Cap Fund                                               7
 •   Edelweiss Small Cap Fund                                             8
 •   Edelweiss Recently Listed IPO Fund                                   9
 •   Edelweiss Long Term Equity Fund (Tax Savings)                       10

 Hybrid Funds
 •   Edelweiss Arbitrage Fund                                            11
 •   Edelweiss Equity Savings Fund                                       12
 •   Edelweiss Aggressive Hybrid Fund                                    13
 •   Edelweiss Balanced Advantage Fund                                   14

 Debt Funds
 •   Edelweiss Overnight Fund                                            15
 •   Edelweiss Liquid Fund                                               16
 •   Edelweiss Money Market Fund                                         17
 •   Edelweiss Banking & PSU Debt Fund                                   18
 •   Edelweiss Government Securities Fund                                19

 Passive Funds
 •   Bharat Bond ETF APRIL 2023                                          20
 •   Bharat Bond ETF APRIL 2025                                          21
 •   Edelweiss Nifty PSU Bond Plus SDL Index Fund 2026                   22
 •   Bharat Bond ETF APRIL 2030                                          23
 •   Bharat Bond ETF APRIL 2031                                          24
 •   Edelweiss ETF - Nifty 50                                            25
 •   Edelweiss ETF - Nifty Bank                                          26
 •   Edelweiss ETF - Nifty 100 Quality 30                                27
 •   Edelweiss MSCI India Domestic & World Healthcare 45 Index Fund      28

 Fund of Funds
 •   Bharat Bond FOF APRIL 2023                                          29
 •   Bharat Bond FOF APRIL 2025                                          30
 •   Bharat Bond FOF APRIL 2030                                          31
 •   Bharat Bond FOF APRIL 2031                                          32

 Overseas Fund of Funds
 •   Edelweiss Greater China Equity Off-Shore Fund                       33
 •   Edelweiss US Technology Fund                                        34
 •   Edelweiss Emerging Markets Opportunities Equity Offshore Fund       35
 •   Edelweiss Asean Equity Off-Shore Fund                               36
 •   Edelweiss Europe Dynamic Equity Off-Shore Fund                      37
 •   Edelweiss US Value Equity Off-Shore Fund                            38
 Schedule
 •   SIP Performance                                                     39
 •   Fund Performance - Direct Plan                                      40
 •   IDCW History                                                        43
 •   Schemes managed by Fund Manager                                     45
 •   Investing made Simple                                               46
 •   How to Read Factsheet                                               47
Why We Own What
We Own

The purpose of this product is to offer a brief & simplified rationale behind our investments in certain businesses/themes in
 our long only portfolios. This is not meant to be an elaborate research report or a recommendation. In this note we explain
                                       why we are positive on India's Bioeconomy theme.

Forging India's Bioeconomy                                      Commercial viability:
We see India paving its way as an “Ethanol Economy”             A series of measures have been taken to make ethanol
owing to rising energy demand .Today, India imports             production more remunerative. As a result, more than
85% of its oil requirement at a net cost of US $ 55 Bn          500 million litres of distillery capacities have been set
(2020-21) majorly used in transportation, hence a               up. Furthermore, encouraging signs of additional
successful Ethanol blending program (20%) can save              capacities would be prevalent as we divert from B-Heavy
the country US $4 billion per annum.                            molasses to Cane juice. The Indian government's
                                                                commitment towards biofuels with a long-term
All the interests are finally aligned:                          direction is positive, as it will give confidence for capex
Sugar is a sector of significant importance to the              in ethanol projects in the country benefitting Praj
national economy. India has now become the world's              Industries (~60% market share).
largest sugar producer and this has resulted into surplus
sugar inventories. However, the Indian sugar industry           Chart1: Ethanol price is attractive to producers and not
has witnessed some stabilisation in the last two years          impacted by crude volatility
due to increased Government regulation and initiatives
There is now a common interest which lies between the
government, the industry and the farmers in keeping
adequate profitability so farmers can be paid on time
and cane arrears do not mount.

Through successful ethanol blending program,
Government can achieve/promote:
v     Make in India
v     Swachh Bharat
v     Doubling of farmers income
v     Promote waste to health generation
v     FX Savings to the exchequer                               Source: Phillip Capital India Research, Industry.

Biofuel policy – a game changer                                 Table1: Ethanol capacity augmentation (20% blending
Currently, petrol with 10% ethanol blend (E10) is being         by 2025-26)
retailed by various Oil Marketing Companies in India.
The current level of average ethanol blending in the
country is 5% (Ethanol Supply Year 2019-20). The
present Government seems to be very serious in
achieving the Ethanol blending target of 20% and has
preponed to achieve this by year 2025 from earlier 2030.
The blending target is achievable in the new construct
owing to changes in “National Bio-fuels Policy 2018”
thereby including wider range of feedstock for ethanol
production.

                                                                Source: Phillip Capital India Research, Industry.

                                                                                                                            2
Why We Own What
We Own
Table 2: Ethanol Required (20% blending by 2025-26) sugar cane. In terms of blending, both the countries
have surpassed 25% where India can also look forward
to.
Structural Story
With the current retail price of petrol being close to INR
100 per litre, the process of new flexi-vehicles will speed
up, as ethanol is under GST (5% rate) and retail prices
could be below INR 70 per litres. There are various ways
to invest in this theme, but at present we are investing
through Praj Industries and not sugar distillery
companies as its marred by political interference and
volatile financials. Over the last several years, Praj has
developed sustainable de-carbonisation solutions with
a unique position in ethanol technology.
Source: Phillip Capital India Research, Industry.
Key Risks:
Bio-mobility: On the way to USA, Brazil model
USA is the largest producer of ethanol followed by Brazil v Availability of sufficient feedstock on a
and both put together contributing 80% of global sustainable basis
production. Brazil is the world's first "sustainable"
biofuels economy and is a model for other countries. It v Weather related issues
produces ethanol from sugarcane, which is the most v Pricing of feedstock and ethanol
successful alternative fuel. It's cost of production is
v Reversal in supportive Government policies
c.US$ 0.5/litres, while in India it is c.US$ 0.45/litres from
B-heavy. India can replicate Brazil, as both have an
agricultural base and are largest producers of
As on July, 2021
Disclaimer
This Note is for information purposes only for distributors and does not constitute an offer or recommendation to buy or sell any
scheme of Edelweiss Mutual Fund. This also does not constitute an offer or recommendation to buy or sell any financial
products offered by Edelweiss. Any action taken by you on the basis of the information contained herein is your responsibility
alone and Edelweiss Asset Management Limited (the AMC)/Edelweiss Trusteeship Company Limited/ Edelweiss Mutual Fund
or its directors or employees will not be liable in any manner for the consequences of such action taken by you. The AMC takes
no responsibility of updating any data/information in this material from time to time. The information shall not be altered in any
way, transmitted to, copied or distributed, in part or in whole, to any other person or to the media or reproduced in any form,
without prior written consent of the AMC.
Mutual Fund investments are subject to market risks, read all scheme related documents carefully.
3Edelweiss An open ended equity scheme
predominantly investing in large
Large Cap Fund cap stocks
Inception Date 20-May-09
Investment Objective (As on 30th June, 2021)
Fund Managers Details
The investment objective is to seek to generate long-term capital appreciation from a portfolio predominantly consisting equity and equity- Fund Managers Experience Managing Since
related securities of the 100 largest corporate by market capitalisation listed in India. However, there is no assurance that the investment
objective of the Scheme will be realized and the Scheme does not assure or guarantee any returns. Mr. Bharat Lahoti 13 years 02-May-17
Mr. Hardik Varma 05 years 11-Nov-19
Top Holdings as on June 30, 2021 Portfolio Analysis: Sector-Wise Fund Size
Month End AUM Monthly Average AUM
Name of Instrument Industry % to Net Financial Services 27.92% Rs. 257.32 Crore Rs. 252.96 Crore
Assets
IT 17.59%
Infosys Ltd. IT 7.45% NAV (as on June 30, 2021)
Consumer Goods 9.76%
HDFC Bank Ltd. Financial Services 7.30%
Pharma 8.98%
Direct Plan IDCW Option 27.8800
ICICI Bank Ltd. Financial Services 6.57%
Reliance Industries Ltd. Oil & Gas 4.28% Direct Plan Growth Option 53.4800
Oil & Gas 5.33%
Bharti Airtel Ltd. Telecom 3.24% Regular Plan IDCW Option 22.6100
Automobile 4.57%
Axis Bank Ltd. Financial Services 3.02% Regular Plan Growth Option 49.5600
Larsen & Toubro Ltd. Construction 2.69% Telecom 3.24%
HCL Technologies Ltd. IT 2.58% Construction 2.69% Minimum Investment Amount
Hindustan Unilever Ltd. Consumer Goods 2.47%
Cement & Cement Products 2.34% Rs. 5000/- and multiple of Re. 1/- thereafter
State Bank Of India Financial Services 2.40%
Tata Consultancy Services Ltd. IT 2.11% Metals 1.78%
Kotak Mahindra Bank Ltd. Financial Services 2.04% Additional investment amount
Divi's Laboratories Ltd. Pharma 1.75% Rs. 500/- per application & in multiples of Re. 1/-
Wipro Ltd. IT 1.68% Market Capitalization (% of total) thereafter
Housing Development
Finance Corp Ltd. Financial Services 1.67% Exit Load
Maruti Suzuki India Ltd. Automobile 1.60% 1.31%
9.82% • If the units are redeemed / switched out on or
Cipla Ltd. Pharma 1.48%
before 365 days from the date of allotment – 1.00%
ITC Ltd. Consumer Goods 1.43%
• If the units are redeemed / switched out after 365
Ultratech Cement Ltd. Cement & Cement Products 1.39%
Avenue Supermarts Ltd. Consumer Goods 1.20% days from the date of allotment – Nil
P I Industries Limited Fertilisers & Pesticides 1.05%
Bharat Petroleum Corporation Ltd. Oil & Gas 1.05% Total Expense Ratios~:
ICICI Lombard General Regular Plan 2.50%
Insurance Co. Ltd. Financial Services 1.03% 88.87% Direct Plan 1.04%
Cadila Healthcare Ltd. Pharma 1.00%
Shree Cement Ltd. Cement & Cement Products 0.95%
HDFC Life Insurance Company Ltd. Financial Services 0.94%
Motherson Sumi Systems Ltd. Automobile 0.93%
Large cap Mid cap Small cap
Marico Ltd. Consumer Goods 0.86%
Eicher Motors Ltd. Automobile 0.83%
Laurus Labs Ltd. Pharma 0.81%
Other 32.20%
Quantitative indicators As on June 30, 2021
21.45% Sharpe 0.96 Active 68
Ratio** bets
Std. Beta Total stocks
deviation 0.46 28.17% in portfolio
Top 10 stocks@ Net Equity Portfolio Turnover Ratio^ Total Portfolio Turnover Ratio^
This product is suitable for investors who are seeking*
42.00% 99.05% Equity F&O 2.34
1.06 1.29 • To create wealth in the long term
• Investment predominantly in equity and equity related
**Risk free rate of return (FIMMDA Overnight MIBOR) 3.36% | @ Top 10 Stock also includes the Future and Options securities including equity derivatives of the 100
largest companies by market capitalization, listed in
India.
Fund Performance as on June 30, 2021 *Investors should consult their financial advisers if in
doubt about whether the product is suitable for them.
Benchmark Additional Benchmark
Scheme - Regular Plan
(Nifty 50 TR Index) (S&P BSE Sensex TR Index)
Period
Returns* Value of Rs. 10000 Returns* Value of Rs. 10000 Returns* Value of Rs. 10000 Investors
Invested Invested Invested AT
E
understand
ER
OD
1 Year 51.14% 15,114 54.58% 15,458 52.38% 15,238 that their
M
3 Year 13.20% 14,517 15.00% 15,220 15.32% 15,350 principal
LOW
will be at
5 Year 14.05% 19,307 15.08% 20,191 15.58% 20,638
Very
Since Inception - Regular Plan 14.12% 49,560 12.72% 42,691 13.07% 44,311 RISKOMETER
High Risk
Past performance may or may not be sustained in future and should not be used as a basis for comparison with other investments.
* CAGR Return.
Notes:
1. Different plans shall have different expense structure. The performance details provided herein are of Regular Plan of Edelweiss Large Cap Fund. Returns are for Growth Option only. In case the
start/end date is non business day, the NAV of previous day is used for computation.
2. The scheme is currently managed by Mr. Bharat Lahoti (Managing this fund from May 2, 2017) & The scheme is currently managed by Mr. Hardik Varma (Managing this fund from May 11, 2019)
Please refer page no. 45 for name of the other schemes currently managed by the Fund Managers and relevant scheme for performance.
3. Standard deviation and Sharpe ratio are annualized.
4. ^ Lower of sales or purchase divided by average AUM for last rolling 12 months.
5. Active bets are those where the fund have exposure away from the weightage as compared to benchmark. Source: Bloomberg.
4Edelweiss An open ended equity scheme
investing in both large cap and
Large & Mid Cap mid cap stocks
Fund
Inception Date 14-Jun-07
Investment Objective (As on 30th June, 2021)
Fund Managers Details
The investment objective of the Scheme is to generate long-term capital appreciation from a diversified portfolio of predominantly Large Cap Fund Managers Experience Managing Since
and Mid Cap equity and equity-related securities However, there can be no assurance that the investment objective of the Scheme will be
realised. Mr. Harshad Patwardhan, 25 years 14-Jun-07
CFA.
Top Holdings as on June 30, 2021 Portfolio Analysis: Sector-Wise Fund Size
Month End AUM Monthly Average AUM
Name of Instrument Industry % to Net Financial Services 26.64% Rs. 834.60 Crore Rs. 809.01 Crore
Assets
IT 10.43% NAV (as on June 30, 2021)
Infosys Ltd. IT 5.57% Consumer Goods 9.46% Direct Plan IDCW Option 22.0380
ICICI Bank Ltd. Financial Services 5.30%
Industrial Manufacturing 8.60% Direct Plan Growth Option 52.1470
HDFC Bank Ltd. Financial Services 4.49%
State Bank Of India Financial Services 3.76% Pharma 7.55% Regular Plan IDCW Option 19.8200
Reliance Industries Ltd. Oil & Gas 2.85% Construction 6.50% Regular Plan Growth Option 47.1820
Axis Bank Ltd. Financial Services 2.82%
Gujarat Gas Ltd. Oil & Gas 2.49% Oil & Gas 5.73%
HCL Technologies Ltd. IT 2.48% Automobile 4.61% Minimum Investment Amount
Mphasis Ltd. IT 2.38%
Cement & Cement Products 4.38% Rs. 5,000/- per application & in multiples of Re. 1/-
SRF Ltd. Industrial Manufacturing 2.29%
Larsen & Toubro Ltd. Construction 2.06% Chemicals 3.06% thereafter
Dr. Reddy's Laboratories Ltd. Pharma 1.95%
Ultratech Cement Ltd. Cement & Cement Products 1.91% Additional investment amount
Bharti Airtel Ltd. Telecom 1.80% Asset Allocation
Market Capitalization
(% of (%
total)
of total) Rs. 500/- per application & in multiples of Re. 1/-
Laurus Labs Ltd. Pharma 1.78% thereafter
Jindal Steel & Power Ltd. Metals 1.75%
Dixon Technologies (india) Ltd. Consumer Goods 1.73%
Balkrishna Industries Ltd. Automobile 1.70% Exit Load
14.13%
Shriram Transport Finance • If the units are redeemed / switched out on or
Company Ltd. Financial Services 1.69% before 12 months from the date of allotment – 1.00%
Crompton Greaves Cons • If the units are redeemed / switched out after 12
Electrical Ltd. Consumer Goods 1.65% months from the date of allotment – Nil
Cummins India Ltd. Industrial Manufacturing 1.62%
Dalmia Bharat Ltd. Cement & Cement Products 1.56%
Chambal Fertilizers & 46.31% Total Expense Ratios~:
Chemicals Ltd. Fertilisers & Pesticides 1.50% 39.56%
Regular Plan 2.36%
Equitas Holdings Ltd. Financial Services 1.48%
The Phoenix Mills Ltd. Construction 1.47%
Direct Plan 0.77%
Minda Industries Ltd. Automobile 1.46%
Ashok Leyland Ltd. Automobile 1.45%
CSB Bank Ltd. Financial Services 1.42%
Praj Industries Ltd. Industrial Manufacturing 1.35%
Large cap Mid cap Small cap
Cipla Ltd. Pharma 1.33%
Other 32.91%
Quantitative indicators As on June 30, 2021
21.59% Sharpe 0.88 Active 65
Ratio** bets
Std. Beta Total stocks
deviation in portfolio
0.58 60.00%
Top 10 stocks
@
Net Equity Portfolio Turnover Ratio^ Total Portfolio Turnover Ratio^
34.43% 96.99% Equity F&O 0.62
0.62 0.00
This product is suitable for investors who are seeking*
**Risk free rate of return (FIMMDA Overnight MIBOR) 3.36% | @ Top 10 Stock also includes the Future and Options
• Long-term capital growth.
• Investments predominantly in equity and equity related
Fund Performance as on June 30, 2021 securities of large & mid cap companies.
*Investors should consult their financial advisers if in
Benchmark Additional Benchmark doubt about whether the product is suitable for them.
Scheme - Regular Plan
(Nifty Large Midcap 250 TR Index) (Nifty 50 TR Index)
Period
Returns* Value of Rs. 10000 Returns* Value of Rs. 10000 Returns* Value of Rs. 10000
Invested Invested Invested E
Investors
AT
64.27% 16,427 67.87% 16,787 54.58% 15,458 understand
ER
1 Year
OD
that their
M
3 Year 15.89% 15,576 16.18% 15,694 15.00% 15,220
principal
5 Year 15.53% 20,587 16.74% 21,692 15.08% 20,191
LOW
will be at
Since Inception - Regular Plan 11.67% 47,182 12.85% 54,708 11.21% 44,534 Very
RISKOMETER
High Risk
Past performance may or may not be sustained in future and should not be used as a basis for comparison with other investments.
* CAGR Return.
Notes:
1. Different plans shall have different expense structure. The performance details provided herein are of Regular Plan of Edelweiss Large & Mid Cap Fund. Returns are for Growth Option only. Since
Inception returns are calculated on Rs. 10/- invested at inception of the scheme. In case the start/end date is non business day, the NAV of previous day is used for computation.
2. The scheme is currently managed by Harshad Patwardhan (managing this fund from June 14, 2007). Please refer page no. 45 for name of the other schemes currently managed by the Fund
Managers and relevant scheme for performance.
3. Standard deviation and Sharpe ratio are annualized.
4. ^ Lower of sales or purchase divided by average AUM for last rolling 12 months.
5. Active bets are those where the fund have exposure away from the weightage as compared to benchmark. Source: Bloomberg.
6. Please note that the scheme is acquired from JPMorgan mutual fund on and from the close of business hours of November 25, 2016, hence disclosure requirement vide SEBI Circular no.
SEBI/HO/IMD/DF3/CIR/P/2018/69 dated April 12, 2018 on performance disclosure post consolidation/ Merger of Schemes, prior to acquisition date, is not provided.
5Edelweiss An open ended dynamic equity scheme investing
across large cap, mid cap, small cap stocks
Flexi-Cap Fund
Inception Date 3-Feb-15
Investment Objective (As on 30th June, 2021)
Fund Managers Details
The investment objective of the Scheme is to generate long-term capital appreciation from a diversified portfolio that dynamically invests
Fund Managers Experience Managing Since
in equity and equity-related securities of companies across various market capitalisation. However, there can be no assurance that the
investment objective of the Scheme will be realized. Mr. Harshad Patwardhan, 25 years 03-Feb-15
CFA.
Top Holdings as on June 30, 2021 Portfolio Analysis: Sector-Wise
Fund Size
Name of Instrument Industry % to Net Month End AUM Monthly Average AUM
Financial Services 30.71%
Assets
Rs. 760.51 Crore Rs. 748.33 Crore
Infosys Ltd. IT 7.88% IT 13.50%
ICICI Bank Ltd. Financial Services 7.42% Consumer Goods 8.50%
HDFC Bank Ltd. Financial Services 6.33% Industrial Manufacturing 7.59% NAV (as on June 30, 2021)
State Bank Of India Financial Services 3.83% Pharma 7.38% Direct Plan IDCW Option 18.9310
HCL Technologies Ltd. IT 3.35%
Construction 7.19% Direct Plan Growth Option 22.2490
Axis Bank Ltd. Financial Services 3.28%
Oil & Gas 5.22% Regular Plan IDCW Option 17.5400
Larsen & Toubro Ltd. Construction 2.65%
Cement & Cement Products
Regular Plan Growth Option 20.5450
Reliance Industries Ltd. Oil & Gas 2.52% 4.79%
Dr. Reddy's Laboratories Ltd. Pharma 2.28% Automobile 4.23%
Mphasis Ltd. IT 2.27% Minimum Investment Amount
Metals 2.72%
Hindustan Unilever Ltd. Consumer Goods 2.10% Rs. 5,000/- per application & in multiples of Re. 1/-
Gujarat Gas Ltd. Oil & Gas 2.02% thereafter
SRF Ltd. Industrial Manufacturing 1.97%
Ultratech Cement Ltd. Cement & Cement Products 1.95%
Market Capitalization (% of total)
Additional investment amount
Dixon Technologies (india) Ltd. Consumer Goods 1.88%
Rs. 500/- per application & in multiples of Re 1/-
Tata Steel Ltd. Metals 1.69%
thereafter
Dalmia Bharat Ltd. Cement & Cement Products 1.68%
Bharti Airtel Ltd. Telecom 1.67% 16.01%
Equitas Holdings Ltd. Financial Services 1.65% Exit Load
Cipla Ltd. Pharma 1.62% • If the units are redeemed / switched out on or
Ashok Leyland Ltd. Automobile 1.56% before 12 months from the date of allotment – 1.00%
CSB Bank Ltd. Financial Services 1.48% • If the units are redeemed / switched out after 12
Praj Industries Ltd. Industrial Manufacturing 1.47% months from the date of allotment – Nil
26.47% 57.51%
Minda Industries Ltd. Automobile 1.34%
Balkrishna Industries Ltd. Automobile 1.33%
Total Expense Ratios~:
Brigade Enterprises Ltd. Construction 1.32%
Shriram Transport Finance Regular Plan 2.35%
Company Ltd. Financial Services 1.31% Direct Plan 0.60%
Amber Enterprises India Ltd. Consumer Goods 1.27%
Large cap Mid cap Small cap
Creditaccess Grameen Ltd. Financial Services 1.27%
Cummins India Ltd. Industrial Manufacturing 1.24%
Other 26.37%
Quantitative indicators As on June 30, 2021
21.89% Sharpe 0.95 Active 58
Ratio** bets
Std. Beta Total stocks
deviation 0.47 59.10% in portfolio
Top 10 stocks@ Net Equity Portfolio Turnover Ratio^ Total Portfolio Turnover Ratio^
41.81% 98.39% Equity F&O 0.60
0.60 0.00
This product is suitable for investors who are seeking*
**Risk free rate of return (FIMMDA Overnight MIBOR) 3.36% | @ Top 10 Stock also includes the Future and Options
• Long Term Capital Growth
• Investment in equity and equity-related securities of
Fund Performance as on June 30, 2021 companies across various market capitalisations.
*Investors should consult their financial advisers if in
Benchmark Additional Benchmark doubt about whether the product is suitable for them.
Scheme - Regular Plan
(Nifty 500 TR Index) (Nifty 50 TR Index)
Period
Returns* Value of Rs. 10000 Returns* Value of Rs. 10000 Returns* Value of Rs. 10000
Invested Invested Invested E
Investors
AT
understand
ER
1 Year 61.42% 16,142 60.77% 16,077 54.58% 15,458
OD
that their
M
3 Year 13.62% 14,678 15.00% 15,220 15.00% 15,220 principal
LOW
5 Year 15.49% 20,551 15.40% 20,473 15.08% 20,191 will be at
Since Inception - Regular Plan 11.89% 20,545 11.73% 20,354 10.96% 19,476 Very
RISKOMETER
High Risk
Past performance may or may not be sustained in future and should not be used as a basis for comparison with other investments.
* CAGR Return.
Notes:
1. Different plans shall have different expense structure. The performance details provided herein are of Regular Plan of Edelweiss Flexi-Cap Fund. Returns are for Growth Option only. Since Inception
returns are calculated on Rs. 10/- invested at inception of the scheme. In case the start/end date is non business day, the NAV of previous day is used for computation.
2. The scheme is currently managed by Harshad Patwardhan (managing this fund from February 3, 2015). Please refer page no. 45 for name of the other schemes currently managed by the Fund
Managers and relevant scheme for performance.
4. ^ Lower of sales or purchase divided by average AUM for last rolling 12 months.
5. Active bets are those where the fund have exposure away from the weightage as compared to benchmark. Source: BSE, Bloomberg.
6. Please note that the scheme is acquired from JPMorgan mutual fund on and from the close of business hours of November 25, 2016, hence disclosure requirement vide SEBI Circular no.
SEBI/HO/IMD/DF3/CIR/P/2018/69 dated April 12, 2018 on performance disclosure post consolidation/ Merger of Schemes, prior to acquisition date, is not provided.
6Edelweiss An open ended equity scheme
predominantly investing in mid
Mid Cap Fund cap stocks
Inception Date 26-Dec-2007
Investment Objective (As on 30th June, 2021) Fund Managers Details
The investment objective is to seek to generate long-term capital appreciation from a portfolio that predominantly invests in equity and Fund Managers Experience Managing Since
equity-related securities of Mid Cap companies. However, there can be no assurance that the investment objective of the Scheme will be Mr. Harshad Patwardhan, 25 years 26-Dec-07
realised.
CFA.
Fund Size
Top Holdings as on June 30, 2021 Portfolio Analysis: Sector-Wise Month End AUM Monthly Average AUM
Rs. 1,486.84 Crore Rs. 1,436.57 Crore
Name of Instrument Industry % to Net
Assets Financial Services 19.66%
NAV (as on June 30, 2021)
Mphasis Ltd. IT 3.55% Industrial Manufacturing 14.57%
Direct Plan IDCW Option 38.0750
Shriram Transport Finance Consumer Goods 12.74%
Direct Plan Growth Option 49.7190
Company Ltd. Financial Services 3.28%
Pharma 7.74% Regular Plan IDCW Option 27.8770
Laurus Labs Ltd. Pharma 3.28%
SRF Ltd. Industrial Manufacturing 2.97% Automobile 6.99% Regular Plan Growth Option 45.1550
Dalmia Bharat Ltd. Cement & Cement Products 2.82% IT 6.64%
Gujarat Gas Ltd. Oil & Gas 2.74%
Cement & Cement Products 5.14% Minimum Investment Amount
Balkrishna Industries Ltd. Automobile 2.53%
Dixon Technologies (india) Ltd. Consumer Goods 2.52% Construction 4.73% Rs. 5,000/- per application & in multiples of Re. 1/-
Tata Power Company Ltd. Power 2.50% Chemicals 3.68% thereafter
The Federal Bank Ltd. Financial Services 2.44%
Fertilisers & Pesticides 3.13%
Praj Industries Ltd. Industrial Manufacturing 2.34%
Cholamandalam Investment Additional investment amount
& Fin Co Ltd. Financial Services 2.31% Rs. 500/- per application & in multiples of Re. 1/-
Max Financial Services Ltd. Financial Services 2.27% Asset Allocation
Market Capitalization
(% of (%
total)
of total) thereafter
Crompton Greaves Cons
Electrical Ltd. Consumer Goods 2.27%
Ashok Leyland Ltd. Automobile 2.25% Exit Load
Apollo Hospitals Enterprise Ltd. Healthcare Services 2.19% 1.96%
• If the units are redeemed / switched out on or
Cummins India Ltd. Industrial Manufacturing 2.08%
Emami Ltd. Consumer Goods 2.04% before 12 months from the date of allotment – 1.00%
City Union Bank Ltd. Financial Services 2.00% • If the units are redeemed / switched out after 12
26.98%
Bharat Electronics Ltd. Industrial Manufacturing 1.95% months from the date of allotment – Nil
Jindal Steel & Power Ltd. Metals 1.95%
PI Industries Limited Fertilisers & Pesticides 1.90% 71.06%
Voltas Ltd. Consumer Goods 1.87% Total Expense Ratios~:
Equitas Holdings Ltd. Financial Services 1.68% Regular Plan 2.14%
Birlasoft Ltd. IT 1.60% Direct Plan 0.66%
JK Cement Ltd. Cement & Cement Products 1.58%
CSB Bank Ltd. Financial Services 1.56%
Minda Industries Ltd. Automobile 1.54%
Amber Enterprises India Ltd. Consumer Goods 1.49%
Persistent Systems Ltd. IT 1.49%
Other 33.01% Mid cap Small cap Large cap
Quantitative indicators As on June 30, 2021
25.37% 0.88 64
Sharpe Active
Ratio** bets
Std. Beta Total stocks
deviation 0.59 57.51% in portfolio
Top 10 stocks
@
Net Equity Portfolio Turnover Ratio^ Total Portfolio Turnover Ratio^
Equity F&O This product is suitable for investors who are seeking*
28.63% 96.90% 0.66
0.66 0.00
• Long Term Capital Growth
• Investments predominantly in equity and equity related
**Risk free rate of return (FIMMDA Overnight MIBOR) 3.36% | @ Top 10 Stock also includes the Future and Options securities of mid cap companies.
*Investors should consult their financial advisers if in
doubt about whether the product is suitable for them.
Fund Performance as on June 30, 2021 ^The Fund Manager may from time to time include other
equity and equity related securities outside the universe
Benchmark to achieve optimal portfolio construction
Scheme - Regular Plan Additional Benchmark
(Nifty Midcap 100 TR Index) (Nifty 50 TR Index)
Period
Returns* Value of Rs. 10000 Returns* Value of Rs. 10000 Returns* Value of Rs. 10000 Investors
Invested Invested Invested AT
E
understand
ER
OD
1 Year 87.51% 18,751 84.97% 18,497 54.58% 15,458 that their
M
3 Year 18.43% 16,626 15.13% 15,273 15.00% 15,220 principal
LOW
will be at
5 Year 17.92% 22,812 15.50% 20,566 15.08% 20,191
Very High Risk
Since Inception - Regular Plan 11.80% 45,155 9.91% 35,883 8.58% 30,432 RISKOMETER
Past performance may or may not be sustained in future and should not be used as a basis for comparison with other investments.
* CAGR Return.
Notes:
1. Different plans shall have different expense structure. The performance details provided herein are of Regular Plan of Edelweiss Mid Cap Fund. Returns are for Growth Option only. Since Inception
returns are calculated on Rs. 10/- invested at inception of the scheme. In case the start/end date is non business day, the NAV of previous day is used for computation.
2. The scheme is currently managed by Harshad Patwardhan (managing this fund from December 26, 2007). Please refer page no. 45 for name of the other schemes currently managed by the Fund
Managers and relevant scheme for performance.
3. Standard deviation and Sharpe ratio are annualized. 4. ^ Lower of sales or purchase divided by average AUM for last rolling 12 months.
5. Active bets are those where the fund have exposure away from the weightage as compared to benchmark. Source: Bloomberg.
6. Please note that Edelweiss Emerging Leaders Fund was merged with JP Morgan India Mid and Small Cap Fund and feature of JP Morgan India Mid and Small Cap Fund was retained with surviving
scheme name as Edelweiss Mid and Small Cap Fund. Further, performance details as per SEBI Circular dated April 12, 2018 of JP Morgan schemes prior to acquisition data is not provided.
7Edelweiss An open ended equity scheme
predominantly investing in small
Small Cap Fund cap stocks
Inception Date 07-Feb-19
Investment Objective (As on 30th June, 2021)
Fund Managers Details
The investment objective of the scheme is to generate long term capital appreciation from a portfolio that predominantly invests in equity and
equity related securities of small cap companies. However, there can be no assurance that the investment objective of the Scheme will be Fund Managers Experience Managing Since
realised. Mr. Harshad Patwardhan, 25 years 07-Feb-19
CFA.
Fund Size
Top Holdings as on June 30, 2021 Portfolio Analysis: Sector-Wise Month End AUM Monthly Average AUM
Rs. 956.47 Crore Rs. 926.27 Crore
Name of Instrument Industry % to Net
Industrial Manufacturing 15.31% NAV (as on June 30, 2021)
Assets
Persistent Systems Ltd. IT 3.05% Consumer Goods 13.06% Direct Plan IDCW Option 20.5300
Chambal Fertilizers & Chemicals Ltd. Fertilisers & Pesticides 2.99% Financial Services 11.94% Direct Plan Growth Option 21.7410
Dixon Technologies (india) Ltd. Consumer Goods 2.94% Construction 8.90% Regular Plan IDCW Option 19.7420
Praj Industries Ltd. Industrial Manufacturing 2.71% It Regular Plan Growth Option 20.9500
8.62%
APL Apollo Tubes Ltd. Metals 2.60%
Services 8.54%
JB Chemicals &
Pharmaceuticals Ltd. Pharma 2.38% Pharma 6.37% Minimum Investment Amount
Laurus Labs Ltd. Pharma 2.15% Chemicals 5.71% Minimum of Rs. 5,000/ and multiples of Re. 1/
Birlasoft Ltd. IT 2.04% Metals 5.02%
thereafter.
Gateway Distriparks Ltd. Services 2.01%
Cement & Cement Products 4.76%
Amber Enterprises India Ltd. Consumer Goods 1.98% Additional investment amount
Dalmia Bharat Ltd. Cement & Cement Products 1.89%
Rs.500/ and in multiples of Re. 1/ thereafter.
CSB Bank Ltd. Financial Services 1.82%
Ratnamani Metals & Tubes Ltd. Metals 1.81% Asset Allocation
Market Capitalization
(% of (%
total)
of total)
GMM Pfaudler Ltd. Industrial Manufacturing 1.80%
Exit Load
Mphasis Ltd. IT 1.80% If the units are redeemed / switched out on or
TCI Express Ltd. Services 1.78% before 12 months from the date of allotment -1.00%
Equitas Holdings Ltd. Financial Services 1.73% 22.53% If the units are redeemed / switched out after 12
Mastek Ltd. IT 1.73% months from the date of allotment Nil
JK Cement Ltd. Cement & Cement Products 1.66%
Century Plyboards (india) Ltd. Consumer Goods 1.66% Total Expense Ratios~:
77.47%
KEC International Ltd. Construction 1.65% Regular Plan 2.29%
KEI Industries Ltd. Industrial Manufacturing 1.65% Direct Plan 0.62%
Indian Energy Exchange Ltd. Financial Services 1.62%
Sudarshan Chemical Industries Ltd. Chemicals 1.61%
Grindwell Norton Ltd. Industrial Manufacturing 1.60%
Garware Technical Fibres Ltd. Textiles 1.57%
Multi Commodity Exchange
of India Ltd. Financial Services 1.55%
Brigade Enterprises Ltd. Construction 1.48% Small cap Mid cap
Timken India Ltd. Industrial Manufacturing 1.47%
NCC Ltd. Construction 1.46%
Other 41.81%
Quantitative indicators As on June 30, 2021
76.62% Total stocks 24.85%
in portfolio Net Equity
Active Top 10 stocks
bets
70 98.33%
Portfolio Turnover Ratio^ Total Portfolio Turnover Ratio^
This product is suitable for investors who are seeking*
Equity F&O • Long Term Capital Appreciation Growth
0.57 0.00 0.57
• Investments predominantly in equity and equity related
securities of small cap companies.
*Investors should consult their financial advisers if in
doubt about whether the product is suitable for them.
Fund Performance as on June 30, 2021 ^The Fund Manager may from time to time include other
equity and equity related securities outside the universe
Benchmark Additional Benchmark to achieve optimal portfolio construction
Scheme - Regular Plan
(Nifty Smallcap 250 TRI) (Nifty 50 TR Index)
Period
Returns* Value of Rs. 10000 Returns* Value of Rs. 10000 Returns* Value of Rs. 10000
Invested Invested Invested E
Investors
AT
understand
ER
1 Year 105.82% 20,582 109.40% 20,940 54.58% 15,458
OD
that their
M
3 Year NA NA NA NA NA NA principal
LOW
5 Year NA NA NA NA NA NA will be at
Since Inception - Regular Plan 36.19% 20,950 26.29% 17,489 17.23% 14,632 Very High Risk
RISKOMETER
Past performance may or may not be sustained in future and should not be used as a basis for comparison with other investments.
* CAGR Return.
Notes:
1. Different plans shall have different expense structure.
2. The scheme is currently managed by Harshad Patwardhan (managing this fund from February 07, 2019). Please refer page no. 45 for name of the other schemes currently managed by the Fund
Managers and relevant scheme for performance.
3. Active bets are those where the fund have exposure away from the weightage as compared to benchmark. Source: Bloomberg.
8Edelweiss Recently An open-ended equity scheme following
investment theme of investing in recently
Listed IPO Fund listed 100 companies or upcoming Initial
Public Offer (IPOs)
Note: Edelweiss Maiden Opportunities Fund Series 1 (a closed ended scheme) was converted into Edelweiss Recently Listed IPO Fund
(an open ended scheme) and is now open for investment effective from June 29, 2021.
Inception Date 22-Feb-18
Investment Objective (As on 30th June, 2021)
Fund Managers Details
The investment objective of the Scheme is to seek to provide capital appreciation by investing in equity and equity related securities of
recently listed 100 companies or upcoming Initial Public Offers (IPOs). However, there can be no assurance that the investment objective of Fund Managers Experience Managing Since
the Scheme will be realised. Mr. Bharat Lahoti 13 years 22-Feb-18
Mr. Bhavesh Jain 11 years 22-Feb-18
Top Holdings as on June 30, 2021 Portfolio Analysis: Sector-Wise Fund Size
Name of Instrument Industry % to Net Month End AUM Monthly Average AUM
Financial Services 40.26%
Assets Rs. 431.09 Crore Rs. 463.97 Crore
Consumer Goods 18.32%
Dixon Technologies (india) Ltd. Consumer Goods 6.76% NAV (as on June 30, 2021)
Avenue Supermarts Ltd. Consumer Goods 5.39% IT 8.04%
Direct Plan IDCW Option 17.0705
Metropolis Healthcare Ltd. Healthcare Services 5.12% Pharma 6.36% Direct Plan Growth Option 17.0704
Gland Pharma Ltd. Pharma 4.92%
ICICI Lombard General Healthcare Services 6.17% Regular Plan IDCW Option 16.8239
Insurance Co. Ltd. Financial Services 4.51% Services 5.85% Regular Plan Growth Option 16.8242
HDFC Life Insurance Company Ltd. Financial Services 4.45%
HDFC Asset Management Industrial Manufacturing 3.98%
Company Ltd. Financial Services 4.32% Minimum Investment Amount
Automobile 2.18%
Indian Railway Catering & Rs. 5,000/- and in multiples of Re. 1
Tou. Corp. Ltd. Services 4.24% Chemicals 2.15%
Amber Enterprises India Ltd. Consumer Goods 4.06% Construction 1.15% Additional investment amount
Aavas Financiers Ltd. Financial Services 3.89%
SBI Life Insurance Company Ltd. Financial Services 3.55% Rs. 500/- and in multiples of Re. 1/‐thereafter
Central Depository Services (i) Ltd. Financial Services 3.51% Market Capitalization (% of total)
AU Small Finance Bank Ltd. Financial Services 3.36% Exit Load
Polycab India Ltd. Industrial Manufacturing 2.95%
Upto 180 days : 2%
Affle (india) Ltd. IT 2.73%
Indian Energy Exchange Ltd. Financial Services 2.67% After 180 days : Nil
Bandhan Bank Ltd. Financial Services 2.66%
SBI Cards & Payment Services Ltd. Financial Services 2.55%
30.39% Total Expense Ratios~:
Fine Organic Industries Ltd. Chemicals 2.15% 35.56%
Larsen & Toubro Infotech Ltd. IT 2.00% Regular Plan 2.42%
Computer Age Management Direct Plan 1.27%
Services Ltd. Financial Services 1.96%
Happiest Minds Technologies Ltd. IT 1.69%
L&t Technology Services Ltd. IT 1.62%
Laurus Labs Ltd. Pharma 1.44%
Creditaccess Grameen Ltd. Financial Services 1.23%
Mahindra Logistics Ltd. Services 1.18%
34.06%
Indigo Paints Ltd. Consumer Goods 1.16%
Sona Blw Precision Forgings Ltd. Automobile 1.13%
TCNS Clothing Company Ltd. Textiles 1.08%
Nippon Life India Asset Large cap Mid cap Small cap
Management Ltd. Financial Services 1.05%
Other 10.67%
Quantitative indicators As on June 30, 2021
21.79% Sharpe 0.79 Total stocks 42.09%
Ratio** in portfolio
Std. Beta Active
deviation 0.81 40 bets
Top 10 stocks Net Equity Portfolio Turnover Ratio^ Total Portfolio Turnover Ratio^
48.32% 95.98% Equity F&O
0.64 0.91
0.27
This product is suitable for investors who are seeking*
**Risk free rate of return (FIMMDA Overnight MIBOR) 3.36%
• Long-term capital growth.
• Investment in equity and equity-related securities
Fund Performance as on June 30, 2021 recently listed 100 companies or upcoming Initial
Public Offer (IPOs)
Benchmark Additional Benchmark *Investors should consult their financial advisers if in
Scheme - Regular Plan
(India Recent 100 TR Index) (Nifty 50 TR Index) doubt about whether the product is suitable for them.
Period
Returns* Value of Rs. 10000 Returns* Value of Rs. 10000 Returns* Value of Rs. 10000
Invested Invested Invested
74.95% 17,495 59.29% 15,929 54.58% 15,458 Investors
1 Year AT
E
understand
ER
OD
3 Year 20.97% 17,719 12.33% 14,183 15.00% 15,220 that their
M
5 Year NA NA NA NA NA NA principal
LOW
Since Inception - Regular Plan 16.78% 16,824 9.33% 13,486 14.63% 15,809 will be at
Very
Past performance may or may not be sustained in future and should not be used as a basis for comparison with other investments. RISKOMETER
High Risk
* CAGR Return.
Notes:
1. Different plans shall have different expense structure. The performance details provided herein are of Regular Plan of Edelweiss Recently Listed IPO Fund. Returns are for Growth Option only. In case
the start/end date is non business day, the NAV of previous day is used for computation.
2. The scheme is currently managed by Mr. Bharat Lahoti and Mr. Bhavesh Jain (Managing since Feb 22, 2018). Please refer page no. 45 for name of the other schemes currently managed by the Fund
Managers and relevant scheme for performance.
3. Standard deviation and Sharpe ratio are annualized.
4. ^ Lower of sales or purchase divided by average AUM for last rolling 12 months.
5. Active bets are those where the fund have exposure away from the weightage as compared to benchmark. Source: Bloomberg.
9Edelweiss An open ended equity linked saving
scheme with a statutory lock in of
Long Term Equity 3 years and tax benefit
Fund (Tax Savings)
Inception Date 30-Dec-08
Investment Objective (As on 30th June, 2021)
Fund Managers Details
The primary objective of the Scheme is to generate long-term capital appreciation with an option of periodic payouts at the end of lock in
periods from a portfolio that invests predominantly in equity and equity related instruments. However, there is no assurance that the Fund Managers Experience Managing Since
investment objective of the Scheme will be realized and the Scheme does not assure or guarantee any returns. Mr. Harsh Kothari 8 years 30-Apr-19
Mr. Pratik Dharmshi 9 years 30-Apr-19
Top Holdings as on June 30, 2021 Portfolio Analysis: Sector-Wise Fund Size
Name of Instrument Industry % to Net Month End AUM Monthly Average AUM
Financial Services 33.01%
Assets Rs. 178.48 Crore Rs. 177.08 Crore
IT 13.31%
Infosys Ltd. IT 7.90% NAV (as on June 30, 2021)
Consumer Goods 10.37%
ICICI Bank Ltd. Financial Services 7.21% Direct Plan IDCW Option 25.9200
HDFC Bank Ltd. Financial Services 6.37% Construction 8.18%
Direct Plan Growth Option 70.1300
Axis Bank Ltd. Financial Services 4.84% Pharma 6.10%
Regular Plan IDCW Option 19.2400
State Bank Of India Financial Services 4.18% Oil & Gas 5.37%
Larsen & Toubro Ltd. Construction 3.56% Regular Plan Growth Option 63.4600
Industrial Manufacturing 4.45%
HCL Technologies Ltd. IT 3.10%
Housing Development Cement & Cement Products 4.35% Minimum Investment Amount
Finance Corp Ltd. Financial Services 3.10% Metals 3.55% Rs. 500/- per application & in multiples of Re. 500/-
Reliance Industries Ltd. Oil & Gas 3.04% thereafter
Automobile 3.47%
Bharti Airtel Ltd. Telecom 2.66%
Tata Steel Ltd. Metals 1.78% Additional investment amount
Dixon Technologies (india) Ltd. Consumer Goods 1.71%
Rs. 500/- per application & in multiples of Re 500/-
Ultratech Cement Ltd. Cement & Cement Products 1.71% Market Capitalization (% of total)
thereafter
Equitas Holdings Ltd. Financial Services 1.70%
Minda Industries Ltd. Automobile 1.68%
Emami Ltd. Consumer Goods 1.50% 18.33% Exit Load Nil
Dr. Reddy's Laboratories Ltd. Pharma 1.48%
Greenpanel Industries Ltd. Consumer Goods 1.48% Total Expense Ratios~:
Tata Consultancy Services Ltd. IT 1.47%
Regular Plan 2.37%
Gujarat Gas Ltd. Oil & Gas 1.46%
ITC Ltd. Consumer Goods 1.46% Direct Plan 0.68%
Crompton Greaves Cons 18.50% 63.17%
Electrical Ltd. Consumer Goods 1.38%
Praj Industries Ltd. Industrial Manufacturing 1.33%
KNR Constructions Ltd. Construction 1.31%
GMM Pfaudler Ltd. Industrial Manufacturing 1.30%
Ashoka Buildcon Ltd. Construction 1.29%
Hindalco Industries Ltd. Metals 1.27%
Mahindra Logistics Ltd. Services 1.24%
Ashok Leyland Ltd. Automobile 1.22% Large cap Mid cap Small cap
SBI Life Insurance Company Ltd. Financial Services 1.22%
Other 25.05%
Quantitative indicators As on June 30, 2021
22.18% Sharpe 0.96 Total stocks 56.21%
Ratio** in portfolio
Std. Beta Active
deviation 0.38 57 bets
Top 10 stocks Net Equity Portfolio Turnover Ratio^ Total Portfolio Turnover Ratio^
45.96% 98.59% Equity F&O
0.00 0.56
0.56
This product is suitable for investors who are seeking*
**Risk free rate of return (FIMMDA Overnight MIBOR) 3.36%
• To create wealth in the long term
• Investment in equity and equity-related securities that
Fund Performance as on June 30, 2021 will be locked-in for the first three years.
*Investors should consult their financial advisers if in
Benchmark Additional Benchmark
Scheme - Regular Plan doubt about whether the product is suitable for them.
(Nifty 500 TR Index) (Nifty 50 TR Index)
Period
Returns* Value of Rs. 10000 Returns* Value of Rs. 10000 Returns* Value of Rs. 10000
Invested Invested Invested E
Investors
AT
54.63% 15,463 60.77% 16,077 54.58% 15,458 understand
ER
1 Year
OD
that their
M
3 Year 11.79% 13,978 15.00% 15,220 15.00% 15,220
principal
5 Year 12.31% 17,876 15.40% 20,473 15.08% 20,191
LOW
will be at
Since Inception - Regular Plan 15.92% 63,460 16.49% 67,479 15.61% 61,339 Very
RISKOMETER
High Risk
Past performance may or may not be sustained in future and should not be used as a basis for comparison with other investments.
* CAGR Return.
Notes:
1. Different plans shall have different expense structure. The performance details provided herein are of Regular Plan of Edelweiss Long Term Equity Fund (Tax Savings). Returns are for Growth Option
only. In case the start/end date is non business day, the NAV of previous day is used for computation.
2. The scheme is currently managed by Mr. Harsh Kothari and Mr. Pratik Dharmshi (Managing since April 30, 2019). Please refer page no. 45 for name of the other schemes currently managed by the
Fund Managers and relevant scheme for performance.
3. Standard deviation and Sharpe ratio are annualized.
4. ^ Lower of sales or purchase divided by average AUM for last rolling 12 months.
5. Active bets are those where the fund have exposure away from the weightage as compared to benchmark. Source: Bloomberg.
10Edelweiss An open ended scheme investing in
Arbitrage Fund arbitrage opportunities
Investment Objective (As on 30th June, 2021) Inception Date 27-Jun-14
The investment objective of the Scheme is to generate income by predominantly investing in arbitrage opportunities in the cash and the Fund Managers Details
derivative segments of the equity markets and the arbitrage opportunities available within the derivative segment and by investing the
balance in debt and money market instruments. However, there is no assurance that the investment objective of the Scheme will be realized. Fund Managers Experience Managing Since
Equity Portion:
Top Holdings as on June 30, 2021 Portfolio Analysis: Sector-Wise Mr. Bhavesh Jain 11 years 27-Jun-14
(Quantity fully hedged against derivative) Debt Portion:
Name of Instrument Industry % to Net Mr. Dhawal Dalal 21 years 22-Dec-16
Financial Services 17.37%
Assets
Metals 10.38%
Adani Ports & Special Economic Fund Size
Services 5.71%
Zone Ltd. Services 4.33%
Reliance Industries Ltd. Oil & Gas 3.91% Oil & Gas 5.32% Month End AUM Monthly Average AUM
Bharti Airtel Ltd. Telecom 3.13% Pharma 5.01% Rs. 5,574.75 Crore Rs. 5,406.85 Crore
Vedanta Ltd. Metals 2.83%
IT 4.42%
Tata Steel Ltd. Metals 2.69% NAV (as on June 30, 2021)
ICICI Bank Ltd. Financial Services 2.58% Automobile 3.69%
Steel Authority Of India Ltd. Metals 1.94% Telecom
Direct Plan IDCW Option 11.4134
3.46%
Kotak Mahindra Bank Ltd. Financial Services 1.61% Direct Plan Monthly IDCW Option 13.1157
Consumer Goods 3.16%
JSW Steel Ltd. Metals 1.61% Direct Plan Growth Option 15.9658
Tata Power Company Ltd. Power 1.55% Power 1.57%
Regular Plan IDCW Option 11.2283
Punjab National Bank Financial Services 1.47%
Bank Of Baroda Financial Services 1.37%
Regular Plan Monthly IDCW Option 12.5009
Cadila Healthcare Ltd. Pharma 1.31% Regular Plan Growth Option 15.3014
Tech Mahindra Ltd. IT 1.14%
Asset Allocation (% of total)
ITC Ltd. Consumer Goods 1.08% Minimum Investment Amount
Sun Pharmaceutical Industries Ltd. Pharma 1.03%
6.37% Rs. 5,000/- per application & in multiples of Re. 1/-
Housing Development
Finance Corp Ltd. Financial Services 0.93% thereafter.
Mindtree Ltd. IT 0.92%
Adani Enterprises Ltd. Services 0.84% Additional investment amount
HDFC Bank Ltd. Financial Services 0.82%
Canara Bank Financial Services 0.82% Rs. 500/- per application & in multiples of
26.82% Re. 1/- thereafter
Indusind Bank Ltd. Financial Services 0.78%
Bharat Petroleum Corporation Ltd. Oil & Gas 0.78%
Mahindra & Mahindra Exit Load
Financial Serv Ltd. Financial Services 0.77%
66.81%
Amara Raja Batteries Ltd. Automobile 0.75% • If the units are redeemed / switched out on or
Zee Entertainment Enterprises Ltd. Media & Entertainment 0.74% before 30 days from the date of allotment - 0.10%
Coforge Ltd. IT 0.73%
• If the units are redeemed / switched out on after 30
Motherson Sumi Systems Ltd. Automobile 0.70%
days from the date of allotment - Nil
Apollo Hospitals Enterprise Ltd. Healthcare Services 0.68% Equities Debt Cash & Other Receivables
Deepak Nitrite Ltd. Chemicals 0.67%
Other 55.49% Total Expense Ratios~:
Regular Plan 1.09%
Quantitative indicators As on June 30, 2021
Direct Plan 0.34%
0.37 0.38
Yield to years Average years Std. 2.38
maturity (YTM)# Maturity# deviation Beta
Modified Macaulay# Sharpe
Duration# 0.38 Duration 0.79% Ratio**
3.58% years 0.60
Total stocks
in portfolio Top 10 stocks Portfolio Turnover Ratio^ Total Portfolio Turnover Ratio^
138 26.18% Equity F&O Debt This product is suitable for investors who are seeking*
13.32
3.29 9.98 0.04
• To generate income by predominantly investing in
arbitrage opportunities.
# Yield to maturity (YTM), Modified Duration, Average Maturity and Macaulay Duration for Debt Portion. • Investments predominantly in arbitrage opportunities
**Risk free rate of return (FIMMDA Overnight MIBOR) 3.36% in the cash and derivative segments of the equity
markets and the arbitrage opportunities available
within the derivative segment and by investing the
Fund Performance as on June 30, 2021 balance in debt and money market instruments.
*Investors should consult their financial advisers if in
Benchmark Additional Benchmark
Scheme - Regular Plan $ doubt about whether the product is suitable for them.
(Nifty 50 Arbitrage PR Index ) (CRISIL 1 year T-bill Index)
Period
Returns* Value of Rs. 10000 Returns* Value of Rs. 10000 Returns* Value of Rs. 10000
Invested Invested Invested E
Investors
AT
3.44% 10,344 3.51% 10,351 3.58% 10,358 understand
ER
1 Year
OD
that their
M
3 Year 5.23% 11,654 4.69% 11,476 6.39% 12,047
principal will
5 Year 5.63% 13,155 4.75% 12,610 6.30% 13,576
LOW
be at low risk
Since Inception - Regular Plan 6.25% 15,301 5.51% 14,569 6.82% 15,881
RISKOMETER
Past performance may or may not be sustained in future and should not be used as a basis for comparison with other investments.
* CAGR Return.
Notes:
1. Different plans shall have different expense structure. The performance details provided herein are of Regular Plan of Edelweiss Arbitrage Fund. Returns are for Growth Option only. Since
Inception returns are calculated on Rs.10/- invested at inception of the scheme. In case the start/end date is non business day, the NAV of previous day is used for computation.
2. The scheme is currently managed by Bhavesh Jain (managing this fund from June 27, 2014) and Mr. Dhawal Dalal (Managing this fund from December 22, 2016). Please refer page no. 45 for
name of the other schemes currently managed by the Fund Managers and relevant scheme for performance.
3. Standard deviation and Sharpe ratio are annualized.
4. ^ Lower of sales or purchase divided by average AUM for last rolling 12 months.
5. $ Nifty 50 Arbitrage TR Index is not available on NSE Website
11Edelweiss An Open ended scheme investing in
equity, arbitrage and debt
Equity Savings
Fund
Inception Date 13-Oct-14
Investment Objective (As on 30th June, 2021)
Fund Managers Details
The investment objective of the scheme is to provide capital appreciation and income distribution to the investors by using equity and equity
related instruments, arbitrage opportunities, and investments in debt and money market instruments. However, there can be no assurance Fund Managers Experience Managing Since
that the investment objective of the Scheme will be realized or that income will be generated and the scheme does not assure or guarantee Equity Portion :
any returns. Mr. Bharat Lahoti 13 years 18-Sep-17
Arbitrage Portion:
Top Holdings as on June 30, 2021 Portfolio Analysis: Sector-Wise Mr. Hardik Varma 05 years 27-Sep-19
Debt Portion :
Name of Instrument Industry % to Net Financial Services Mr. Dhawal Dalal 21 years 28-Nov-16
22.62%
Assets
Oil & Gas 8.15%
Reliance Industries Ltd. Oil & Gas 7.59% Fund Size
Services 6.64%
Adani Ports & Special Economic Month End AUM Monthly Average AUM
Zone Ltd. Services 6.32% Consumer Goods 6.22%
Rs. 136.75 Crore Rs. 130.43 Crore
Housing Development Finance IT 5.59%
Corp Ltd. Financial Services 4.39%
Metals 3.91%
Kotak Mahindra Bank Ltd. Financial Services 4.21% NAV (as on June 30, 2021)
Infosys Ltd. IT 3.50% Telecom 2.59%
Direct Plan IDCW Option 13.5897
ICICI Bank Ltd. Financial Services 2.53% Construction 2.27% Direct Plan Growth Option 18.4306
Bharti Airtel Ltd. Telecom 2.20%
Pharma 2.22% Regular Plan IDCW Option 12.2983
HDFC Bank Ltd. Financial Services 2.12%
Steel Authority Of India Ltd. Metals 2.11% Automobile 1.81% Regular Plan Growth Option 17.5132
Bandhan Bank Ltd. Financial Services 1.85%
Minimum Investment Amount
State Bank Of India Financial Services 1.65%
Hindustan Unilever Ltd. Consumer Goods 1.45% Asset Allocation
Market Capitalization
(% of (%
total)
of total) Rs. 5,000/- per application and in multiples of Re. 1/-
NTPC Ltd. Power 1.20% thereafter
Dodla Dairy Ltd. Consumer Goods 1.20%
ITC Ltd. Consumer Goods 1.07% Additional investment amount
Indusind Bank Ltd. Financial Services 0.85% 9.60%
Rs. 500/- per application and in multiples of Re. 1/-
Sun Pharmaceutical Industries Ltd. Pharma 0.77% thereafter
Hindalco Industries Ltd. Metals 0.76% 9.63%
Tata Consultancy Services Ltd. IT 0.74% Exit Load
Axis Bank Ltd. Financial Services 0.70% Nil
Brookfield India Real Estate Trust Construction 0.68%
SBI Life Insurance Company Ltd. Financial Services 0.66% 80.77%
Total Expense Ratios~:
Amara Raja Batteries Ltd. Automobile 0.65% Regular Plan 2. 04%
Deepak Nitrite Ltd. Chemicals 0.61% Direct Plan 0. 62%
Cipla Ltd. Pharma 0.61%
Maruti Suzuki India Ltd. Automobile 0.58%
Canara Bank Financial Services 0.55%
Larsen & Toubro Ltd. Construction 0.53%
DLF Ltd. Construction 0.52%
Large cap Mid cap Small cap
Indian Bank Financial Services 0.51%
Other 46.89%
Quantitative indicators As on June 30, 2021
1.28 1.33
Yield to years Average Std. 0.97 16.44%
years
maturity (YTM)# Maturity# deviation Beta
#
Modified Macaulay Sharpe Active
4.18% Duration
#
1.49 Duration Ratio** 0.78 bets
years 6.47%
Total stocks
in portfolio Top 10 stocks Net Un Hedged Equity Portfolio Turnover Ratio^ Total Portfolio Turnover Ratio^
89 36.82% 35.67% Equity F&O Debt 5.76
0.94 4.66 0.17
This product is suitable for investors who are seeking*
# Yield to maturity (YTM), Modified Duration, Average Maturity and Macaulay Duration for Debt Portion.
• Income distribution by investing in debt and money
**Risk free rate of return (FIMMDA Overnight MIBOR) 3.36% market instrument and arbitrage opportunities.
• Long term capital appreciation by using equity and
Fund Performance as on June 30, 2021 equity related instruments.
*Investors should consult their financial advisers if in
Benchmark Additional Benchmark doubt about whether the product is suitable for them.
Scheme - Regular Plan #
(Nifty Equity Savings Index ) (CRISIL 10 year Gilt Index)
Period
Returns* Value of Rs. 10000 Returns* Value of Rs. 10000 Returns* Value of Rs. 10000
Invested Invested Invested Investors
E
AT
1 Year 19.53% 11,953 20.42% 12,042 4.08% 10,408 understand
ER
OD
that their
M
3 Year 9.63% 13,184 10.17% 13,378 9.61% 13,174
principal will
5 Year 9.40% 15,678 9.83% 15,985 7.25% 14,192
LOW
be
Since Inception - Regular Plan 8.70% 17,513 9.08% 17,935 8.13% 16,909 at Moderately
RISKOMETER
High Risk
Past performance may or may not be sustained in future and should not be used as a basis for comparison with other investments.
* CAGR Return.
Notes:
1. Different plans shall have different expense structure. The performance details provided herein are of Regular Plan of Edelweiss Equity Savings Fund. Returns are for Growth Option only. Since
Inception returns are calculated on Rs. 10/- invested at inception of the scheme. In case the start/end date is non business day, the NAV of previous day is used for computation.
2. The scheme is currently managed by Mr. Bharat Lahoti (managing this fund from September 18, 2017), Mr. Hardik Varma (Managing this fund from September 27, 2019) and Mr. Dhawal Dalal
(Managing this fund from November 28, 2016). Please refer page no. 45 for name of the other schemes currently managed by the Fund Managers and relevant scheme for performance.
3. Standard deviation and Sharpe ratio are annualized. 4. ^ Lower of sales or purchase divided by average AUM for last rolling 12 months.
5. Active bets are those where the fund have exposure away from the weightage as compared to benchmark. Source: Bloomberg.
6. Please note that Edelweiss Equity Savings Advantage Fund was merged with JP Morgan India Equity Income Fund and feature of JP Morgan India Equity Income Fund was retained with surviving
scheme name as Edelweiss Equity Savings Advantage Fund. Further, performance details as per SEBI Circular dated April 12, 2018 of JP Morgan schemes prior to acquisition data is not provided.
7. #Please note that benchmark of the Scheme is changed from 70% Crisil Liquid Fund Index + 30% Nifty 50 Index to Nifty Equity Savings Index.
12You can also read