The Global Financial Centres Index 29 - March 2021 - Financial Centre Futures - Long Finance
←
→
Page content transcription
If your browser does not render page correctly, please read the page content below
The Global
Financial Centres
Index 29
March 2021

  Financial Centre Futures
In March 2007, Z/Yen and the City Of London released the first edition of the GFCI, which
 continues to provide evaluations of competitiveness and rankings for the major financial
 centres around the world. We are pleased to present the twenty-ninth edition of the
 Global Financial Centres Index (GFCI 29).

 In July 2016, Z/Yen and the China Development Institute (CDI) in Shenzhen established a
 strategic partnership for research into financial centres. We continue our collaboration in
 producing the GFCI.

 The GFCI is updated every March and September and receives considerable attention
 from the global financial community. The index serves as a valuable reference for policy
 and investment decisions.

 Z/Yen is the City of London's leading commercial think-tank. Z/Yen was founded in 1994
 to promote societal advance through better finance and technology. Z/Yen has built its
 practice around a core of high-powered project managers, supported by experienced
 technical specialists so that clients get expertise they need, rather than just resources
 available.

 The CDI is a leading national think-tank that develops solutions to public policy challenges
 through broad-scope and in-depth research to help advance China’s reform and opening-
 up to world markets. The CDI has been working on the promotion and development of
 China’s financial system since its establishment in 1989. Based on rigorous research and
 objective analysis, CDI is committed to providing innovative and pragmatic reports for
 governments at different levels in China and corporations at home and abroad.

 The authors of this report, Mike
 Wardle and Professor Michael
 Mainelli, would like to thank Bikash
 Kharel, Carol Feng, Peng Yu, and
 the rest of the GFCI team for their
 contributions with research,
 modelling, and ideas.

Cover Photo by Vikram Sundaramoorthy on Unsplash

The Global Financial Centres Index 29

Foreword
Congratulations to Z/Yen on the successful launch of another edition of Global
Financial Centres Index (GFCI), especially in the light of all the challenges in the
current times.

I do not need to detail how challenging this past year has been to the world and to
the financial services community. Companies have needed to adopt new approaches
to operate; and practitioners have strived hard to deliver productivity in the remote
work setting. Fortunately, despite all the hurdles, global financial markets have
demonstrated resilience - and I am glad to share that Hong Kong’s has also remained
robust and dynamic.

The GFCI has been an important indicator for financial centres, including Hong Kong,
to gauge where they stand globally and how they can improve further. We are
encouraged by the fact that Hong Kong has consistently been ranked among the top
financial centres in the world since GFCI’s debut in 2007. In this latest GFCI 29, Hong
Kong is again recognised for its strong connectivity with mainland China and other
Asian markets, its business-friendly environment (with sound legal and regulatory
framework as well as ease of doing business), and its efficient financial infrastructure,
among other strengths. On areas where we are yet to be seen as among the top
centres, we are humbled and will continue to learn from our peers with the goal to
improve further.

In a global ranking, the relationship among markets is often seen as zero-sum. But
the synergy which can be achieved through collaboration is what we intend to
highlight further. While the pandemic has yet to permit full resumption of close
physical connectivity through ease of business travel, this does not stop us from
working together – in financial innovations, sustainability, and so many other
aspects. Indeed, exactly because of our strength in connectivity, Hong Kong stands
ready to join hands with other financial markets so that we can all scale to new
heights, locally, regionally, and globally.

Mr Laurence Li
Chairman,
Hong Kong Financial Services Development Council

                                           1
The Global Financial Centres Index 29

GFCI 29 Summary And Headlines
Overview
• We researched 126 centres for this edition of the Global Financial Centres Index
  (GFCI 29). The number of financial centres in the main index has increased from
  111 to 114 with the addition of Berlin, Trinidad & Tobago, and Bogota. There are 12
  associate centres awaiting potential inclusion in the main index.
• GFCI 29 shows a relatively high level of stability in the top half of the index, with
  few centres changing 10 or more places in the rankings. In the lower half of the
  index, there was more volatility, perhaps reflecting some uncertainty about the
  resilience of emerging and smaller centres.
• The average rating of centres in the index dropped only 3.5 points (-0.55%) from
  GFCI 28 (41 points from GFCI 27 to GFCI 28), which may indicate more confidence
  in the financial system than in the first stages of the covid-19 pandemic.
• The fact that overall ratings have not recovered to the levels that we saw in 2019
  reflects the continuing uncertainty around international trade, the impact of the
  covid-19 pandemic, and geopolitical and local unrest.
• Nine of the top 10 centres in the index fell in the ratings, with London and Tokyo
  falling over 10 points. With the top centres dropping, might this be due to central
  banks taking the reins during covid-19?

GFCI 29 Results

Leading Centres
• New York retains first place in the index. London fell to only one point ahead of
  third place Shanghai.
• Hong Kong moved up a place to fourth, one point behind Shanghai, with Singapore
  in fifth position. Tokyo dropped three places from fourth to seventh.
• Frankfurt replaced San Francisco in the top 10 in this edition, gaining seven rank
  places, perhaps benefiting from the exit of the UK from the European Union.
• Within the top 30 centres, Vancouver, Seoul, Sydney, Milan, and Stuttgart rose by
  more than five places.

Western Europe
• As in GFCI 28, centres in Western Europe had mixed fortunes in GFCI 29, with 12
  centres rising in the rankings and 16 falling. However, the average drop in ratings
  was just 0.63 points (-0.1%) in this region.
• Berlin entered the index for the first time, ranked 45th.

Asia/Pacific
• Asia/Pacific Centres also had a mixed performance in GFCI 29, with 14 centres
   falling in the rankings and 14 rising. The change in average ratings for the region
   was 2.9 points (0.46%).
• Globally, Asia/Pacific centres continue to perform well, with six centres in the top
   10 globally. Seoul and Sydney rejoined the top 20 in GFCI 29.

                                             2
The Global Financial Centres Index 29

North America
• North American centres showed the least change in the average rating across the
  regions, falling on average just 0.18 points (-0.03%).
• Vancouver, Washington DC, Chicago, and San Diego all improved five or more
  places in the rankings.

Eastern Europe & Central Asia
• Overall, this region saw average rating increase by 8.5 points (1.51%), with nine of
  the 16 centres in the region improving their ratings.
• Moscow, Vilnius, Bratislava, Budapest, and St Petersburg rose five places or more in
  the rankings.

Middle East & Africa
• Seven centres in the Middle East & Africa improved their ratings in GFCI 29 with
  Bahrain, Kuwait City, and Tehran improving five or more rank places.
• The average rating in the region rose 9.92 points (1.67%).

Latin America & The Caribbean
• Nine centres rose in the ratings in Latin America & The Caribbean after significant
   falls in GFCI 28. The average rating in the region rose 11.2 points (1.97%).
• British Virgin Islands, Barbados, and Santiago gained more than 10 places in the
   rankings.
• Trinidad & Tobago and Bogota entered the index, ranking 97th and 100th
   respectively.

FinTech
• We are able to rate 105 centres on their Fintech offering.
• New York continues to lead the FinTech ranking, followed by Shanghai, Beijing,
   Shenzhen, and London.
• Tel Aviv and Los Angeles enter the top 10.

GFCI 29
• GFCI 29 was compiled using 143 instrumental factors. These quantitative measures
  are provided by third parties including the World Bank, The Economist Intelligence
  Unit, the OECD, and the UN. Details can be found in Appendix 4.
• The instrumental factors were combined with 65,507 assessments of financial
  centres provided by 10,774 respondents to the GFCI online questionnaire. A
  breakdown of the respondents is shown in Appendix 2.
• Further details of the methodology behind GFCI 29 are in Appendix 3.

                                             3
The Global Financial Centres Index 29

Table 1 | GFCI 29 Top 57 Ranks And Ratings
                               GFCI 29                    GFCI 28         Change in   Change in
 Centre
                        Rank          Rating       Rank          Rating     Rank       Rating
 New York                 1            764          1             770         0         ▼6
 London                   2            743          2             766         0         ▼23
 Shanghai                 3            742          3             748         0         ▼6
 Hong Kong                4            741          5             743        ▲1         ▼2
 Singapore                5            740          6             742        ▲1         ▼2
 Beijing                  6            737          7             741        ▲1         ▼4
 Tokyo                    7            736          4             747        ▼3         ▼11
 Shenzhen                 8            731          9             732        ▲1         ▼1
 Frankfurt                9            727          16            715        ▲7         ▲12
 Zurich                  10            720          10            724         0         ▼4
 Vancouver               11            719          24            698       ▲13         ▲21
 San Francisco           12            718          8             738        ▼4         ▼20
 Los Angeles             13            716          11            720        ▼2         ▼4
 Washington DC           14            715          19            712        ▲5         ▲3
 Chicago                 15            714          20            711        ▲5         ▲3
 Seoul                   16            713          25            695        ▲9         ▲18
 Luxembourg              17            712          12            719        ▼5         ▼7
 Sydney                  18            711          32            682       ▲14         ▲29
 Dubai                   19            710          17            714        ▼2         ▼4
 Geneva                  20            709          14            717        ▼6         ▼8
 Edinburgh               21            708          13            718        ▼8         ▼10
 Guangzhou               22            706          21            710        ▼1         ▼4
 Melbourne               23            705          27            693        ▲4         ▲12
 Boston                  24            703          15            716        ▼9         ▼13
 Paris                   25            699          18            713        ▼7         ▼14
 Milan                   26            698          38            670       ▲12         ▲28
 Montreal                27            696          26            694        ▼1         ▲2
 Amsterdam               28            695          22            701        ▼6         ▼6
 Toronto                 29            694          31            684        ▲2         ▲10
 Stuttgart               30            689          37            672        ▲7         ▲17
 Stockholm               31            688          23            700        ▼8         ▼12
 Osaka                   32            684          39            665        ▲7         ▲19
 Madrid                  33            683          28            692        ▼5         ▼9
 Copenhagen              34            680          36            674        ▲2         ▲6
 Chengdu                 35            678          43            659        ▲8         ▲19
 Busan                   36            677          40            664        ▲4         ▲13
 Brussels                37            676          30            686        ▼7         ▼10
 Abu Dhabi               38            675          33            681        ▼5         ▼6
 Jersey                  39            673          55            637       ▲16         ▲36
 Taipei                  40            668          42            662        ▲2         ▲6
 Tel Aviv                41            666          45            656        ▲4         ▲10
 Qingdao                 42            665          47            654        ▲5         ▲11
 Hamburg                 43            664          29            690       ▼14         ▼26
 San Diego               44            663          60            605       ▲16         ▲58
 Berlin                  45            662         New            New       New         New
 Wellington              46            660          44            657        ▼2         ▲3
 Kuala Lumpur            47            652          41            663        ▼6         ▼11
 Dublin                  48            650          34            679       ▼14         ▼29
 Munich                  49            647          48            653        ▼1         ▼6
 Lisbon                  50            641          59            608        ▲9         ▲33
 Liechtenstein           51            638          68            591       ▲17         ▲47
 Rome                    52            636          53            643        ▲1         ▼7
 Casablanca              53            632          46            655        ▼7         ▼23
 Vienna                  54            629          54            640         0         ▼11
 Doha                    55            628          56            627        ▲1         ▲1
 Helsinki                56            620          65            594        ▲9         ▲26
 Moscow                  57            615          62            600        ▲5         ▲15

                                               4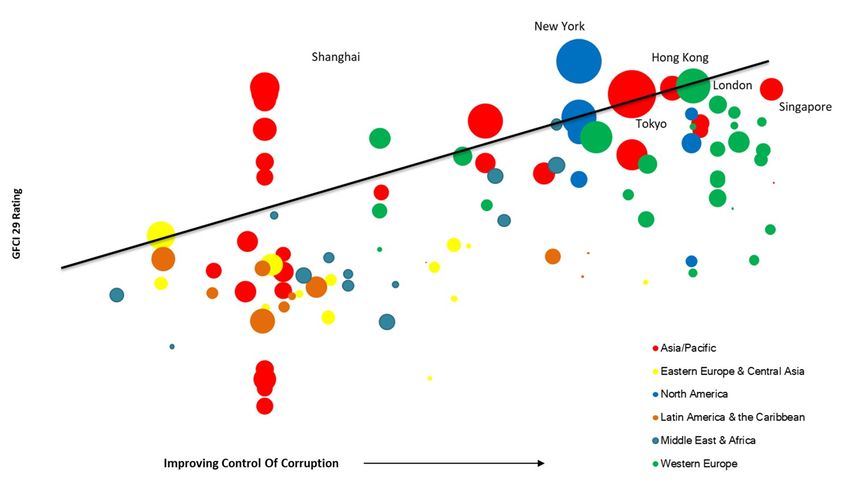
The Global Financial Centres Index 29

Table 1 (Continued) | GFCI 29 Remaining Ranks And Ratings
                                  GFCI 29                    GFCI 28         Change in   Change in
 Centre
                           Rank          Rating       Rank          Rating     Rank       Rating
 British Virgin Islands     58            614          72            587       ▲14         ▲27
 Bangkok                    59            610          58            617        ▼1         ▼7
 Monaco                     60            609          75            580       ▲15         ▲29
 Warsaw                     61            607          57            618        ▼4         ▼11
 Vilnius                    62            606          76            578       ▲14         ▲28
 Malta                      63            603          73            586       ▲10         ▲17
 Barbados                   64            600          86            559       ▲22         ▲41
 Mumbai                     65            599          35            678       ▼30         ▼79
 Bratislava                 66            598          87            552       ▲21         ▲46
 Santiago                   67            597          93            546       ▲26         ▲51
 Bahrain                    68            596          83            562       ▲15         ▲34
 Mexico City                69            595          70            589        ▲1         ▲6
 Oslo                       70            594          50            651       ▼20         ▼57
 Calgary                    71            593          51            649       ▼20         ▼56
 Cayman Islands             72            592          78            575        ▲6         ▲17
 Bahamas                    73            591          69            590        ▼4         ▲1
 Istanbul                   74            590          64            595       ▼10         ▼5
 Guernsey                   75            589          79            574        ▲4         ▲15
 Prague                     76            588          66            593       ▼10         ▼5
 Rio de Janeiro             77            587          85            560        ▲8         ▲27
 Nur-Sultan                 78            586          74            585        ▼4         ▲1
 Manila                     79            585         106            491       ▲27         ▲94
 New Delhi                  80            584          49            652       ▼31         ▼68
 Glasgow                    81            583          52            648       ▼29         ▼65
 Cape Town                  82            582          67            592       ▼15         ▼10
 Kuwait City                83            581         103            524       ▲20         ▲57
 Bermuda                    84            580          61            601       ▼23         ▼21
 Budapest                   85            577         101            531       ▲16         ▲46
 Isle of Man                86            576          77            577        ▼9         ▼1
 Tallinn                    87            575          88            551        ▲1         ▲24
 St Petersburg              88            574         104            523       ▲16         ▲51
 Mauritius                  89            573          63            598       ▼26         ▼25
 Johannesburg               90            572          90            549         0         ▲23
 Buenos Aires               91            571          94            543        ▲3         ▲28
 GIFT City-Gujarat          92            568          82            563       ▼10         ▲5
 Jakarta                    93            567          81            568       ▼12         ▼1
 Panama                     94            566          91            548        ▼3         ▲18
 Sofia                      95            565          95            540         0         ▲25
 Tehran                     96            564         102            528        ▲6         ▲36
 Trinidad & Tobago          97            563         New            New       New         New
 Cyprus                     98            561          71            588       ▼27         ▼27
 Gibraltar                  99            559          84            561       ▼15         ▼2
 Bogota                    100            554         New            New       New         New
 Almaty                    101            553          99            536        ▼2         ▲17
 Reykjavik                 102            549         100            535        ▼2         ▲14
 Athens                    103            545          92            547       ▼11         ▼2
 Sao Paulo                 104            542          80            569       ▼24         ▼27
 Riyadh                    105            541         107            486        ▲2         ▲55
 Nairobi                   106            520          96            539       ▼10         ▼19
 Baku                      107            515          98            537        ▼9         ▼22
 Hangzhou                  108            501         109            463        ▲1         ▲38
 Riga                      109            493          97            538       ▼12         ▼45
 Tianjin                   110            492         108            477        ▼2         ▲15
 Dalian                    111            491         110            455        ▼1         ▲36
 Xi'an                     112            485         105            506        ▼7         ▼21
 Nanjing                   113            484          89            550       ▼24         ▼66
 Wuhan                     114            469         111            420        ▼3         ▲49

                                                  5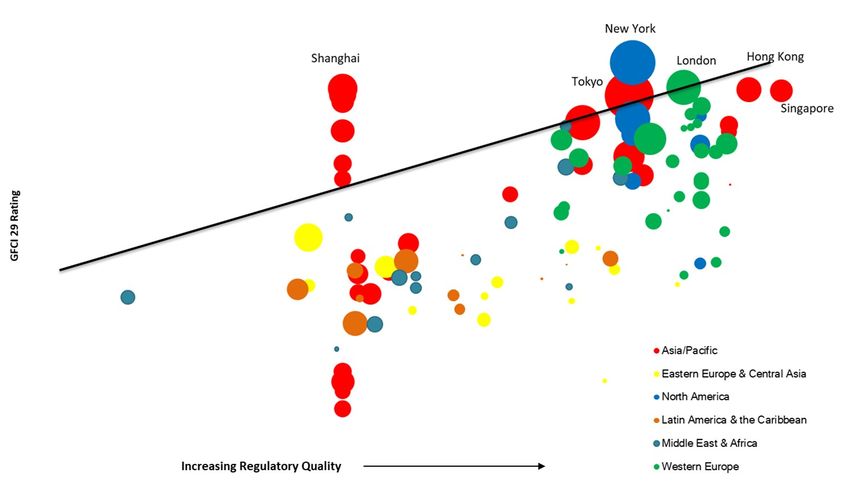
The Global Financial Centres Index 29

We track centres that have yet to achieve the number of assessments required to be
listed in the main GFCI index. Table 2 lists the 12 centres which fall into this ‘associate
centres’ category.

Table 2 | GFCI 29 Associate Centres

                                        Number Of Assessments                 Mean Of
Centre
                                         In The Last 24 Months              Assessments
Lagos                                             132                           517
Lugano                                            126                           660
Ho Chi Minh City                                  124                           561
Andorra                                            84                           607
Chisinau                                           77                           621
Karachi                                            72                           565
Turks and Caicos                                   70                           583
Kaunas                                             54                           561
Atlanta                                            43                           588
Kigali                                             30                           553
Minneapolis / St Paul                              23                           609
Gothenburg                                          9                           655

Regional Performance
The mean of the top five Asia/Pacific centres remains higher than other regions, with
North America fractionally ahead of Western Europe on this measure. While the
average ratings for the leading regions fell slightly in GFCI 29, the average for the leading
Latin American & Caribbean and Eastern European & central Asian centres improved
from GFCI 28.

Chart 1 | Average Ratings Of The Top Five Centres In Each Region

                                                6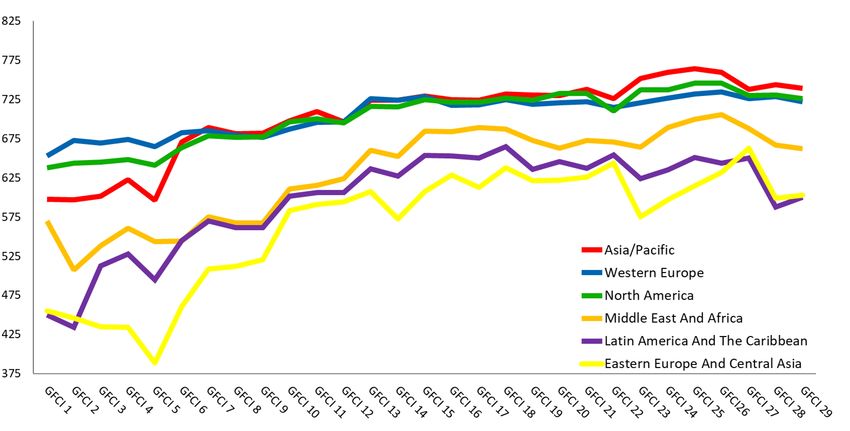
The Global Financial Centres Index 29

The Top Five Centres
New York retained its first place in the index, and London hung on to second place, but
fell back in the ratings after improvements in GFCI 28. Shanghai, Hong Kong and
Singapore rank third, fourth and fifth, with only one point separating Shanghai from
London, Hong Kong from Shanghai and Singapore from Hong Kong.

Chart 2 | The Top Five Centres— GFCI Ratings Over Time

  “The ease of communication
   with the local regulator is a
         big advantage in
    Liechtenstein. The time to
   market to launch products/
   start business is extremely
       fast. Starting Fintech
        businesses is openly
         promoted by the
   government and supported
         by the regulator.”
  SUPERVISION OFFICER, REGULATOR, LIECHTENSTEIN

                                                  7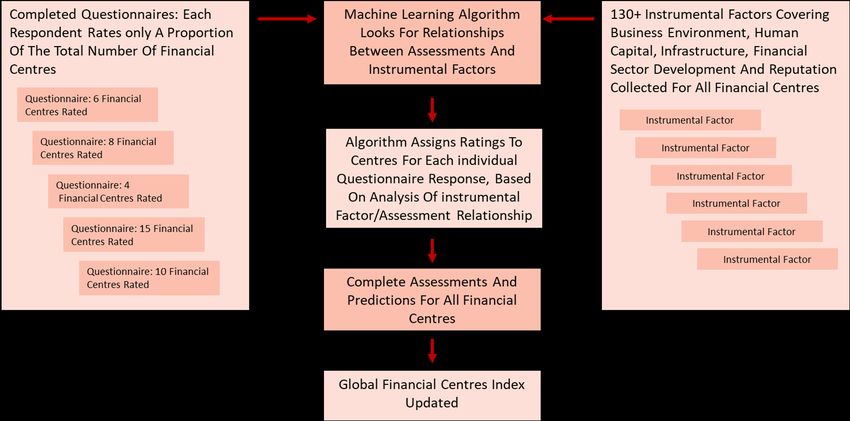
The Global Financial Centres Index 29

Future Prospects

The GFCI questionnaire asks respondents which centres they consider will become
more significant over the next two to three years. Table 3 shows the top 15 centres
mentioned. Nine of the 15 centres are in the Asia/Pacific region.

Table 3 | The 15 Centres Likely To Become More Significant

 Centre                                               Mentions in last 24 months

 GIFT City - Gujarat                                               371
 Seoul                                                             217
 Stuttgart                                                         217
 Shanghai                                                          199
 Qingdao                                                           186
 Singapore                                                         164
 Beijing                                                           123
 Shenzhen                                                          92
 Guangzhou                                                         87
 Hong Kong                                                         87
 New York                                                          68
 Paris                                                             63
 London                                                            58
 Dubai                                                             46
 Frankfurt                                                         46

  “Location is now less important, because working
processes have become more and more digital. I can
recruit professionals everywhere without needing to
                     move them.”
REGIONAL DIRECTOR, INSURANCE FIRM, HAMBURG

                                              8
The Global Financial Centres Index 29
Areas Of Competitiveness
The instrumental factors used in the GFCI model are grouped into five broad areas of
competitiveness: Business Environment, Human Capital, Infrastructure, Financial Sector
Development, and Reputation. These areas and the instrumental factor groups which
comprise each area are shown in Chart 3.
Chart 3 | GFCI Areas Of Competitiveness
“Regulation plays a big part in changing the landscape
of any sector. The rule of law will force people to
change habits sooner than being forced to change by
environment or circumstances. Corruption is big risk
when all work is done on line, this needs to be
mitigated with stronger controls and security.”
HEAD - GLOBAL MARKETS & TREASURY, BANKING, SINGAPORE
9The Global Financial Centres Index 29
To assess how financial centres perform in each of these areas, the GFCI factor assessment
model is run separately for each of the five areas of competitiveness. The top 15 ranked
centres in each of these sub-indices are shown in Table 4. New York takes the lead position
in four out of the five areas, with London top for financial sector development. Singapore,
Hong Kong, Beijing, Shanghai, Shenzhen, and Zurich feature in the top five centres in one or
more areas.
Table 4 | GFCI 29 Top 15 Centres By Area Of Competitiveness
Financial Sector Reputational &
Rank Business Environment Human Capital Infrastructure
Development General
1 New York New York New York London New York
2 Singapore London London New York Singapore
3 London Singapore Shanghai Singapore London
4 Hong Kong Hong Kong Hong Kong Shenzhen Hong Kong
5 Beijing Shanghai Singapore Hong Kong Zurich
6 Shanghai Tokyo Tokyo Shanghai Shanghai
7 San Francisco Beijing Beijing Zurich Beijing
8 Tokyo Paris Amsterdam Frankfurt Tokyo
9 Chicago Brussels Zurich Seoul Geneva
10 Frankfurt Luxembourg Boston Los Angeles Edinburgh
11 Edinburgh Los Angeles Frankfurt Luxembourg Glasgow
12 Luxembourg San Francisco Edinburgh San Francisco Dublin
13 Amsterdam Chicago Geneva Beijing Seoul
14 Zurich Shenzhen Guangzhou Geneva Hamburg
15 Washington DC Frankfurt Seoul Edinburgh Paris
“The regulatory environment is probably the most
important factor in selecting a financial centre. It
needs to have approachable regulators who work
with the banking and financial sectors to provide
guidance and to act as mentors to FinTechs.
A regulator who will listen and discuss is of more
help than a regulator which administers with a rod
of iron.”
DIRECTOR, FINTECH FIRM, DUBLIN
10The Global Financial Centres Index 29
Industry Sectors
We investigate the differing assessments for relevant industry sectors by building the
index separately using only the responses provided by people working in those
industries. This creates separate sub-indices for Banking, Investment Management,
Insurance, Professional Services, Government & Regulatory, Finance, FinTech, and
Trading sectors. Table 5 shows the top 15 financial centres in these eight industry
sectors.
New York has consolidated its leading position, ranking first in every category except
insurance, where Shanghai leads the way. Zurich and Geneva show particular
strength in the Government & Regulatory sub-index.
Table 5 | GFCI 29 Industry Sector Sub-Indices — Top Fifteen
Investment Professional Government
Rank Banking Insurance Finance FinTech Trading
Management Services & Regulatory
1 New York New York Shanghai New York New York New York New York New York
2 Shanghai London Singapore London London Shanghai Singapore London
3 Hong Kong Hong Kong Beijing Singapore Zurich Beijing Shanghai Singapore
4 London Singapore New York Hong Kong Singapore London Hong Kong Hong Kong
5 Beijing Shanghai Hong Kong Shenzhen Geneva Luxembourg London Shanghai
6 Shenzhen Beijing London Shanghai Hong Kong Hong Kong Seoul Beijing
7 Tokyo Shenzhen Luxembourg Vancouver Shanghai Shenzhen Beijing Shenzhen
8 Singapore Frankfurt Shenzhen Tokyo Shenzhen Tokyo Tokyo Zurich
9 Zurich Luxembourg Stockholm Beijing Tokyo Edinburgh Shenzhen Frankfurt
GIFT City- San
10 Melbourne Sydney Frankfurt Luxembourg Seoul Luxembourg
Gujarat Francisco
San
11 Paris Zurich Zurich Luxembourg Singapore Amsterdam Tokyo
Francisco
Washington
12 San Francisco Seoul Seoul Tehran Frankfurt Los Angeles Geneva
DC
13 Sydney Boston Tokyo Zurich Dubai Milan Boston Chicago
14 Guangzhou Tokyo Paris Frankfurt Beijing Paris Chicago Los Angeles
San
15 Vienna Dubai Boston Geneva Wellington Brussels Luxembourg
Francisco
“Distribution channels in the insurance industry and
the way they are organized and regulated are
important. Essential is the ability to use
international reinsurance markets.”
DIRECTOR - RISK COMPLIANCE, INSURANCE, PARIS
11The Global Financial Centres Index 29
Profile Of Strengths
We can use the sub-indices by areas of competitiveness and industry sector to show the
relative strengths of a financial centre over time, as shown in charts 4 to 7 below for
Frankfurt and Sydney, two centres that have improved their position in GFCI 29. We
also show a comparison with GFCI 23 - which provides a reasonable comparison over
three years.
Taking Frankfurt’s results, the diagrams show that in the areas of competitiveness sub-
indices, Frankfurt scores well in financial sector development but scores less well in
human capital and reputation. Over time, it has improved its rank in all areas other
than reputation. By industry sector, Frankfurt is well-regarded by those working in
investment management and insurance and has improved its position in both sectors,
but is less well thought of by those from a banking or government & regulatory
background.
Chart 4 | Areas Of Competitiveness Rank - Frankfurt
Chart 5 | Industry Sectors Rank - Frankfurt
12The Global Financial Centres Index 29
Turning to Sydney, the range of rankings for areas of competitiveness is much wider,
with financial sector development being an area of comparative weakness compared
with the other areas. Over time, Sydney has improved in human capital but worsened
in other areas. Looking at industry sectors, Sydney scores highly when considered by
those working in investment management and banking, but is scored lower by those
working in insurance, professional services, and government & regulatory functions,
each areas where its rank has fallen since GFCI 23.
Chart 6 | Areas Of Competitiveness Rank - Sydney
Chart 7 | Industry Sectors Rank - Sydney
13The Global Financial Centres Index 29
Size Of Organisation
We have analysed how the leading centres in the index are viewed by respondents working
for organisations of different sizes. New York leads across respondents from all sizes of
organisation other than those with 50 to 100 staff, where Singapore leads. Singapore is
second in all other categories, other than in organisations with 1,000 to 2,000 staff, where
London takes second place.
Chart 8 | GFCI 29 Average Assessments By Respondents’ Organisation Size
(Number Of Employees)
“Business environment has proved to be the most
important factor deciding the attractiveness of a
financial centre. Regulation and law should be
strong and predictable but adaptable to changing
circumstances. Regulators must be educated on new
technologies.”
STRATEGY AND COMPLIANCE OFFICER, ECONOMIC PROMOTION AGENCY, KIGALI
14The Global Financial Centres Index 29
Factors Affecting Competitiveness
The GFCI questionnaire asks respondents to indicate which factors of competitiveness
they consider the most important at this time. The number of times that each area was
mentioned and the key issues raised by respondents are shown in Table 6.
Table 6 | GFCI 29 Main Areas Of Competitiveness
Area Of Number Of
Main Issues
Competitiveness Mentions
The regulatory environment is still seen as the central pillar
needed for a successful financial centre.
Strong support for regulation which reduces corruption without
Business
509 stifling innovation and development; and with greater
Environment transparency.
FinTech regulation is a hot topic, with a need to find a balanced
approach to regulation of emerging business.
Remote working has made cross-border work easier, reducing
the need to have employees that live and work in the same city.
The labour market needs to be flexible, allowing free movement
Human Capital 305
and ease of employment for talented staff.
The need for IT skills has continued to grow as FinTech and AI
become mainstream.
The importance of digital infrastructure has been highlighted by
the covid-19 pandemic and the need for virtual working.
Infrastructure 365
It is essential to build working environments which cater to the
social as well as business needs of people
Tax is seen as one of the areas in which financial centres can
compete.
Taxation 454 In general, reasonable levels of taxation are seen as better for
businesses. Tax incentives are a key way to attract investment
business and top talent.
Reputation gives confidence to investors and is a leading factor
when selecting a financial centre.
Reputation 406 A city’s reputation is useful for attracting human capital to the
centre, particularly when coupled with good branding and
marketing.
Physical access to customers is becoming less of an issue due to
the accelerated acceptance of remote working and increased
Financial Sector
343 digital connectivity between centres.
Development Business has changed permanently following Covid-19, with a
move to online meetings.
“City reputation plays a vital role in investment
decisions. People tend to choose popular places
without major social and political risks.”
LEGAL PROFESSIONAL, DEVELOPMENT INVESTMENT, WASHINGTON DC
15The Global Financial Centres Index 29
Political Stability And Regulatory Quality
Reputational and Business Environment measures have a significant correlation with
financial centre competitiveness. Chart 9 plots GFCI ratings against the World Bank’s
Control Of Corruption indicator and Chart 10 plots GFCI ratings against the World
Bank’s measure of Regulatory Quality. These charts demonstrate the correlation of
these factors with the GFCI 29 ratings (the size of the bubble indicates the relative
GDP of each centre).
Chart 9 | GFCI 29 Rating Against Control Of Corruption (Supplied By The World Bank)
Chart 10 | GFCI 29 Rating Against Regulatory Quality (Supplied By The World Bank)
16The Global Financial Centres Index 29
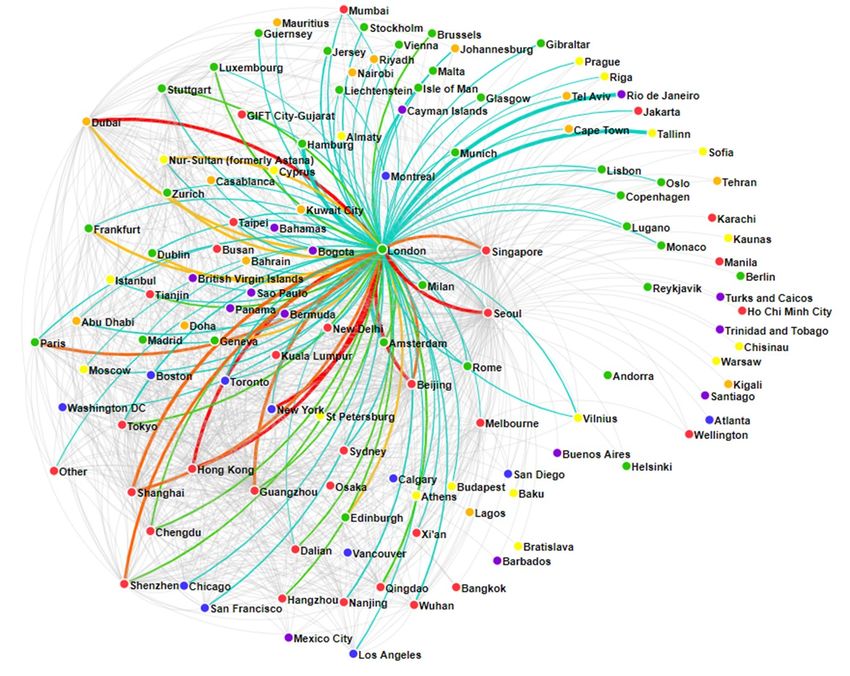
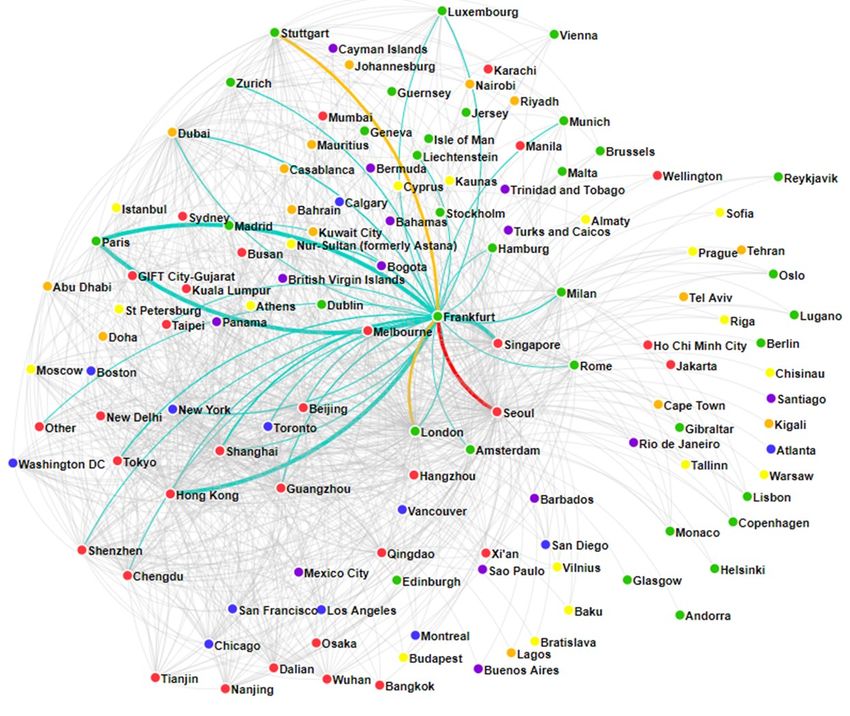
Connectivity
Financial centres thrive when they develop deep connections with other centres. The
GFCI allows us to measure connectivity by investigating the number of assessments
given to and received from other financial centres. Charts 11 and 12 show the different
levels of connectivity enjoyed by London and Frankfurt to demonstrate the contrast,
with London having connections with a wider spread of centres than Frankfurt. Both are
well connected with other European centres; but London is much better connected to
the other leading centres in the GFCI.
Chart 11 | GFCI 29 Connectivity - London
Chart 12 | GFCI 29 Connectivity - Frankfurt
17The Global Financial Centres Index 29
Financial Centre Profiles
Chart 13 | GFCI 29 Profile Elements
Using clustering and correlation analysis we
have identified three measures (axes) that
determine a financial centre’s profile along
different dimensions of competitiveness.
‘Connectivity’ – the extent to which a centre
is well connected around the world, based on
the number of assessments given by and re-
ceived by that centre from professionals
based in other centres.
A centre’s connectivity is assessed using a combination of ‘inbound’ assessment loca-
tions (the number of locations from which a particular centre receives assessments) and
‘outbound’ assessment locations (the number of other centres assessed by respondents
from a particular centre). If the weighted assessments for a centre are provided by over
63% of other centres, this centre is deemed to be ‘Global’. If the ratings are provided
by over 45% of other centres, this centre is deemed to be ‘International’.
‘Diversity’– the instrumental factors used in the GFCI model give an indication of a
range of factors that influence the richness and evenness of areas of competitiveness
that characterise any particular financial centre. We consider this span of factors to be
measurable in a similar way to that of the natural environment. We therefore use a
combination of biodiversity indices (calculated on the instrumental factors) to assess a
centre’s diversity taking account of the range of factors against which the centre has
been assessed – the ‘richness’ of the centre’s business environment; and the ‘evenness’
of the distribution of that centre’s scores. A high score means that a centre is well di-
versified; a low diversity score reflects a less rich business environment.
‘Speciality’ – the depth within a financial centre of the following industry sectors: in-
vestment management, banking, insurance, professional services, and the government
and regulatory sector. A centre’s ‘speciality’ performance is calculated from the differ-
ence between the GFCI rating and the industry sector ratings.
In Table 7, ‘Diversity’ (Breadth) and ‘Speciality’ (Depth) are combined on one axis to cre-
ate a two dimensional table of financial centre profiles. The 114 centres in GFCI 29 are
assigned a profile on the basis of a set of rules for the three measures: how well con-
nected a centre is, how broad its services are, and how specialised it is.
The 17 Global Leaders (in the top left of the table) have both broad and deep financial
services activities and are connected with many other financial centres. This list includes
eight of the top 10 global financial centres in GFCI 29.
Significant changes in GFCI 29 include Beijing and Shenzhen exiting the Global Leaders
in this edition, with Amsterdam, Brussels, Chicago, Frankfurt, Los Angeles, Paris, Wash-
ington DC, and Zurich moving into this category.
18The Global Financial Centres Index 29
Table 7 | GFCI 29 Financial Centre Profiles
Broad & Deep Relatively Broad Relatively Deep Emerging
Global Leaders Global Diversified Global Specialists Global Contenders
London Dublin Shenzhen* GIFT City-Gujarat
New York Seoul Guangzhou Hangzhou
Singapore Beijing* Abu Dhabi*
Paris* Chengdu Dalian
Los Angeles* Moscow*
Frankfurt* Qingdao
Hong Kong
Zurich*
Global Shanghai
Amsterdam*
San Francisco
Geneva
Chicago*
Dubai
Brussels*
Tokyo
Washington DC*
Established International International International
International Diversified Specialists Contenders
Boston Istanbul Luxembourg Tianjin
Munich* Oslo* Nanjing Mauritius*
Rome Vienna Taipei Mumbai*
Busan Mexico City Cyprus New Delhi*
Toronto* Bangkok* Bogota (New) Riga*
International Kuala Lumpur* Nur-Sultan* Doha
Madrid* Panama Wuhan
Milan British Virgin Islands Casablanca*
Stuttgart Almaty Bermuda*
Sydney* Vilnius Guernsey*
Athens Liechtenstein*
Melbourne*
Budapest
Established
Local Diversified Local Specialists Evolving Centres
Players
Montreal* Glasgow* Riyadh* Sao Paulo
Edinburgh* Calgary* Buenos Aires* Johannesburg*
Lisbon Warsaw* Manila* Jakarta
Stockholm Prague* Xi'an Cape Town
Copenhagen* Helsinki* Tallinn Bahamas*
Osaka Tel Aviv* Sofia Malta*
Hamburg* Wellington* Bahrain Isle of Man*
Local San Diego St Petersburg Rio de Janeiro
Vancouver Bratislava Baku*
Berlin (New) Tehran Cayman Islands*
Santiago Barbados Reykjavik*
Kuwait City Nairobi*
Jersey Trinidad & Tobago (New)
Gibraltar
Monaco
An asterisk denotes cities that have moved between categories between GFCI 28 and GFCI 29
19The Global Financial Centres Index 29
The GFCI 29 World
102
71 See Detailed
11
27 Map Below
29
12 24
15
1
13
14
44 84 53
73
69
72 58
64
94
97
100
77
104
67 82
91
The numbers on the map indicate the GFCI 29 rankings.
Broad and Deep Relatively Broad Relatively Deep Emerging
Global Leaders Global Diversified Global Specialists Global Contenders
Established International International Diversified International Specialists International Contenders
Established Players Local Diversified Local Specialists Evolving Centres
Associate Centre
20The Global Financial Centres Index 29
88
57
78
101 16
74 6 110
107 7
112 42 36
98 96 111
41 35 114 32
3
83 113
22 108
68
55 19 80 8 40
92
105 38 4
65 59
79
47
5
106
93
89
90
18
23
46
56
70
87
31
109
34
81 21 62
86 28 43 45
48 2 49 61
37
9
39 76
75 17
30 66
25
10 54 101
51
20
26
60 95
53
33
50 92
99
63
21The Global Financial Centres Index 29
Regional Analysis
In our analysis of the GFCI data, we look at six regions of the world to explore the
competitiveness of their financial centres. Alongside the ranks and ratings of centres,
we look at trends in the leading centres in each region and investigate the average
assessments received by regions and centres in more detail.
We display this analysis in charts which show:
• the mean assessment provided to that region or centre;
• the difference in the mean assessment when home region assessments are
removed from the analysis;
• the difference between the mean and the assessments provided by other regions;
• the proportion of assessments provided by each region.
Charts 14 and 15 show examples of these analyses. Coloured bars to the left of the
vertical axis indicate that respondents from that region gave lower than the average
assessments. Bars to the right indicate respondents from that region gave higher than
average assessments. It is important to recognise that assessments given to a centre by
people based in that centre are excluded to remove ‘home’ bias.
The additional vertical axis (in red) shows the mean of assessments when assessments
from the home region are removed. The percentage figure noted by each region
indicates the percentage of the total number of assessments that are from that region.
“People always travel to a better place for living, not
because people want to live in a financial centre.
With the development of many inland cities in China,
a number of people have returned to their home
town/area to find jobs and opportunities. Skilled
people and flexibility of labour markets are the basic
conditions to ensure a competitive financial centre,
but how to retain people within the local market is
quite challenging.”
SENIOR COMPLIANCE OFFICER, INSURANCE FIRM, SHANGHAI
22The Global Financial Centres Index 29
Chart 14 | Example 1: Assessments Compared With The Mean For Region 6
This line shows that the assessments
given by other regions and excluding
those from region 6 had an average 10
points lower than the overall mean.
Respondents from region 6 rated their
home centres higher than
respondents from other regions.
This percentage shows
This bar shows that that 32 per cent of
assessments from assessments for region
centres in this region 6 came from centres in
Region 1 (32%)
averaged 41 points region 1.
below the mean for Region 2 (24%)
region 6.
Region 3 (7%)
Region 4 (5%)
Region 5 (9%) This bar shows that
assessments from centres in
Region 6 (15%) this region averaged 72
points above the mean for
Multi-Regional (8%) region 6.
-125 -75 -25 623 25 75 125
This figure is the mean of all
assessments in the GFCI for
region 6.
Chart 15 | Example 2: Assessments Compared With The Mean For An Individual Centre
23The Global Financial Centres Index 29
Western Europe
London held onto second place in the index, but its rating dropped 23 points following
an increase of 24 points in GFCI 28. Frankfurt moved up 7 ranking places to take
second place in the region. Most centres in the region fell in the ratings, although
Milan and Jersey rose more than 10 places in the rankings and Copenhagen also
improved. Berlin entered the index for the first time, ranking 45th.
Table 8 | Western European Top 15 Centres In GFCI 29
GFCI 29 GFCI 28 Change in Change in
Centre
Rank Rating Rank Rating Rank Rating
London 2 743 2 766 0 ▼23
Frankfurt 9 727 16 715 ▲7 ▲12
Zurich 10 720 10 724 0 ▼4
Luxembourg 17 712 12 719 ▼5 ▼7
Geneva 20 709 14 717 ▼6 ▼8
Edinburgh 21 708 13 718 ▼8 ▼10
Paris 25 699 18 713 ▼7 ▼14
Milan 26 698 38 670 ▲12 ▲28
Amsterdam 28 695 22 701 ▼6 ▼6
Stuttgart 30 689 37 672 ▲7 ▲17
Stockholm 31 688 23 700 ▼8 ▼12
Madrid 33 683 28 692 ▼5 ▼9
Copenhagen 34 680 36 674 ▲2 ▲6
Brussels 37 676 30 686 ▼7 ▼10
Jersey 39 673 55 637 ▲16 ▲36
Chart 16 | Top Five Western European Centres Over Time
24The Global Financial Centres Index 29
Chart 17 | Average Assessments By Region For Western Europe – Difference From The
Overall Mean
Chart 18 | Assessments By Region For London - Difference From The Overall Mean
Chart 19 | Assessments By Region For Frankfurt - Difference From The Overall Mean
Chart 20 | Assessments By Region For Zurich - Difference From The Overall Mean
25The Global Financial Centres Index 29
Asia/Pacific
Asia/Pacific centres overall performed well in GFCI 29. Hong Kong, Singapore, and Beijing
improved their rank position slightly while Tokyo fell to seventh place. Seoul, Sydney, and
Manila improved their ranking more than five places. The top six centres in the region are
firmly embedded in the top 10 centres in the overall index.
Table 9 | Asia/Pacific Top 15 Centres In GFCI 29
GFCI 29 GFCI 28 Change in Change in
Centre
Rank Rating Rank Rating Rank Rating
Shanghai 3 742 3 748 0 ▼6
Hong Kong 4 741 5 743 ▲1 ▼2
Singapore 5 740 6 742 ▲1 ▼2
Beijing 6 737 7 741 ▲1 ▼4
Tokyo 7 736 4 747 ▼3 ▼11
Shenzhen 8 731 9 732 ▲1 ▼1
Seoul 16 713 25 695 ▲9 ▲18
Sydney 18 711 32 682 ▲14 ▲29
Guangzhou 22 706 21 710 ▼1 ▼4
Melbourne 23 705 27 693 ▲4 ▲12
Osaka 32 684 39 665 ▲7 ▲19
Chengdu 35 678 43 659 ▲8 ▲19
Busan 36 677 40 664 ▲4 ▲13
Taipei 40 668 42 662 ▲2 ▲6
Qingdao 42 665 47 654 ▲5 ▲11
Chart 21 | Top Five Asia/Pacific Centres Over Time
26The Global Financial Centres Index 29
Chart 22 | Average Assessments By Region For Asia/Pacific – Difference From The Overall
Mean
Chart 23 | Assessments By Region For Shanghai - Difference From The Overall Mean
Chart 24 | Assessments By Region For Hong Kong - Difference From The Overall Mean
Chart 25 | Assessments By Region For Singapore - Difference From The Overall Mean
27The Global Financial Centres Index 29
North America
New York retained its leading place in the index, increasing one point in the ratings.
Vancouver, Washington DC, Chicago, Toronto, and San Diego improved their rankings.
The ratings are very close between the leading centres in North America outside New
York. Only five points separate Vancouver in second place in the region from Chicago at
sixth place.
Table 10 | North American Centres In GFCI 29
GFCI 29 GFCI 28 Change In Change In
Centre
Rank Rating Rank Rating Rank Rating
New York 1 764 1 770 0 ▼6
Vancouver 11 719 24 698 ▲13 ▲21
San Francisco 12 718 8 738 ▼4 ▼20
Los Angeles 13 716 11 720 ▼2 ▼4
Washington DC 14 715 19 712 ▲5 ▲3
Chicago 15 714 20 711 ▲5 ▲3
Boston 24 703 15 716 ▼9 ▼13
Montreal 27 696 26 694 ▼1 ▲2
Toronto 29 694 31 684 ▲2 ▲10
San Diego 44 663 60 605 ▲16 ▲58
Calgary 71 593 51 649 ▼20 ▼56
Chart 26 | Top Five North American Centres Over Time
28The Global Financial Centres Index 29
Chart 27 | Average Assessments By Region For North America – Difference From The
Overall Mean
Chart 28 | Assessments By Region For New York - Difference From The Overall Mean
Chart 29 | Assessments By Region for Vancouver - Difference From The Overall Mean
Chart 30 | Assessments By Region For San Francisco - Difference From The Overall Mean
29The Global Financial Centres Index 29
Eastern Europe & Central Asia
This region has seen mixed results in GFCI 29. Moscow takes the lead in the region,
with Vilnius, Bratislava, Budapest, and St Petersburg rising more than 10 places in the
rankings. Istanbul, Prague, Cyprus, Athens, and Riga fell 10 places or more, while
Warsaw, Nur-Sultan, and Almaty rose in the ratings while falling slightly in the
rankings.
Table 11 | Eastern European & Central Asian Centres In GFCI 29
GFCI 29 GFCI 28 Change In Change In
Centre
Rank Rating Rank Rating Rank Rating
Moscow 57 615 62 600 ▲5 ▲15
Warsaw 61 607 57 618 ▼4 ▼11
Vilnius 62 606 76 578 ▲14 ▲28
Bratislava 66 598 87 552 ▲21 ▲46
Istanbul 74 590 64 595 ▼10 ▼5
Prague 76 588 66 593 ▼10 ▼5
Nur-Sultan 78 586 74 585 ▼4 ▲1
Budapest 85 577 101 531 ▲16 ▲46
Tallinn 87 575 88 551 ▲1 ▲24
St Petersburg 88 574 104 523 ▲16 ▲51
Sofia 95 565 95 540 0 ▲25
Cyprus 98 561 71 588 ▼27 ▼27
Almaty 101 553 99 536 ▼2 ▲17
Athens 103 545 92 547 ▼11 ▼2
Baku 107 515 98 537 ▼9 ▼22
Riga 109 493 97 538 ▼12 ▼45
Chart 31 | Top Five Eastern European & Central Asian Centres Over Time
30The Global Financial Centres Index 29
Chart 32 | Average Assessments By Region For Eastern Europe & Central Asia -
Difference From The Overall Mean
-238
Chart 33 | Assessments By Region For Moscow - Difference From The Overall Mean
Chart 34 | Assessments By Region For Warsaw - Difference From The Overall Mean
Chart 35 | Assessments By Region For Vilnius - Difference From The Overall Mean
31The Global Financial Centres Index 29
The Middle East & Africa
There was a balance of results in this region, with around half of centres rising and half
falling in the rankings. Dubai continues to lead the table in the region and Casablanca
continues to take first place in Africa. Bahrain has recovered after falling in the rankings
in GFCI 28, while Abu Dhabi lost much of the improvement it gained in GFCI 28. Other
centres fell back and in particular, Cape Town and Mauritius fell back sharply in the
ratings and rankings.
Table 12 | Middle Eastern & African Centres In GFCI 29
GFCI 29 GFCI 28 Change in Change in
Centre
Rank Rating Rank Rating Rank Rating
Dubai 19 710 17 714 ▼2 ▼4
Abu Dhabi 38 675 33 681 ▼5 ▼6
Tel Aviv 41 666 45 656 ▲4 ▲10
Casablanca 53 632 46 655 ▼7 ▼23
Doha 55 628 56 627 ▲1 ▲1
Bahrain 68 596 83 562 ▲15 ▲34
Cape Town 82 582 67 592 ▼15 ▼10
Kuwait City 83 581 103 524 ▲20 ▲57
Mauritius 89 573 63 598 ▼26 ▼25
Johannesburg 90 572 90 549 0 ▲23
Tehran 96 564 102 528 ▲6 ▲36
Riyadh 105 541 107 486 ▲2 ▲55
Nairobi 106 520 96 539 ▼10 ▼19
Chart 36 | Top Five Middle East & African Centres Over Time
32The Global Financial Centres Index 29
Chart 37 | Average Assessments By Region For The Middle East & Africa — Difference From
The Overall Mean
Chart 38 | Assessments By Region For Dubai - Difference From The Overall Mean
Chart 39 | Assessments By Region For Abu Dhabi - Difference From The Overall Mean
Chart 40 | Assessments By Region For Tel Aviv - Difference From The Overall Mean
33The Global Financial Centres Index 29
Latin America & The Caribbean
Centres in Latin America & The Caribbean again made improvements in GFCI 29 with
seven centres improving their ranking since GFCI 28, and all but two centres rising in the
ratings. Barbados continued the improvement it saw in GFCI 28, and the British Virgin
Islands, and Santiago also saw big improvements. Trinidad & Tobago and Bogota are
new entrants to the index.
Table 13 | Latin American & Caribbean Centres In GFCI 29
GFCI 29 GFCI 28 Change in Change in
Centre
Rank Rating Rank Rating Rank Rating
British Virgin
58 614 72 587 ▲14 ▲27
Islands
Barbados 64 600 86 559 ▲22 ▲41
Santiago 67 597 93 546 ▲26 ▲51
Mexico City 69 595 70 589 ▲1 ▲6
Cayman Islands 72 592 78 575 ▲6 ▲17
Bahamas 73 591 69 590 ▼4 ▲1
Rio de Janeiro 77 587 85 560 ▲8 ▲27
Bermuda 84 580 61 601 ▼23 ▼21
Buenos Aires 91 571 94 543 ▲3 ▲28
Panama 94 566 91 548 ▼3 ▲18
Trinidad & Tobago 97 563 New New New New
Bogota 100 554 New New New New
Sao Paulo 104 542 80 569 ▼24 ▼27
Chart 41 | Top Five Latin American & Caribbean Centres Over Time
34The Global Financial Centres Index 29
Chart 41 | Average Assessments By Region For Latin America & The Caribbean –
Difference From The Overall Mean
Chart 42 | Assessments By Region For British Virgin Islands - Difference From The Overall
Mean
Chart 44 | Assessments By Region For Barbados - Difference From The Overall Mean
Chart 45 | Assessments By Region For Santiago - Difference From The Overall Mean
35The Global Financial Centres Index 29
Home Centre Prospects
While the GFCI is calculated using only assessments from other centres, we ask
respondents about the prospects of the centre in which they are based; and
specifically whether their ‘home’ centre will become more or less competitive.
In general, people are more optimistic about the future of their own centre than
people outside that centre. Respondents from Shanghai are particularly optimistic.
However, a greater proportion of respondents in London are less certain than those
in other centres, reflecting the continuing uncertainty about future trading relations
with the European Union and the rest of the world. New Yorkers largely believed
their city’s performance would remain the same.
Chart 46 | Home Centre Prospects - New Chart 47 | Home Centre Prospects -
York London
Chart 48 | Home Centre Prospects - Chart 49 | Home Centre Prospects -
Shanghai Hong Kong
36The Global Financial Centres Index 29
Stability
Chart 50 contrasts the ‘spread’ or variance of the individual assessments given to each
of the top 40 centres with the sensitivity to changes in the instrumental factors.
The chart shows three bands of financial centres. The unpredictable centres in the
top right of the chart have a higher sensitivity to changes in the instrumental factors
and a higher variance of assessments. These centres have the highest potential future
movement. The stable centres in the bottom left have a lower sensitivity to changes
in the instrumental factors and a lower variance of assessments.
We have only plotted the top 40 centres (for clarity) but it is worth noting that most
of the centres lower in the index would be in the dynamic and unpredictable areas of
the chart if plotted. Eight of the top 10 centres in the index are in the stable area.
Chart 50 | Stability Of The Top 40 Centres In GFCI 29
37The Global Financial Centres Index 29
In addition, we look at the stability of rankings in the index over time. Chart 51 shows
the standard deviation of index rankings against the variance in assessments over the
last 24 months. Some of the centres in the dynamic or unpredictable table area in the
most recent analysis in Chart 45 move into the stable area when their rankings and
assessments are considered over time, for example, Luxembourg, Shenzhen, and
Melbourne.
Chart 51 | Standard Deviation In Index Rankings And Assessments Over Time
“London must compete on regulation, no matter
what levelling measures are agreed in Brexit
negotiations. Corruption at all levels must be
rigorously stamped on. This will require a SEC-style
whistle-blower regime with substantial rewards
attached.”
ADVISOR, PROFESSIONAL SERVICES FIRM, LONDON
38The Global Financial Centres Index 29
Reputation
We look at reputation in the GFCI model by examining the difference between the
weighted average assessment given to a financial centre and the overall rating in the
index.
The first measure reflects the average score a centre receives from financial
professionals across the world, adjusted for time, with more recent assessments given
more weight (see Appendix 3 for details).
The second measure is the GFCI rating itself, which represents the assessments
adjusted to take account of the instrumental factors. If a centre has a higher average
assessment than its GFCI rating, this indicates that respondents’ perceptions of a centre
are more favourable than the quantitative measures alone suggest.
Table 14 shows the top 15 centres with the greatest positive difference between the
average assessment and the GFCI rating. Nine of the top 15 centres in terms of
reputational advantage are in the Asia/Pacific region. Alongside New York and London, a
number of Western European centres feature in the list. This may be due to strong
marketing, or awareness of a centre’s existing or emerging strengths.
‘Reputational advantage’ can become a weakness. These centres need to support their
successful marketing with genuine improvements in their underlying competitiveness.
GIFT City-Gujarat stands out as needing to address this urgently.
Table 14 | GFCI 29 Top 15 Centres Assessments And Ratings — Reputational Advantage
Weighted Average GFCI 29 GFCI 29 Reputational
Centre
Assessment Rating Advantage
GIFT City-Gujarat 922 568 354
Qingdao 844 665 179
Stuttgart 811 689 122
Shenzhen 817 731 86
Guangzhou 786 706 80
Singapore 819 740 79
London 816 743 73
New York 831 764 67
Shanghai 806 742 64
Beijing 792 737 55
Rome 688 636 52
Zurich 762 720 42
Hong Kong 782 741 41
Luxembourg 753 712 41
Melbourne 743 705 38
39The Global Financial Centres Index 29
Table 15 shows the 15 centres with the greatest reputational disadvantage. This
indicates that respondents’ perceptions of a centre are less favourable than the
quantitative measures alone would suggest. The centres featured might benefit from
a stronger marketing effort as well as tackling some core issues relating to the centre.
Table 15 | GFCI 29 Bottom 15 Centres Assessments And Ratings — Reputational
Disadvantage
Weighted Average GFCI 29 GFCI 29 Reputational
Centre
Assessment Rating Advantage
Dalian 444 491 -47
Vancouver 669 719 -50
Tel Aviv 616 666 -50
Sofia 514 565 -51
Jakarta 513 567 -54
Tianjin 436 492 -56
Wellington 598 660 -62
Casablanca 567 632 -65
Rio de Janeiro 521 587 -66
Johannesburg 502 572 -70
Wuhan 398 469 -71
Hamburg 587 664 -77
Mumbai 520 599 -79
Calgary 501 593 -92
New Delhi 460 584 -124
“The availability of skilled people and flexibility of
the labour markets is a major consideration when
global asset management companies choose their
branch location. Shanghai is working hard to
attract talented professionals by providing a
preferential taxation policy and a settled
city policy.”
VICE PRESIDENT, INVESTMENT MANAGEMENT FIRM, SHANGHAI
40The Global Financial Centres Index 29
Working Patterns Post Covid-19
Over the last year, we have included in the GFCI questionnaire a section on working
patterns before and after the covid-19 pandemic. Chart 52 shows the pattern of former
and expected future work patterns, divided between spending time in clients’ premises, at
home, and in the office, with Chart 53 showing the data by region.
Overall, respondents are projecting a shift in working from office to home of more than
20% of their time in the future, with home working reaching 40% of working time. Time
spent with clients is expected to remain similar.
Most respondents expected to be spending 30% to 40% of their time working from home,
but in Western Europe, this figure rose to around 55%.
Chart 52 | Percentage Of Time Spent With Clients, At Home, And In The Office Before
Covid-19 And Moving Forward
Chart 53 | Expected Change In Working Pattern By Region Before Covid-19 And
Moving Forward
41The Global Financial Centres Index 29
There is an expectation in organisations of all sizes that there will be a shift from office to
home working. Smaller organisations, with fewer that 50 staff expect to work the most in
an office going forward, with an expectation of 50% of time in the office.
Chart 54 | Expected Change In Working Pattern By Region Before Covid-19 And
Moving Forward
We asked respondents to comment on future working patterns. The main issues
raised were:
• The shift to online working and video conferencing is set to continue.
• Staggered hours will become the norm and employment routines are likely to be
more flexible.
• Processes were being digitized at a faster pace than before, with AI and machine
learning applications used more extensively.
• Reduction in travel, especially long-haul, but with increased international
connectivity through digital means.
• Financial centres will remain important, differentiated by regulatory structures,
ethics and values, although they may be organised as a looser network across a
wider geographical area.
42The Global Financial Centres Index 29
FinTech
Alongside the main GFCI index, we analyse financial centres in terms of their FinTech
offering. Table 16 shows the centres that received sufficient assessments to feature in the
Fintech index, together with the change in their rank and ratings since GFCI 28. Chinese
and USA centres feature strongly, reflecting their focus on technology development. Tel
Aviv is a new entrant to the FinTech Ranking, and has entered in 10th place. Looking at
centres in the top 45 in the main GFCI index, Guangzhou, Chengdu, Tel Aviv, Qingdao, and
San Diego are more than 10 places higher in the FinTech rankings. Frankfurt, Zurich,
Luxembourg, Edinburgh, Melbourne, Stuttgart, Madrid, and Jersey are more than 10 places
lower in Fintech.
Table 16 | GFCI 29 FinTech Ranks And Ratings - Top 45 Centres
GFCI 29 GFCI 28
Centre
FinTech Rank FinTech Rating FinTech Rank FinTech Rating Change In Rank Change In Rating
New York 1 731 1 735 0 ▼4
Shanghai 2 722 3 719 ▲1 ▲3
Beijing 3 719 2 725 ▼1 ▼6
Shenzhen 4 716 5 713 ▲1 ▲3
London 5 712 4 716 ▼1 ▼4
Hong Kong 6 711 6 707 0 ▲4
Singapore 7 710 9 698 ▲2 ▲12
Los Angeles 8 692 12 693 ▲4 ▼1
San Francisco 9 691 7 706 ▼2 ▼15
Tel Aviv 10 688 New New New New
Guangzhou 11 684 8 701 ▼3 ▼17
Washington DC 12 681 10 696 ▼2 ▼15
Seoul 13 679 18 661 ▲5 ▲18
Vancouver 14 678 20 659 ▲6 ▲19
Sydney 15 677 21 655 ▲6 ▲22
Tokyo 16 676 14 677 ▼2 ▼1
Paris 17 675 15 674 ▼2 ▲1
Boston 18 674 11 694 ▼7 ▼20
Chicago 19 670 13 685 ▼6 ▼15
Frankfurt 20 669 19 660 ▼1 ▲9
Zurich 21 668 30 643 ▲9 ▲25
Toronto 22 667 22 654 0 ▲13
Amsterdam 23 666 17 665 ▼6 ▲1
Dubai 24 665 28 645 ▲4 ▲20
Chengdu 25 664 32 641 ▲7 ▲23
Geneva 26 663 40 632 ▲14 ▲31
Busan 27 662 37 636 ▲10 ▲26
San Diego 28 661 53 593 ▲25 ▲68
Abu Dhabi 29 660 35 638 ▲6 ▲22
Qingdao 30 659 33 640 ▲3 ▲19
Stockholm 31 654 New New New New
Vilnius 32 650 26 648 ▼6 ▲2
Montreal 33 649 27 646 ▼6 ▲3
Milan 34 648 36 637 ▲2 ▲11
Taipei 35 647 43 621 ▲8 ▲26
Melbourne 36 646 New New New New
Copenhagen 37 643 38 635 ▲1 ▲8
Brussels 38 642 23 653 ▼15 ▼11
Edinburgh 39 635 16 669 ▼23 ▼34
Dublin 40 633 42 623 ▲2 ▲10
Osaka 41 631 51 598 ▲10 ▲33
Luxembourg 42 630 52 595 ▲10 ▲35
Berlin 43 629 New New New New
Lisbon 44 627 48 604 ▲4 ▲23
Hamburg 45 624 24 650 ▼21 ▼26
43The Global Financial Centres Index 29
Table 16 (Continued) | GFCI 29 FinTech Ranks And Ratings - Remaining Centres
GFCI 29 GFCI 28
Centre
FinTech Rank FinTech Rating FinTech Rank FinTech Rating Change In Rank Change In Rating
Helsinki 46 621 New New New New
Stuttgart 47 620 25 649 ▼22 ▼29
Oslo 48 619 41 631 ▼7 ▼12
Munich 49 616 29 644 ▼20 ▼28
Rome 50 615 39 633 ▼11 ▼18
Madrid 51 609 31 642 ▼20 ▼33
Moscow 52 608 45 619 ▼7 ▼11
Manila 53 599 New New New New
Santiago 54 595 58 569 ▲4 ▲26
Mumbai 55 594 34 639 ▼21 ▼45
Doha 56 591 57 571 ▲1 ▲20
Bangkok 57 587 47 605 ▼10 ▼18
Kuala Lumpur 58 586 New New New New
New Delhi 59 584 New New New New
Monaco 60 583 74 459 ▲14 ▲124
Cape Town 61 582 New New New New
GIFT City-Gujarat 62 581 63 546 ▲1 ▲35
Jersey 63 580 73 489 ▲10 ▲91
Mexico City 64 579 50 599 ▼14 ▼20
Istanbul 65 578 49 602 ▼16 ▼24
Vienna 66 577 44 620 ▼22 ▼43
Liechtenstein 67 576 76 454 ▲9 ▲122
Tallinn 68 575 New New New New
Prague 69 574 55 587 ▼14 ▼13
Rio de Janeiro 70 572 54 592 ▼16 ▼20
Buenos Aires 71 571 New New New New
Calgary 72 570 New New New New
Tehran 73 569 New New New New
Bogota 74 567 New New New New
Bahrain 75 562 70 506 ▼5 ▲56
Malta 76 561 New New New New
Budapest 77 560 62 550 ▼15 ▲10
Kuwait City 78 559 New New New New
Isle of Man 79 556 75 457 ▼4 ▲99
Casablanca 80 555 71 505 ▼9 ▲50
Panama 81 554 72 499 ▼9 ▲55
Bahamas 82 550 69 510 ▼13 ▲40
St. Petersburg 83 547 New New New New
Bermuda 84 546 78 433 ▼6 ▲113
Sofia 85 545 New New New New
British Virgin Islands 86 544 77 443 ▼9 ▲101
Johannesburg 87 541 New New New New
Almaty 88 535 67 537 ▼21 ▼2
Athens 89 533 56 578 ▼33 ▼45
Sao Paulo 90 531 46 608 ▼44 ▼77
Jakarta 91 528 New New New New
Riyadh 92 527 New New New New
Mauritius 93 526 New New New New
Baku 94 525 New New New New
Guernsey 95 522 New New New New
Cayman Islands 96 520 79 427 ▼17 ▲93
Hangzhou 97 516 66 539 ▼31 ▼23
Nur-Sultan 98 515 New New New New
Dalian 99 514 65 540 ▼34 ▼26
Tianjin 100 512 59 567 ▼41 ▼55
Riga 101 509 New New New New
Cyprus 102 504 68 536 ▼34 ▼32
Xi'an 103 501 61 556 ▼42 ▼55
Nanjing 104 497 60 559 ▼44 ▼62
Wuhan 105 471 64 544 ▼41 ▼73
44The Global Financial Centres Index 29
We asked survey respondents to identify:
• The four most important elements in generating a competitive environment for FinTech
providers and
• The most important areas of current FinTech activity.
Charts 55 and 56 show the results, with access to finance and the availability of skilled
people seen as the leading elements, and with big data analytics and payment transaction
Chart 55 | Most Important Elements In Generating A Competitive Environment For
FinTech Providers
Chart 56 | Most Important Areas Of FinTech Activity
45The Global Financial Centres Index 29
Appendix 1: Assessment Details
Table 17 | GFCI 29 Details Of Assessments By Centre
GFCI 29 Assessments GFCI 29 Assessments
Centre St. Centre St.
Rank Rating Number Average Rank Rating Number Average
Dev Dev
New York 1 764 4,067 833 172 Bangkok 59 610 360 605 196
London 2 743 2,415 818 164 Monaco 60 609 268 609 220
Shanghai 3 742 2,462 809 173 Warsaw 61 607 136 593 199
Hong Kong 4 741 3,231 784 184 Vilnius 62 606 197 599 271
Singapore 5 740 1,581 821 150 Malta 63 603 191 587 210
Beijing 6 737 2,557 797 191 Barbados 64 600 105 596 234
Tokyo 7 736 1,638 736 209 Mumbai 65 599 323 529 274
Shenzhen 8 731 1,467 815 166 Bratislava 66 598 104 602 221
Frankfurt 9 727 872 751 185 Santiago 67 597 285 593 195
Zurich 10 720 645 764 175 Bahrain 68 596 263 564 241
Vancouver 11 719 276 672 197 Mexico City 69 595 555 574 199
San Francisco 12 718 609 751 189 Oslo 70 594 218 574 235
Los Angeles 13 716 1,082 727 202 Calgary 71 593 181 514 255
Washington DC 14 715 755 751 195 Cayman
72 592 290 580 251
Chicago 15 714 869 734 189 Islands
Seoul 16 713 355 735 180 Bahamas 73 591 226 556 231
Luxembourg 17 712 515 753 171 Istanbul 74 590 466 560 192
Sydney 18 711 566 746 183 Guernsey 75 589 169 556 249
Dubai 19 710 1,733 713 196 Prague 76 588 262 569 208
Geneva 20 709 497 728 179 Rio de Janeiro 77 587 229 524 213
Edinburgh 21 708 288 692 178 Nur-Sultan 78 586 232 609 235
Guangzhou 22 706 1,919 794 196 Manila 79 585 174 606 211
Melbourne 23 705 207 747 181 New Delhi 80 584 241 473 290
Boston 24 703 740 695 228 Glasgow 81 583 97 621 230
Paris 25 699 1,203 730 170 Cape Town 82 582 123 593 199
Milan 26 698 467 710 180 Kuwait City 83 581 181 564 245
Montreal 27 696 240 662 197 Bermuda 84 580 251 557 244
Amsterdam 28 695 615 709 192 Budapest 85 577 342 546 206
Toronto 29 694 488 721 190 Isle of Man 86 576 208 578 221
Stuttgart 30 689 387 837 232 Tallinn 87 575 155 538 252
Stockholm 31 688 250 668 193 St Petersburg 88 574 205 557 219
Osaka 32 684 528 654 224 Mauritius 89 573 173 537 230
Madrid 33 683 319 664 184 Johannesburg 90 572 181 504 210
Copenhagen 34 680 242 680 208 Buenos Aires 91 571 218 553 225
Qingdao 35 678 1,272 831 183 GIFT City-
92 568 568 921 211
Busan 36 677 1,373 691 203 Gujarat
Brussels 37 676 352 664 193 Jakarta 93 567 164 521 224
Abu Dhabi 38 675 811 670 221 Panama 94 566 325 529 230
Jersey 39 673 228 647 207 Sofia 95 565 167 514 231
Taipei 40 668 570 661 191 Tehran 96 564 184 535 231
Tel Aviv 41 666 192 622 233 Trinidad &
97 563 52 573 225
Chengdu 42 665 2,488 700 282 Tobago
Hamburg 43 664 270 586 224 Cyprus 98 561 201 525 227
San Diego 44 663 245 630 224 Gibraltar 99 559 122 556 252
Berlin 45 662 231 676 200 Bogota 100 554 213 526 231
Wellington 46 660 102 624 288 Almaty 101 553 227 557 266
Kuala Lumpur 47 652 215 611 188 Reykjavik 102 549 102 542 280
Dublin 48 650 446 665 206 Athens 103 545 218 525 232
Munich 49 647 377 676 184 Sao Paulo 104 542 371 550 198
Lisbon 50 641 226 630 174 Riyadh 105 541 187 509 243
Liechtenstein 51 638 207 621 246 Nairobi 106 520 124 487 234
Rome 52 636 634 685 199 Baku 107 515 154 501 237
Casablanca 53 632 218 563 264 Hangzhou 108 501 1,090 501 259
Vienna 54 629 307 600 225 Riga 109 493 156 506 221
Doha 55 628 450 614 210 Tianjin 110 492 887 430 206
Helsinki 56 620 175 609 196 Dalian 111 491 971 442 215
Moscow 57 615 708 598 200 Xi'an 112 485 473 438 210
British Virgin Nanjing 113 484 917 441 208
58 614 314 575 250
Islands Wuhan 114 469 685 397 239
46You can also read