The costs & benefits of mutual recognition of imputation & franking credits - BusinessNZ
←
→
Page content transcription
If your browser does not render page correctly, please read the page content below

Final report

               The costs & benefits of mutual
               recognition of imputation &
               franking credits
               NZIER and CIE final report
               August 2012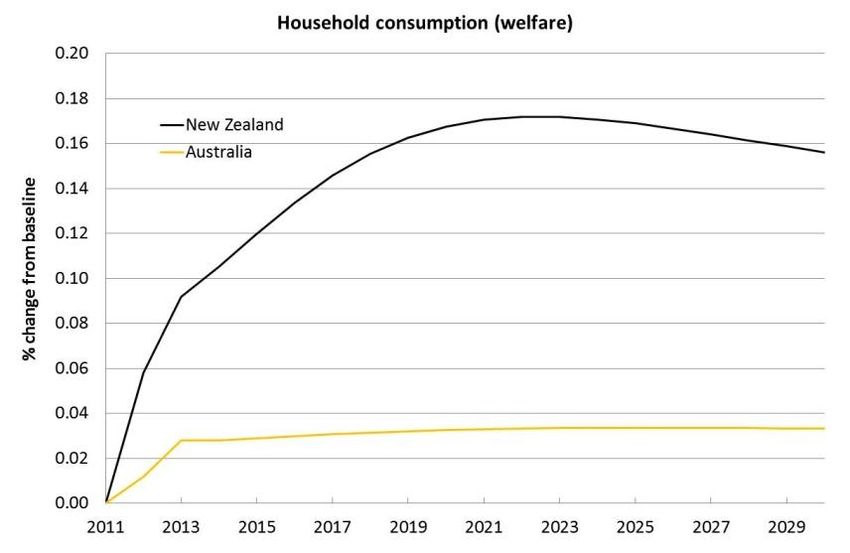
About NZIER
NZIER is a specialist consulting firm that uses applied economic research and analysis to provide a
wide range of strategic advice to clients in the public and private sectors, throughout New Zealand
and Australia, and further afield.

NZIER is also known for its long-established Quarterly Survey of Business Opinion and Quarterly
Predictions.

Our aim is to be the premier centre of applied economic research in New Zealand. We pride ourselves
on our reputation for independence and delivering quality analysis in the right form, and at the right
time, for our clients. We ensure quality through teamwork on individual projects, critical review at
internal seminars, and by peer review at various stages through a project by a senior staff member
otherwise not involved in the project.

Each year NZIER devotes resources to undertake and make freely available economic research and
thinking aimed at promoting a better understanding of New Zealand‘s important economic challenges.
NZIER was established in 1958.

About CIE
The Centre for International Economics is a private economic research agency that provides
professional, independent and timely analysis of international and domestic events and policies. The
CIE‘s professional staff arrange, undertake and publish commissioned economic research and analysis
for industry, corporations, governments, international agencies and individuals. While The CIE
endeavours to provide reliable analysis and believes the material it presents is accurate, it will not be
liable for any party acting on such information.

Authorship and acknowledgements
This paper was prepared at NZIER by Chris Nixon and John Ballingall. The modelling was carried out
by Lee Davis, Jason Soon and Tingsong Jiang of the Centre for International Economics, Australia.
The report was quality approved by Jean-Pierre de Raad.

Guidance was provided by the ANZ Leadership Forum Project Steering Group. Chaired by Murray Jack,
Chairman of Deloitte New Zealand, the Group comprised representatives from Business Council of
Australia and BusinessNZ with support on technical tax and related issues from the New Zealand
Inland Revenue, pwc, the New Zealand Treasury and Robin Oliver. Their input is gratefully
acknowledged. Discussions with the New Zealand and Australian Productivity Commissions have also
been valuable and we thank them for their input.

This report has been prepared with financial assistance from a range of New Zealand and Australian
businesses and we thank them for their generous support. The companies include Fletcher Building,
Fonterra, Westpac, Bank of New Zealand, ANZ Bank, Air New Zealand, ASB Bank, Auckland
International Airport, Telecom New Zealand, IAG Group, Sky City Entertainment Group, Woolworths,
Wesfarmers, Origin Energy, Orica, Macquarie Group, BusinessNZ.

The analysis and opinions put forward in this report are those of the authors alone and do not
necessarily represent the views of those organisations acknowledged above.

nzier.org.nz
8 Halswell St, Thorndon | PO Box 3479, Wellington
Tel +64 4 472 1880 | Fax +64 4 472 1211 | econ@nzier.org.nz

© NZ Institute of Economic Research (Inc) 2012. Cover image © Dreamstime.com .
NZIER‘s standard terms of engagement for contract research can be found at www.nzier.org.nz. While NZIER will use
all reasonable endeavours in undertaking contract research and producing reports to ensure the information is as
accurate as practicable, the Institute, its contributors, employees, and Board shall not be liable (whether in contract,
tort (including negligence), equity or on any other basis) for any loss or damage sustained by any person relying on
such work whatever the cause of such loss or damage.
Key points
A continuing issue for businesses operating across the Tasman is the lack of mutual
recognition of imputation and franking credits.

To assist in the further consideration of the matter, this study provides a basis for
assessing the potential economic implications of a move to a system of mutual
recognition.

A system of mutual recognition of imputation and franking credits would be likely to
deliver net benefits to both Australia and New Zealand. Under the central scenario
modelled trans-Tasman GDP could rise by around NZ$5.3 billion in Net Present Value
terms by 2030. Trans-Tasman welfare is estimated to improve by NZ$7.0 billion.

The problem: double taxation = inefficient resource allocation
Currently some NZ$7.4 billion of trans-Tasman equity investment dividends could
potentially be taxed twice – first via company tax in the destination country and secondly
via personal tax regimes in the investor‘s economy. Australian equity investors in New
Zealand face an effective tax rate of some 60%, and New Zealand investors in Australia
face an effective tax rate of 53%.

The existing regime can be seen as a form of tariff on trans-Tasman investment flows. As
with a tariff, the result is that resources are not allocated efficiently. Trans-Tasman
investment decisions are being made at least in part to minimise tax payments, rather
than on a purely economic basis.

Firms may not be growing their trans-Tasman activities as much as they might do in the
absence of such a distortion and are spending scarce management resources on
minimising tax rather than boosting growth. Case studies in this report support this
perception.

A solution: mutual recognition of imputation credits
One option for addressing this inefficiency would be for New Zealand and Australia to
adopt mutual recognition of franking credits (in Australia) and imputation credits (in New
Zealand). A franking or imputation credit is a way of providing credit against tax on
dividends received by domestic shareholders for tax paid at the company level.

To date, mutual recognition has been resisted primarily due to concerns about the tax
revenue that would be forgone. Yet little attention has been paid to estimating the
potential economic benefits of such a scheme.

We estimate the costs and benefits of mutual recognition using
a global computable general equilibrium model
This report uses the internationally-recognised CIEG-Cubed model of the global economy
that incorporates forward-looking investment expectations and explicitly considers the
links between fiscal policy and economic growth and household welfare to estimate the
potential costs and benefits of introducing a mutual recognition scheme.

Recognising that concerns over forgone tax have been a stumbling block in the past and
the current tight fiscal environments facing both governments, our modelling approach is
revenue neutral for both governments. When mutual recognition is introduced, the tax
forgone is regained by small increases in other taxes on households. 1

    1
        If both governments were in a position of fiscal surplus – as they are expected to be within a few
        years – they would have more options available to them regarding tax cuts and spending.

NZIER report - The costs & benefits of mutual recognition of imputation & franking credits                   ii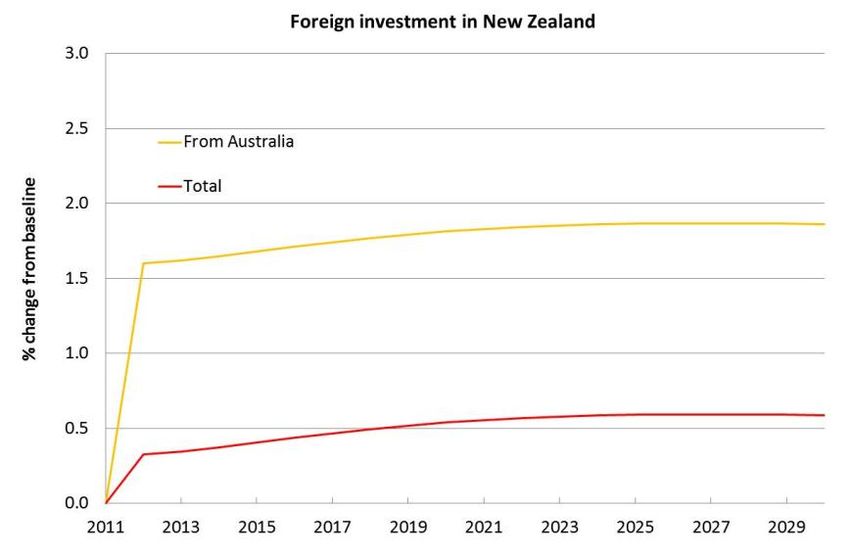
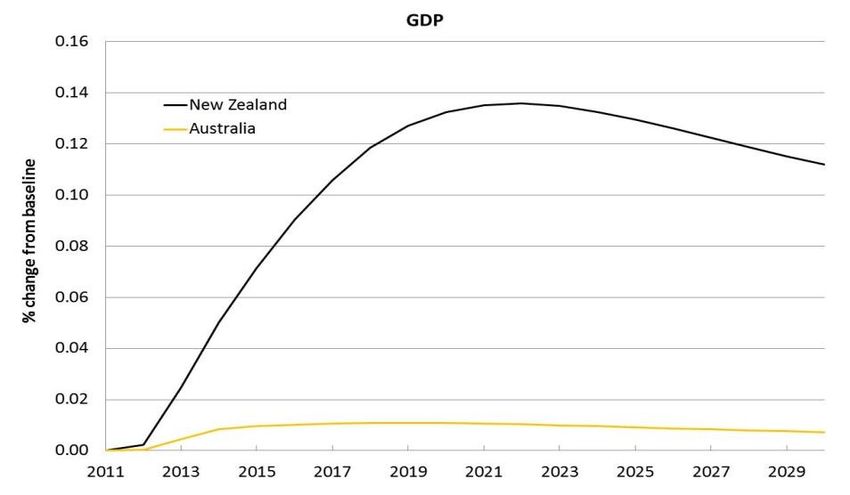
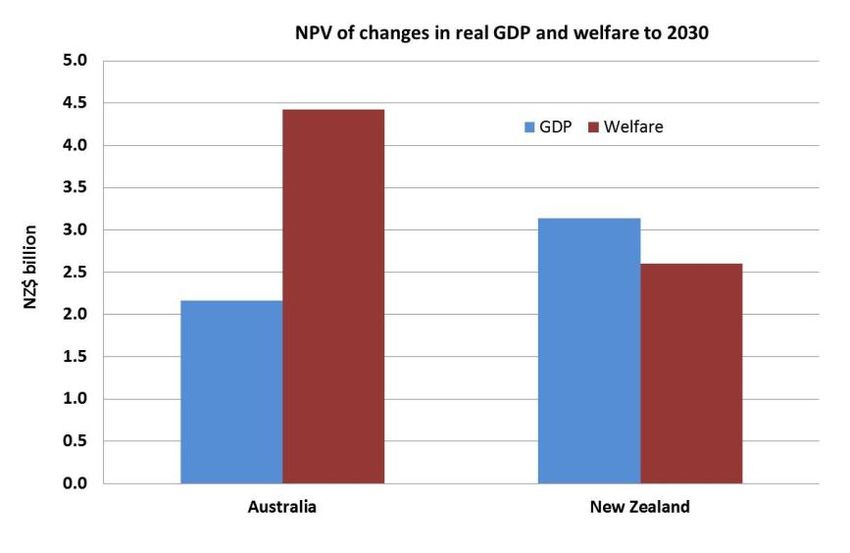
We conduct sensitivity analysis around key assumptions related to: the share of Australian
investments in New Zealand that are in Australian superannuation funds and thus face a
concessional tax rate; the proportion of dividends distributed; and the tax instrument used
to replace the initial forgone tax revenue.

The trans-Tasman economy would expand by NZ$5.3 billion by
2030 from mutual recognition, with both countries gaining
Under our central modelling scenario, after mutual recognition is introduced, the trans-
Tasman economy grows by NZ$5.3 billion (Net Present Value) above baseline by 2030.
This is due to both countries facing a lower cost of capital as post-tax returns on trans-
Tasman increase after mutual recognition is introduced, as well as higher household
disposable income. Household consumption – our preferred measure of welfare –
increases by NZ$7.0 billion.

New Zealand gains proportionately more from mutual recognition. This would be expected
given the far larger share of New Zealand‘s equity investment that comes from Australia
than vice versa. However, even though Australia‘s gains are small, this study finds they
are indeed net gains rather than losses, that is even after taking into account the initial
tax forgone.

Dynamic productivity gains would increase these benefits
We have taken a conservative approach to our modelling and looked only at the allocative
efficiency gains from mutual recognition. We would expect – and our case studies agree –
that mutual recognition would also generate dynamic productivity gains from increased
competition and innovation, and reduced management time spent on tax avoidance.

Estimating the magnitude of these gains is beyond the scope of this report. However,
their existence would boost the net benefits of a mutual recognition scheme above the
figures reported here.

The results are robust to sensitivity analysis
The overall story that mutual recognition delivers net benefits for both economies does
not change under sensitivity testing.

The sensitivity analysis indicates, as expected, the GDP gains from mutual recognition are
slightly higher the larger the proportion of dividends distributed and the higher the share
of Australian investment in New Zealand accounted for by superannuation funds. Both of
these scenarios see a larger proportion of trans-Tasman capital being cheaper, which
boosts economic activity and household spending.

The choice of household tax used to replace the initial tax forgone has very little impact
on the results.

Next steps
As with any economic modelling, especially in a relatively new field of study, many
assumptions are required and there are many avenues for further research. Particular
areas of interest are how dividend distribution might change under mutual recognition and
what the share of superfund Australian investment in New Zealand might be.

However, the empirical analysis and case studies in this report, when combined
with the theoretical benefits from mutual recognition, suggest that this is an
initiative that would stimulate business and deliver a significant net benefit to
the trans-Tasman economy.

NZIER report - The costs & benefits of mutual recognition of imputation & franking credits   iii
Contents
1. Introduction .............................................................................................................. 1
2. Investment is the missing link in the SEM ................................................................... 2
3. Trans-Tasman investors are double taxed on dividends............................................... 3
3.1 The double tax problem .................................................................................. 3
3.2 Mutual recognition is like removing a bilateral tariff .......................................... 4
3.3 So why hasn‘t mutual recognition been introduced? ......................................... 5
3.4 The distorting and costly impacts of double taxation in practice: two case
studies ......................................................................................................... 6
4. Proposed changes ..................................................................................................... 9
4.1 Mutual recognition .......................................................................................... 9
4.2 Alternatives .................................................................................................... 9
5. Costs and benefits of mutual recognition .................................................................. 11
5.1 The cost benefit framework ........................................................................... 11
5.2 Not all impacts can be quantified ................................................................... 11
5.3 Counterfactual .............................................................................................. 11
5.4 Affected parties ............................................................................................ 12
5.5 Costs to trans-Tasman economy .................................................................... 12
5.6 Benefits to trans-Tasman economy ................................................................ 14
5.7 What we quantify.......................................................................................... 15
6. Modelling approach ................................................................................................. 17
6.1 Introduction.................................................................................................. 17
6.2 The CIEG-Cubed model ................................................................................. 17
6.3 Modelling shocks........................................................................................... 18
6.4 Timing of MRF&IC introduction ...................................................................... 19
6.5 A word of caution ......................................................................................... 20
7. Results ................................................................................................................... 21
7.1 Headline results ............................................................................................ 21
7.2 The mechanisms through which MRF&IC affects the economy ........................ 21
7.3 Economic activity and welfare........................................................................ 22
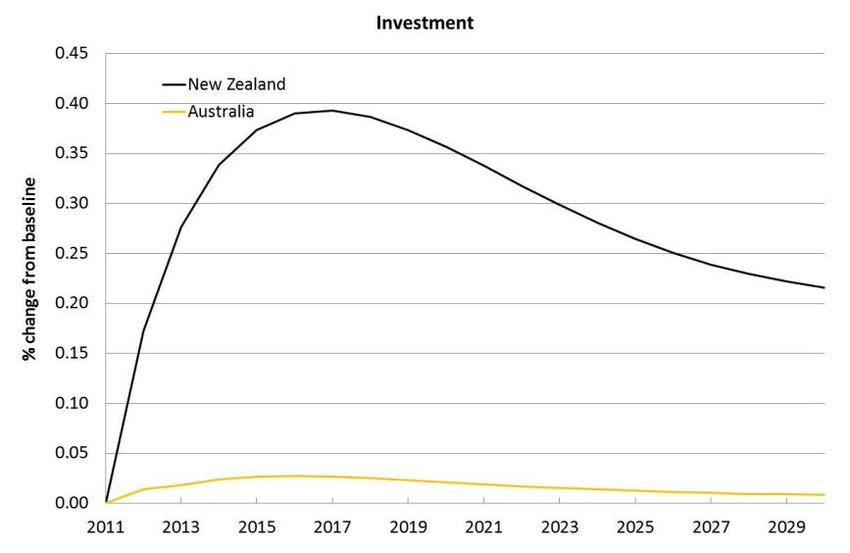
7.4 Savings and investment ................................................................................ 24
7.5 Foreign investment ....................................................................................... 25
8. Sensitivity analysis .................................................................................................. 28
9. Conclusions ............................................................................................................. 31
10. References ............................................................................................................ 32
Appendices
Appendix A Developing the modelling shocks ............................................................... 33
Appendix B Tax burden considerations ......................................................................... 39
NZIER report - The costs & benefits of mutual recognition of imputation & franking credits iv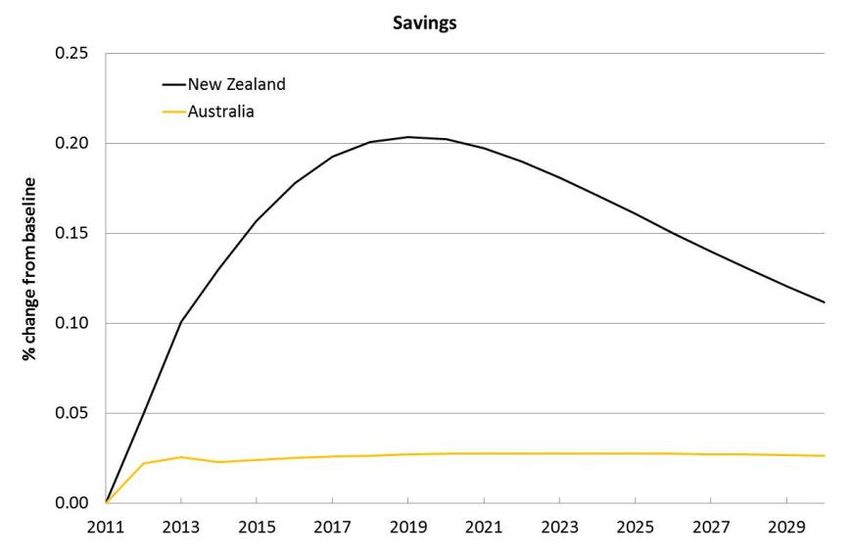
Figures
Figure 1: Steps to trans-Tasman integration ................................................................... 2
Figure 2 Production and welfare gains .......................................................................... 22
Figure 3 Economic activity and welfare impacts ............................................................ 23
Figure 4 Savings and investment impacts ..................................................................... 25
Figure 5 Foreign investment impacts ............................................................................ 26

Tables
Table 1 Status quo: Australian direct investment into New Zealand ................................. 3
Table 2 Status quo: New Zealand direct investment into Australia ................................... 4
Table 3 Summary of approaches .................................................................................. 10
Table 4 Short term fiscal costs of mutual recognition .................................................... 13
Table 5 Which impacts are quantified? ......................................................................... 15
Table 6 Increase in real GDP above baseline under changed assumptions ..................... 29
Table 7 After tax value of Australian share of New Zealand corporate profits ................. 34
Table 8 Potential revenue lost by Australian government from MRF&IC ......................... 35
Table 9 Changes in post-tax returns from Australian investment in New Zealand under
status quo and MRF&IC ............................................................................................... 36
Table 10 After tax value of New Zealand share of Australian corporate profits ............... 37
Table 11 Potential revenue lost by NZ government from MRF&IC .................................. 38
Table 12 Changes in post-tax returns from NZ investment in Australia under status quo
and MRF&IC ............................................................................................................... 38
Table 13 Marginal excess burdens of Australian taxes ................................................... 39

NZIER report - The costs & benefits of mutual recognition of imputation & franking credits                                 v
1. Introduction
Australia and New Zealand have made significant steps to fully integrating their
economies. According to the WTO the integration process has developed ―… one of the
world‘s most comprehensive trading arrangements‖ and this has been done at least cost.2

One area where progress has not been as impressive is investment.3 Currently, Australia
has an equity investment stock of NZ$37.5 billion in New Zealand, and New Zealand has a
NZ$20.8 billion stock of equity investment in Australia. The dividends generated from
these investments are being taxed twice before they end up in households‘ pockets.

The current double taxation regulations act as a barrier to the free flow of trans-Tasman
investment. This causes economic inefficiencies for New Zealand and Australia as
investment flows are at least partially determined by tax policy rather than economic
fundamentals.

A way of eliminating this barrier on investment is to adopt mutual recognition of franking
credits (in Australia) and imputation credits (in New Zealand) [henceforth MRF&IC]. The
purpose of this report is to provide a cost benefit analysis (CBA) of implementing a mutual
recognition scheme.

The idea of MRF&IC has been around for some time. It has been the subject of various
reports4 but these studies have been either conceptual or largely confined to the question
of tax. Indeed, the debate has been dominated by concerns over lost tax revenue. To our
knowledge, no research has quantified the benefits from MRF&IC.

We have taken a fresh look at the problem to explain why this is not just a tax issue but
an important component of the SEM. To provide an independent trans-Tasman approach
the New Zealand Institute of Economic Research (NZIER) has partnered with Sydney‘s
Centre for International Economics (CIE) to develop a systematic economic appraisal that
details the quantifiable and non-quantifiable costs and benefits of MRF&IC.

The analysis is intended to give policymakers an indication of the likely magnitude of costs
and benefits to assist in a decision on whether or not to progress with MRF&IC and to
inform the business debate on the topic. However, it needs to be acknowledged that this
is a complex area of policy to model and that there are data gaps. As such the modelling
results should not be seen as precise forecasts, but indications of the potential direction
and size of impacts.

In our modelling, we have drawn on publicly available data wherever possible. Where
comprehensive data is not available, we have used our professional judgement and drawn
on the views of experts to inform our analysis. We have used sensitivity analysis to test
the influence of key assumptions on the results.

    2
        See http://www.wto.org/english/tratop_e/tpr_e/tp44_e.htm
    3
        This is despite the signing of the Investment Protocol to the New Zealand Australia Closer Economic
        Relations Trade Agreement in 2011. This Protocol focused on lifting the screening thresholds on
        bilateral investment in business assets and improving investor certainty about access to and
        transfers of investment funds.
    4
        Notably Australia‘s Future Tax System (2010) (otherwise known as the Henry Report), Dunbar
        (2005) and Shewan (2008).

NZIER report - The costs & benefits of mutual recognition of imputation & franking credits                1
2. Investment is the
missing link in the SEM
Both countries are committed to the SEM. To reinforce this goal the then Australian Prime
Minister Kevin Rudd and the New Zealand Prime Minister John Key issued a joint
statement in March 2009 that outlined their ambition. They stressed (emphasis added):
‖5 …we are committed to accelerating regulatory harmonisation and
alignment in order to stimulate business and create jobs. To that end, we
have agreed on a framework of principles and a range of shared medium
term practical outcomes for developing cross border economic initiatives.
The outcomes framework supports an aspirational Single Economic
Market (SEM) agenda, and will in the short-term drive pragmatic
initiatives and set clear timelines for the work programme. A key
element within the framework is a deliberate move from
consideration purely of national benefits in policy development,
to consideration of the net trans-Tasman benefit.‖
We interpret this quote – and especially the last sentence – to mean that the aim of the
SEM is to maximise Australian and New Zealand welfare. Part of this process is to allow
business people to make locational decisions on the basis of economic factors rather than
policy constraints. Therefore, removing barriers to trans-Tasman investment flows is
potentially an important element of ―accelerating regulatory harmonisation and alignment ‖
in the two economies as depicted in Figure 1.
Figure 1: Steps to trans-Tasman integration
Source: NZIER
5
http://www.beehive.govt.nz/release/joint-statement-prime-ministers-rudd-and-key
NZIER report - The costs & benefits of mutual recognition of imputation & franking credits 23. Trans-Tasman investors
are double taxed on
dividends
3.1 The double tax problem
Currently, dividends from Australian companies in New Zealand that are repatriated to
shareholders in Australia are taxed twice: once via company tax in New Zealand and once
via the personal tax system in Australia.
The impact is set out in Table 1 for an Australian shareholder (on the top personal tax
rate) in a New Zealand company.6 Under the status quo the effect of double taxation is
evident when compared with a situation ―with‖ MRF&IC. The effective tax rate on
Australian shareholders drops by nearly 40% with the introduction of MRF&IC.
Table 1 Status quo: Australian direct investment into New
Zealand
Dollars
Australian shareholder in a New Zealand Status quo “with” MRF&IC
company
Company Income 100 100
Tax Paid 28 28
Australian shareholder
Taxable dividend 72 100
Personal tax @ 45% 32.4 45
Franking credit 0 28
Net personal tax 32.4 17
Net income 39.6 55
Effective tax rate 60.4% 45%
Increase in post-tax dividends 38.9%
Source: New Zealand Inland Revenue
This table implies that under the status quo, company income would have to be around
$140 to generate the equivalent "with" MRF&IC post tax return of $55.
A similar situation exists with New Zealand shareholders investing in Australia (see Table
2). Under MRF&IC the increase in post-tax dividends would be 42.9%.
6
The table assumes that equity investment into New Zealand from Australia is foreign direct
investment from an Australian parent company investing into a New Zealand subsidiary.
NZIER report - The costs & benefits of mutual recognition of imputation & franking credits 3Table 2 Status quo: New Zealand direct investment into Australia Dollars New Zealand shareholder in an Australian Status quo “with” MRF&IC company Company Income 100 100 Tax Paid 30 30 New Zealand shareholder Taxable dividend 70 100 Personal tax @ 33% 23.1 33 Imputation credit 0 30 Net personal tax 23.1 3 Net income 46.9 67 Effective tax rate 53.1% 33% Increase in post-tax dividends 42.9% Source: New Zealand Inland Revenue This table implies that under the status quo, company income would have to be $143 before it generated a return equivalent to the "with" MRF&IC post tax return of $67. The implication of the current taxation system is that an investment opportunity in the destination country has to offer a far higher return than a similar opportunity in the home country to make it of equivalent commercial viability and compensate for the double taxation. This creates a home bias in investment decisions: even though from a pure economic perspective an investment opportunity looks a better bet in the destination economy, the impact of the tax policy determines that it makes sense to forego that opportunity and put money into a potentially less efficient investment domestically. As a result, trans-Tasman resource decisions are distorted: resources are not being allocated to their optimal locations. 3.2 Mutual recognition is like removing a bilateral tariff The development of a MRF&IC framework is analogous – albeit not perfectly – to a reduction in goods tariffs under CER. Tariffs distort trade and reduce economic welfare by raising import prices above the domestic price. This reduces the competitive pressure on domestic producers, leading to inefficient firms remaining in business. This limits the ability of truly competitive domestic firms to access scarce resources. Tariffs also reduce households‘ purchasing power as they pay more for imported goods than they would do under freer trade. The removal of a tariff on a good tends to lead to an improved allocation of resources in the importing country and improved household welfare. It also leads to a drop in tariff revenue, but this cost is more than offset by the efficiency gains across the economy. NZIER report - The costs & benefits of mutual recognition of imputation & franking credits 4
This line of reasoning has been accepted by the vast majority of New Zealanders and
Australians as both countries have been through extensive unilateral, bilateral, regional
and multilateral tariff reductions in recent decades. In the CER negotiations there were
few concerns on either side of the Tasman about the loss in tariff revenue from
liberalisation. Governments were more concerned about the economic opportunities that
CER would create.

Since the current double taxation of dividends on trans-Tasman investment pushes up the
price (return required) of foreign investments relative to domestic investments, the tariff
analogy seems appropriate. It also seems logical then to expect that removing double
taxation is likely to improve trans-Tasman welfare by allowing trans-Tasman investment
to flow to where it can be put to its best economic use (mainly an allocative efficiency
gain).

These gains, in turn, enhance the potential for higher growth in output and incomes. It is
these benefits from MRF&IC that need to be traded off against any short term loss in tax
revenue on trans-Tasman dividend flows.7

Following the trade policy analogy the introduction of bilateral MRF&IC can be thought of
as being ‘investment-creating‘ within CER (Viner 1950). Flows of investment are likely to
be redirected to more efficient uses due to MRF&IC. This improved efficiency is likely to
lead to further new investment and trade flows (see Romer 1994).

MRF&IC may also have ‗investment-diverting‘ effects for third countries. The bilateral
investment tariff preference that mutual recognition offers Australia and New Zealand will
reduce the attractiveness of investments in third countries. This may make third countries
worse off. However, given that we assume – as per the Joint Prime Ministers‘ statement in
section 1 – the aim of the SEM is to improve trans-Tasman welfare over time, not world
welfare, we do not focus on these third country effects in this report.

In short, from a conceptual basis we would expect that – relative to the status quo8 – over
time MRF&IC will result in the trans-Tasman economy being better off.

3.3 So why hasn’t mutual recognition been
introduced?
Trans-Tasman tax systems have evolved relatively independently, although both
imputation systems were introduced in the late 1980s. However, it was not until the
success of CER became apparent that efforts were made to negotiate a MRF&IC
agreement.

The major stumbling block has been the short term loss of tax revenue by both
governments. However, from an economywide perspective the short term loss in tax
revenue is not a cost but a transfer to households that will generate more tax since funds
are likely to be re-invested or consumed within the trans-Tasman economy. This is looked
at in more detail in section 5.5.

    7
         The tariff comparison is not completely analogous though. Theory suggests that the unilateral
         removal of a tariff is generally beneficial for the home country, even if other countries maintain their
         tariffs. The unilateral recognition of franking credits, however, is not. It would encourage offshore
         investment displacing domestic investment without any reciprocal benefit. This would tend to lower
         national income.
    8
         It could be argued that implementing mutual recognition might be more effective as part of a wider
         set of trans-Tasman business harmonisation initiatives. While we do not disagree with this view, it is
         outside the scope of this report to look at any of these broader packages.

NZIER report - The costs & benefits of mutual recognition of imputation & franking credits                      5
The issue has remained on the political and business agenda for many years. The recent announcement that both countries‘ governments have tasked their respective Productivity Commissions to carry out a joint study into the impacts of further economic trans-Tasman integration provides an opportunity for MRF&IC to be explored in more detail. 3.4 The distorting and costly impacts of double taxation in practice: two case studies As part of this project pwc provided us with a number of actual examples of the problems Australian and New Zealand firms have with the investment tariff. We have included two of these case studies below (names changed to preserve anonymity) to illustrate these problems. Practical experiences like this do become well known and can rapidly spread around, causing businesses, particularly SMEs, to be very cautious before expanding across the Tasman. NZIER report - The costs & benefits of mutual recognition of imputation & franking credits 6
Case study 1 – NZ manufacturer wanting to expand in Australia
Facts
NZ manufacturer (NZ Co) is a midsized company (total assets circa NZ$200m) with a substantial share of the NZ market.
NZ Co identifies an opportunity to acquire a competitor company based in Australia (Aus Co). Purchase price NZ$100m.
Preferred structure
NZ Co to fund the acquisition using $20m in retained earnings and $80m in debt from its NZ bankers
acquire 100% of the shares in Australian Co.
Problems with preferred structure
no NZ tax relief for tax paid in Australia on Aus Co‘s profits
as a result, although dividends from Aus Co to NZ Co are tax exempt, when NZ Co pays these dividends to its
NZ shareholders double tax arises
aggregate tax rate on Aus Co profits is 53.1% compared with 33% on NZ profits
tax paid return from a corporate NZ investment is 42.9% higher.
Potential solutions
establish Australian Limited Partner (ALP) to purchase Aus Co‘s assets
wind-up Aus Co
ALP to be owned directly by NZ Co‘s shareholders so that tax paid in Australia can be offset against NZ Co‘s
shareholders NZ tax liability.
Problems with proposed solutions
after expending substantial sums (total in excess of $200k) in investigating the Australian and New Zealand
legal and tax implications of the proposed structure the following problems are identified:
the ALP structure is not suitable for trading in multiple states in Australia
a solution would be to limit trading to a single state but this negates the commercial objective of the
acquisition
the proposed structure involves shareholders owning assets directly in Australia as well as owning their
shares in NZ Co. Because management of the operation needs to be combined, the legal structure is
inconsistent with the necessary management structure. Significant administration costs will arise as a
result
ALPs are not widely accepted or used by Australian businesses, so NZ Co is counselled that they will be
less attractive in the market than competitors using conventional structures
Australian stamp duty and other costs in winding up Aus Co are substantial.
Ultimate structure adopted
NZ Co establishes new Australian holding company (Aus Co Hold) to purchase Aus Co
Aus Co Hold borrows the maximum amount in respect of which interest is able to be deducted under the
Australian thin capitalisation rules and debt funds the acquisition
balance is subscribed in equity from NZ Co
significant additional funding costs are incurred due to Aus Co Hold having to borrow through Australian
facilities leaving existing NZ facilities undrawn
some of Aus Co‘s functions are transferred to NZ Co to enable adjustments to be made to transfer pricing of
stock to maximise profits in NZ and minimise profits in Australia. The overall cost of conducting these
operations in NZ is higher than previously because it results in duplication of some facilities and functions.
In addition, NZ Co loses some key staff who are unwilling to relocate to New Zealand. NZ Co management
are also worried about having key management at a distance from their major growth market (Australia).
However, the tax advantage of avoiding double tax outweighs the commercial inefficiency from
duplication of operations and loss of experienced management.
NZIER report - The costs & benefits of mutual recognition of imputation & franking credits 7Case study 2 – Tax trips up existing trans-Tasman operation
Facts
Aus Co is a midsized (total assets $500m) entity involved in the supply of heavy equipment. A number of Aus Co‘s
Australian customers have NZ operations. Aus Co starts exporting equipment directly to these operations. Sales to NZ
increase rapidly, and as a result Aus Co has a number of Australian based executives travelling across the Tasman to
meet customers, enter into preliminary negotiations on contracts and have follow up service and maintenance meetings.
The operations continue on this basis for 4 years.
No NZ tax has been paid because Aus Co is thought to have no NZ tax presence. Tax is paid in Australia on Aus Co‘s
profits, including those arising from sales in NZ.
Problem
NZ‘s Inland Revenue Department investigates Aus Co and concludes that it maintains a ‗permanent establishment‘ in New
Zealand as a consequence of the extent of its presence. In particular, Inland Revenue notes that some of the executives
have been concluding contracts in NZ, and have been operating out of an office maintained by one of Aus Co‘s major
customers. Inland Revenue assesses Aus Co for NZ tax on profits for the last 4 years.
The implications of the above are:
significant NZ tax payable. Although this is able to be claimed by Aus Co as a credit against its Australian tax,
because the NZ tax is not able to be used to frank dividends the reduction in Australian tax payable by Aus Co
means that it has overdrawn its franking account
as a result Aus Co is exposed to a retrospective tax bill of several million dollars
the costs of the investigation, analysis of technical issues and attempts to persuade Inland Revenue to
withdraw its position amount to $500k.
Solution
Aus Co concludes that it cannot justify operating in New Zealand if it is to suffer double tax resulting in a 28% reduction
in return. It withdraws from the New Zealand market.
NZIER report - The costs & benefits of mutual recognition of imputation & franking credits 84. Proposed changes
4.1 Mutual recognition
The most recent review of Australia‘s tax system stated that the dividend imputation
system should be kept in the short- to medium-term.9 It also suggested that if an
imputation system were to be kept, the favoured approach for further investment
integration with New Zealand is through MRF&IC. The impact of such a system is set out
in Table 1 for an Australian investor in New Zealand on the top marginal tax rate (45%).
Put simply, a franking (in Australia) or imputation (in New Zealand) credit is a way of
providing credits against tax on dividends received by domestic shareholders for tax paid
at the company level.
While it is beyond the scope of this report to examine how a MRF&IC scheme would be
implemented, a simple approach would be for New Zealand to treat franking credits as
imputation credits and Australia to accept imputation credits as franking credits.
4.2 Alternatives
Other methods could also address some of the issues associated with double taxing of
dividends.10
4.2.1 Streaming
Streaming of credits has been suggested as a way around double taxation of investor
dividends. This would allow firms to stream income from domestic investments with
imputation/franking credits to New Zealand/Australian shareholders who can make use of
the imputation/franking credits and income from foreign investments with no
imputation/franking credits to foreign shareholders.
The basis of an imputation system is to ensure that domestic tax is collected on income of
non-residents sourced from New Zealand and also the worldwide income of residents.
Streaming would undermine both these imputation design features. However, we would
expect that the impact would vary widely depending on the circumstances of the firms
involved. It is also worth noting that the Henry Review firmly rejected dividend streaming
as long as the imputation system is retained.
4.2.2 Unilateral recognition of imputation/franking credits
Unilateral recognition at face value seems like a logical approach to the imputation
problem. This would work by Australia and New Zealand allowing imputation tax credits
on dividends from all domestic and foreign sources of investment.
9
Australia‘s Future Tax System (2010) – known from here on as the Henry Review.
http://www.taxreview.treasury.gov.au/Content/Content.aspx?doc=html/home.htm
―Dividend imputation continues to provide benefits such as neutrality around financing and entity
choices. It also enhances the integrity of the tax system by reducing the benefits of minimising
company income tax. These benefits mean that dividend imputation should be maintained in the
short to medium term‖ (p.42)
10
Our analysis focuses solely on addressing the problem of double taxation of dividends. We
acknowledge that there is a suite of alternative policy settings that could be envisaged under the
broad heading of ‗business harmonisation‘.
NZIER report - The costs & benefits of mutual recognition of imputation & franking credits 9Such a system would encourage trans-Tasman investment efficiency, and if imputation
systems were adopted around the world it would lead to improved global investment
efficiency. The problem is that imputation systems are used in very few jurisdictions so
while Australia and New Zealand would be providing imputation/franking credits for
foreign taxes, there would be no corresponding imputation credits provided by foreign
governments to citizens who are investing in Australia and New Zealand. To take
advantage of the scheme, third countries would have to develop imputation credit
schemes. This is unlikely for a number of political and legal reasons.11
In the absence of other countries providing reciprocal benefits, allowing imputation credits
for foreign taxes is unlikely to be in either New Zealand‘s or Australia‘s national interest.
It would encourage firms to invest in ways which maximise pre-tax incomes and to be
indifferent between paying income at home or abroad. Since taxes paid at home are part
of national income whereas taxes paid abroad are not, this could lead to negative
domestic welfare impacts.
The Henry Review firmly rejected the unilateral approach for practical reasons. Of
particular concern was verifying whether firms had paid tax in a foreign jurisdiction. This
could be difficult given the varying degrees of institutional quality around the world.
4.2.3 Summary
Table 3 shows our summary assessment of the strengths and weaknesses of regulatory
tools that could be used to address the double taxation issue.
Table 3 Summary of approaches
Simplicity Certainty Durable Feasible
Streaming √x X ? X
Unilateral recognition √ X X X
Mutual recognition √ √ √ √
Source: NZIER
All approaches have positive attributes. Streaming credits is relatively straightforward
(although not as straightforward as unilateral and MRF&IC). But it creates uncertainty
because it undermines the principles of a company tax imputation system. Therefore, it is
not feasible and because of this there is a question mark over its durability.
Unilateral recognition is simple to implement in theory. However, there would be practical
difficulties in ascertaining how much company tax has been paid in many cases.
Moreover, it would mean providing credits for foreign taxes and encouraging offshore
investment without any reciprocal benefit.
This leaves MRF&IC as the most feasible option to address the inefficiencies caused by
the current system (as suggested by the Henry Review). It is relatively simple to
implement, creates certainty (e.g. it eliminates attempts to circumvent double taxation)
and is durable since it is likely to generate additional economic activity.
11
For example, European Court of Justice rulings have led to the abandonment of some countries‘
imputation systems in Europe. The rulings essentially concluded that because only some countries
used the imputation approach rather than a common imputation system being adopted, the free
flow of capital in the EU was being impeded.
NZIER report - The costs & benefits of mutual recognition of imputation & franking credits 105. Costs and benefits of
mutual recognition
5.1 The cost benefit framework
We have used a cost benefit analysis (CBA) framework, incorporating computable general
equilibrium (CGE) modelling, to obtain an estimate of the potential value of MRF&IC.
CBA is a long-established technique intended to identify the economic efficiency of a
proposed project or policy change. Efficiency is broadly about maximising outputs
obtained from available inputs, but there are different variants used in economics. In
particular, we are interested in allocative efficiency which refers to the ease with which
resources can move across the trans-Tasman economy to their most productive use.
If the introduction of a MRF&IC scheme allows the shift of resources to their most
productive use then clearly it will improve allocative efficiency. It may also impact on
dynamic efficiency since better matching of resources may generate new products and
services that would not have otherwise been developed.
A CBA proceeds by comparing effects and outcomes associated with the introduction of
MRF&IC against what would have occurred under a counterfactual without the proposed
change. This counterfactual can be described as a projection of the status quo into the
future.
5.2 Not all impacts can be quantified
This is a ‗partial‘ CBA, recognising that some effects will be too difficult to reliably
quantify. For instance, an important benefit of MRF&IC may well be the ability of New
Zealand and Australian small and medium sized businesses not only to export to each
other‘s market but also through this process learn the skills to export to third markets.
While we can identify these benefits, it is not feasible to value them in economic terms,
given available information, time and resources. For practical reasons the analysis has
concentrated on quantifying effects that are readily quantified and valued, and describing
in a qualitative way the effects that cannot be readily quantified or valued.
5.3 Counterfactual
The counterfactual is the status quo where dividends are double taxed.
This means that:
some barriers to trans-Tasman investment would remain
the SEM would not be a fully functioning single market
additional investment that would potentially go to Australia/New Zealand from
New Zealand/Australia would remain in the domestic market.
NZIER report - The costs & benefits of mutual recognition of imputation & franking credits 11This scenario becomes the baseline from which we measure changes that occur if
Australia and New Zealand were to develop MRF&IC regulations.12 The following sections
set out this preliminary analysis.
5.4 Affected parties
We have identified – based on feedback from various stakeholders and published material
– a number of costs and benefits of a MRF&IC scheme that need to be considered in the
CBA, whether they can be quantified or not. These costs and benefits accrue to four key
groups:
shareholders in Australia/New Zealand investing in New Zealand/Australia
will pay tax only once, freeing up funds for the consumption of other goods
and services
businesses will direct trans-Tasman investment to its most economically
efficient location rather than spending valuable time trying to minimise tax
payments
trans-Tasman governments will see the tax take from trans-Tasman
dividends drop, but could still benefit in the medium term due to increased tax
revenue from a stronger, more efficient economy
third country shareholders and businesses may be slightly disadvantaged
because MRF&IC will favour investors in Australia/New Zealand investing in
New Zealand/Australia rather than third countries.13
5.5 Costs to trans-Tasman economy
5.5.1 Tax forgone
The immediate static fiscal costs are borne by governments as tax forgone on
franked/imputed dividends received in Australia and New Zealand. In Table 4 we use
some generic assumptions to set out an approximate short term fiscal cost from trans-
Tasman MRF&IC.14
Under a central scenario where 50% of dividends are distributed, the short term fiscal
costs are estimated to be NZ$494 million for Australia and NZ$156 million for New
Zealand.15, 16 Proportionally, the tax forgone is higher for New Zealand, although the level
12
Conceptually one could also consider a different ‗factual‘ that aimed to quantify the costs and
benefits of a fully harmonised trans-Tasman business environment, and compare these results to
those for mutual recognition only. However, given the time and resources available, this was not
feasible for this research. In addition, it is difficult to speculate on what full harmonisation might
look like.
13
In keeping with the sentiment of the Joint Prime Ministers‘ statement shown in section 1, our cost
benefit analysis focuses on the impacts on Australia and New Zealand and we do not analyse these
third country investment diversion effects in any great detail.
14
See Appendix A for details of calculations.
15
This distribution proportion is an important determinant of the initial tax impacts. However, there is
little data available to verify with any certainty what a suitable share is for our modelling scenarios.
Based on advice from New Zealand Inland Revenue, we are of the view that 50% seems a
reasonable central assumption, and we conduct sensitivity analysis around this value in the
modelling section.
16
We assume that all distributed dividends go to shareholders living in Australia and New Zealand. To
the extent that some shares are held by non-resident Australian and New Zealand shareholders,
these mutual recognition agreement fiscal costs (and the concomitant benefits) may be somewhat
overstated. However, we have no official data on non-resident shareholders to adjust our estimates
with. Note that the sensitivity analysis around the distribution proportion considers a lower tax
forgone scenario.
NZIER report - The costs & benefits of mutual recognition of imputation & franking credits 12is larger for Australia. The combined drop in trans-Tasman tax revenue under our central
scenario would be 0.15% of the total tax take.
Table 4 Short term fiscal costs of mutual recognition
NZ$ millions
Australian tax NZ tax revenue Combined CER tax
revenue revenue
Dividend Loss % of Loss % of Loss % of
distribution total total total
assumption
100% 988 0.26% 312 0.61% 1300 0.30%
75% 741 0.20% 234 0.45% 975 0.23%
50% 494 0.13% 156 0.30% 650 0.15%
25% 247 0.07% 78 0.15% 325 0.08%
Source: CIE, NZIER, Statistics New Zealand, ABS
5.5.2 Implications for cost benefit analysis
From a cost benefit analysis perspective, the figures estimated in Table 4 are not costs in
the true sense but transfers from government to those who receive dividends. The value
of the tax forgone isn‘t lost to the economy – it is just recycled in a more direct way.
Rather than the government buying goods and services on behalf of households and firms
(i.e. through government expenditure), shareholders spend the money themselves.
By itself, this transfer might be expected to improve national welfare, because the
deadweight losses associated with tax collection are reduced. And this is before taking
into account the dynamic efficiency benefits discussed below.
However, the question then becomes what the government decides to do to address the
drop in tax receipts. It has four broad options:
1. Raise taxes from elsewhere in the economy to maintain a constant tax revenue
and government spending profile
2. Reduce government spending
3. If it is in deficit, borrow to maintain government spending without raising taxes
4. If it is in surplus, reduce the level of that surplus.
Each of these options has different costs.
In our modelling scenarios, we assume that the first option above is followed. This is a
standard ‗closure‘ assumption in CGE modelling. Each government maintains government
spending as a share of GDP and replaces the investment dividend tax forgone from other
taxation sources. If – as expected – the economy grows from the implementation of
MRI&FC, tax revenue also grows to ensure that government spending holds steady as a
share of GDP.
This assumption reflects the current tight fiscal environment, with both governments
committed to returning to budget surplus as soon as possible. When both governments
NZIER report - The costs & benefits of mutual recognition of imputation & franking credits 13are running surpluses, they will have greater policy space to consider alternative tax and spending options. 5.6 Benefits to trans-Tasman economy 5.6.1 Improved bilateral efficiency of investment Currently investment by Australian/New Zealand firms in New Zealand/Australia requires a higher pre-tax rate of return than similar domestic investments to overcome the double taxation problem. This suggests investment inefficiency. By removing this bias MRF&IC is likely to boost productivity and competitiveness on both sides of the Tasman. 5.6.2 Improved product market efficiency With improved investment allocative efficiency we would expect further product market efficiency. The importance of the linkage between investment efficiency and product market efficiency should not be underestimated (Scrinivasan 2006). Selling products or services in an export market normally requires substantial investment in marketing infrastructure. The current situation stifles the entry of competitors and constrains innovation. MRF&IC will remove a home market investment bias for tax reasons and potentially drive further innovation that will in turn promote productivity and further growth. In particular, we are likely to see more exporting from both countries – in the short run to each other‘s market, but longer term there is a potential for additional third market exporting. 5.6.3 Reduced compliance and administrative costs Complying with the current double taxation system imposes compliance costs on businesses and administrative costs on government. The status quo encourages small and medium sized businesses to set their business up in a way that may be tax efficient but not necessarily economically efficient. As the case studies in section 3.4 demonstrate, there are examples of Australian and New Zealand businesses developing complex structures, increasing their debt to equity ratios and developing other unusual schemes to avoid the existing double taxation regime. Setting up these schemes involves scarce management time that would be better directed towards more productive activities. Such schemes also attract attention from tax authorities (and thus soaks up government resources) on both sides of the Tasman. A MRF&IC scheme will help to avoid these issues. 5.6.4 Removing profit streaming devices The status quo encourages firms to locate their most profitable business units in the domestic market i.e. to shift profitable functions of the firms to where they are taxed the least. The status quo also incentivises firms to pay most of their tax in the country where the final shareholders of that company reside. Therefore a New Zealand/Australian subsidiary of an Australian/New Zealand parent company is encouraged to stream its profits to Australia/New Zealand. These activities are engaged in solely for tax reasons and maintaining them represents a deadweight loss to both economies. NZIER report - The costs & benefits of mutual recognition of imputation & franking credits 14
5.6.5 Enhanced stability and effectiveness of tax system
Australian and New Zealand tax systems are characterised by high tax collection rates.
MRF&IC will reinforce this position by removing attempts by firms to avoid the investment
tariff (examples of which are set out in sections 3.4 and 5.6.4).

5.6.6 Logical progression of SEM and demonstration
benefits
After the success of CER, the attention of trans-Tasman regulators has moved to behind
the border barriers to trade. While there are number of issues on the table, the existing
tariff barrier on investment flows is a key obstacle to the SEM.17

MRF&IC therefore is a logical extension of a single market. If there are no barriers to
investment flows between Perth and Brisbane or between the North and South Island in
New Zealand then it makes economic sense for trans-Tasman investors in a single trans-
Tasman market to operate with a similar tax credit system.

A strong SEM not only allows for a strong base for trans-Tasman exporters but also sets a
blueprint for further integration in the Asian region. It demonstrates to Asian nations that
deeper integration is possible and can be replicated at relatively low cost.

5.7 What we quantify
We cannot put monetary values on all of the costs and benefits discussed above. Table 5
summarises what we do and don‘t quantify in our modelling work.

Table 5 Which impacts are quantified?

 Cost/benefit                                              Quantified?

 Costs
 Short term fiscal costs                                   Yes

 Benefits
 Bilateral investment efficiency                           Yes
 Product market efficiency                                 No
 Reduced compliance and admin costs                        No
 Removal of streaming                                      No
 Tax system effectiveness and stability                    No
 SEM progression and demonstration                         No

Source: NZIER

The benefits in the bottom five rows of the table can be seen as forms of dynamic
productivity gains from greater economic integration. These dynamic gains stem from the
greater competition and innovation that can be attributed to firms operating in a more

    17
         See page 7 of the Australian and New Zealand Productivity Commissions‘ Joint Study Issues Paper
         (2012) for a list of outstanding issues.

NZIER report - The costs & benefits of mutual recognition of imputation & franking credits             15
open trading environment, and are in addition to the standard allocative efficiency gains
that result from improved resource allocation between countries and industries.
It seems reasonable to think that MRF&IC might lead to some degree of dynamic
productivity gains to New Zealand (in particular) and Australian firms. However, given the
similarity between the business environments of the two economies and the high degree
of integration already present, it is difficult to estimate how large such gains might be in
the case of MRF&IC.
Therefore we take a conservative approach and do not incorporate these dynamic gains18,
but note that they would occur in addition to the modelling results reported in sections 7
and 8. That is, the net benefits we present from MRF&IC in this report are likely to be
under-stated.
18
A point on nomenclature: the CIE-GCubed model is ‗dynamic‘ in that it looks at how the economy
changes over time and incorporates forward-looking investment expectations. However we have
chosen not to explicitly build into the scenarios ‗dynamic productivity gains‘ from investment
liberalisation.
NZIER report - The costs & benefits of mutual recognition of imputation & franking credits 16You can also read