Learning-based Practical Smartphone Eavesdropping with Built-in Accelerometer
←
→
Page content transcription
If your browser does not render page correctly, please read the page content below
Learning-based Practical Smartphone Eavesdropping
           with Built-in Accelerometer

           Zhongjie Ba∗†§ , Tianhang Zheng‡§ , Xinyu Zhang∗ , Zhan Qin∗ , Baochun Li‡ , Xue Liu† and Kui Ren∗
                                          ∗ School
                                                 of Cyber Science and Technology, Zhejiang University
                                   Email: xinyuzhang53@zju.edu.cn, qinzhan@zju.edu.cn, kuiren@zju.edu.cn
                                               † School of Computer Science, McGill University

                                              Email: zhongjie.ba@mcgill.ca, xueliu@cs.mcgill.ca
                                  ‡ Department of Electrical and Computer Engineering, University of Toronto

                                             Email:th.zheng@mail.utoronto.ca, bli@ece.toronto.edu

    Abstract—Motion sensors on current smartphones have been             usage is the highest by default in most operating systems [2].
exploited for audio eavesdropping due to their sensitivity to            A significant amount of research in the literature focused on
vibrations. However, this threat is considered low-risk because of       how to eavesdrop on a user’s phone call by exploiting the
two widely acknowledged limitations: First, unlike microphones,          vulnerability of communication protocols, or by implanting a
motion sensors can only pick up speech signals traveling through         backdoor to access the permission of utilizing a microphone.
a solid medium. Thus, the only feasible setup reported previously
is to use a smartphone gyroscope to eavesdrop on a loudspeaker
placed on the same table. The second limitation comes from a                 In this paper, we consider the problem of eavesdropping on
common sense that these sensors can only pick up a narrow                the speaker in a smartphone by side-channel attacks without
band (85-100Hz) of speech signals due to a sampling ceiling of           the requirement of sensitive system permissions. Instead of
200Hz. In this paper, we revisit the threat of motion sensors            hacking into the operating system and gaining access to the ad-
to speech privacy and propose AccelEve, a new side-channel               ministrator authority, we recognize and reconstruct the speech
attack that employs a smartphone’s accelerometer to eavesdrop            signals emitted by a smartphone’s speaker through analyzing
on the speaker in the same smartphone. Specifically, it utilizes the     the measurements of motion sensors on the same smartphone.
accelerometer measurements to recognize the speech emitted by
                                                                         This attack could arise due to the following reasons. First,
the speaker and to reconstruct the corresponding audio signals. In
contrast to previous works, our setup allows the speech signals to       because the acceleroemeter and gyroscope are considered low-
always produce strong responses in accelerometer measurements            risk, they are usually set to be zero-permission sensors and
through the shared motherboard, which successfully addresses             can be accessed without warning smartphone users. Second,
the first limitation and allows this kind of attacks to penetrate        motion sensors can response to external vibrations, which
into real-life scenarios. Regarding the sampling rate limitation,        allows them to pick up certain audio signals. Additionally,
contrary to the widely-held belief, we observe up to 500Hz               there is an overlap between the fundamental frequencies of
sampling rates in recent smartphones, which almost covers the            human voice and the sampling frequencies of smartphone
entire fundamental frequency band (85-255Hz) of adult speech.            sensors. Therefore, it is theoretically possible to capture speech
On top of these pivotal observations, we propose a novel deep            signals by zero-permission motion sensors.
learning based system that learns to recognize and reconstruct
speech information from the spectrogram representation of ac-
celeration signals. This system employs adaptive optimization on             In the literature, motion sensor based speech recognition
deep neural networks with skip connections using robust and gen-         has attracted a number of studies. Michalevsky et al. [32]
eralizable losses to achieve robust recognition and reconstruction       is the first work towards this direction, which utilizes a
performance. Extensive evaluations demonstrate the effectiveness         smartphone’s gyroscope to pick up surface vibrations incurred
and high accuracy of our attack under various settings.                  by an independent loudspeaker placed on the same table.
                                                                         The captured vibrations are then analyzed to recognize the
                            I.   I NTRODUCTION                           speech information played by the loudspeaker. The proposed
                                                                         method suffers from its feasibility and the poor performance
    Smartphones have permeated into our daily lives as an                on recognition accuracy, i.e., the accuracy is only 26% in
indispensable communication interface to the rest of the world.          differentiating single digit pronunciations. Another line of
Among all different modalities of communication, voice com-              research focuses on exploiting the air as the medium rather
munication is always considered as one of the top choices. Due           than a solid surface. Zhang et al. [44] use the accelerometer
to its importance, the system permission level of microphone             as a “microphone” to detect the voice input of the smartphone.
  § The                                                                  Recently, Anand et al. [5] (S&P 2018) study the problem of
          first two authors contribute equally to the paper.
                                                                         detecting speech signals through either solid surfaces (such as
                                                                         desks) or air. Their experimental results show that among all
                                                                         tested audio sources and medium, only the loudspeaker placed
Network and Distributed Systems Security (NDSS) Symposium 2020           on the desk has sufficient power and sound path for generating
23-26 February 2020, San Diego, CA, USA
ISBN 1-891562-61-4                                                       and transmitting vibrations to motion sensors. Based on this
https://dx.doi.org/10.14722/ndss.2020.24076                              observation, [5] claims that the threat under investigation will
www.ndss-symposium.org                                                   not go beyond the loudspeaker setup studied in [32].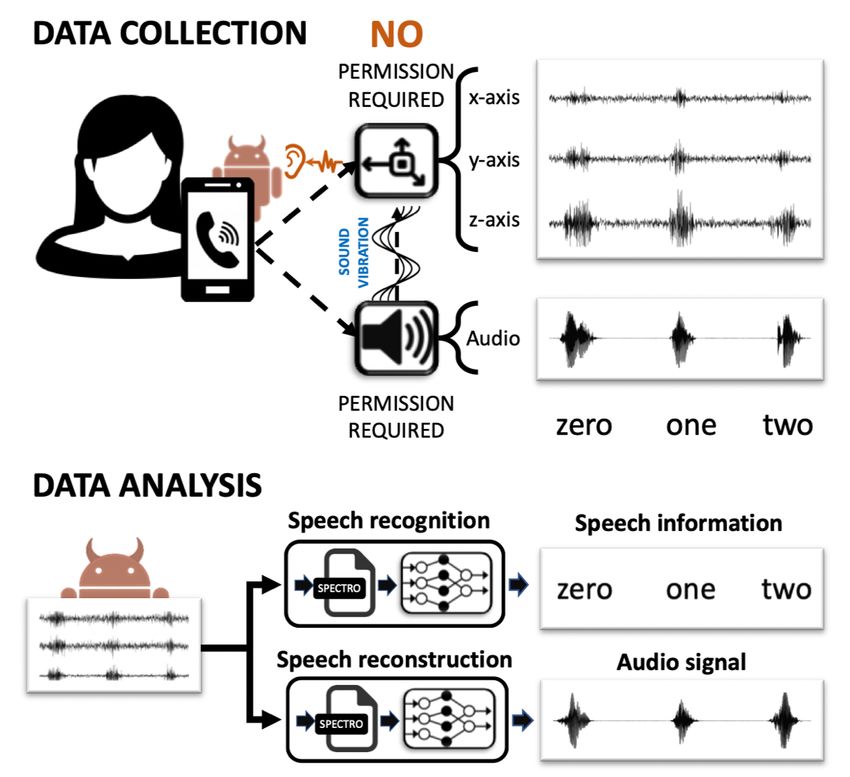
collects accelerometer measurements in the background and
                                                                               utilizes the collected signals to recognize and reconstruct the
                                                                               played speech signals. It is worth noting that the spy app could
                                                                               be disguised as any kind of mobile apps since accessing the
                                                                               accelerometer does not require any permission.
                                                                                   The main intent of the proposed system is to recognize
                                                                               and reconstruct the speech signals from the accelerometer
                                                                               measurements. Since raw acceleration signals usually cap-
                                                                               ture multiple “words” and could be severely distorted by
                                                                               human movement, our system first implements a preprocessing
                                                                               module to automatically eliminate significant distortions from
                                                                               acceleration signals and to cut long signals into single word
                                                                               segments. We then convert each single word acceleration signal
                                                                               to its spectrogram representation and pass it to a recognition
                                                                               module and a reconstruction module for further analysis.
                                                                                   The recognition module adopts the DenseNet [24] as the
                                                                               base network to recognize the speech information (text) carried
                                                                               by the spectrogram of the acceleration signal. Extensive eval-
                                                                               uations demonstrate that our recognition module achieves new
Fig. 1. Accelerometer-based smartphone eavesdropping and the workflow of       state-of-the-art results under different settings. In particular,
speech recognition and speech reconstruction.                                  our recognition module has 78% accuracy on recognizing 10
                                                                               digits and 70% accuracy on identifying 20 speakers when the
                                                                               smartphone is placed on a table, while the previous SOTA
    However, all of the above works failed to cover the most                   results are 26% accuracy in the digit task and 50% accuracy
adverse setup, where the motion sensors are utilized as a side-                on recognizing only 10 speakers. Also, evaluations under
channel to capture the speech signals played by the speaker                    different noisy ambient conditions demonstrate the robustness
on the same smartphone. In this case, the motion sensors and                   of our recognition model. Except for digits and letters, we also
the speaker are in physical contact with the same board and                    demonstrate that our recognition and reconstruction models
locate in very close proximity to each other. Hence, contrary                  can be used to identify hot (sensitive) words in phone calls.
to the claim in [5], speech signals emitted by the speaker will                With the help of our speaker-identification model, the adver-
always have a significant impact on the motion sensors like the                sary might acquire multiple pieces of sensitive information for
gyroscope and the accelerometer, no matter where and how the                   the callers’ contacts by linking the hot words identified across
smartphone is placed (on a table or in your hand).                             multiple phone calls to a specific caller. Furthermore, we also
                                                                               realize an end-to-end attack based on our recognition model
    Furthermore, all previous works in the literature share                    in real-world conversations.
a misleading common sense that the sampling rates of the
                                                                                   In the reconstruction module, we implement a reconstruc-
accelerometer and gyroscope in Android-powered smartphones
                                                                               tion network that learns the mapping between the accelerom-
cannot exceed 200Hz [32], [44], [5]. Because the typical
                                                                               eter measurements and the audio signal played by the smart-
fundamental frequency for adult speech lies in the range 85-
                                                                               phone speaker. Because most of the speech information in the
255Hz [38], [7], the previously believed sampling ceiling
                                                                               high frequency band are the harmonics of the fundamental fre-
leads to a consensus that motion sensors can only capture
                                                                               quency, the reconstruction module can convert an acceleration
a very small range of human speech in 85-100Hz. However,
                                                                               signal into an audio (speech) signal with enhanced sampling
we show that this is not the case. According to the official
                                                                               rates (1500Hz). According to our experimental results, the
documents for Android [2], an Android application selecting
                                                                               reconstruction module was able to recover nearly all the vowel
the SENSOR_DELAY_FASTEST mode will receive sensor
                                                                               information, including the fundamental frequency components
measurements as fast as possible. Thus the actual sampling
                                                                               in the low frequency band and its harmonics in the high-
rates of motion sensors are determined by the performance of
                                                                               frequency band. The unvoiced consonants are not recovered
the smartphone, which has been confirmed by our experiments.
                                                                               because these components have no information distributed in
In particular, for certain smartphones released in 2018, we
                                                                               the frequency band below 2000Hz.
observe a sampling frequency of up to 500Hz, which indicates
that the accelerometer is able to capture speech information in                   Our contributions are summarized as follows:
the range of 85-250Hz. It covers almost the entire fundamental
frequency band (85-255Hz) of adult speech.                                        1)    We propose AccelEve, an accelerometer-based side
                                                                                        channel attack against smartphone speakers. Contrary
   In this paper, we address the limitations of previous works                          to the previous belief, the proposed setup infiltrates
by presenting a novel and practical setup and a deep learn-                             this kind of attacks into common scenarios in daily
ing based system for speech recognition and reconstruction,                             life, e.g., answering a phone call or receiving voice
which outperforms all similar related works. In our setup,                              messages. Comprehensive experiments are conducted
the adversary is a spy app whose objective is to eavesdrop                              to evaluate the feasibility of the setup.
on the speaker in the same smartphone. When the speaker                           2)    We first report an important observation that ac-
emits speech signals (e.g., during a phone call), the spy app                           celerometers on recent smartphones almost cover the

                                                                           2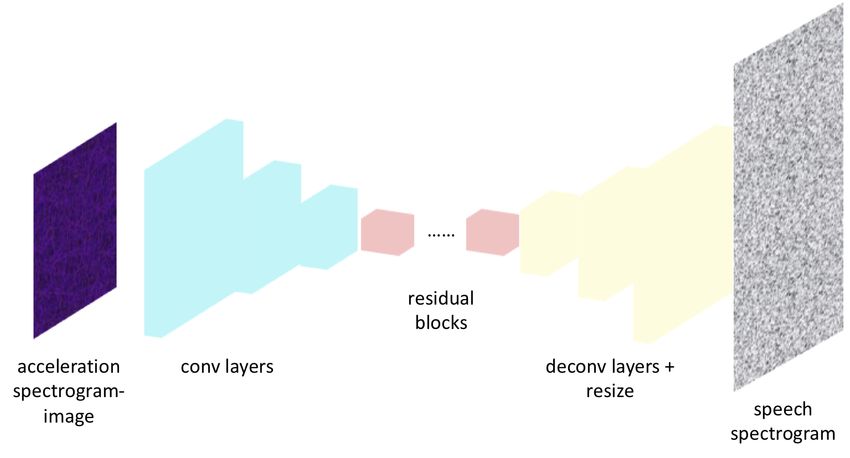
entire fundamental frequency band of adult speech.
    3)    We design a deep learning-based system to recog-
          nize and reconstruct speech signals only from ac-
          celerometer measurements. Extensive evaluations on
          the existing and our datasets show that the system
          significantly and consistently outperforms existing so-
          lutions1 . To the best of our knowledge, the proposed
          system gives the first trail on accelerometer-based
          speech reconstruction.
                                                                                                         (a) Accelerometer structure
          II.   BACKGROUND AND R ELATED W ORK
   In this section, we first describe the design of the motion
sensors on current smartphones. We then review the existing
works that exploit motion sensors to capture speech signals
and other topics related to AccelEve.

A. MEMS Motion Sensors
    Modern smartphones typically come equipped with a three-
axis accelerometer and a three-axis gyroscope. These sensors
are highly sensitive to the motion of the device and have been
widely applied to sense orientation, vibration, shock, etc.                                                (b) Gyroscope structure
    Accelerometer: a three-axis accelerometer is a device that
                                                                                Fig. 2.   Sketches of an accelerometer and gyroscope.
captures the acceleration of its body along three sensing axes.
Each axis is normally handled by a sensing unit consisting of                     TABLE I.       S AMPLING FREQUENCIES SUPPORTED BY A NDROID [2].
a movable seismic mass, several fixed electrodes, and several
spring legs, as shown in Fig.2(a). When the accelerometer                                  Delay Options                Delay     Sampling Rate
                                                                                           SENSOR_DELAY_NORMAL         200 ms           5 Hz
experiences an acceleration along a sensing axis, the corre-                               SENSOR_DELAY_UI             20 ms           50 Hz
sponding seismic mass shifts to the opposite direction and                                 SENSOR_DELAY_GAME           60 ms          16.7 Hz
creates a change in the capacitance between the electrodes.                                SENSOR_DELAY_FASTEST         0 ms     As fast as possible
This change yields an analog signal that is then mapped to
acceleration measurements.                                                      B. Speech Recognition via Motion Sensors
    Gyroscope: gyroscopes on smartphones normally leverage                          Human speech signals have a fundamental frequency that
the Coriolis force [1] to measure the angular rate around three                 carries important linguistic and non-linguistic information such
axes. As shown in Fig.2(b), the sensing unit for each axis has                  as naturalness, emotion, and speaker idiosyncrasy [18]. It is
a similar structure to the accelerometer’s, except that the mass                defined as the vibration rate of the vocal folds and varies
is constantly vibrating and is allowed to move along two axes.                  widely depending on age, gender, individual physiological dis-
When the gyroscope experiences an external angular rate, due                    positions, etc [13], [19]. Typically, the fundamental frequencies
to the Coriolis effect, the mass tends to continue vibrating in                 for an adult male and adult female lie in the range 85-180Hz
the same plane and exerts a Coriolis force perpendicular to the                 and 165-255Hz, respectively. [38], [7]. Because the frequency
rotating axis and the moving direction of the mass. This force                  range of this fundamental frequency partially overlaps with
creates a displacement of the mass and changes the capacitance                  that of smartphone sensors, the accelerometer and gyroscope
between the electrodes. Through measuring the capacitance                       have been exploited to capture a small portion of the speech
change, the angular rate of the device can be obtained.                         signals in the low frequency band.
    In practice, the information captured by a motion sensor                        Michalevsky et al. [32] (Usenix Security 2014) study the
is determined not only by its sensitivity to the surround-                      setup where a smartphone is placed on the same solid surface
ing environment, but also by the sampling frequency. On                         as a loudspeaker. They employ the smartphone’s gyroscope to
Android-powered smartphones, motion sensors can be ac-                          “pick up” speech signals emitted by the loudspeaker and use
cessed with four delay options as listed in Table I. Each                       the captured information to conduct speech recognition and
option specifies an interval at which sensor measurements are                   speaker identification. In this scenario, the signals captured
sent to the application. In particular, if an application selects               by the gyroscope are actually surface vibrations. Because the
SENSOR_DELAY_FASTEST, sensor measurements will be                               gyroscope shows low sensitivity to surface vibrations and
sent to that application as fast as possible and the actual                     suffers from limited sampling rate (200Hz), it is difficult to
sampling rate will be mainly determined by the performance                      achieve high success rates for the recognition tasks.
of the smartphone. In 2014, the actual sampling rate achieved
                                                                                    Zhang et al. [44] study the setup where a user speaks to a
200Hz [32], which allows the motion sensors to accurately
                                                                                smartphone held in her hand or placed on a desk. In this setup,
capture frequency components below 100 Hz, according to the
                                                                                the authors employ the accelerometer to pickup speech signals
Nyquist sampling theorem.
                                                                                traveling through the air and used the obtained accelerometer
   1 Our code and collected datasets are available on https://github.com/       readings to conduct hot words detection (”Okay Google” and
tianzheng4/learning speech from accelerometer.                                  ”Hi Galaxy”). However, the experimental results in [5] suggest

                                                                            3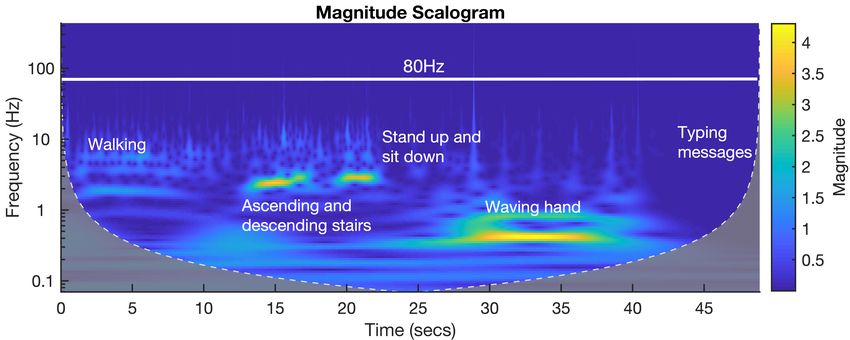
that the speech signals traveling through the air are unlikely        songs played by the smartphone. Son et al. [37] explore
to have any noticeable impact on motion sensors. Therefore,           the possibility of incapacitating a drone through generating
the accelerometer may not be able to collect sufficient speech        a sound noise at the resonant frequencies of the gyroscope
information through airborne vibrations.                              on that drone. Feng et al. [17] propose an accelerometer-
                                                                      based continuous authentication system for voice assistants
    In order to better understand the threat of motion sensors        (e.g., Siri and Google Now). Through cross-checking the voice
to speech privacy, Anand et al. [5] (S&P 2018) systemati-             input with a wireless accelerometer attached to the user’s
cally study the response of accelerometers and gyroscopes to          skin, the system enables the voice assistant to differentiate
speech signals in various settings. They stimulate both sen-          the owner’s command from voice signals that originate from
sors with human-rendered, laptop-rendered and loudspeaker-            others. VibWrite [28] enables fingerprint-input on ubiquitous
rendered speech signals traveling through the air or a solid          surfaces leveraging vibration signals generated by a vibration
surface. Their experimental results show that only loudspeaker-       motor. They show that vibration signals on a solid surface
rendered speech signals traveling through a solid surface can         can be used to extract unique features that reflect the touching
create noticeable impacts on motion sensors. Based on this            location and force of a user’s finger pressing. Another line
observation, Anand et al. [5] claim that the threat under in-         of research has focused on accelerometer-based trajectory
vestigation does not go beyond the Loudspeaker-Same-Surface           recovery and activity recognition. Han et al. [21] demonstrate
setup studied by Michalevsky et al. [32].                             that the accelerometer on a device can be used to determine
    However, all the above works failed to cover the most             the trajectory and location of the device owner if he/she is
adverse setup where the motion sensors are on the same                driving in a vehicle. [27], [30], [35] explore how smartphone
smartphone as the target speaker. In this case, the motion            accelerometers and gyroscopes can be used to detect and
sensors and the speaker will be in physical contact with              identify user activities (e.g., walking, jogging, bicycling etc).
the same board and locate in very close proximity to each
other. Thus here, contrary to the claim in [5], speech signals                       III.   P ROBLEM F ORMULATION
emitted by the speaker will always have a significant impact
on the gyroscope and the accelerometer. It does not matter                In this paper, we consider the novel problem of launching
where and how the smartphone is placed, which could                   a side-channel attack against smartphone speakers: recognize
be on a table (solid surface), on a bed (soft surface),               and reconstruct the speech signals played by the smartphone
or in your hand. Moreover, a smartphone speaker is more               speaker through exploiting the accelerometer on the same
likely to reveal sensitive information than an independent            device. Our attack mainly focuses on the Android system due
loudspeaker. For instance, when a user is making a phone              to its prevalence as the open source mobile operating system
call, an application running in the background can access             (not taking its variants into account). Please note that the
to the zero-permission motion sensors and use the collected           proposed approach may also be extended to attack iOS since
signals to recover sensitive speech information. In this paper,       the maximum sampling rate of the accelerometer in iOS is
we look into this setup and explore accelerometer-based speech        also determined by the maximum frequency supported by the
recognition and reconstruction using deep learning techniques.        hardware. The reason we prefer to use the accelerometer is
                                                                      that it is more sensitive to vibrations than the gyroscope. A
    In parallel and independent work, Anand et al. (arXiv             comparison between the gyroscope and the accelerometer is
2019) [6] also study accelerometer-based speech recognition           shown in Fig. 3.
under the setup that the accelerometer is on the same smart-
phone as the speaker. While Anand et al. employ existing fea-         A. Threat Model
ture selection and classification tools that work well on small
datasets, we implement deep learning-based speech recognition             We assume a victim user with a high-end smartphone.
that achieves higher accuracy. The proposed model is also             The smartphone plays a speech signal that contains private
more robust as we investigate a comprehensive set of factors          information. In this paper, we focus on private information
and address them with effective preprocessing approaches.             made up of numbers, letters, and hot words, such as social
Moreover, we are the first to implement accelerometer-based           security number, a password, a credit card number, etc. The
speech reconstruction and report that accelerometers on recent        smartphone could be on a table or in the user’s hand.
smartphones almost cover the entire fundamental frequency
                                                                          The adversary is a spy app whose objective is to extract
band of adult speech.
                                                                      the private information contained in the speech signal. The spy
                                                                      app continuously collects accelerometer measurements in the
C. Other Topics Related to AccelEve                                   background and tries to extract speech information when the
                                                                      smartphone speaker plays an audio signal (e.g., during a phone
    In the literature, accelerometers and gyroscopes have been        call or voice message). The detection of the playing activity
extensively studied to sense vibrations in various application        can be achieved through checking the high-frequency compo-
scenarios. Marquardt et al. [29] use the accelerometer in a           nents of the collected accelerometer measurements. Although
smartphone to collect and decode vibration signals incurred           the accelerometer can also be affected by daily activities, these
by the keypresses on a nearby keyboard, so as to infer the text       activities rarely affect frequency components above 80Hz (as
entered by the user. Owusu et al. [34], Miluzzo et al. [33],          will be shown in section IV-C).
Xu et al. [42] and Cai et al. [10] show that motion sensors
on a smartphone can be utilized to infer keystrokes on its                For the extraction of the private information, we implement
touch screen. Matovu et al. [31] show that a smartpone’s              accelerometer-based speech recognition and speech recon-
accelerometer measurements can be used to detect and classify         struction. Speech recognition converts acceleration signals to

                                                                  4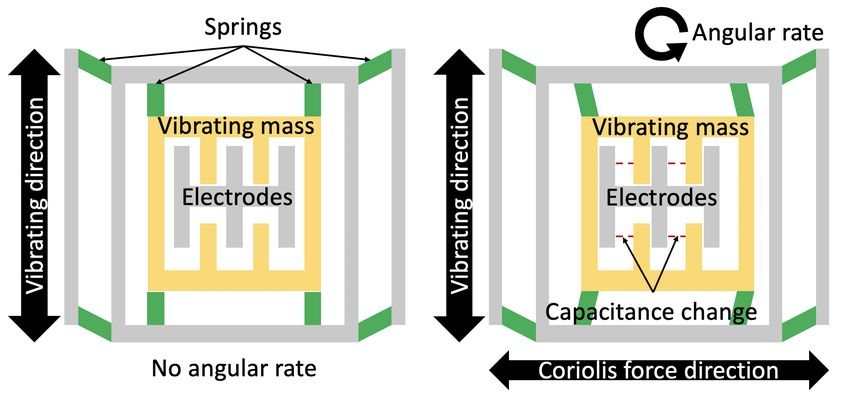
could lead to serious privacy leakage. 2) Location information:
                                                                                   because most navigation apps on current smartphones support
                                                                                   voice guidance, the spy app may track user location through
                                                                                   analyzing the geographical information emitted by the smart-
                                                                                   phone speaker. 3) Music and video preferences: our attacks
                                                                                   can be extended to detect the music or video played by a
                                                                                   smartphone, which could be further analyzed to construct the
                                                                                   user’s listening and watching habits.
                                                                                       The spy app can also eavesdrop on remote callers who
                                                                                   make phone calls or send voice messages to the victim’s
                                                                                   smartphone. For instance, Alice (the victim) makes a phone
                                                                                   call to Bob and request for a credit card number with its
                                                                                   CVV number. Because Bob’s voice will be played by Alice’s
                                                                                   smartphone, the spy app on Alice’s phone will be able to
                                                                                   extract the spoken digits and hot words. In this attack, the
                                                                                   adversary can only eavesdrop on the remote caller since
                                                                                   the voice of the smartphone owner will not be played by
                                                                                   his/her smartphone. Although listening to one side of the
                                                                                   conversation may miss important context information in one
                                                                                   phone call, the adversary can further identify the remote caller
                                                                                   through analyzing the accelerometer measurements (as will be
                                                                                   shown in section VI-B). This allows the adversary to link the
                                                                                   private information extracted across multiple phone calls to a
                                                                                   specific caller. Once the adversary gathers multiple pieces of
                                                                                   information for a specific contact (e.g., social security number,
Fig. 3. The response of a smartphone’s gyroscope and accelerometer to the          credit card number, phone number, password, etc), the privacy
same audio signal. The gyroscope can also response to speech signals emitted       of that contact will be seriously threatened.
by the speaker on the same device. However, the gyroscope exhibit much
lower audio response than the accelerometer.
                                                                                                     IV.   F EASIBILITY S TUDY
text. It allows the adversary to recognize pre-trained numbers,                        As mentioned earlier, our core idea is to exploit the
letters, and hot words from the accelerometer measurements.                        accelerometer on a smartphone as a zero-permission “mi-
Speech reconstruction reconstructs voice signals from accelera-                    crophone” to eavesdrop on the speaker of the same device.
tion signals. It allows the adversary to double-check the recog-                   We now present our experimental validations to demonstrate
nition results with human ears. Because the reconstruction                         the feasibility (severity) of this attack from three aspects:
model mainly learns the mapping between signals rather than                        significance, effectiveness and robustness.
the semantic information, it is more generalizable to untrained
words compared with recognition model.                                                 We note that all the acceleration signals presented in IV-A
                                                                                   and IV-C are preprocessed with the interpolation approach
    The spy app could be disguised as any app running on the                       proposed in section V. We use this approach to resolve
smartphone since accessing the accelerometer does not require                      the problem of unstable sampling interval so that spectrum
any permission. Without loss of generality, in this paper, we                      analysis can be applied. The resulting acceleration signals have
collect accelerometer readings (signals) through a third-party                     a fixed sampling rate of 1000 Hz.
Android application named AccDataRec running in the back-
ground. This application requires zero permission to record                        A. Significance
three-axis accelerometer readings along with a timestamp. Ear
                                                                                       The core intuition behind this attack is that the accelerom-
speakers and headphones are not considered in this paper as
                                                                                   eter and speaker of the same device will always be in physical
they can hardly affect the accelerometer.
                                                                                   contact with the same board and locate in very close proximity
                                                                                   to each other, thereby enabling speech signals to always
B. Attack Scenarios                                                                produce significant responses in accelerometer measurements.
    The side channel attack described in this paper allows an                          In order to validate this hypothesis, we evaluate the re-
adversary to recognize pre-trained hot words emitted (played)                      sponses of a smartphone’s accelerometer to its loudspeaker
by a smartphone through analyzing its accelerometer mea-                           at different volume levels. Specifically, we generate a single
surements. This attack will affect not only the owner of the                       tone signal at 200 Hz and play it on a Samsung S8 at 20%,
smartphone but also his/her contacts.                                              40%, 60%, 80%, and 100% of the highest volume supported
                                                                                   by the smartphone. For each setting, we place the smartphone
    For the smartphone owner, the spy app on the smartphone
                                                                                   on a table and play the speech signals for one second. The
may steal the following information: 1) Voice memo: the spy
                                                                                   accelerometer readings are collected simultaneously through
app can catch pre-trained key words when a user listens to
                                                                                   the AccDataRec APP running in the background.
his/her voice memos. Because the voice memo is usually
used to record important private information (e.g., passwords,                        After recording the acceleration signals, we calculate the
phone number, and postcode), exposure of certain key words                         continuous wavelet transform for each axis and generate the

                                                                               5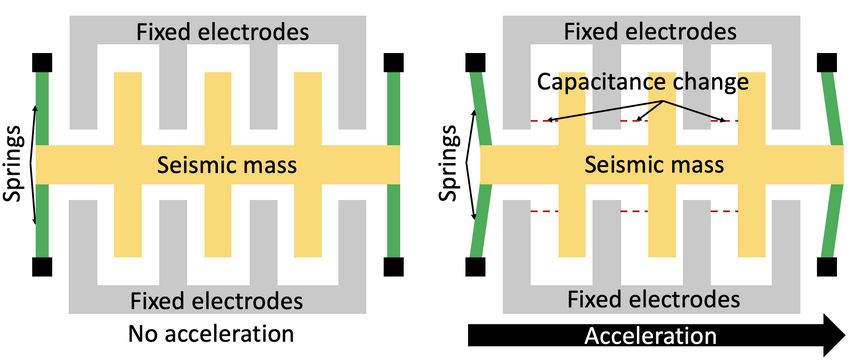
(a) Scalogram: x-axis                               (b) Scalogram: y-axis                               (c) Scalogram: z-axis

Fig. 4. The response of a smartphone accelerometer to a 200 Hz single tone signal played by its loudspeaker at different volume levels. The acceleration signals
obtained at different volume are concatenated for better display and comparison. Please note that the range of magnitudes is different for different scalograms.

                                                                                      TABLE II.       T HE AUDIO RESPONSE OF EACH SETTING IN F IG . 4.
corresponding scalograms, which show how the magnitude
of frequency components changes over time. The obtained                             Volume                   20%       40%       60%         80%       100%
                                                                                    ARdB of the x-axis      1.0593    1.1715    4.2761      4.1370     5.2496
scalograms are depicted in Fig. 4, where a brighter region                          ARdB of the y-axis      0.5710    2.0818    7.1051      8.8069     9.5171
in the scalogram indicates stronger frequency components.                           ARdB of the z-axis     14.8148   18.6134    23.0665    25.6657    27.1832
It can be observed that, starting from the volume level at
20% of the highest volume, the regions around 200 Hz
are becoming brighter (especially for the z axis), indicating                      by the smartphone speaker will always transmit through the
that the accelerometer successfully captures the voice signals                     motherboard of the smartphone and “hit” the smartphone
emitted by the loudspeaker.                                                        accelerometer from the same direction, the accelerometer will
                                                                                   always have the most significant audio response along the same
    To facilitate quantitative comparison between the ac-                          axis. This consistency is important as it helps determine the
celerometer’s response under different settings, we further                        portion of the speech information captured from each sensing
quantify the accelerometer’s audio response as:                                    axis. In this paper, we refer to the axis with strongest response
                                             P (S)                                 as the dominant axis of the smartphone.
                      ARdB = 10log10 (              ),
                                             P (N )
                                                                                   B. Effectiveness
where P is the summed squared magnitude, S and N are two
acceleration signals recorded with and without the presence of                         In the previous literature, it is a common sense that,
speech signals (played by the speaker). This ARdB is similar                       the sampling rates of the accelerometer and gyroscope in
to the definition of signal to noise ratio (SNR) except that the                   Android-powered smartphones cannot exceed 200 Hz [32],
signal (S) here is a mixture of the captured speech signal and                     [44], [5]. Since the typical fundamental frequency for an adult
noise. In the ideal case where the noise signal remains constant                   male and adult female respectively lie in the range 85-180Hz
overtime, an audio response ARdB higher than zero indicates                        and 165-255Hz [38], [7], this common sense implies that
that the speech signal under investigation has affected the                        the sensors can only pickup a very small range of human
accelerometer. However, due to the changing nature of noise,                       speech in the 85-100 Hz frequency band (according to Nyquist
the ARdB calculated from pure noise signals (without any                           Theorem) and thus the effectiveness of the attack is limited.
audio information) could also fluctuate within a small range                       However, as stated in section II-A, if an Android application
around zero. Through studying the pure noise signals from                          selects SENSOR_DELAY_FASTEST, the official documents
several smartphone accelerometers, we observe that a threshold                     [2] claim that sensor measurements will be sent to the
of three can effectively determine if the accelerometer has been                   application as fast as possible. In this context, we hypothesize
significantly affected by speech signals.                                          that this fastest sampling rate for the recent smartphone
                                                                                   models may surpass 200Hz.
    Table II lists the audio response calculated from each
specific setting. It can be observed that the accelerometer’s                          To verify the above hypothesis, we test eight smartphones
audio response varies significantly with axis and increases                        released in different years and list the actual sampling rates of
with higher volume. The sensing units along the x-axis, y-                         the accelerometers in table III. The results confirm that the
axis, and z-axis are able to capture speech signals above                          actual sampling rate of the accelerometer increases rapidly
60%, 60% and 20% volume level respectively. One important                          with the development of the smartphone models. For high-
observation is that, for each speech signal under investigation,                   end smartphones released after 2017, their accelerometers have
the tested accelerometer always has the strongest response                         reached sampling frequencies above 400 Hz and therefore
along the z-axis, followed by the y-axis, and then the x-                          should be able to pickup a considerable range of human
axis. In fact, this relationship remains constant regardless of                    speech. In particular, for Huawei P20 Pro and Mate 20, the
whether the smartphone is placed on the table or held by                           sampling rate of their accelerometers have reached as high as
hand. This consistency can be explained by the structure                           500 Hz, which allows them to pick up frequency components
of the accelerometer’s sensing unit shown in Fig. 2(a). For                        up to 250 Hz. Because the highest fundamental frequency for
each sensing unit, the seismic mass only vibrates along its                        adult speech is just 255 Hz, these two smartphones almost can
sensing axis and therefore is less sensitive to vibration signals                  cover the entire fundamental frequency band of adult speech.
coming from other directions. Because the vibrations rendered                      The takeaway message is that the threat of motion sensors to

                                                                               6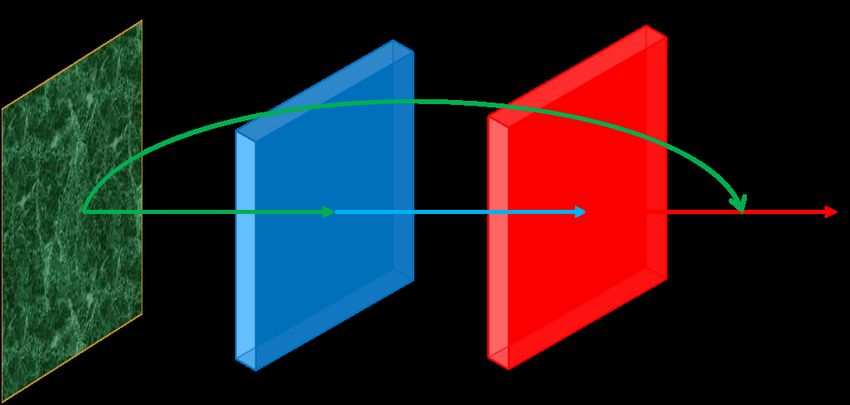
TABLE III.   ACTUAL SAMPLING RATE OF DIFFERENT SMARTPHONES
          WHEN CONFIGURED AT SENSOR_DELAY_FASTEST.

    Model               Year                CPU              Sampling Rate
    Moto G4             2016      4x1.5 GHz & 4x1.2 GHz         100 Hz
    Samsung J3          2016             4x1.3 GHz              100 Hz
    LG G5               2016      2x2.15 GHz & 2x1.6 GHz        200 Hz
    Huawei Mate 9       2016      4x2.4 GHz & 4x1.8 GHz         250 Hz
    Samsung S8          2017      4x2.35 GHz & 4x1.9 GHz        420 Hz
    Google Pixel 3      2018      4x2.5 GHz & 4x1.6 GHz         410 Hz
    Huawei P20 Pro      2018      4x2.4 GHz & 4x1.8 GHz         500 Hz
    Huawei Mate 20      2018      2x2.6 GHz & 2x1.92 GHz        500 Hz
                                        & 4x1.8 GHz
                                                                                     (a) Audio response distribution               (b) Samsung S8

speech privacy has become a serious issue and will continue
to grow due to the rapid improvement of smartphone models.

C. Robustness
    Accelerometers on smartphones are highly sensitive to the
environmental noise. In the adversarial setup under investiga-
tion, the noise may come from following sources: hardware
distortion, acoustic noise, human activities, self-noise and
surface vibration. We look into all these kinds of noise,                                   (c) Google Pixel 3                     (d) Huawei P20
and find that most of these noises are either unlikely to
affect accelerometer readings or can be effectively eliminated,                  Fig. 5. Resonant frequency search. Fig. 5(a) presents the audio response of
except for the acoustic noise contained in the audio signal                      different smartphone accelerometers to airborne voice signals. The airborne
                                                                                 signal is a series of single tone signals from 1000Hz to 22000Hz with an
played by the smartphone speaker. The impact of such noise                       interval of 50Hz. Fig. 5(b), 5(c), and 5(d) respectively presents the scalogram
on the recognition accuracy is evaluated in section VI-C                         of the accelerometer signal for the corresponding smartphone to achieve the
                                                                                 highest audio response.
    Hardware distortion is a systematic distortion incurred
by manufacturing imperfection. Small variations in electro-
mechanical structures (e.g., gap between the fixed electrodes                    component. For the gain error, it only affects the “loudness”
and the flexibility of the seismic mass) result in slightly                      of captured speech signal and thus will not distort its spec-
different measurement values [15]. For illustration, we place                    trum. Therefore, we address the hardware distortion simply by
four smartphones on the same table and record their responses                    eliminating the DC component of the captured signals.
to gravity along six directions (+x, -x, +y, -y, +z, -z).                            Acoustic noise refers to all the unwanted sound signals
                                                                                 in the surrounding environment, which could be from speech,
       TABLE IV.   T HE GRAVITY RESPONSE OF DIFFERENT
  ACCELEROMETERS ALONG THE SIX DIRECTIONS . A AND B ARE TWO
                                                                                 music, vehicles, industrial sources, etc. For the attack proposed
              SMARTPHONES OF THE SAME MODEL .                                    in this paper, the acoustic noise mainly comes from the sur-
                                                                                 roundings of the victim smartphone and the noise components
                                     Response to Gravity (m2 /s)
     Device
                           +x        -x        +y       -y     +z     -z         of the played audio, that is, the noise around the remote caller.
     Samsung S8 A         9.64      10.01     9.94    9.78    9.83   9.83
     Samsung S8 B         9.59      10.05    10.02    9.76    9.71   9.82            For the acoustic noise around the victim smartphone, the
     Google Pixel 3 A     10.16     9.41      9.89    9.67    9.59   9.82        sound will travel through the air to arrive the accelerometer. In
     Google Pixel 3 B     9.78      9.81      9.77    9.79    9.80   9.81        the literature, Anand et al. [5] show that airborne speech sig-
                                                                                 nals are unable to have any noticeable impact on accelerometer
    As shown in Table IV, the gravity measured along different                   measurements even at high sound pressure level. To study the
directions are slightly different, which indicate the existence of               impact of other noise signals, we first bring the smartphone
hardware distortion. Given a specific accelerometer, its actual                  to three noisy environments (bar, crowded bus station, and
measurement along ith axis can be modeled as [16]                                metro station) and collect accelerometer measurements for 30
                                                                                 seconds. For all three environments, we observe no significant
                          aM
                           i = Si (ai ) + Oi ,                                   impact on the accelerometer measurements and the ARdB
where ai is the actual acceleration, Si and Oi respectively                      values along the z axis are only 0.1900, 0.0724, and -0.0431,
represent the gain and offset errors. Therefore, the actual                      respectively. We then evaluate the impact of resonant fre-
acceleration signal along the ith axis can be recovered by                       quency. The resonant frequency of the accelerometer’s mass-
                                                                                 spring system typically lies in the range from a few kHz [26]
                          ai = (aM
                                 i − Oi )/Si ,                                   to tens of kHz [4]. According to the literature [40], [14],
where Si and Oi are calculated through analyzing the ac-                         [39], airborne audio signals around the resonant frequency
celerometer’s response to gravity[12], [9].                                      of a MEMS motion sensor can affect its measurements at
                                                                                 high sound pressure level. To find out the impact of resonant
    In the proposed attack, it is even not necessary for the                     frequency on our system, we test the audio response of
adversary to recover the actual acceleration signal. This is                     Samsung S8, Google Pixel 3, and Huawei P20 with airborne
because that the speech information captured by the accelerom-                   audio signals within the normal frequency range from 1000Hz
eter mainly distributed in the frequency components above                        to 22000Hz. For each smartphone under investigation, we
85 Hz while the offset error can only affect the DC (0 Hz)                       stimulate its accelerometer with the speaker of a Huawei

                                                                             7
(a) Time domain                                      Fig. 7. The response of a smartphone accelerometer to five human activities.
                                                                                   The obtained acceleration signals are concatenated for better comparison.

                                                                                   volume and make phone calls to volunteers in six realistic
                                                                                   environments with different noise levels: 1) Quiet room, 2) Lab
                                                                                   with people talking, 3) Bar with music playing, 4) Crowded
                                                                                   bus station, 5) Metro station with trains running, 6) Metro
                                                                                   station without trains running. For each environment, we col-
                                                                                   lect accelerometer measurements for 30 seconds and calculate
                                                                                   the average ARdb along the z-axis. The ARdb obtained from
                                                                                   the six environments are -0.85, 1.67, 9.15, 13.87, 12.18, 4.89.
                                                                                   Fig. 6 plots the time and frequency domain of the collected
                           (b) Frequency domain
                                                                                   accelerometer measurements. It can be observed that the noise
Fig. 6. The impact of acoustic noise around the remote caller. We eliminate
                                                                                   signals in environment 3, 4, and 5 have significantly affected
the DC component of the acceleration signals and concatenate them for better       all frequency components of the accelerometer measurements.
comparison. The first segment is the self-noise of the accelerometer.              The noise signals in environment 1, 2, and 6 have less effect
                                                                                   on the accelerometer measurements and mainly affect the low
                                                                                   frequency band of the acceleration signal, and thus can be
Mate 20 configured at its highest volume. The speaker and                          significantly suppressed through a high-pass filter. Because the
the accelerometer are placed on two different tables at a                          acoustic noise around the remote caller can significantly affect
distance of 10 centimeters in order to eliminate the impact                        the accelerometer measurements, we evaluate its impact on
of surface vibration and maximize the sound pressure on the                        speech recognition in Section VI-C.
accelerometer. The audio signal is a series of two-second single
tone signals ranging from 1000Hz to 22000Hz with a step                                Human activities can significantly affect the measure-
frequency of 50Hz. We calculate the accelerometer’s audio                          ments of smartphone accelerometers and thus might be able
response at each frequency and plot the distribution of the                        to distort the speech information inferred by the adversary. In
obtained ARdB values (Fig. 5(a)). The resulting ARdB values                        order to evaluate the impact of human activities, we studied
seem to be normally distributed for each smartphone and have                       the accelerometer’s response to five human activities: walking,
no notable outlier. Most of the recorded acceleration signals                      ascending and descending stairs, stand up and sit down, waving
have an ARdB below three. Samsung S8, Google Pixel 3, and                          hand, and typing messages. During each test, the user hold
Huawei P20 respectively achieve the highest ARdB value at                          a Samsung S8 with AccDataRec running in the background
4150 Hz (z-axis), 9450Hz (z-axis), and 11450Hz (x-axis). Fig.                      and conduct the activity for about 10 seconds. Because the
5(b), 5(c), and 5(d) show the scalograms of the acceleration                       accelerometer exhibits very similar response along the three
signals recorded at these frequencies. For Samsung S8 and                          axes, we concatenate the obtained acceleration signals and
Google Pixel 3, the accelerometers do not have a constant                          display the scalogram of the y-axis in Fig. 7. It can be observed
response at any specific frequency, which indicates that the                       that each of the tested activity produces a relatively unique and
high ARdB values are caused by the variation of environmental                      constant pattern in the acceleration signals. However, none of
vibrations. For Huawei P20, its accelerometer seems to have a                      these activities has significant impact on frequency components
constant but weak response at 20Hz. We repeat the experiment                       above 80 Hz. As the typical fundamental frequency for adult
with the same stimulation signal for 10 times and the response                     speech signals is from 85Hz to 255Hz, a high-pass filter with
has not been successfully reproduced, which indicates that the                     80Hz cut-off frequency can eliminate most of the distortions
ARdB value is caused by environmental vibrations. Based on                         incurred by human activities (as shown in Fig. 7). The re-
these experimental results, it can be concluded that airborne                      maining distortions mainly exist as very short-time pulses in
acoustic noises at regular frequency (below 22000Hz) and                           the high frequency domain, which actually has little impact
sound pressure level are unlikely to distort the accelerometer                     on recognition/reconstruction according to our observation, but
measurements. The proposed attack will not be affected by the                      will influence the way of segmentation as introduced in V-A.
acoustic noise around the victim smartphone.
                                                                                       Self-noise and surface vibration: self-noise refers to
    For the acoustic noise around the remote caller, because                       the noise signal output by the smartphone’s accelerometer
the noise signals will enter the caller’s smartphone and be                        at no external stimulus. This noise is an inherent feature of
played by the victim device, it is likely that the accelerometer                   the accelerometer itself and contributes to the primary noise
of the victim smartphone will be affected. To study the impact                     components of the proposed system. Because it is almost
of such noise, we set the victim smartphone at its highest                         impossible to keep the accelerometer in a state without any

                                                                               8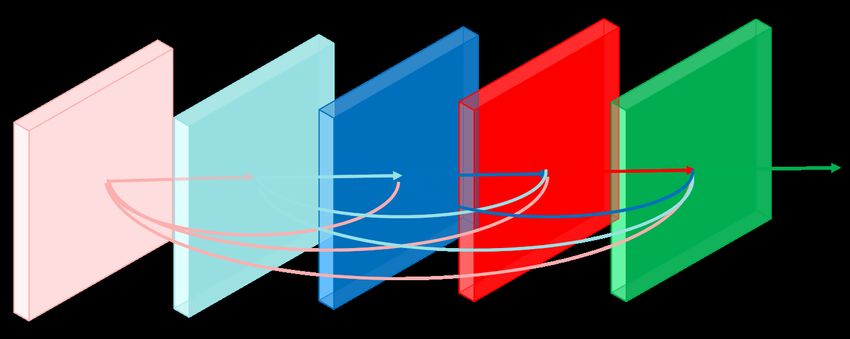
(a) Acceleration signal along the x- (b) Spectrogram of the signal along
 axis, y-axis, and z-axis             the z-axis                                                                 (a) Table setting

Fig. 8. The impact of self-noise and surface vibration. The accelerometer is
placed on a table and is only affected by the vibration of the surface.

external stimulus, we investigate the combined effect of self-
noise and surface vibration. Surface vibration could affect
the accelerometer’s measurements along the z-axis when the
smartphone is placed on a table. To measure the impact of
these two noise sources, we place a Samsung S8 on a table
and record its accelerometer measurements for 330 seconds.
The table has a solid surface that could effectively hand over
vibration to the smartphone and is placed in a building under
construction. The output signal of the accelerometer is depicted
in Fig. 8(a). It can be observed that the accelerometer has
a constant noise output along the x-axis and the y-axis. The
self-noise of the accelerometer contributes to the majority of
these noise outputs. For the z-axis, the accelerometer outputs
a constant noise signal as well as surface vibrations. The fre-                                                (b) Handhold setting
quency distribution of the acceleration signal along three axes
are similar. For illustration, Fig. 8(b) plots the spectrogram                     Fig. 9.   Raw acceleration signals captured by smartphone accelerometer.
of the signal along the z-axis (with the DC offset removed).
In this spectrogram, around 57% of the energy are distributed
below 80Hz. Because the typical fundamental frequency for                          the Mel-scale mimics the non-linear perception characteristics
adult speech is from 85Hz to 255Hz, we address the self-                           of human ear and is good for discarding redundant and
noise and the surface vibration through eliminating frequency                      superfluous information. In our system, however, Mel-scale
components below 80 Hz. The impact of the remaining noise                          representations are of little help as the accelerometers in
signal will be evaluated in section VI.                                            modern smartphones can only pick up speech signals in the low
                                                                                   frequency band. Therefore, in the proposed system, we pre-
                   V.    T HE P ROPOSED S YSTEM                                    process the acceleration signals into spectrograms for speech
                                                                                   recognition and reconstruction. The spectrogram representation
    In this section, we will detail our proposed system, which                     explicitly reflects the multi-scale information of a signal in
mainly includes three modules, i.e. the preprocessing module,                      the frequency domain, and enables the employment of some
the recognition module, and the reconstruction module.                             network structures widely-used in the computer vision tasks,
                                                                                   such as ResNet & DenseNet.
A. Preprocessing
                                                                                       Without loss of generality, we now use a Samsung S8
    The main intent of our system is to recognize and re-                          to help illustrate how spectrograms are generated from raw
construct the speech information captured by smartphone ac-                        acceleration measurements. Fig. 9(a) and Fig. 9(b) show the
celerometers. Compared with analyzing raw waveform data, a                         raw acceleration signals collected from two different settings.
more prevalent and elegant way to recognize speech signals                         In the table setting, we place the smartphone on a table and
is to analyze their spectrogram representations [23], [8]. Such                    play a speech signal of five isolated digits (from zero to four)
representation shows the frequency components of the signal                        through its loudspeaker. Acceleration signals collected from
and how their intensities change overtime. In conventional                         this setting show strong audio response along all axes. For
audio signal based speech recognition tasks, the spectrogram is                    the handhold setting, we play the same speech signal with
normally further processed on a Mel-scale to calculate the Mel-                    the smartphone held in hand. The acceleration signals are
Frequency Cepstrum Coefficients (MFCCs). This is because                           severely distorted due to the unintentional movement of the

                                                                               9
(a) Table setting (b) Handhold setting
Fig. 10. The time interval between two adjacent accelerometer readings. Raw
accelerometer readings have unstable sampling interval because the system is
configured to send measurements to the application as fast as possible.
hand. There are three main problems in the raw acceleration (a) Table setting
signals: 1) Because the system is configured to send accelerom-
eter measurements to the application as fast as possible,
raw accelerometer measurements are not sampled at fixed
interval (Fig.10). 2) Raw accelerometer measurements can be
severely distorted by human movement. 3) Raw accelerometer
measurements have captured multiple digits and needs to be
segmented. To address these problems, we use the following
steps to convert raw acceleration signals to spectrograms.
Interpolation: We first use linear interpolation to deal with
unstable intervals of accelerometer measurements. Because the
timestamps of the sensor measurements are with millisecond
accuracy, a natural way to resolve unstable intervals is to
upsample the accelerometer measurements to 1000 Hz. There-
fore, we use timestamps to locate all time points that have
no accelerometer measurement and use linear interpolation
to fill in the missing data. The resulting signal has a fixed
sampling rate of 1000 Hz. We note that this interpolation (b) Handhold setting
(upsampling) process does not increase the speech information
of the acceleration signal. Its primary purpose is to generate Fig. 11. Acceleration signals processed with interpolation, high-pass filtering,
acceleration signals with a fixed sampling rate. and segmentation. The cut-off frequency for high-pass filtering is 20 Hz. The
magnitude sequences are directly calculated from the filtered signals since
High-pass filtering: We then use a high-pass filter to they do not involve intense human movements.
eliminate significant distortions caused by gravity, hardware
distortion (offset error), and human activities. In particular,
also eliminated the impact of hand movement. The filtered
we first convert the acceleration signal along each axis to
signals obtained after this step mainly consist of the target
the frequency domain using the Short-Time Fourier Transform
speech information and the self-noise of the accelerometer.
(STFT). It divides the long signal into equal-length segments
(with overlaps) and calculates the Fourier transform on each Segmentation: As the acceleration signals along the three
segment separately. We then set the coefficients of all fre- axes are completely synchronized, we use the dominant axis
quency components below the cut-off frequency to zero and (z-axis) described in section IV to locate cutting points and
convert the signal back to the time domain using inverse STFT. then use the obtained cutting points to segment the filtered
Because the fundamental frequency for adult male and female acceleration signal along three axes. The cutting points are
is usually higher than 85 Hz, and human activities rarely affect located as follows: Given the acceleration signal along the
frequency components above 80 Hz (as shown in Fig. 7), the dominant axis, we first sanitize the signal through another
cut-off frequency for speech recognition is set to 80Hz so that round of high-pass filtering with a cut-off frequency of 160 Hz.
the impact of noise components can be minimized. For speech Through studying signals collected from noisy experimental
reconstruction, since the reconstruction network mainly learns setups, we observe that this cut-off-frequency could eliminate
the mapping between acceleration signals and audio signals, a significant amount of noise components including the short-
we use a cut-off frequency of 20 Hz in order to preserve more time pulses caused by human movement. Typically, this process
speech information. Fig. 11(b) and 11(a) display the filtered is needed only when the smartphone experiences external vi-
acceleration signals with a cut-off frequency of 20 Hz. For brations or intense movement. We then calculate the magnitude
the table setting, all the acceleration signals are shifted to zero (absolute value) of the sanitized signal and smooth the obtained
mean, which indicates the successful removal of the offset error magnitude sequence with two rounds of moving average. The
and the gravity (for the z-axis). For the acceleration signals sliding window for the first round and the second round are
collected under the handhold setting, the high-pass filter has 200 and 30 respectively. The smoothed magnitude sequences
10(a) Table setting (b) Handhold setting
(a) Table setting (b) Handhold setting
Fig. 13. The spectrogram-image of the first single-word signal. These images
Fig. 12. The spectrogram of the first single word signal (z-axis). cover the frequencies from 80Hz to 300Hz.
of the two settings are shown in Fig. 11. Next, we find the and 255 will result in considerable information loss. Finally,
maximum value Mmax and the minimum value Mmin of the we export the m × n × 3 tensor as an image in PNG format.
smoothed magnitude sequence. In this process, the first and In the obtained spectrogram-image, the red, green, and blue
last 100 magnitude values are discarded as they do not have channels correspond to the x-axis, y-axis, and z-axis of the
sufficient neighboring samples for averaging. The obtained acceleration signal, respectively. For the recognition task, the
minimum value is approximately the magnitude of the noise spectrogram-images are cropped to the frequency range from
signal. After that, we traverse through the smoothed magnitude 80 Hz to 300 Hz in order to reduce the impact of self-
sequence and locate all the regions with magnitudes higher noise. Fig. 13 plots the spectrogram-image of the first single-
than a threshold of 0.8Mmin + 0.2Mmax . Each located region word signal of each setting. A brighter region indicates that
indicates the existence of a speech signal. In order to make sure the acceleration signal has stronger energy at that frequency
that the segmented signal will cover the whole speech signal, range during that time period. It can be observed that the blue
the start and end points of each located region are then moved channel (the acceleration signal along the z-axis) provides the
forward and backward by 100 and 200 samples, respectively. most speech information under both settings.
The cutting points calculated from each setting are marked in
Fig. 11. Finally, we use the obtained cutting points to segment B. Recognition
the filtered acceleration signal into multiple short signals, each
of which corresponds to a single word. With the above preprocessing operations, the resulting
acceleration spectrogram-images can be fed into various stan-
Signal-to-spectrogram conversion: To generate the spec- dardized neural networks such as VGG [36], ResNet [22],
trogram of a single-word signal, we first divide the signal into Wide-ResNet [43], and DenseNet [24] after resizing. We now
multiple short segments with a fixed overlap. The lengths of the detail the design of our recognition module.
segment and the overlap are set as 128 and 120 respectively.
We then window each segment with a Hamming window and Spectrogram-image Resizing To feed those spectrogram-
calculate its spectrum through STFT, which generates a series images into standardized computer vision networks, it is better
of complex coefficients for each segment. The signal along to resize them into n × n × 3 images. Note that fine-grained
each axis is now converted into a STFT matrix that records information and correlations of the acceleration-spectrograms
the magnitude and phase for each time and frequency. Finally, may be influential to the recognition results, especially the
the 2D spectrogram can be calculated through results of speaker identification. To preserve sufficient infor-
mation, we resize the spectrogram-images into 224 × 224 × 3.
spectrogram{x(n)}(m, w) = |ST F T {x(n)}(m, w)|2 , (1)
Network Choice Generally, we choose DenseNet as the
where x(n) and |ST F T {x(n)}(m, w)| respectively represents base network for all our recognition tasks. Compared with
a single-axis acceleration signal and the magnitude of its traditional deep networks like VGG and ResNet, DenseNet
corresponding STFT matrix. Because we have acceleration introduces connections between each layer and all its preceding
signals along three axes, three spectrograms can be obtained layers, i.e., totally (L+1)L
2 connections in an L-layer network.
for each single-word signal. For illustration, Fig. 12 plot the For instance, as shown in the diagram of a common block
spectrogram (z-axis) of the first single-word signal of each in DenseNet (Fig. 14(a)), the first to fourth layers all have
setting. The frequency components below 20 Hz are close to direct links to the fifth layer. In another word, l-th takes the
zero due to the high-pass filtering process. concatenation of feature maps from 0-th layer (input image)
to the (l − 1)-th layer as input, which can be mathematically
Spectrogram-Images: To directly feed the spectrograms
represented by
into the neural networks used in computer vision tasks, we
further convert the three 2-D spectrograms of a signal into xl = Hl ([x0 , x1 , ..., xl−1 ]). (2)
one RGB image in PNG format. To do so, we first fit the
three m × n spectrograms into one m × n × 3 tensor. Then Hl and xl denote the function and the feature map of the
we take the square root of all the elements in the tensor and l-th layer, respectively. [x0 , x1 , ..., xl−1 ] denote the concate-
map the obtained values to integers between 0 and 255. The nation of the feature maps of the 0-th layer to the l − 1-th
reason of taking the square root is that the majority of the layer. These direct connections enable all layers to receive
elements in the original 2-D spectrograms are very close to and reuse the features from their preceding layers, and thus,
zero. Directly mapping these elements to integers between 0 DenseNet does not have to use some redundant parameters
11You can also read


