The Last Mile Matters: Impact of Dockless Bike Sharing on Subway Housing Price Premium
←
→
Page content transcription
If your browser does not render page correctly, please read the page content below
The Last Mile Matters: Impact of Dockless Bike Sharing
                              on Subway Housing Price Premium*

                           Junhong Chu, Yige Duan, Xianling Yang, and Li Wang

                                                    Abstract
    Dockless bike sharing provides a convenient and affordable means of transport for urban residents. It
solves the “last-mile problem” in public transport by reducing the travel cost between home and subway
stations and thus increasing the attractiveness of distant apartments. This may affect the relationship
between housing price and distance to subway and reduce the price premium enjoyed by proximate
apartments. Using resale apartment data in 10 major cities in China, a difference-in-differences approach
at the apartment level, and a two-step estimator at the city-month level, we find that the entry of bike sharing
reduces the housing price premium by 29% per km away from a subway station. The effect is equivalent to
a reduction of 1,893–2,127 CNY (282–317 USD) in commuting costs per household per annum over 30
years. The effect is driven by a relative increase in the listing price of, and in the demand for, apartments
distant from vis-à-vis proximate to subway stations.
    Keywords: Sharing economy, dockless bike sharing, last-mile problem, urban economics.

1. Introduction
In recent years, 1,608 cities in the world have embraced shared bikes as an innovative and economical
alternative for urban commuting. From 2013 to 2018, the number of shared bikes worldwide increased from
700,000 to 18 million, most of which are dockless bikes that are operated without docking stations, and
hence can be parked anywhere. Ofo and Mobike, two bike sharing start-ups in China, have jointly
introduced 17 million dockless bikes to more than 200 cities globally, and each has acquired over 200

*
 Chu: National University of Singapore, bizcj@nus.edu.sg; Duan: University of British Columbia, yige.duan@ubc.ca;
Yang and Wang: Lianjia Research Institute and Kongbai (Beijing) Technology Co Ltd, yangxianling@outlook.com,
wangli.lj@outlook.com. The authors are grateful to Ivan Png, Pradeep Chintagunta, Nan Yang, Anirban Mukherjee,
Hai Long Doung, Yanlai Chu, Tesary Lin, Haifeng Xu, and seminar participants at the University of Chicago, National
University of Singapore, the University of British Columbia, Renmin University of China, Central University of
Finance and Economics, Northwestern Polytechnical University, the University of Science and Technology of China,
the University of Electronic Science and Technology of China, Beijing University of Posts and Telecommunications,
and the 2019 ISMS Marketing Science Conference for valuable comments and suggestions. Qin Chao provided
outstanding research assistance. The research is funded by Singapore Ministry of Education, Social Science Research
Thematic Grant [MOE2016-SSRTG-059, SPIRE].

                                                        1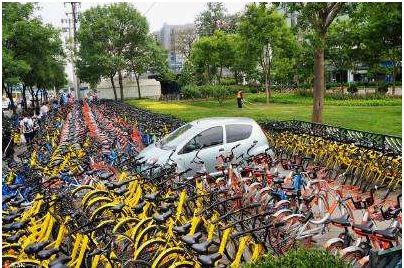
million users since 2015.1
    Several technological advances and economic benefits of dockless shared bikes may have contributed
to their fast expansion and wide adoption. GPS sensors, smart locks, mobile payments, and the docklessness
feature offer great flexibility and convenience, and the lower price and various promotions have vastly
enhanced affordability. Studies have found that docked shared bikes can reduce commuting costs, traffic
congestion, and air pollution, and have positive health effects (Woodcock et al. 2014; Pelechrinis, Li and
Qian 2016). Dockless shared bikes are likely to have similar benefits.
    One notable benefit of dockless bike sharing is that it is an effective solution for the “last-mile problem”
that has hindered public transit systems. In metropolitan areas worldwide, despite affordable means of
station-to-station commuting such as subways, buses, and trains, commuting remains disproportionally
costly in terms of both money and time to travel between home and a public transit station. To alleviate
such costs, people choose to live near subway stations, which drives up the demand for and the price of
proximate apartments. Apartments close to subway stations tend to be priced higher than, or enjoy a price
premium over, identical but distant ones, which is dubbed “subway housing price premium” (Dewees 1976;
Coulson and Engle 1987; Baum-Snow and Kahn 2000; Bowes and Ihlanfeldt 2001; Gibbons and Machin
2005; Bajic 1983; Yiu and Wong 2005; Fesselmeyer and Liu 2017).
    Free from docking stations and available almost everywhere, dockless bike sharing is a convenient,
reliable, and affordable means of door-to-door commuting and a complement to public transit. It is also
considered to be an effective solution to the last-mile problem (United Nations Department of Economic
and Social Affairs, 2011)2 because it allows people to live farther from a subway but still easily access
subway services. This may drive up the demand for and the price of distant apartments relative to proximate
ones, reduce the price premium enjoyed by proximate apartments, and narrow the price gap between
apartments at different distances from subway stations.
    In this paper, we study how the presence of dockless bike sharing moderates the relationship between
housing price and distance to subway (termed the “housing price gradient” in the literature; e.g., Dewees
1976) and quantify the monetary value of dockless bike sharing in solving the last-mile problem. We can
recover people’s willingness to pay for the reduction in commuting costs by measuring the change in the

1
  See https://www.bbc.com/news/business-44066083 and https://mobike.com/cn, http://www.ofo.com.
2
  Previous surveys and research show that many shared bike users ride from or to public transit hubs. For example, a
survey of 1,255 shared bike riders in China reports that 68% of the respondents ride from and to public transit hubs,
and over 90% of trips cover a distance under 3 km. A U.S. bike sharing company, LimeBike, reports that 40% of its
rides serve the same purpose, and an average ride in U.S. metropolitan areas is around 1 mile. Another report from
China finds that over half of the rides are within 0.5-2 km or 6-20 minutes. See https://www.cbinsights.com/research/
bike-sharing-boom, http://report.iresearch.cn/wx/report.aspx?id=2961, and http://www.chinadaily.com.cn/a/201801/
10/WS5a557e01a3102e5b17371d1b.html,.

                                                         2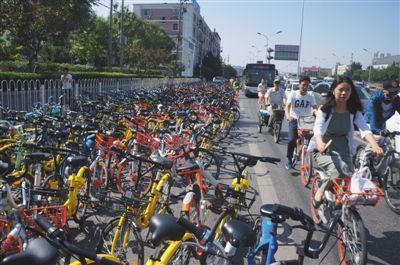
housing price gradient against distance to subway and using the hedonic price method (Rosen 1974; Roback
1982).
    Our empirical analysis exploits a novel dataset comprising detailed information on nearly 400,000
resale apartments near subway stations. To identify the causal effect of dockless bike sharing on the subway
housing price premium, we use the staggered entry of Ofo and Mobike into 10 major Chinese cities at
different time points as a quasi-natural experiment to conduct (1) difference-in-differences (DID) analysis
at the apartment level and (2) two-stage estimation at the city-month level. In the DID approach, the effect
is identified from the spatial variation in prices of apartments at different distances to the same subway
station before and after the entry; in the two-stage approach, we directly estimate the housing price gradients
in each city at different time points and identify the effect by comparing the gradients before and after the
entry. Both approaches yield a consistent finding: The entry of bike sharing significantly attenuates the
housing price gradient by 29%, from 4.2% to 3.0% per km, which is equivalent to an urban resident’s 1-
year disposable income. The implied reduction in commuting costs is 1,893–2,127 CNY (282–317 USD)
per household per annum over 30 years—an economically significant figure. Further analysis reveals that
the effect is driven by a relative increase in the attractiveness to potential buyers, as well as a relative rise
in initial listing prices of apartments distant from vis-à-vis proximate to subway stations. In addition, the
effects are heterogeneous across apartments, communities, and cities, and robust to the selection of time
windows around entry, selection of samples, measures of distance, and alternative explanations.
    Our paper’s main contributions are as follows. First, we use different approaches to convincingly
establish the causal effect of dockless bike sharing on subway housing price premium. In addition to the
DID approach and two-step estimation, which rely on different identification strategies, we conduct
falsification tests to rule out the effect of anticipated entry and implement various robustness checks to
unobserved apartment characteristics and time-varying community characteristics, the selection of time
windows around entry, selection of samples, measures of distance, omitted variables, measurement errors,
and alternative explanations. We thus rule out potential endogeneity concerns to a great extent. Second, we
explore the mechanism of the effect from the supply side, the demand side, and the market equilibrium. We
find that both property owners and buyers respond to the entry of dockless bike sharing, which jointly leads
to a reduction in the housing price gradient. We also find that the gradient reduction arises from a reduction
in commuting costs. Third, we quantify the monetary value of the commuting cost reduction brought
forward by dockless shared bikes and indirectly demonstrate the benefits of solving the last-mile problem
in urban commuting. Hence, our findings have significant implications for bike sharing firms, property
developers, policymakers, and bike riders.
    The reminder of the paper proceeds as follows. Section 2 reviews related literature. Section 3 presents
the data, Section 4 introduces our empirical strategy, and Section 5 reports findings. Section 6 conducts

                                                       3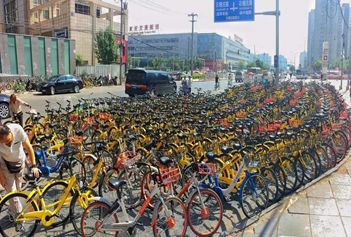
validation and robustness tests, and Section 7 concludes.

2. Literature Review
Our research is related to the burgeoning literature on the sharing economy. Pioneered by Uber, Airbnb,
and other gig companies, the sharing economy has brought about fundamental changes to the traditional
economy. Airbnb has been found to reduce the prices of low-end hotels (Zervas, Proserpio, and Byers 2017)
but raise the prices of rentable properties (Barron, Kung, and Proserpio 2018). Uber has been shown to
promote self-employment among taxi drivers (Berger, Chen, and Frey 2017) and complement public transit
and taxis (Hall, Palsson, and Price 2017; Mammen and Shim 2017), but also reduce taxi drivers’ wage
earnings (Berger, Chen, and Frey 2017). The traditional economy, on the other hand, has also implemented
various changes to respond to threats from the sharing economy. Uber’s entry in New York City and
Chicago reduces consumer complaints about taxi services, which implies that competition from Uber
improves the service quality of taxis (Wallsten 2015). In Singapore, taxi companies introduced a flat-fare
option to mitigate competition from ride-hailing platforms (Miao and Chu 2019).
    The sharing economy boom has important welfare implications. Fraiberger and Sundararajan (2017)
find that a peer-to-peer rental market for used goods raises consumer surplus by accelerating the
replacement of used goods and offering lower prices. Ride-hailing platforms are found to improve rider
welfare by matching drivers to riders who value the ride the most (Cohen et al. 2016) and serving areas that
are underserved by taxis (Lam and Liu 2017). They also benefit drivers by offering more flexible working
hours (Chen et al. forthcoming), proportional commission fees to share the risk of demand uncertainty
(Angrist, Caldwell and Hall 2017), and higher capacity utilization rates of vehicles (Cramer and Krueger
2016). In terms of nonpecuniary benefits, Uber is found to relieve traffic congestion (Li, Hong and Zhang
2016) and reduce traffic accidents related to drunk driving (Greenwood and Wattal 2017). Docked bike
sharing is found to reduce traffic congestion (Wang and Zhou 2017) and CO2 emissions (Pelechrinis, Li
and Qian 2016). For a comprehensive review of the literature, we refer the reader to Proserpio and Tellis
(2017).
    Our paper extends the literature in several important ways. To the best of our knowledge, we are the
first to study the economic impact of dockless bike sharing. In contrast to Uber, which seeks to disrupt the
traditional business, bike sharing serves more as a complement to public transit, and the complementarity
effect could be more salient for dockless bikes because they offer greater flexibility in riding routes than
docked bikes. Further, instead of studying closely related industries such as taxis and public transit, we
investigate how dockless bike sharing affects subway housing price premium and quantify the monetary
value of dockless bike sharing in reducing commuting costs.
    Our research is mostly related to that of Pelechrinis et al. (2017), who study the effect of docked bike
sharing in Pittsburgh on housing prices around docking stations and find that the presence of 50 shared bike

                                                     4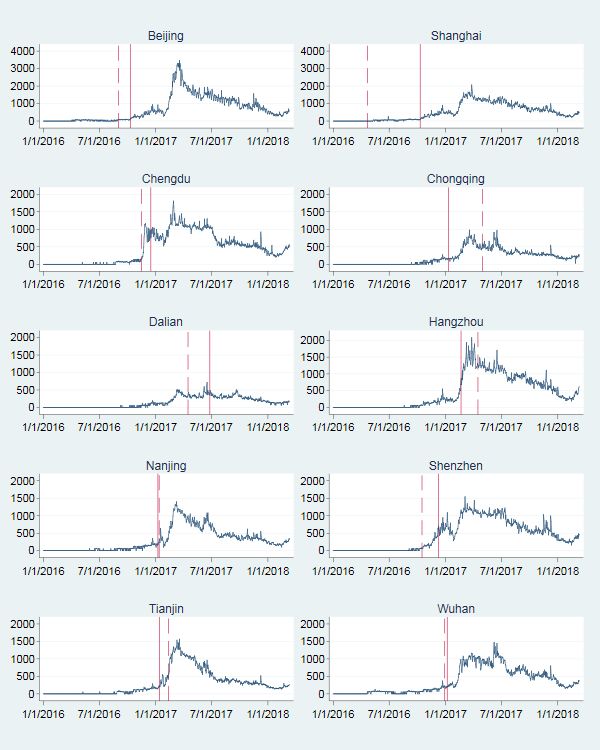
stations in 12 Zip codes with a total of 500 bikes led to a 2.5% increase in real estate value. However, their
study does not provide sufficient evidence to justify the parallel pre-trend assumption and the exogeneity
of docking stations, and thus cannot establish a causal relationship. By contrast, we use two approaches and
various robustness checks to demonstrate the causal effect of dockless bike sharing on the subway housing
price premium. We further show that the effect depends on an apartment’s distance to a subway station, i.e.,
dockless bike sharing reduces the negative effect of distance on housing price, while Pelechrinis et al. do
not investigate how the distance between docking stations and other public transit options affects housing
price. Also in contrast to Pelechrinis et al.’s study, we take two further steps to explore the mechanism
underlying the change from both the demand side and the supply side, and quantify the savings in
commuting costs brought forward by bike sharing.
    Another related study is by Cao, Jin, and Zhou (2018), who examine the competition between dockless
bike sharing companies in China. Although we study the same market, we focus on a different aspect: How
dockless bike sharing reduces commuting costs, and thus moderates the relationship between housing price
and distance to subway.
    Beyond the sharing economy literature, our paper is also related to the urban economics literature on
China’s housing market (e.g., Chen and Wen 2017; Deng et al. 2015; Fang et al. 2016; Wei, Zhang, and
Liu forthcoming) and the influence of transportation condition on housing price (e.g., Bajic 1983; Baum-
Snow and Kahn 2000; Bowes and Ihlanfeldt 2001; Coulson and Engle 1987; Dewees 1976; Fesselmeyer
and Liu 2018; Gibbons and Machin 2005; Yiu and Wong 2005). In particular, our result is consistent with
existing findings that housing prices are higher nearer subway stations because residents enjoy more
convenient public transport services. Furthermore, we validate the theory that households make a trade-off
between lower commuting cost and higher housing prices. Our estimates show that as commuting costs fall
due to the entry of dockless bike sharing, the housing price premium near subway stations also falls and the
price difference between houses of different distances to subway shrinks.

3. Data
3.1. Housing prices and characteristics

    We exploit a novel administrative dataset of resale apartments provided by a Chinese real estate agency,
which has the largest market shares in all 10 cities. The dataset comprises 507,975 apartments initially listed
for resale between July 1, 2015 and December 31, 2017 and tracks all unsold apartments until March 12,
2018, when the dataset was compiled. Thus, each apartment in our dataset is observed for at least 2.5 months.
The data contain detailed characteristics of each apartment, including size, number of rooms, floor number,
age of the building, decoration status, window directions, geo-coordinates, and whether it is proximate to a
good public school (referred to as school-district apartment hereafter). It also tracks each apartment’s

                                                      5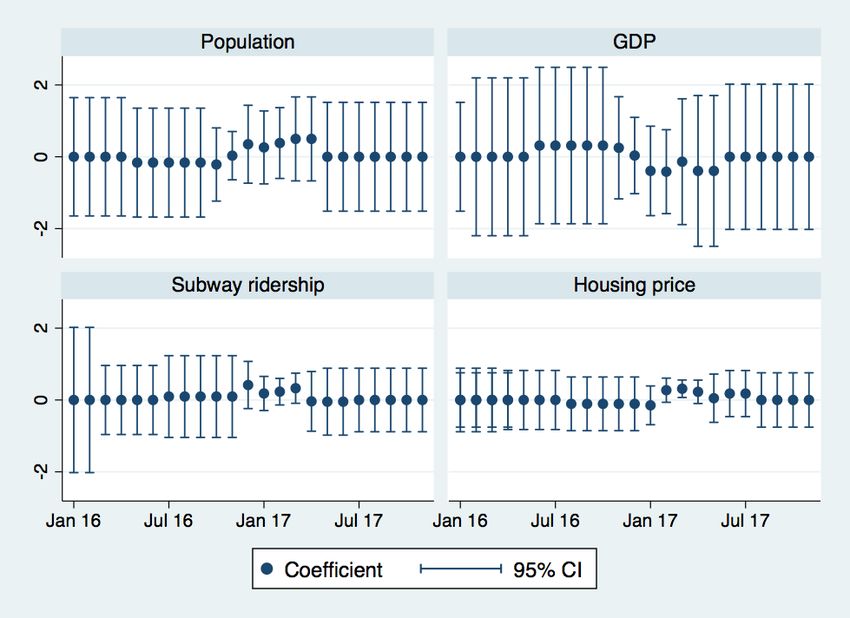
historical and current prices, transaction status (sold out or not), and number of visits by potential buyers.
    We distinguish an apartment’s initial price, adjusted price, and last/transaction price as follows. When
a seller decides to list their apartment on the agency’s website, they set an initial price for the apartment at
will. Before the apartment is sold, the seller can overwrite the previous price with an adjusted price, which
can be lower or higher. The dataset records all price adjustments and the time of adjustments. If the
apartment is sold via the agency, the dataset will record the transaction date and actual transaction price;
otherwise, it will keep tracking the price until the latest one. Thus, an apartment will have multiple
observations if there are price adjustments or updates on the sales status. If a listed apartment is transacted
between buyer and seller directly without notifying the agency (usually to avoid paying sales commissions),
the last price is likely the actual transaction price, but the price and transaction status of the apartment are
not updated.
    When an apartment is available for resale, interested buyers may contact the agency to arrange a visit
to check the status of the apartment, and likely bargain with the seller for a lower price. The sale of an
apartment typically involves many rounds of visits and bargaining between buyers and sellers. For all
apartments, we have the total number of visits by interested buyers up to March 12, 2018; for apartments
in Beijing, we also have a detailed viewing history with viewer identifiers.

3.2. Distance to subway station

    To complement the housing data, we manually collect information on each city’s subway network and
each station’s geo-coordinates and start date of operation. Then we match each apartment to its nearest
subway station by geodesic distance and keep apartments within 3 km of their respective nearest stations.
Apartments beyond 3 km (12%) are excluded, because we believe buyers of these apartments are less likely
to use dockless shared bikes to commute between home and subway (see footnote 2). Online Appendix A
illustrates in detail how distances to subway are calculated and updated, and Figure A1 shows the
distribution of apartments before and after the entry. For apartments with single observations, their
distances to the respective nearest subway station are calculated only once and do not change over time.
For apartments with multiple records, their distances may decrease over time if new and closer subway
stations are built. In the end, we have 399,840 apartments matched to 1,422 stations.
    The geodesic distance to subway is intuitive for illustrating the housing price gradient. In reality,
however, commuters only consider walking distance to a subway station. Therefore, we manually determine
the walking distance from each apartment to the nearest subway station identified by geodesic distance. In
this process, we might occasionally match an apartment to a non-nearest station because of the potential
discrepancy between geodesic and walking distance, and lose 3.8% observations. Fortunately, and as
expected, the two measures of distance are highly consistent, with a correlation coefficient of 0.89.

                                                       6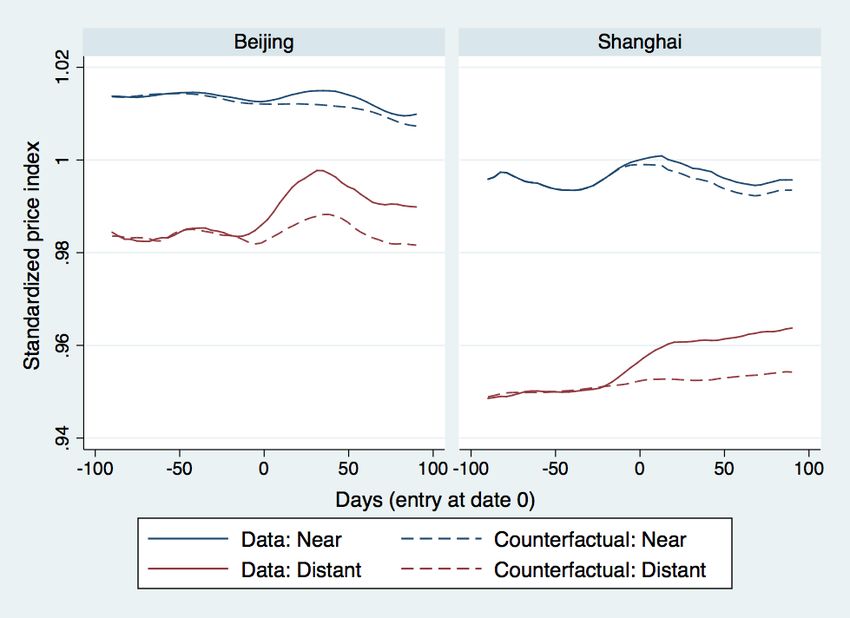
3.3. Entry of bike sharing
In online Appendix B, Table B1, we report the entry dates of Ofo and Mobike to each city, which are
collected from each company’s corporate website and public internet sites, and cross-validated with the
dates in Cao, Jin, and Zhou (2018). The earlier of Ofo’s and Mobike’s entry dates is defined as the entry
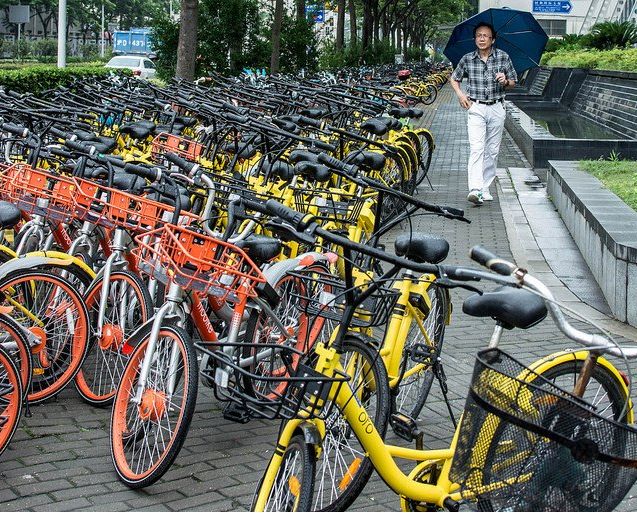
date of dockless bike sharing. Figure B1 presents some photos of shared dockless bikes in the 10 cities.
Inspired by Hall, Palsson, and Price (2017), who use Google Trend to proxy Uber’s penetration in the U.S.,
we also use the daily Baidu search index3 on the keyword “bike sharing” to proxy bike sharing’s penetration
in each city. As Figure B2 shows, in many cities the index peaks around the entry dates of Ofo and Mobike.
3.4. Summary statistics
Table 1 presents summary statistics of our data. The top panel reports prices, price adjustments, and
viewing visits; the middle panel reports housing characteristics; and the bottom panel reports bike sharing
and distance to nearest subway station. In total, we have 617,271 price records from 399,840 apartments.
The average of all prices is 31,536 CNY/m2 (437 USD/ft2); the average price adjustment over the previous
price is 7.4% with a standard deviation of 5.6%; and each apartment is visited 6.3 times with a standard
deviation of 17.1.
[Insert Table 1 Here]
An average apartment is 90.5 m (974 ft2) in size, has 2.2 bedrooms, and is located on the ninth floor
2
of a 14-year-old building 4 . One-half are school-district apartments; 13% of apartments have basic
decoration, 20% have intensive decoration, and the remaining have no decoration or missing decoration
information. The apartments have windows that face different directions, with the most common direction
being south (77%) and the least common being west (12%). The average geodesic and walking distances
to subway are 1.08 km and 1.62 km, respectively, and the maximums are 3 km and 5.2 km. Finally, 55%
of apartments are listed before the entry of bike sharing and 45% after.
4. Empirical Strategy
Our objective is to investigate how the presence of dockless bike sharing moderates the relationship
between housing prices and distance to subway and quantify its impact on commuting costs from and to
subway stations. We can directly estimate the effect on housing price premium, but since commuting costs
are not observed in our data, we instead indirectly infer the impact on commuting costs from the change in
3
The Baidu search index is the Chinese analog of Google Trend developed by Baidu, the largest search engine in
China. It counts how many times a keyword is searched on Baidu.com every day from IPs in each city.
4
About 37% of observations lack building age. To avoid losing these observations, we create an indicator for
apartments with missing data on age and replace the missing data with the mean of reported ages. In Table 8, column
(e), we report estimates without controlling for building age as a robustness check.
7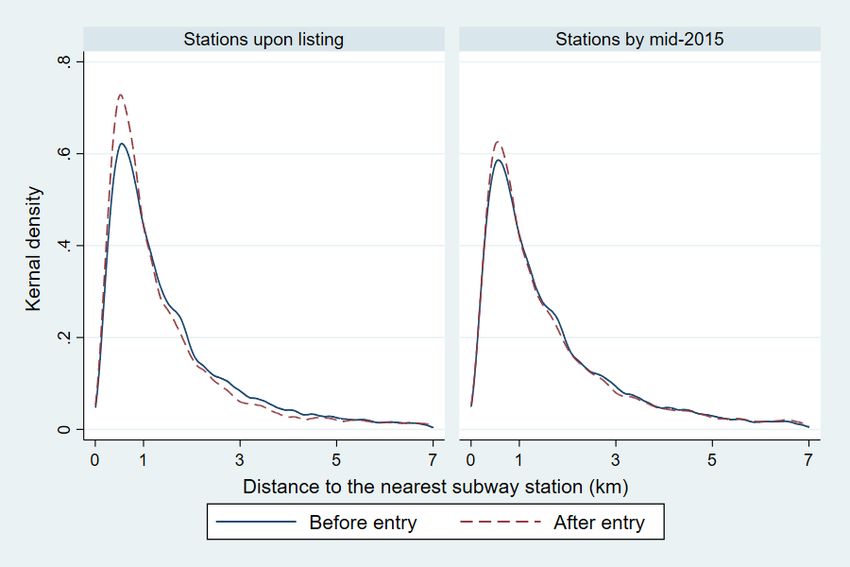
the housing price gradient. The idea is that households trade off between housing prices and commuting
costs: They choose to either live closer to a subway station to enjoy lower commuting costs but pay higher
housing prices, or live farther from a subway station to enjoy lower housing prices but pay higher
commuting costs. Hence, in equilibrium, housing price and distance to subway are negatively correlated,
and the price difference between proximate and distant (otherwise identical) apartments will capitalize the
difference in commuting costs. As dockless bike sharing reduces commuting costs, the price gap will also
shrink, resulting in a flatter gradient between housing prices vis-a-vis distance to subway.
       Absent randomized controlled trial or other better identification strategies like regression discontinuity
(e.g., Chu, Liu and Png, 2019), we take two approaches to establish the causal impact of dockless bike
sharing on the relationship between housing price and distance to subway: A DID approach at the apartment
level and a two-step estimator at the city-month level.

4.1. Difference-in-differences estimation at apartment level

       Our DID specification is similar to that of Archibong and Annan (2017), who perform a DID estimation
on cross-sectional data with some observations entering the sample before the treatment and others after
the treatment. In our study, we estimate the following model using DID, in which one difference is before
and after the entry of bike sharing and the other is the price difference between apartments at different
distances to the same subway station.
 (1)           ln(Pict) = β0 + β1 Distist + β2 Bikect + β3 Distist ×Bikect + Xit β + δs + θcym + εict .
       Here, i, c, and t represent apartment, city, and time, respectively; Pict is apartment i’s price per m2; Distist
is apartment i’s distance to the nearest subway station s at time t; Bikect is an indicator for the entry of and
presence of bike sharing in city c in time t; and Xit represents apartment characteristics, including size, floor
number, building age, number of bedrooms, decoration status, window direction, school district, apartment
density (measured as the number of apartments within a 3-km radius of the closest subway station in each
month); and indicators of initial and last prices. δs and θcym are subway station and city-year-month fixed
effects, and εict is the error term.
       In particular, the inclusion of subway station fixed effects not only accounts for neighborhood
conditions that might affect the suitability of bike riding (e.g., ambiance, terrain, weather), but also
addresses the uneven supply of and demand for shared bikes around each subway station. Even if the initial
geographical supply of dockless shared bikes is endogenous, because people ride the bikes from place to
place, the distribution will soon be randomized. City-year-month fixed effects control for any city-wide
policy impacts, such as regulations on the housing market or bike sharing companies. Since dockless bike
sharing may enter a city in the middle of a month, θcym does not completely absorb Bikect. Moreover,
controlling for apartment characteristics allows us to compare the prices of similar apartments.

                                                              8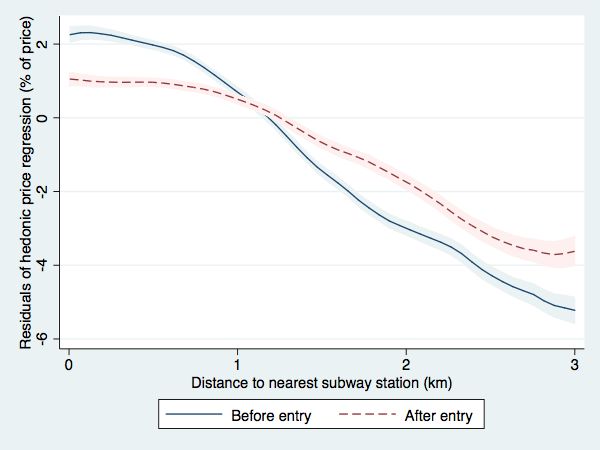
The economic intuition of model (1) is as follows. Before the entry of bike sharing (Bikect = 0), the
housing price gradient with respect to distance to a subway station is β1, which is expected to be negative:
Ceteris paribus, for each km away from a station, average housing price drops by -100β1%5. After the entry
of bike sharing, however, the gradient becomes β1+β3: Ceteris paribus, for each km away from a station,
average housing price drops by -100(β1+β3)%. Therefore, β3 identifies the impact of bike sharing on the
gradient. A positive β3 implies that dockless bike sharing flattens the gradient, reduces the price premium
of apartments near a subway station, and narrows the price gap.
    To identify the causal impact of dockless bike sharing on subway housing price premium, we exploit
the staggered entry of Ofo and Mobike into the 10 Chinese cities as a quasi-natural experiment. Ofo and
Mobike are the two largest dockless bike sharing companies, with a combined market share of over 90%.
Between 2016 and 2018, they expanded to hundreds of cities in China and many others around the world.
All 10 cities, with a total population of 152 million, have mature subway networks that play important roles
in everyday commuting (online Appendix B, Table B1). This allows us to focus on the housing price
gradient around subway stations. As we will show later, the entry of Ofo and Mobike to these 10 cities is
ideal for our study, because it is fast enough to be considered exogenous but slow enough to generate
sufficient variation for DID analysis. Also, they are always the first entrant in the 10 cities.
    Essentially, our DID identification relies on the within-station, within-month spatial variation in the
prices of similar apartments at different distances to the same subway station. Thus, our estimates are robust
to a wide range of confounders, with one exception: those that affect apartments matched to the same station
differently depending on their distances. In Section 6.2, we show that such confounders are unlikely to bias
our estimates.

4.2. Two-step estimation at city-month level

    In the DID specification, we do not include apartment fixed effects because many apartments have only
one observation. The presence of unobserved apartment characteristics or other macro-socioeconomic
factors may bias the estimates if they affect apartments at different distances from the same subway station
differently. As our main focus is to study how the entry of dockless bike sharing in a city attenuates the
housing price gradient, a more appropriate unit of analysis is city-month. Therefore, we conduct another
analysis at the city-month level via a two-step approach6. In the first step, we estimate a housing price
gradient for each of the 329 city-month subsamples by Equation (2a); in the second step, we compare the

5
  In continuous form, β1 can be interpreted as semi-elasticity, which is the percent change in Pict when Distist changes
by 1 unit (Wooldridge 2016); in discrete form, exp(β1)-1 represents the percent change in Pict when Distist changes by
1 unit. When β1 is small (-0.05–0.05), exp(β1)-1≈β1.
6
  We thank the Associate Editor for suggesting this approach.

                                                           9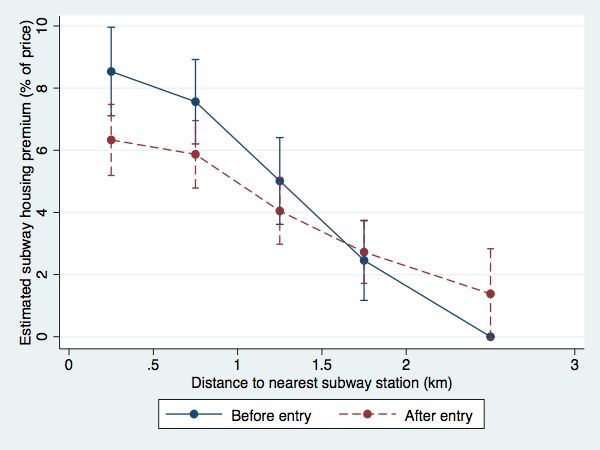
gradients before and after the entry using Equation (2b).
(2a)           ln( Pict ) = b 0 + b cym Distist + X it b + d s + q cym + e ict

(2b)             bˆcym = g 0 + g 1Bikecm + d c + xcym
where βcym is the housing price gradient for city c, year y, and month m, and δc is city fixed effects.

5. Results
5.1. Main results

       We estimate model (1) by OLS and report robust standard errors clustered by subway station7. In the
baseline estimates, we define Distist as the geodesic distance and Bikect as the indicator of the earlier entry
of Ofo and Mobike, and let Pict include all prices. If an apartment ever has its price adjusted, it will have
multiple observations, and we include two indicators for the initial and last price. The results are presented
in Table 2.
                                                    [Insert Table 2 Here]
       Table 2, column (a) presents the average effect of the entry of dockless bike sharing on housing price
close to subway stations. The coefficient of distance to subway, -0.042 (s.e. 0.003), indicates that before
the entry of bike sharing, apartments near subway stations enjoy a price premium. For every km away from
a subway station, housing price on average falls by 4.2%. The coefficient of distance x bike sharing, 0.012
(s.e. 0.003), implies that the entry of bike sharing reduces the premium and flattens the gradient by 1.2
percentage points (ppts) or 29% (= 0.012/0.042). As a result, apartments near subway stations still enjoy a
price premium after entry, but the magnitude is 71% of the premium before entry.
       At the average housing price of 31,536 CNY/m2 and average size of 90.5 m2, the estimated price
gradient for an average apartment before entry is equivalent to 119,868 CNY (17,890 USD) per km. In
other words, an average apartment 1 km closer to a subway enjoys an 119,868 CNY price premium. The
premium can be interpreted as a household’s willingness to pay to live 1 km closer to a subway or total
compensation for the commuting costs of living 1 km farther from a subway during its tenure in the
apartment. After entry, the reduction in the gradient is equivalent to 34,248 CNY (5,112 USD). The effect
is both statistically and economically significant: To put this in context, in 2016 the average disposable
income of an urban resident in China was 33,616 CNY, so the reduction is approximately 1 year of
disposable income.
       Columns (b) and (c) examine the entry of Ofo and Mobike, respectively. Ofo’s entry attenuates the
gradient by 1.3 ppts per km and Mobike’s entry by 1.1 ppts per km, both of which are close to the estimate
in column (a). Column (d) uses the Baidu search index to measure entry. For every increase of 1,000 in the

7
    We also cluster standard errors by city and obtain similar results. See Table , column (f).

                                                                10
search index, the gradient will be flattened by 1.0 ppt per km.
Since many apartments have only one observation, we cannot include apartment fixed effects in model
(1), unlike in the conventional DID approach. This raises the question of whether any unobserved
heterogeneity of apartments matched to the same subway station before and after entry might bias our
estimate. To address this, we estimate a model with grid fixed effects. Specifically, we use the geo-
coordinates of the apartments to partition the sample into 173,175 10m x 10m grids with an average of 2.3
apartments within each grid. The grid size is roughly the size of an average apartment, and multiple
apartments within the same grid are typically different floors of the same building, for which we use floor
number to control. The estimated effect (Table 2, column (e)) of bike sharing on subway housing gradient,
0.012 (s.e. 0.003), is similar to that using subway station fixed effects. Hence we are confident that
unobserved characteristics of apartments within each grid are unlikely to bias our results.
To further investigate the effect dynamics, Table 2, column (f) reports the estimated effect of bike
sharing by month. We find that the housing price gradient starts to respond 1 month after entry, and the
effect gets larger as time goes by. In the longer term, dockless bike sharing reduces the housing price
gradient by 1.3 ppts, which is in line with the estimated average effect in column (a).
Table 2, column (g) reports two-step estimates at the city-month level. After the entry of bike sharing,
the housing price gradient becomes flatter by 1.4 ppts, which is not statistically different from the estimate
using the DID model that controls for station fixed effects and city-year-month fixed effects. Given that
both approaches yield statistically identical results, we will use model (1) in the remaining analyses.
5.2. Nonlinear estimates
The above estimates assume that the housing price gradient is constant over all distances to subway.
However, as shown in online Appendix B, Figure B3, the nonparametrically estimated housing price
gradients are nonlinear both before and after the entry of dockless bike sharing. To capture the nonuniform
pattern, we re-estimate model (1) but replace the continuous variable Distist with indicators that an apartment
falls within 0-0.5 km, 0.5-1 km, 1.0-1.5 km, 1.5-2.0 km, or 2.0-3.0 km of the nearest station, with the last
segment as the reference group; this allows the gradients to vary by distance. In Figure 1, the blue dots and
line depict coefficient estimates before entry, the red ones estimates after entry, and the bars denote the
corresponding 95% confidence intervals.
[Insert Figure 1 here]
Consistent with the findings in Table 2, the estimated housing price gradients are negative and become
flatter after the entry of bike sharing. However, neither the slope nor its change (the gap between the two
lines) is uniform: The slope is the steepest between 0.5–2.0 km of subway station both before and after
entry; the entry of bike sharing “rotates” the gradient curve, which implies that the reduction in housing
11price premium is stronger for apartments closer to a subway (i.e., the more expensive ones).
5.3. Effect heterogeneity
The effect of bike sharing on subway housing price premium may vary across apartments, communities,
and cities. In Table 3, we examine the within-city heterogeneities by introducing three-way interactions
between distance to subway, entry of bike sharing, and apartment- or community-level moderators.
[Insert Table 3 Here]
Table 3, columns (a) and (b) report, respectively, the effect of bike sharing by apartment size and floor
number. The coefficient of distance x bike sharing represents the average effect size across all apartments,
while the coefficient of distance x bike sharing x moderator represents the change in the effect size as the
moderator increases by 1 standard deviation (for continuous moderators, normalized to zero mean and unit
standard deviation), or that the moderator possesses that property. We find that the effect of bike sharing is
centered on the previously estimated average effect, but is particularly large for larger and higher-level
apartments: A 1 standard deviation (42.7 m2) increase in apartment size is associated with a 63.6%
(0.007/0.011) increase in the effect over the average effect; a 1 standard deviation rise in floor number (7.8
stories) is associated with a 30.8% (0.004/0.013) increase over the average effect. Bigger and higher-floor
apartments tend to be priced higher. The direction of the effect is consistent with the following: Before the
availability of dockless bike sharing, people did not want to live in bigger or higher-floor—but distant—
apartments due to higher commuting costs and higher housing prices. After the entry of bike sharing,
however, they could afford to do so. Dockless bike sharing renders these types of apartments more attractive
and drives higher demand for them.
Table 3, column (c) reports the effect of bike sharing by whether an apartment falls within a school
district. The coefficient of distance x bike sharing x moderator stands for the difference in effect size
between apartments within and those outside a school district. The coefficient is statistically insignificant,
which means that the effect of bike sharing is not contingent on whether an apartment is within a school
district. This might be due to the balance of two conflicting considerations: On the one hand, dockless bike
sharing offers a convenient means of commuting to the subway for parents. On the other hand, children
under age 12 are not allowed to ride dockless shared bikes—and given the competitiveness of all kinds of
exams in China, parents may still prefer to live closer to subway stations to save their children’s commuting
time.
Next, we show how the effect of dockless bike sharing is moderated by local commuting conditions.
We measure commuting conditions in two ways to capture accessibility to a subway: Whether an
apartment’s closest subway station is a transit station—i.e., a station that connects several subway lines—
and the number of subway stations within a 3 km radius of an apartment. Columns (d)-(e) report estimates
12using each of the two measures. As before, the coefficients of distance x bike sharing are all positive,
significant, and close to that in Table 2, column (a). The coefficients of the three-way interactions are
significantly positive, which indicates that the effect of bike sharing on subway housing premium is stronger
for apartments that have advantageous commuting conditions, are i.e., near a transit station or have more
stations within 3 km. This further testifies to the complementarity of dockless bike sharing to subway
commuting.
We take two approaches to examine how the effect of dockless bike sharing varies across cities. First,
we estimate model (1) with city-specific coefficients for distance and the interaction between distance and
bike sharing. Second, we estimate model (1) separately for each city. The results are in online Appendix B,
Tables B2 and B3. We find downward-sloping housing price gradients in all cities, which reflects higher
housing prices near subway stations, but the magnitude differs substantially across cities. Tianjin has the
steepest housing price gradient of 6.9% per km, followed by Shanghai (6.5%), Dalian (5.7%), Beijing
(5.5%), and Wuhan (4.7%). The gradients are smaller in Chengdu (3.9%), Shenzhen (2.3%), Nanjing
(2.5%), Hangzhou (3.7%), and Chongqing (0.8%, not significant). The gradient is significantly attenuated
by the entry of dockless bike sharing: by 3.7 ppts in Shanghai, 2.9 ppts in Beijing, 2.1 ppts in Shenzhen,
2.0 ppts in Wuhan, and 1.5 ppts in Chongqing, all of which have large populations and extensive subway
networks. The attenuation in other cities is not statistically significant.
In reference to housing prices and disposable income, the impact of dockless bike sharing on housing
price gradients is huge. In Beijing, the housing price gradient drops by 52.7%, which is equivalent to 2.98
times the city’s per capita disposable income in 2016; the reduction amounts to 2.96 times the per capita
disposable income in Shanghai, 2.03 times in Shenzhen, and 0.81 times in Wuhan. In Chongqing, dockless
bike sharing completely flattens the housing price gradient.
5.4. Mechanisms
The above estimates indicate that the entry of dockless bike sharing is associated with a reduction in
the subway housing price gradient around subway stations and a narrower price gap between distant and
proximate apartments. In this subsection, we explore the mechanism through which the effect operates. As
we have proposed, dockless bike sharing increases the attractiveness of apartments distant from vis-à-vis
proximate to subway stations and shifts the former’s demand curve outwards. Anticipating this, sellers of
distant apartments may raise their listing prices and gain more bargaining power in price negotiations. Using
detailed data on housing prices and the transaction process, we empirically test the above mechanism.
We estimate model (1) with five outcome variables: initial listing price, frequency of visits by potential
buyers, last price, transaction price, and price adjustments before the transaction completes or by the end
of the data period. The initial price reflects the seller’s perceived value of the apartment; frequency of visits
13reflects buyers’ interest and purchase intention; the last and transaction prices are the prices in market
equilibrium; and the direction of price adjustment reflects the bargaining power of sellers and buyers. Hence,
the effect of bike sharing on these variables represents its effect on the supply side, the demand side, and
the market equilibrium, respectively.
Table 4, column (a) presents the estimates on initial prices. The coefficient of distance x bike sharing
is positive and significant (0.015, s.e. 0.003), which indicates that the entry of bike sharing reduces the
gradient of initial prices by over one-third (0.015/0.043). This suggests that when setting initial listing prices,
property owners already take into account the effect of dockless bike sharing on housing price.
[Insert Table 4 Here]
Next, column (b) shows the estimates on frequency of visits. The coefficient of distance to subway, -
0.018 (s.e. 0.005), implies that apartments proximate to subway stations attract more visits before the entry
of dockless bike sharing despite their higher prices: For every 1 km away from a subway, the number of
visits declines by 1.8%. The coefficient of distance x bike sharing, 0.016 (s.e. 0.006), means that the entry
of bike sharing increases visits to apartments farther from subway stations relative to proximate ones, which
indicates that potential buyers are more interested in the distant apartments. The post-entry distance
coefficient is no longer significant, which means that after the entry of dockless bike sharing, proximate
apartments no longer enjoy a significant premium in attracting viewers.
Table 4, columns (c) and (d) report, respectively, estimates on last prices for all apartments and
transaction prices for sold apartments. The coefficient of distance x bike sharing for last prices is positive
and has the same magnitude as that for initial prices; that coefficient for transaction prices, 0.013 (s.e. 0.005),
is about 27% of the subway housing price gradient. This implies that in equilibrium, dockless bike sharing
narrows the price gap between distant and proximate apartments by 27%.
Column (e) reports the estimates on price adjustment. The coefficients of distance to subway and
distance x bike sharing are both in the right direction, in that distant apartments tend to experience
downward price adjustments and the entry of dockless bike sharing causes their prices to adjust upward,
but they are not statistically significant. This implies that there is no significant difference in price
negotiation and adjustment process between apartments closer to and farther away from subway stations,
either before or after the entry of bike sharing.
Combining the effects on initial price, frequency of potential buyers’ viewing visits, last price,
transaction price, and price adjustments, we conclude that both the supply side and the demand side respond
to the entry of dockless bike sharing and jointly flatten the housing price gradient.
5.5. Welfare implications
Our analysis above indicates that dockless bike sharing generates considerable benefit for urban
14commuters by making subway services more accessible to people living farther from subway stations. From
a hedonic price approach, we interpret the housing price gradient as the compensating commuting costs for
living in distant apartments. Analogously, the reduction in the gradient can be interpreted as the reduction
in commuting costs due to the entry of dockless bike sharing.
In this subsection, we conduct a back-of-the-envelope analysis to recover the reduction in commuting
costs from the previously estimated change in housing price gradient. The calculation goes as follows. For
each apartment listed after entry (all with Bikect = 1), we use the estimates in Table 2, column (a) to predict
its total price (predicted price per m2 times size) and counterfactual total price as if there were no bike
sharing (Bikect = 0). Then we compute the difference between these two prices, which we treat as the
reduction in commuting costs during the buyer’s entire stay in the apartment. Next, we amortize the total
reduction in commuting costs into 30 years of residence8 to obtain the annual reduction in commuting costs.
We use China’s latest compound interest rate for 5-year fixed deposits (2.86% per annum) and 5-year
treasury bills (3.86% per annum), respectively, as the lower- and upper-bound of discount factors.
With these numbers, we estimate the annual reduction in commuting costs to be 1,893–2,217 CNY
(282–317 USD) per apartment, averaged across all apartments. To put this number in context, the starting
bus fare in these 10 cities is 2 CNY per ride, so the minimum commuting cost between home and subway
by bus will be 1,000 CNY per person and 2,000 CNY per household (assuming two commuters in one
household and 250 working days a year). The cost will be higher if households also (and very likely) go
out on weekends. In comparison, the cost of using dockless shared bikes is 20 CNY per month, 240 CNY
per year per person, and 480 CNY per household. These figures imply that dockless bike sharing
considerably reduces commuting costs for urban dwellers relative to the price of using shared bikes. In
other words, bike sharing companies do not fully internalize all of the benefits of providing dockless shared
bikes; the benefit of solving the last-mile problem is at least partly captured by buyers or sellers in the
housing market.
Our identification relies on price differences between distant and proximate apartments matched to the
same subway—but what causes the reduction in price premium, the price increase of distant apartments or
the price decrease of proximate apartments? Identifying the effect on absolute price changes requires that
housing prices be stationary in the absence of bike sharing’s entry. Unfortunately, since the city-year-month
fixed effects for the baseline model are jointly highly significant (F-statistic = 472.70, p-value < 0.001), the
stationarity assumption is apparently rejected. Thus, we cannot say more about the driving forces for the
entire sample. Instead, we look at a narrower time window (90 days before and after entry) for Beijing and
Shanghai—the two largest Chinese cities that experienced the biggest impact of bike sharing on subway
8
In China, residential buildings become eligible for demolition and reconstruction after 30 years of use. Online
Appendix C, Table C1 reports estimates using alternative discounting durations.
15housing gradient—and compare the actual price trajectory with the counterfactual trajectory without the
entry of bike sharing. As online Appendix C, Figure C1 shows, it seems it is the price increase of distant
apartments that narrows the price gap. We caution, however, that this result should not be overinterpreted
but rather taken as illustrative. This is because to make the plot, we control for city-year-month fixed effects
to detrend the data, but the entry of bike sharing changes the time trend: When we detrend, we also partial
out some of the treatment effects.
Potentially, dockless bike sharing reduces commuting costs via several channels. For people who walk
to subway stations, bike sharing offers a faster commuting option and hence saves travel time. For people
who first walk to bus stops and then take buses to subway stations, since riding a bike is less likely to be
subject to bad traffic during rush hour, dockless bike sharing can reduce their commuting time; this includes
waiting time for buses and commuting cost (riding a shared bike is cheaper than taking a bus). For people
who ride their own bikes, bike sharing saves not only the cost to purchase, maintain, and park their bikes,
but also the risk of having their bikes stolen or damaged. Moreover, with shared bikes, people no longer
need to return to the same subway station to pick up their own bikes. For people who do not travel by
subway because they live too far from a station, bike sharing provides them with easier access to the subway
and encourages them to substitute cheaper public transit for other more expensive commuting methods,
such as driving their own car or taking a taxi.
6. Validation
The above estimates indicate that the subway housing price gradient becomes flatter after the entry of
bike sharing. To identify this effect as causal, we inspect two critical assumptions underlying the DID
approach for causal interpretation: parallel pre-trends and the exogeneity of entry.
6.1. Testing for parallel pre-trends
The assumption of parallel pre-trends implies that absent bike sharing, the average prices of apartments
close to and farther from subway would have moved in parallel. In the absence of counterfactual price data
after the entry, a common test for this assumption is to check whether the prices of apartments at different
distances from a subway moved in parallel before the entry. Therefore, we estimate model (1) including
indicators for the first month up to the sixth month before the entry of bike sharing and their interactions
with distance to subway. As reported in Table 5, none of the coefficients for the interaction terms is
statistically significant. This suggests that the parallel trends assumption is satisfied.
[Insert Table 5 Here]
6.2. Testing for exogenous entry
The second assumption, the exogeneity of entry, refers to (1) the lack of correlation between the
16citywide entry of bike sharing and city characteristics, and (2) the lack of correlation between within-city
distribution of bikes and housing characteristics, especially housing prices. If this assumption is violated,
our estimates will capture the effect of confounders on both housing prices and the entry of bike sharing.9
We tackle the issue of endogenous entry from various perspectives. At the city level, we have included
city-year-month fixed effects to account for both time-invariant and time-varying confounders that may
affect the entry of dockless bike sharing. In addition, the institutional background on how local governments
regulate the entry of bike-sharing companies further alleviates any concern regarding endogeneity. Before
entering a city, a bike sharing company must submit a proposal to the municipal authority for approval.
Even if the company endogenously chooses the time to submit the proposal, it is unlikely that the time of
approval has any correlation with local socioeconomics, housing prices, or the price gap between
apartments at different distances to subway. Further, we conduct three tests on entry exogeneity at the city
level, as follows.
6.2.1 The Zervas, Proserpio, and Byers (2017) test
Inspired by Zervas, Proserpio, and Byers (2017), we construct a balanced panel dataset that comprises
240 city-year-month observations for the 10 cities over the period of January 2016 to December 2017. To
examine whether pre-entry city characteristics influence the entry decision of bike sharing, we estimate the
following regression model:
(3) Bikect = (Dt * Xc) θ + εct
where Bikect is the indicator for the presence of bike sharing in city c, year-month t. Dt represents the year-
month dummies, Xc represents pre-entry, time-invariant city characteristics, and εct is the error term. Our
Xc comprises four city-level variables at the end of 2015: population, annual GDP, annual subway ridership,
and annual average housing price. To avoid multicollinearity in the first and last few months when Bikect
equals 0 or 1 for all cities, we do not include city fixed effects.
We plot the estimates of θ with 95% confidence intervals in Figure 2. For ease of illustration, city
characteristics variables are standardized to have zero mean and unit standard deviation. As the figure
shows, all but one coefficient is statistically insignificant, which suggests that city characteristics do not
predict entry. This finding supports our argument that the entry of bike sharing is exogenous at the city
level.
6.2.2 The Bertrand, Duflo, and Mullainathan (2004) test
9
A common practice in testing this assumption is to run a triple-differences regression that includes cities or
apartments that do not have dockless bike sharing, but for which housing prices are equally affected by the confounders.
However, by 2017, Ofo and Mobike had entered all Chinese cities with a subway, and in each city, shared bikes could
be found in all communities due to the dockless feature and high mobility. Hence, the triple-differences approach is
not feasible in our context.
17Following the spirit of Bertrand, Duflo, and Mullainathan (2004), we estimate our baseline model using
generated random dates of entry. Given the multilevel structure of our empirical context and dataset, we
can assume that artificial entry dates differ across cities, subway stations, apartments, and even observations.
Allowing for variation in entry date within cities also helps to alleviate the endogeneity concern about the
distribution of bikes within each city. As shown in Table 6, the estimates for distance x bike sharing are all
attenuated toward zero. This is consistent with the fact that the fake entry dates can be viewed as classical
measurement errors.
[Insert Table 6 here]
6.2.3 The Seamans and Zhu (2013) test
We conduct a hazard rate test similar to that in Seamans and Zhu (2013) using the four city
characteristics, as in subsection 6.2.1. Estimates of the test are reported in online Appendix B, Table B4.
Since none of the estimates is statistically significant at the 5% level, it is reasonable to believe that pre-
entry city characteristics do not predict the entry of bike sharing, and thus the entry is exogenous at the city
level.
At the community level, the placement of shared bikes may not be random. Although subway station
fixed effects have controlled for confounders that vary across subway stations, it remains a concern that
shared bikes are more likely to concentrate in areas within a subway station that have higher demand. The
high mobility and park-anywhere feature of dockless shared bikes will randomize the distribution of new
bikes soon after they are released. The specification with 10m x 10m grid fixed effects (Table 2, column
(e)) helps alleviate this concern.
6.3. Alternative explanations
6.3.1. Contemporaneous changes in local socioeconomic conditions
The inclusion of city-year-month fixed effects does not rule out time-varying confounders within cities.
We take three approaches to tackle this issue.
First, we include district-specific year-month fixed effect in model (1). There are 108 districts in the 10
cities. These fixed effects can help to control for time-varying administrative and policy-related factors at
the district level, including the average number of shared bikes in each district each month. We obtain
nearly identical estimates (Table 7, column (a)) as the main specification.
Second, with 1,421 subway stations and 33 months, it is not statistically feasible to include subway-
year-month fixed effects and obtain significant estimates. Instead, we use the apartments’ geo-coordinates
to partition the sample into 388 6km x 6km grids with 3.7 stations in each grid, and estimate a model with
grid-year-month fixed effects. These fixed effects are a finer spatiotemporal control than district-year-
month fixed effects, and can capture time-varying factors specific to each grid, including the time-varying
18numbers of shared bikes in each grid. We obtain a consistent estimate of the effect of bike sharing on the
subway housing price premium (Table 7, column (b)). The estimate, 0.008 (s.e. 0.003), is highly significant,
but smaller than the baseline estimate. This is because apartments matched to the same station may be
divided into different grids, and thus their price gap is partially absorbed by the fixed effects.
Third, we limit our sample period before and after the entry of bike sharing, so that it is less likely to
capture contemporaneous changes in unobservables at the community level. In Table 7, columns (c) and
(d), we respectively limit the sample period to a 1-year window (183 days before and after entry) and a
half-year window (90 days on each side), and find that the effect remains positive and significant. The
estimates have smaller magnitude because they only capture the short-run impacts, whereas our original
estimates capture relatively long-run impacts.
[Insert Table 7 Here]
6.3.2. Anticipated entry of bike sharing
If the entry of bike sharing is anticipated, housing price gradients would start to flatten prior to entry
and our estimates will not fully capture the causal effects. However, as the parallel trends test in Table 5
suggests, there is no evidence of early reaction. Moreover, we conduct two additional tests to rule out this
possibility.
In many cities, Ofo was available on university campuses months before its official entry into the whole
city. If citywide entry were anticipated due to the presence of campus bikes, housing prices would start to
respond sometime between the entry to campuses and the entry to the whole city. In Table 7, column (e),
we show that the effect of bike sharing only appears after the citywide entry. The change in housing price
gradient between the campus entry and the citywide entry is merely 0.4 ppts and statistically insignificant.
Give this result, it is unlikely that Ofo’s entry to campuses creates market expectations of citywide entry.
Second, we consider anticipation of new subway stations. It is possible that prospective subway stations
will raise surrounding real estate values by reducing future commuting costs. However, the entry of bike
sharing may offset the price premium of properties near subway stations. To rule out this possibility, we
conduct a falsification test and estimate the effect of bike sharing on the housing price gradient against
distance to planned subway stations in Beijing—stations that are still in the planning or construction stage
and have no commuting value yet. In Table 7, column (f), we find that the gradients are flat and insignificant
both before and after the entry of bike sharing, therefore reject the hypothesis of anticipated entry.
In summary, the estimation above implies that anticipation cannot explain the identified effect of bike
sharing in our research.
6.3.3. Expansion of public transit system
As Bajic (1983) and Fesselmeyer and Liu (2018) find, expanding a subway network enhances the
benefit of living near an existing subway station and results in a steeper housing price gradient. This might
19You can also read