COVID-19 and the New York City Economy - ECONOMIC DEVELOPMENT QUARTERLY - March 2021
←
→
Page content transcription
If your browser does not render page correctly, please read the page content below
ECONOMIC
             DEVELOPMENT
             QUARTERLY

COVID-19
and the
New York City
Economy
March 2021
Contents

03   Executive Summary

04   Introduction

05   NYC Before and Since COVID-19

07   Defining Characteristics

09   Risk Factors and Impacts

22   Sustainability

24   Conclusion

26   Appendix

     Economic Development Quarterly, March 2021: COVID-19 and the New York City Economy
Executive Summary Recessions can inspire governments to adjust and implement policies to ensure that future economic shocks don’t cause the same devastating consequences. After the Great Recession, New York City invested heavily in diversifying its economy, which had in previous decades been over-reliant on a small number of industries. In part due to these investments, the city went on to add nearly a million private-sector jobs during the ensuing economic recovery. Yet, while job growth was high and the unemployment rate fell to historic lows, truly inclusive economic growth eluded NYC for much of the past decade. The COVID-19 pandemic impacted both the global economy and the NYC economy in unforeseen and unprecedented ways. While the city might have been more resilient in the face of another financial crisis, many industries that were better able to weather previous economic downturns were hit hardest by COVID-19. These include typically resilient industries that play outsize roles in the city’s economy, like tourism and education. But small businesses struggled too, seeing decreased revenue amid public health guidance and certain government policies—a situation amplified by the fact that these businesses generally have less cash on hand. The worker composition of the industries hit hardest by COVID-19 meant that some of the city’s most vulnerable neighborhoods faced even greater financial strain due to job losses among residents. The city’s density, erroneously cited early in the pandemic as a risk factor, in fact provided some benefits; it increases the likelihood that residents can find all daily essentials within their neighborhood. At the same time, the pandemic also highlighted how essential a truly robust, citywide transit system is—for transporting essential Economic Development Quarterly, March 2021: COVID-19 and the New York City Economy 2
workers to their jobs and for transporting all New Yorkers to a
vast variety of opportunities.

NYC’s economic diversity can help it add jobs in the next recovery.
But the City also needs to explore specific interventions to fix
the issues that COVID-19 laid bare, and to correct the failings of
previous recoveries. The full impact of COVID-19 is still unknown,
but it’s clear that the City can begin planning immediately for
important steps toward recovery.

Throughout history, NYC has successfully reinvented itself to
address major changes in the world’s economy. In the aftermath
of the Great Depression, the fiscal crisis of the 1970s, the 9/11
attacks, the Great Recession, and Superstorm Sandy, the city
persevered and bounced back stronger. There is now a chance
for the city to build back stronger than it was before. This paper
identifies industries, neighborhoods, and occupations that have
been most impacted by COVID-19. These can be the targets of
efficient, innovative interventions to help reinvent the city, and keep
it thriving. The economic recovery can be the engine that makes
NYC’s economy more inclusive, equitable, resilient, and sustainable.

Economic Development Quarterly, March 2021: COVID-19 and the New York City Economy   3
Introduction

The New York City economy has evolved significantly in the last few decades, with
technological innovation driving growth and sparking productivity gains across a wide range
of industries. The unprecedented magnitude of the decline in employment and production
heralded by COVID-19 has laid bare many flaws in existing economic and social structures.
Unlike in previous recessions, job losses during this crisis have been more significant for
workers with low wages. Since the downturn stems from a pandemic, understanding its
impact on the economy and healthcare system remains critical for any meaningful recovery
efforts. Before the COVID-19 pandemic ended a decade-long economic expansion in NYC,
the city economy added 980,000 private sector jobs—about a one-third increase—between
August 2009 and February 2020. However, due to poor labor market conditions and other
factors, nominal wages did not increase significantly for several years.

The public health crisis and measures taken so far continue to have second-order effects.
While we have seen the depth and speed of the decline caused by the virus, the exact duration
of the crisis is still not clear for sectors that involve in-person engagements, e.g., restaurants,
retail, tourism, and travel. Additionally, it will take some time for the scale of the eventual
economic damage to be ascertained, since long-term economic impacts are difficult to
measure in the face of too many unknowns. This has major implications for long-term
economic recovery. One of the most significant impacts of the COVID-19 recession has been
job loss. Apart from exacerbating existing inequalities, the virus’s impacts and remedies are
atypical. Also, considering that this is a pandemic-induced recession, sectors that were resilient
in the past might be on a different trajectory this time.

Throughout history, NYC has successfully reinvented itself to address major changes in
the world’s economy. This paper identifies new opportunities on the surely long road to
recovery, but as we navigate the uncharted waters of COVID-19, NYC’s status as a global
leader in finance and innovation will enable the city to reinvent itself. The pandemic presents
an opportunity to shape the vision of rebuilding a more inclusive, equitable, resilient, and
sustainable economy. Therefore, interventions must be truly future-oriented since their long-
lasting effects have implications for intergenerational equity and justice.

To the extent that maximizing employment is the major goal of most economic recovery plans,
special attention should be given to vulnerable industries and employees, while also focusing
on impactful industries that are identified via metrics of concentration and multipliers. This is
the focus of this report.

Economic Development Quarterly, March 2021: COVID-19 and the New York City Economy                4
NYC Before and Since COVID-19

                        Global economic picture and forecast
                        The COVID-19 pandemic has radically changed the global economic outlook. The World Bank
                        estimated a 4.3 percent contraction in global GDP in 2020, with per capita income contractions
                        in 2020 expected to be more widespread than at any other time since 1870, and growth in
                        developing countries at its weakest in over 60 years.1 In its October 2020 report, the IMF
                        estimated a 4.4 percent contraction for the year.2 Even with the World Bank’s projection of
                        a 4 percent increase in global economic output in 2021, this would still leave global output
                        5 percent below pre-pandemic projections.3

  Figure 1: Pre-pandemic NYC economic snapshot

   $776B Gross City Product
   $1.77T Gross Metro Product
   8.3M Residents
   3.1M Foreign-born residents
   46 Fortune 500 companies
   4.1M Private-sector jobs
   3.4% Unemployment rate
   1M Owner-occupied units
   2.1M Renter-occupied units

Source: Moody Analytics; Census Bureau Population Estimates Program; Mayor's Office of Immigrant Affairs Annual Report 2018; Fortune 500
2019; and New York State Department of Labor

                        NYC’s economy pre-COVID
                        The current recession marks the end of a decade-long economic expansion in NYC. From
                        August 2009 to February 2020, the city added 980,000 private-sector jobs, an increase of 31.4
                        percent. In other ways, however, the recovery was slow and weak. Due to poor labor market
                        conditions, worker bargaining power was low, and nominal wages did not increase significantly
                        for several years.4 (However, wage growth did accelerate toward the end of the decade.)
                        The 2008 global financial crisis and accompanying recession revealed high levels of income
                        inequality, poverty, and economic insecurity among NYC’s marginalized populations.

                        1
                            https://www.worldbank.org/en/news/press-release/2021/01/05/global-economy-to-expand-by-4-percent-in-2021-
                             vaccine-deployment-and-investment-key-to-sustaining-the-recovery
                        2
                            https://www.imf.org/en/Publications/WEO/Issues/2020/06/24/WEOUpdateJune2020
                        3
                            https://openknowledge.worldbank.org/bitstream/handle/10986/34710/9781464816123-Ch01.pdf
                        4
                            https://www.epi.org/nominal-wage-tracker/

                        Economic Development Quarterly, March 2021: COVID-19 and the New York City Economy                                 5
Citywide view – what has changed so far
COVID-19 dramatically changed NYC’s economic outlook over the course of a few months.
The city’s unemployment rate skyrocketed from a record low of 3.4 percent in February 2020
to a record high of 20.4 percent in June. The city lost 894,000 jobs from February to April
and added back only 308,000 in the following seven months. Approximately 5 percent of the
city’s population left the city in the first two months of the pandemic, while some of the city’s
wealthier neighborhoods saw close to 40 percent of residents leave.5 Worsening economic
conditions saw the City forecast a $9 billion revenue shortfall through the middle of 2021,
forcing a reduction in the City’s budget for fiscal year 2021.6 Some sectors of the economy
have made strides in recovering jobs that were lost: From May to November, Construction
gained back 72 percent of the jobs lost in March and April, while Retail Trade regained 55
percent of the jobs lost during the same period.
5
https://www.nytimes.com/interactive/2020/05/15/upshot/who-left-new-york-coronavirus.html
6
https://www.bloomberg.com/news/articles/2020-05-27/nyc-revenue-picture-worsens-with-shortfall-rising-to-9-
billion
Economic Development Quarterly, March 2021: COVID-19 and the New York City Economy 6Defining Characteristics
Addressing a unique recession
The current recession is unique and unprecedented; it also differs significantly from the most
recent downturn, the Great Financial Crisis of 2008–09. Globally, some of the countries that
have seen stronger economic recoveries are those that have gone on to manage to control the
pandemic most effectively.7 While most recessions have historically been characterized by a
relatively quick, “V-shaped” recovery, financial crises are typically followed by slower recoveries.
The unique nature of the current economic situation has caused some to term the economic
recovery a “K-shaped” recovery—one in which there is a divergence in fortunes between two
sets of people.8 A K-shaped recovery would exacerbate economic inequality, which has been
growing for the past few decades in the US.9 In the aftermath of a financial crisis, individuals
and institutions tend to face large debt burdens that make it less likely that they will borrow,
spend, or invest.10 However, the current crisis has been characterized by higher borrowing,
saving, and spending than might have otherwise been seen during a recession,11 12 due to
factors such as low interest rates and the $2.2 trillion Coronavirus Aid, Relief, and Economic
Security (CARES) Act.
Differentiating characteristics of the COVID-19 downturn
While no two recessions are the same, the current COVID-19-induced recession is particularly
unparalleled in both its depth and speed. Both factors are driven by the root cause of the
recession—a global pandemic that led to the shutdown of many businesses due to public
health concerns. According to data from Indeed, nationwide job postings saw continuous
improvement relative to 2019 levels after a May 2020 trough, though improvements slowed in
August, and through October, postings were 14 percent below the 2019 trend.13
7
https://www.imf.org/en/Topics/imf-and-covid19/Policy-Responses-to-COVID-19
8
https://www.fastcompany.com/90549147/forget-u-or-v-or-w-we-may-be-headed-toward-a-k-shaped-recovery
9
https://www.cnbc.com/2020/10/23/coronavirus-is-exacerbating-economic-inequality-in-the-us.html
10
https://www.gsb.stanford.edu/insights/why-was-last-recovery-slower-usual-actually-it-wasnt
11
https://www.cnbc.com/2020/10/23/coronavirus-is-exacerbating-economic-inequality-in-the-us.html
12
https://rooseveltinstitute.org/wp-content/uploads/2020/10/RI_-
RecoveringandStructuringAfterCOVID19_IssueBrief_202010.pdf
13
https://www.hiringlab.org/2020/11/05/job-postings-through-oct-30/
Economic Development Quarterly, March 2021: COVID-19 and the New York City Economy 7Figure 2: Percent job losses in recent recessions, NYC
5.0%
0.0%
Percent job losses
-5.0%
-10.0%
-15.0%
-20.0%
-25.0%
1 3 5 7 9 11 13 15 17 19 21 23 25 27 29 31 33 35 37 39 41 43 45 47 49 51 53 55 57 59 61 63 65 67 69 71 73 75 77 79 81
Months after peak employment
2001 2008 2020
Source: Current Employment Statistics, NYSDOL, data seasonally adjusted by OMB
The pandemic has resulted in a dual public health and economic crisis. Further progress in the
economic recovery will go hand-in-hand with progress in containing and reducing the spread of
the virus.
Economic Development Quarterly, March 2021: COVID-19 and the New York City Economy 8Risk Factors and Impacts
Density, crowding, and other risk factors
From the beginning of the COVID-19 pandemic, there was a perception that NYC’s density
determined its destiny in being an early epicenter of the virus.14 However, analyzing the pattern
of the spread of COVID-19 reveals other more significant risk factors. Studies have revealed
the unequal burden of COVID-19 on low-income populations, who are more likely to be people
of color, living in crowded multi-generational households, heavily reliant on public transit, less
likely to have internet access, and less likely to work from home.15
Further countering the perception around density, many rural and suburban communities
in the US went on to record high infection rates, despite seeing lower rates earlier in the
pandemic. There also were low infection rates in a number of densely populated cities in East
and Southeast Asia.
Notably, the existence of a strong correlation between crowding and COVID-19 cases
suggests how different socioeconomic groups are affected.16 Analysis of American
Community Survey data reveals that minorities made up roughly 69 percent of the population
in the 10 most crowded NYC neighborhoods.17 This proportion drops to 43 percent among
the 10 least crowded neighborhoods, further suggesting inequalities among various NYC
populations. In addition, further correlation analysis from NYCEDC suggests that income is
a strong determinant in how a community is affected by the pandemic. An increase in the
median income of a neighborhood is associated with a corresponding decline in the case
rate (Table 1).
Table 1. Number of positive cases and median income brackets per NYC zip code.
Income bracket ZCTA count* Confirmed cases Percent positive Cases per 100,000
Less than $50,000 40 84,584 10.0% 3,379
$50,000 to $74,999 72 121,029 9.7% 3,321
$75,000 to $99,999 33 35,486 8.1% 2,901
$100,000 to $124,999 17 9,808 3.9% 1,698
$125,000 to $149,999 10 5,578 3.7% 1,590
$150,000 and higher 7 502 3.4% 1,356
Total 179 256,987 8.7% 3,083
*ZCTA – ZIP Code Tabulation Area
Source: NYC Department of Health and Mental Hygiene; accurate as of 11/11/2020.
14
https://www.nytimes.com/2020/03/23/nyregion/coronavirus-nyc-crowds-density.html
15
“COVID-19 Cases in New York City, a Neighborhood-Level Analysis,” NYU Furman Center, April 10, 2020,
https://furmancenter.org/thestoop/entry/covid-19-cases-in-new-york-city-a-neighborhood-level-analysis.
16
Yu Zhong and Bertrand Teirlinck, “Density and its Effect on COVID-19 Spread,” NYCEDC, October 2020,
https://edc.nyc/density-and-its-effect-on-covid-19-spread.
17
Minority defined as all population that does not identify as “White Alone.”
Economic Development Quarterly, March 2021: COVID-19 and the New York City Economy 9Further analysis also reveals similar findings when an area’s general educational attainment is
considered: As the educational attainment rises, case rate falls. These findings are consistent
with borough-level analysis—Manhattan has higher levels of education and income and has
fewer confirmed cases relative to other boroughs (Table 2). This points to the fact that higher-
income populations—often more educated than lower-income ones—are more often able to
work from home and, in some cases, move to a second home during the crisis.
NYC data highlight the importance of wealth and socioeconomic status in navigating a
health crisis such as this one, along with the importance of the City’s ongoing effort to foster
an inclusive economic recovery that addresses existing systemic inequalities.
Table 2: Confirmed COVID-19 cases in NYC (as of September 25, 2020)
Borough Persons/sq. mile (2019 est.) Percentage of positive tests Case rate per 100,000 people
The Bronx 34,078.20 12.80% 3,625.90
Staten Island 8,157.90 12.10% 3,236.00
Queens 21,088.30 11.70% 3,056.50
Brooklyn 36,470.30 9.60% 2,473.10
Manhattan* 56,485.10 5.80% 2,302.70
* Assumes 20% population outflow for Manhattan
Source: Demographics from U.S. Census Bureau; Cases data from NYC Department of Health and Mental Hygiene
A recent World Bank article18 argues that urban density could be a blessing when it comes to
fighting the virus—that, in fact, crowding, income, race/ethnicity, and educational attainment
are equally important in determining the transmission mechanism.19 This resonates when we
consider how dense urban communities support high-quality infrastructure that can provide
faster emergency response times during a crisis. In addition to better hospital staffing and a
greater concentration of intensive-care beds and other healthcare resources, density also
makes neighborhoods more resilient during disasters, offering alternative services either within
walking distance or through delivery services when travel becomes an issue.
Impact on higher education
Universities around the country were forced to order two-week lockdowns shortly after
opening for the 2020–2021 school year; the future of in-person, on-campus instruction
remains unclear, with major implications for universities and businesses across the world.
The city’s private colleges and universities employ over 90,000 people and have a total payroll
of over $9 billion.20 The public City University of New York (CUNY) system employs over
45,000 staff. Over 600,000 students are enrolled in a college or university in NYC at the
18
https://blogs.worldbank.org/sustainablecities/urban-density-not-enemy-coronavirus-fight-evidence-china
19
https://www.washingtonpost.com/health/income-emerges-as-a-major-predictor-of-coronavirus-infections-along-
with-race/2020/06/22/9276f31e-b4a3-11ea-a510-55bf26485c93_story.html
20
BLS, Quarterly Census of Employment and Wages, 2019
Economic Development Quarterly, March 2021: COVID-19 and the New York City Economy 10undergraduate, graduate, or professional level.21 While higher education didn’t suffer acutely
during the Great Recession, COVID-19 has raised many difficult questions for higher education
in NYC, an ecosystem that largely relies on the sharing of indoor space for living, learning,
teaching, and working.
Impact on tourism
Tourism is a $70 billion industry in NYC—67 million people visited the city in 2019, capping 10
consecutive years of growth.22 Shutdown orders in March 2020 closed off much of the city’s
tourism economy, including restaurants and bars, hotels, museums, and Broadway. While the
March shutdown orders were driven by the COVID-19 spike in NYC itself, the City also imposed
quarantine orders in subsequent months on visitors from designated states with high rates of
COVID-19 infection.23
Efforts to spur tourism in the short term will, by necessity, focus on people living in the New
York area.24 According to a December 2020 estimate by NYC & Company, tourism will end
up having fallen to 22.9 million visitors in 2020, a 66 percent drop from 2019.25 A strong
resurgence of the city’s tourism industry is important from an equity perspective as well. In
the Accommodation and Food Services industry, which benefits greatly from visitors to the
city, 78.3 percent of workers are people of color, compared to 59.8 percent of workers citywide.
Figure 3. Total visitors to NYC, 2017–2019
70
60
50
40
30
20
10
0
2017 2018 2019
Domestic Visitation (millions) International Visitation (millions)
Source: NYC & Company
Impact on small business
The virus has disproportionately affected a wide array of small businesses—a key feature of
NYC’s economy, accounting for about 95 percent of all businesses (Figure 4). Further, small
businesses are largely labor-intensive and generally have low cash on hand, making them most
vulnerable to situations of low or no revenue.
21
US Census Bureau, American Community Survey, 5-year estimates 2014-2018
22
https://www.washingtonpost.com/national/when-will-new-york-reopen-to-tourists/2020/05/15/981bfb0e-939a-
11ea-82b4-c8db161ff6e5_story.html
23
https://www.nycgo.com/coronavirus-information-and-resources-for-travelers
24
https://www.nytimes.com/2020/07/24/nyregion/nyc-tourism-coronavirus.html
25
https://www.ny1.com/nyc/all-boroughs/news/2020/12/03/this-is-what-tourism-looks-like-in-nyc-right-now
Economic Development Quarterly, March 2021: COVID-19 and the New York City Economy 11One of the most significant economic impacts of the COVID-19 recession has been job loss
and, unlike in previous crises, job losses during this pandemic-induced recession have been
more significant for low-wage workers. The concomitant labor market polarization has major
implications. The more inequality that exists in an economy, the less likely it is for economic
growth alone to sufficiently lift up those at the bottom.
Figure 4: NYC small business employment by industry
Restaurants &
Hotels, 206,721
Retail,
183,898
Other, 814,537
Health Care and
Social
Assistance,
151,882
Restaurants & Hotels Retail Health Care and Social Assistance Other
Source: NYCEDC and NYC QCEW public and microdata
While small businesses are important to the city’s economy from a payroll and jobs
perspective, they are also an important component of an inclusive recovery from an equity
perspective. Among others, uncertainty and structural factors perpetuate wage depression
in the aftermath of a recession. The cyclicality of the labor share of output, especially
following a recession, has received considerable attention in the literature.26
Contemporary evidence on the labor market effects of the pandemic, along with changes in
labor costs, shows that low-wage, essential workers are worse off.27 28 29 Over the last five
decades, economic activity in the US has gradually moved from small, often labor-intensive
businesses, to large, capital-intensive ones (Figure 5). While this shift has been one of the key
drivers of income and wealth inequality over the years, it is often not within a typical firm.
This has led to the emergence of “superstar firms” with market power in key sectors of the
economy—firms like “big box” retailers and large tech companies.30
26
https://www.brookings.edu/bpea-articles/the-decline-of-the-u-s-labor-share/
27
https://www.bls.gov/covid19/effects-of-covid-19-pandemic-on-productivity-and-costs-statistics.htm
28
https://www.bls.gov/opub/mlr/2020/article/covid-19-shutdowns.htm
29
https://www.brookings.edu/research/the-initial-impact-of-covid-19-on-labor-market-outcomes-across-groups-and-
the-potential-for-permanent-scarring/
30
David Autor, David Dorn, Lawrence F Katz, Christina Patterson, John Van Reenen, “The Fall of the Labor Share and
the Rise of Superstar Firms,” The Quarterly Journal of Economics, Volume 135, Issue 2, May 2020, Pages 645–
709, https://doi.org/10.1093/qje/qjaa004
Economic Development Quarterly, March 2021: COVID-19 and the New York City Economy 12Figure 5: Share of labor compensation in GDP in the US
66.0%
65.0%
64.0%
63.0%
62.0%
61.0%
60.0%
59.0%
58.0%
57.0%
56.0%
55.0%
70
72
74
76
78
80
82
84
86
88
90
92
94
96
98
00
02
04
06
08
10
12
14
16
19
19
19
19
19
19
19
19
19
19
19
19
19
19
19
20
20
20
20
20
20
20
20
20
Source: Federal Reserve Bank of St. Louis; bars indicate approximate start dates of US recessions
If maximizing employment is a goal of the economic recovery, then it follows that efforts
should focus on particularly vulnerable industries and/or those that might merit government
aid, either due to low cash on hand or a high number of essential workers.
Special attention should be accorded to vulnerable industries (identified via metrics of
business resiliency like cash on hand and metrics of COVID-19 impacts) and vulnerable
employees (lower-wage earners in less-vulnerable industries). At the same time, there should
be a focus on impactful industries (identified via metrics of employment/businesses
supported and small business concentration, along with economic multipliers and other
modeling tools like RIMS31 and REMI32).
31
Regional Input-Output Modeling System
32
Regional Economic Models, Inc.
Economic Development Quarterly, March 2021: COVID-19 and the New York City Economy 13Based on these criteria, the following industries emerge as potential priorities for
targeted relief:
Industry Vulnerability Impact
Non-grocery Retail Outlier in terms of low cash on hand (19 days Relatively large industry—nearly 15,200 small businesses
(NAICS codes 441- median); COVID-19 impacts are significant due employ over 55,800 NYC workers; industry skews heavily
444 & 447-453) to public health guidance, government policies, towards small businesses, and it is an impactful industry
reduced tourism (8.1-12.6 jobs per $1 million demand shock)
Restaurants Lowest cash on hand (16 days median 20,900 small businesses employ nearly 195,000 workers;
(NAICS code 722) nationwide); severe demand slump $1 million demand shock supports 15.5 jobs
Social Assistance Generally serves a financially vulnerable 4,900 small businesses employ nearly 52,000 workers; $1
(NAICS code 624) population million demand shock supports 15.3 jobs
Personal Services Low cash on hand (national median 21 days) 6,300 small businesses employ nearly 25,600 workers; $1
(NAICS code 8121) million demand shock supports 21.7 jobs
Fitness and Revenues highly impacted by COVID-19 1,000 small businesses employ about 11,200 workers; $1
Recreation million demand shock supports 12.8 jobs
Businesses (subset
of NAICS code
7139)
Laundromats Low cash on hand (national median 23 days) 2,770 small businesses employ about 8,400 workers; $1
and Dry Cleaners million demand shock supports about 14.5 jobs
(NAICS code 8123)
Repair Workers for Low cash on hand (national median 18 days) 3,100 small businesses employ about 13,800 workers; $1
Household million demand shock generates 8.4 to 11.4 jobs
Appliances (NAICS
code 811)
Taxi Workers Large demand slump due to public health 87 small businesses employ over 3,500 workers; $1 million
(NAICS code guidance and COVID-19 policies demand shock generates about 13.6 jobs
48531)
Hotels Low cash on hand (16 days median); significant Largely dominated by bigger hotels; 660 small hotels
(NAICS code 721) demand slump due to COVID-19; NYC employ over 12,000 workers; $1 million demand shock
occupancy fell from above 90% to 15% generates about 9 jobs
Doctor and Dentist Decrease in discretionary visits due to COVID-19 14,700 small businesses employ nearly 83,000 workers; $1
Offices (NAICS million demand shock generates about 9.8 jobs
code 621)
“Street level retail” (in addition to hotels, social assistance organizations, and low-wage
workers in doctor and dentist offices) is a compelling yet simple framework for thinking about
businesses facing the largest likely revenue declines and meriting priority City assistance.
We provide a “street level retail” definition by NAICS code in Appendix I.
Measuring vulnerability: business resiliency metrics
In an attempt to measure vulnerability for small businesses, we build upon JP Morgan
Research Institute’s 2016 report “Cash is King: Flows, Balances, and Buffer Days” to identify
less resilient industries.33 We highlight four industries that have relatively low levels (in
dollar- and day- terms) of cash on hand.
33
https://www.jpmorganchase.com/content/dam/jpmc/jpmorgan-chase-and-co/institute/pdf/jpmc-institute-small-
business-report.pdf
Economic Development Quarterly, March 2021: COVID-19 and the New York City Economy 14Table 3: Cash-on-hand analysis
# of small Median daily Median cash Median days
businesses in NYC outflow on hand of cash on hand
Construction 12,447 $473 $11,545 20
Health Care Services 20,795 $623 $21,147 30
High-Tech Manufacturing 283 $967 $36,900 32
High-Tech Services 4,275 $404 $15,537 33
Metal & Machinery 2,213 $809 $26,434 28
Other Professional Services 21,923 $398 $15,213 33
Personal Services 10,394 $233 $5,718 21
Real Estate 19,556 $269 $15,105 47
Repair & Maintenance 9,723 $293 $6,366 18
Restaurants & Hotels 21,575 $1,033 $17,263 16
Retail 29,684 $441 $10,250 19
Wholesalers 12,794 $699 $19,960 23
Other Industries 52,330 N/A N/A N/A
Total 217,992 $404 $13,055 27
Note: Business counts are NYC-specific using Quarterly Census of Employment and Wages (QCEW) data. Daily outflow, cash on hand, and days
of cash on hand are national level data from JP Morgan Research Institute inflated to 2020 dollars.
Measuring impact: employment and business metrics
Below is a high-level picture of private employment in NYC by industry, with smaller industries
omitted for brevity. This reveals industries with the highest number of small businesses or
highest levels of employment at small businesses: Accommodation and Food Services, Retail
Trade, and Other Services (think personal services like salons and barbers). The Health Care
and Professional, Scientific, and Technical Services industries are large industries, but they pay
relatively higher wages. So, targeted interventions aimed at industries with lower-wage workers
(or supporting employers to retain low-wage employment) may be more beneficial.
Economic Development Quarterly, March 2021: COVID-19 and the New York City Economy 15Table 4: NYC private employment by industry
Total number
Total number of employees
Total number of Total number of small at small
2 Digit NAICS Code and Description establishments of employees establishments establishments
23: Construction 14,702 153,517 12,447 77,709
42: Wholesale Trade 14,673 131,483 12,794 76,729
44–45: Retail Trade 32,843 344,163 29,684 183,898
52: Finance and Insurance 12,258 330,183 10,400 94,049
53: Real Estate and Rental and Leasing 21,287 132,799 19,556 94,863
54: Professional, Scientific, and Technical Services 30,688 399,267 25,148 143,457
62: Health Care and Social Assistance 24,153 714,329 20,795 151,882
72: Accommodation and Food Services 24,629 367,196 21,575 206,721
81: Other Services (except Public Administration) 36,409 174,942 33,528 117,765
NYC Private Sector Totals 252,422 3,679,840 217,992 1,357,038
Note: Industries with fewer than 50,000 employees at small establishments have been omitted.
Source: Quarterly Census for Employment and Wages (QCEW), NYC public and microdata.
Measuring impact: economic multiplier metrics
The table below shows the total employment effects (direct + indirect + induced) of a $1
million positive demand shock. It is worth noting that Social Assistance includes Individual and
Family Services; Community Food and Housing, and Emergency and Other Relief Services;
Vocational Rehabilitation Services; and Child Day Care Services. Code 485 includes taxi drivers,
and code 713 includes fitness and recreation facilities and bowling alleys.
Table 5: Employment multipliers
NAICS code & industry description Jobs created per $1M industry purchase
722: Food services and drinking places 15.51
624: Social assistance 15.34
485: Transit and ground passenger transportation 13.61
445: Food and beverage stores 13.29
623: Nursing and residential care facilities 13.28
713: Amusement, gambling, and recreation industries 12.77
452: General merchandise stores 12.59
561: Administrative and support services 12.40
711, 712: Performing arts, spectator sports, museums, and related activities 12.14
611: Educational services 11.93
Note: The high multiplier industry of “forestry, fishing, & related activities” are excluded due to the very small size of the industry.
Economic Development Quarterly, March 2021: COVID-19 and the New York City Economy 16Essential vs. non-essential
Essential employment in NYC – strict definition
Another potential reason for companies or industries to be considered for targeted aid is
having large numbers of essential workers. Using New York State Executive Order 202.6
(as of March 25, 2020) as a guideline to estimate the types of businesses and employees
deemed essential, NYC’s Department of City Planning (DCP) assembled a list of NAICS codes
deemed essential. Based on NYCEDC’s analysis, using QCEW data from 2019: Q3, 128,199
private businesses meet the strict definition of “essential” and those firms employ 2.2 million
NYC workers.
The specific codes deemed essential by DCP can be found in Appendix II.
Essential employment in NYC – “common sense” definition
Building on the work above, NYCEDC developed a set of assumptions about what industries
meet the “common sense” definition of “essential” private employment. The DCP framework is
used as the baseline, with further adjustments based on professional judgment and research.
NYCEDC estimates34 that 93,541 private businesses meet the “common sense” definition of
“essential,” and those firms employ 1.7 million NYC workers.
Regardless of the definition of “essential,” it is clear that a large portion of the NYC workforce
should be considered for targeted aid as part of the city’s recovery.
Specific codes and industries deemed essential, and differences between the two
methodologies, are outlined in detail in Appendix II.
Demographic data on COVID-19 impacts
Income loss by race and gender
Research has highlighted disproportionate income losses for middle-income Black and
Hispanic Americans, compared to white Americans. University of Chicago’s National Opinion
Research Center published findings from a survey administered to a representative sample of
the US population and found that 42 percent of people of color earning an income of $45,000
to $75,000 experienced income loss, compared to just 26 percent of white Americans in the
same income range.35
34
Our approach dives deeper into the 4-digit sectors and refines existing assumptions. We believe consumer spending
on durable goods like automobiles and home appliances is likely to decline in the coming months, as households
defer purchases until the economic crisis is over. Therefore, it is likely that firms in Sector 4236—Household
Appliances and Electrical and Electronic Goods Merchant Wholesalers—might have pared back workforces to maybe
50 percent of normal levels. This exercise is conducted for each 4-digit sector in Sector 42.
35
https://www.chicagobooth.edu/research/rustandy/blog/2020/how-are-americans-coping-with-the-covid19-crisis-7-
key-findings
Economic Development Quarterly, March 2021: COVID-19 and the New York City Economy 17Figure 6: Income loss due to COVID-19, by race, US
70
60
% of workers affected
50
40
30
20
10
0
Less $15K $15-30K $30-45K $45-75K $75K+
White People of Color
Source: University of Chicago Poverty Lab
Communities of color can less afford to face the health and income effects of COVID-19 in
NYC. Across the five boroughs, people of color are less likely to have health insurance (Table 6)
and more likely to be rent-burdened (Figure 7).
COVID-19 may also accelerate a shift in the skills demanded in the labor market—toward
skills that are correlated with higher education. This shift in demanded skills will also likely
impact male and female workers differently. High- and middle-wage-earning women are
more likely to hold a college degree than men (63 percent to 53 percent in NYC), and therefore,
women may have an easier transition into new middle- and high-wage employment
opportunities than men will.
Table 6: Health insurance: uninsured rates by borough and race
Percent uninsured The Bronx Brooklyn Manhattan Queens Staten Island
Civilian noninstitutionalized population 9.70% 8.20% 5.80% 10.50% 4.90%
Race and ethnicity
White, Non-Hispanic 5.6% 5.4% 3.1% 5.2% 2.9%
Black or African American alone 8.3% 7.9% 7.3% 7.3% 5.9%
American Indian and Alaska Native alone 9.4% 14.1% 13.6% 13.6% 5.8%
Asian alone 6.8% 7.4% 5.5% 12.0% 6.2%
Some other race alone 12.8% 19.6% 12.0% 17.9% 13.2%
Two or more races 6.8% 6.6% 9.0% 7.6% 4.4%
Hispanic or Latino (of any race) 11.1% 14.7% 9.9% 16.2% 10.5%
Source: ACS 2018 5-year estimates
Economic Development Quarterly, March 2021: COVID-19 and the New York City Economy 18Figure 7: People of color represent a higher share of rent-burdened NYC residents
Severely rent burdened 34% 66%
Rent burdened 37% 63%
Not rent burdened 44% 56%
0% 20% 40% 60% 80% 100% 120%
White People of Color
Source: ACS 2018 5-year estimates
Women’s labor is less volatile overall compared to men’s labor. 40 percent of women and only
20 percent of men work in Government and Education and Health Services, where employment
is countercyclical to the business cycle. The most cyclical sectors, Manufacturing,
Construction, and Trade, Transportation, Utilities, account for 46 percent of male employment
and 24 percent of female employment.36
The combination of higher education attainment and less volatile sector employment will likely
offer women protections as jobs become more automated. This is supported by McKinsey
Global Institute’s future of work analysis, which predicts men being displaced at slightly higher
rates than women and women being able to capture a greater percentage of new jobs.37
However, women have not been unaffected by the economic impacts of COVID-19. With social
distancing rules in effect, many New Yorkers are trying to balance telecommuting with unpaid
work (like cooking and childcare), and these responsibilities likely are disproportionately falling
on women. One survey by Morning Consult found that 70 percent of women say they’re fully
or mostly responsible for housework during lockdown, and 66 percent say so for childcare.38
A Boston Consulting Group survey in April 2020 found that US parents have nearly doubled the
time spent on education and household tasks, from 30 to 59 hours, and women are taking on
a greater share of the additional time.39 The University of Chicago researchers also found that
women are facing income loss at similar rates of incidence as men, with lower earners facing
higher probabilities of income loss.40
36
Ibid
37
McKinsey Global Institute “Future of Work in America” pg. 67
38
https://www.nytimes.com/2020/05/06/upshot/pandemic-chores-homeschooling-gender.html
39
https://www.bcg.com/en-us/publications/2020/helping-working-parents-ease-the-burden-of-covid-19
40
https://www.chicagobooth.edu/research/rustandy/blog/2020/how-are-americans-coping-with-the-covid19-crisis-7-
key-findings
Economic Development Quarterly, March 2021: COVID-19 and the New York City Economy 19Figure 8: Income loss due to COVID-19, by gender, US
70
60
% of workers affected
50
40
30
20
10
0
Less $15K $15-30K $30-45K $45-75K $75K+
Men Women
Source: University of Chicago Poverty Lab
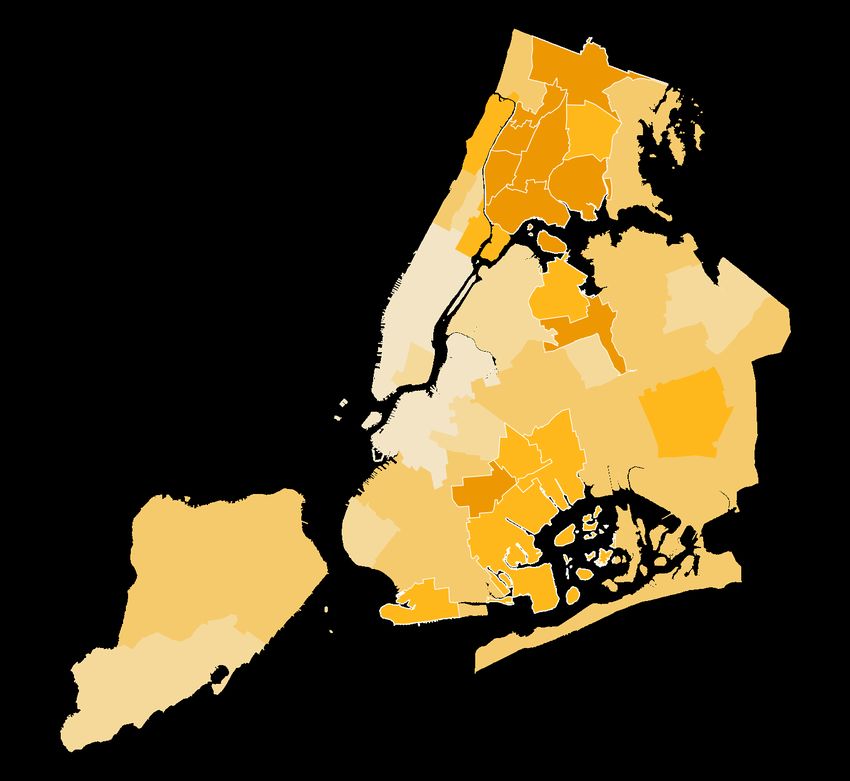
Geographic distribution of workers in most at-risk industries
Within NYC, some neighborhoods have faced a higher burden due to COVID-19, both in the
form of health impacts and economic losses. The same is true if we forecast losses in resident
employment by neighborhood over the next few years. To conduct this analysis, we created a
citywide forecast of cumulative employment losses by industry for the years 2020 to 2024.
We then imputed the citywide results at a neighborhood level (using Public Use Microdata
Area, or PUMA), based on each PUMA’s breakdown of resident employment by industry. In
part, though forecasting employment loss only by industry, this map reflects where the people
live who work in industries that have been hardest hit by COVID-19. Of the 15 PUMAs projected
to have the largest cumulative job losses, eight are in the Bronx, five are in Brooklyn, and
two are in Queens. Figure 9 shows job loss projections by PUMA; the 15 PUMAs with the
highest projected job losses are highlighted. A 2020 report by Opportunity Insights found that
job losses at NYC small businesses were largest for firms in affluent areas, due to reduced
spending in these areas. Low-income earners working in high-income neighborhoods were
most likely to lose their jobs, resulting in the vulnerability of affluent neighborhoods spreading
to other parts of the city.41
41
https://opportunityinsights.org/wp-content/uploads/2020/06/tracker-summary.pdf
Economic Development Quarterly, March 2021: COVID-19 and the New York City Economy 20Figure 9: Job loss projections
Total job change (%)
-16.7% – -20.4%
-20.5% – -23.5% 8
-23.6% – -25.3% 2
-25.4% – -26.9% 15
1
-27.0% – -29.1% 4
5
7
Top 15 neighborhoods by Job Loss Percentage 3
1. Morris Heights, Fordham South & Mount Hope (-29.1%)
2. Bedford Park, Fordham North & Norwood (-28.7%)
3. Hunts Point, Longwood & Melrose (-28.2%)
4. Belmont, Crotona Park East & East Tremont (-28.1%)
5. Concourse, Highbridge & Mount Eden (-27.8%) 14
6. East Flatbush, Farragut & Rugby (-27.7%)
7. Castle Hill, Clason Point & Parkchester (-27.3%) 9
8. Wakefield, Williamsbridge & Woodlawn (-27.1%)
9. Elmhurst & South Corona (-27%)
10. Brownsville & Ocean Hill (-26.7%)
11. East New York & Starrett City (-26.5%)
12. Brighton Beach & Coney Island (-26.4%)
13. Canarsie & Flatlands (-26.1%) 11
14. Jackson Heights & North Corona (-25.8%) 10
15. Pelham Parkway, Morris Park & Laconia (-25.8%)
6
13
12
Source: New York City Health Department COVID-19 Data; NYCEDC Economic Research & Policy COVID Scenario Modeling of 2020–2024
What does this mean for equity and inclusion in NYC?
Clearly, COVID-19 has perpetuated and deepened existing inequalities. The overarching
trend for the past 50 years of industry consolidation and falling labor share of income is
likely to continue or accelerate during this crisis. As such, practices that favor economic
activity reallocation with asymmetric, distortionary impact on labor’s share of output can
only exacerbate existing gaps. Policy interventions must prevent a further erosion of labor’s
share of GDP, and the concomitant increase in inequality. One way to address this inequality
in the labor market is to provide tax incentives that augment or protect labor, rather than
predominantly subsidizing investment in capital. Another potential intervention is to advocate
for improvement in worker benefits, including improved childcare, improved paid leave
options, and consistent scheduling practices.
Economic Development Quarterly, March 2021: COVID-19 and the New York City Economy 21Sustainability
What COVID-19 has revealed about the environment and economy
The COVID-19 pandemic has drastically slowed down the global economy, and if there is a
silver lining, it is the fact that the world’s carbon footprint is significantly diminished as a result.
Emissions of nitrogen dioxide, for example, have dropped 20–40 percent in cities in China,
Europe, and the US.42 The visible difference between the pre-COVID world and the world of the
pandemic shines a harsh light on just how unsustainable pre-pandemic emissions were.
The United Nations Environment Programme predicts that even if all commitments under the
Paris Agreement are implemented, global temperatures will rise by 3.2 degrees Celsius by
2100.43 Just as COVID-19 has magnified global inequality, future pandemics and catastrophic
weather events triggered by climate change would disproportionately hurt the poor.44 Within
the US, there are racial disparities in air pollution exposure—non-Hispanic whites experience
17 percent less air pollution exposure than is caused by their own consumption, while Blacks
and Hispanics experience 56 percent and 63 percent excess exposure, respectively, relative to
their consumption.45
Recent evidence shows how housing policy also has played a role in creating disparities in
the temperatures felt by different neighborhoods within the same city. In the New York
area, neighborhoods that were “redlined” by the federal government in the 1930s today face
summer temperatures that are 1.6 degrees above the area average, while A-graded “best”
neighborhoods per the 1930s guidelines today experience summer temperatures 4.2 degrees
lower than the area average. Redlined neighborhoods tend to have fewer trees and more
paved surfaces.46
Potential policies to address sustainability goals
It is possible to address both the economic crisis and the climate crisis at the same time.
Economies around the world are in need of stimulus packages; such packages could include
investments in renewable energy, smart buildings, smart cities, public transit, and sustainable
food and agriculture systems.47
Longer commutes and ownership of multiple vehicles are associated with larger footprints;
housing policy that accommodates more people living in denser, more transit-accessible parts
of the region could have the effect of reducing carbon emissions per household. For instance,
in the immediate aftermath of the pandemic, the notion of car-free streets as a way to reduce
42
https://www.wri.org/news/distance-clean-air-post-covid-19
43
https://www.unenvironment.org/news-and-stories/story/covid-19-four-sustainable-development-goals-help-future-
proof-global
44
https://www.iisd.org/library/coronavirus-shaping-sustainable-development
45
https://www.pnas.org/content/116/13/6001
46
https://www.nytimes.com/interactive/2020/08/24/climate/racism-redlining-cities-global-warming.html
47
https://www.unenvironment.org/news-and-stories/story/covid-19-four-sustainable-development-goals-help-future-
proof-global
Economic Development Quarterly, March 2021: COVID-19 and the New York City Economy 22emissions in NYC quickly moved to the front burner of the policy debate.48 At the state level,
New York aims to achieve 70 percent renewable energy by 2030, which compares to current
energy usage that is 28 percent renewable.49 At the local level, NYC’s Local Law 97 sets
carbon caps for buildings starting in 2024 and will require the retrofitting of approximately
50,000 buildings in 10 years. This will create an estimated $20 billion retrofit market over the
next decade.50
Another trending sustainability goal is to increase the circularity of industries across the city,
in order to reduce waste for things like textiles, construction materials, or food. In the coming
years, the Biden-Harris administration’s climate plans could see increased investments in
transit, infrastructure, clean energy, and environmental justice.51
Finally, public transit itself is integral to the region’s economy, and must be a part of any
sustainability discussion. Many of the city’s most vulnerable communities rely heavily on
public transit. The year 2020 saw an increase in alternative transit choices such as cycling,
and in some ways the pandemic provided a blueprint for how a “15-minute neighborhood”
could function—a scenario in which residents of a neighborhood can access all of life’s daily
essentials in a short trip.52 53 Nevertheless, this would not lessen the need to maintain and
fund robust, citywide public transit services, which allow people to access higher quantities
and varieties of jobs, allow the city to accommodate more people, and lessen the dependency
on automobiles.
48
https://www.nytimes.com/2020/05/01/nyregion/coronavirus-streets-closed-nyc.html?referringSource=articleShare
49
https://www.nrdc.org/experts/cullen-howe/renewable-energy-gets-major-boost-new-york-state-budget
50
https://www.urbangreencouncil.org/content/news/20b-building-energy-retrofit-market
51
https://joebiden.com/clean-energy/
52
https://www.masstransitmag.com/alt-mobility/shared-mobility/bicycle-scooter-sharing/news/21164774/ny-nyc-
sees-big-bicycling-boom-in-year-of-covid-according-to-dot-data
53
https://nymag.com/intelligencer/2020/07/the-15-minute-city-can-new-york-be-more-like-paris.html
Economic Development Quarterly, March 2021: COVID-19 and the New York City Economy 23Conclusion
The goals of economic and racial inclusion are not independent of economic growth. In fact,
interventions that seek to increase economic and racial inclusion can also lead to economic
growth and can aid an economic recovery. A 2018 report by the Urban Institute details a
number of ways in which policies that promote inclusion have led to stronger economic
recoveries in cities around the country. Examples of these policies include education policy
that promotes school desegregation, housing policy that creates affordable, high-quality
housing in high-opportunity neighborhoods, economic development policy that acknowledges
and amplifies the unique contributions of immigrant communities, and tax policy that targets
tax incentive programs at distressed neighborhoods.54
Many of these interventions are similar to programs that the city already has in place and
which it could look to expand. Pursuing an inclusive economic recovery also presents an
opportunity for considering innovative progressive policies.55 The COVID-19 pandemic dealt
a crushing blow to the physical, social, and economic health of communities around the
world. The recovery will not be immediate, but it does provide an opportunity, globally, to avoid
the mistakes of the past. Locally, this means helping those who have been impacted most
by the pandemic and ensuring that existing inequalities are not exacerbated. Considering
budgetary pressures and limited fiscal space in most jurisdictions, this will require efficiency
and innovation.
The city has been forced to be innovative during the pandemic. Historically, keeping
businesses open and retaining some of NYC’s unique qualities has required both small
and large innovations. The City’s Essex Market covered the cost of safety procedures for
tenants, helped tenants to shift to making sales online, and set aside time specifically for
seniors, at-risk customers, and essential workers.56 In the month of June alone, the City
issued over 3,000 permits for restaurants to be able to put tables and chairs on sidewalks
and streets.57
Museums are able to operate safely by offering timed ticket slots and reducing the number
of visitors at a given time. The need for residents to be able to safely interact with the city
has prompted many cities to consider how to repurpose space; one solution in NYC has been
to increase the supply of bike lanes.58 The City’s Open Streets program closed off 100 miles
of streets to automobile traffic, enhancing safety of movement for cyclists and pedestrians.59
On the federal level, the Biden administration’s plan to invest $1.3 trillion in the country’s
infrastructure over 10 years—creating jobs and facilitating smarter, cleaner growth—also
54
Urban Institute, “Inclusive Recovery in US Cities.” April 2018.
55
NYC Department of Consumer Affairs, “Student Loan Debt Distress Across NYC Neighborhoods.” November 2018
56
https://www.brookings.edu/blog/the-avenue/2020/08/04/how-a-new-york-city-public-market-is-keeping-a-
neighborhoods-third-place-alive-during-covid-19/
57
https://nextcity.org/daily/entry/new-york-citys-street-vendors-considered-essential-are-adapting-to-covid-19
58
https://nyc.streetsblog.org/2020/06/24/breaking-city-doubles-temporary-protected-bike-lanes-in-response-to-covid/
59
https://www1.nyc.gov/html/dot/html/pedestrians/openstreets.shtml
Economic Development Quarterly, March 2021: COVID-19 and the New York City Economy 24should play a critical role in rebuilding NYC.60 While the pandemic has raised questions about
the livability and logic of NYC, the city is essential to the region and fundamental to the
economic success of the US.
NYC has made significant progress since being hit early and hard by the pandemic, but COVID-
19 has laid bare the need and opportunity for the city to rebuild—and reinvent—itself with a
more inclusive, equitable, resilient, and sustainable economy.
60
https://joebiden.com/infrastructure-plan/
Economic Development Quarterly, March 2021: COVID-19 and the New York City Economy 25Appendix
We use the following NAICS codes to define “street-level retail.” This definition was originally
developed in July 2018.
Street Activity Definition
NAICS 441 Motor vehicle and parts dealers
NAICS 442 Furniture and home furnishings stores
NAICS 443 Electronics and appliance stores
NAICS 444 Building material and garden supply stores
NAICS 445 Food and beverage stores
NAICS 446 Health and personal care stores
NAICS 447 Gasoline stations
NAICS 448 Clothing and clothing accessories stores
NAICS 451 Sports, hobby, music instrument, book stores
NAICS 452 General merchandise stores
NAICS 453 Miscellaneous store retailers
NAICS 454 Nonstore retailers
NAICS 485310 Taxi service
NAICS 487 Scenic and sightseeing transportation
NAICS 512131 Motion picture theaters, except drive-ins
NAICS 519120 Libraries and archives
NAICS 522110 Commercial banking
NAICS 522120 Savings institutions
NAICS 522130 Credit unions
NAICS 5322 Consumer goods rental
NAICS 541940 Veterinary services
NAICS 7111 Performing arts companies
NAICS 7112 Spectator sports
NAICS 7121 Museums, historical sites, zoos, and parks
NAICS 713940 Fitness and recreational sports centers
NAICS 713950 Bowling centers
NAICS 713990 All other amusement and recreation industries
NAICS 722330 Mobile food services
NAICS 7224 Drinking places, alcoholic beverages
NAICS 7225 Restaurants and other eating places
NAICS 81211 Hair, nail, and skin care services
NAICS 812310 Coin-operated laundries and drycleaners
NAICS 812320 Drycleaning and laundry services
NAICS 8129 Other personal services
Economic Development Quarterly, March 2021: COVID-19 and the New York City Economy 26Appendix II
New York City Department of City Planning’s list of essential NAICS codes
NAICS ID Description
11 Agriculture, Forestry, Fishing and Hunting
22 Utilities
23 Construction
311 Food Manufacturing
3121 Beverage Manufacturing
322 Converted Paper Product Manufacturing
325 Chemical Manufacturing
333242 Semiconductor Machinery Manufacturing
334 Computer and Electronic Product Manufacturing
3391 Medical Equipment and Supplies Manufacturing
42 Wholesale Trade
444 Building Material and Garden Equipment and Supplies Dealers
445 Food and Beverage Stores
44611 Pharmacies and Drug Stores
447 Gasoline Stations
45391 Pet and Pet Supply Stores
454 Nonstore Retailers
481 Air Transportation
482 Rail Transportation
483 Water Transportation
484 Truck Transportation
485 Transit and Ground Passenger Transportation
4881 Support Activities for Air Transportation
4882 Support Activities for Rail Transportation
4883 Support Activities for Water Transportation
4884 Support Activities for Road Transportation
4885 Freight Transportation Arrangement
4889 Other Support Activities for Transportation
491 Postal Services
492 Couriers and Messengers (including local delivery)
493 Warehousing and Storage
515 Broadcasting (except Internet)
517 Telecommunications
518 Data Processing, Hosting, and Related Services
519 Other Information Services
521 Monetary Authorities-Central Banking
522 Credit Intermediation and Related Activities
523 Securities, Commodity Contracts, and Other Financial Investments and Related Activities
524 Insurance Carriers and Related Activities
525 Funds, Trusts, and Other Financial Vehicles
541214 Payroll Services
541219 Other Accounting Services
541614 Process, Physical Distribution, and Logistics Consulting Services
54171 Research and Development in the Physical, Engineering, and Life Sciences
54194 Veterinary Services
Economic Development Quarterly, March 2021: COVID-19 and the New York City Economy 27You can also read