Social Media and Xenophobia: Evidence from Russia - Google Sites
←
→
Page content transcription
If your browser does not render page correctly, please read the page content below
Social Media and Xenophobia:
                           Evidence from Russia∗

                      Leonardo Bursztyn†                          Georgy Egorov‡
                      Ruben Enikolopov§                           Maria Petrova¶

                                                June 2020

                                                  Abstract

We study the causal effect of social media on ethnic hate crimes and xenophobic attitudes in Rus-
sia and the mechanisms underlying this effect, using quasi-exogenous variation in social media
penetration across cities. Higher penetration of social media led to more hate crimes in cities with
a high pre-existing level of nationalist sentiment. Consistent with a mechanism of coordination
of crimes, the effects are stronger for crimes with multiple perpetrators. Using a national survey
experiment, we also find evidence of a mechanism of persuasion: social media led individuals
(especially young, male, and less-educated ones) to hold more xenophobic attitudes.

    Keywords: social media, xenophobia, hate crime, Russia
    JEL Classification: D7, H0, J15

   ∗
       We are grateful to Garance Genicot, Matthew Gentzkow, Mike Golosov, Brian Knight, Andrew Little, Andreas
Madestam, Natalya Naumenko, Nancy Qian, Aakaash Rao, Alvaro Sandroni, Daniel Spiro, David Strömberg, Alireza
Tahbaz-Salehi, and Katia Zhuravskaya for very helpful discussions, to Danil Fedchenko for excellent research as-
sistance, and to numerous seminar participants at AEA, BEROC, BI Norwegian, Chicago Harris, DCPEC Political
Economy Seminar, EEA, HSE, Northwestern, Pompeu Fabra, Stockholm, Uppsala, and Social Media and Political
Participation NYU conference for comments and suggestions. Ruben Enikolopov and Maria Petrova acknowledge
financial support from the BBVA Foundation grant.
     †
       University of Chicago and NBER, bursztyn@uchicago.edu
     ‡
       Northwestern University–Kellogg School of Management and NBER, g-egorov@kellogg.northwestern.edu
     § New Economic School, ICREA-Universitat Pompeu Fabra, Barcelona IPEG, and Barcelona GSE,

renikolopov@nes.ru
     ¶
       ICREA-Universitat Pompeu Fabra, Barcelona IPEG, New Economic School, and Barcelona GSE,
petrova.ma@gmail.com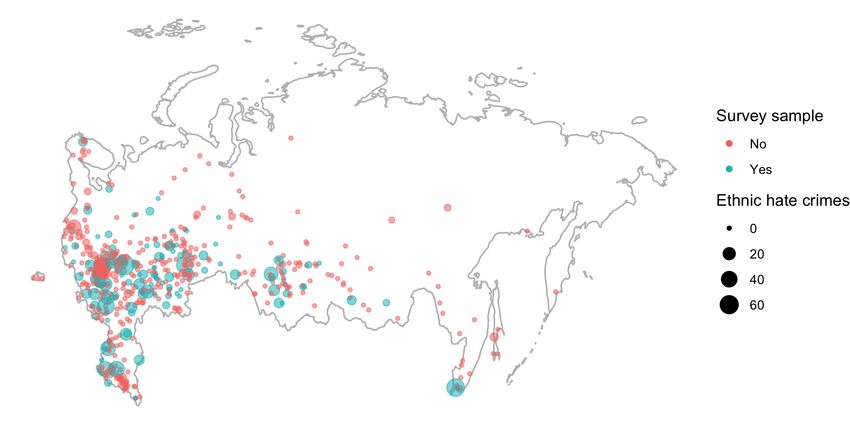
1      Introduction

     In recent years, the world has witnessed a large increase in expression of hate and xenophobia.1
Candidates and platforms endorsing nationalism and views associated with intolerance toward
specific groups have also gathered increased popular support both in the U.S. and across Europe.
Social media has been widely named a major factor in the increase in expression of hate, and
hate crimes in particular.2 In this paper, we document the causal effects of social media exposure
on violent hate crimes and xenophobic attitudes in Russia, a country with more than 180 ethnic
groups. We also combine observational data with survey experiments to provide evidence of the
particular mechanisms behind these effects.
     Conceptually, social media may affect expression of hate, and hate crimes in particular, through
two main channels. First, social media can facilitate coordination and collective action. For exam-
ple, it has been shown that social media facilitates the coordination of political protests.3 Coordi-
nation through social media may be particularly relevant for illegal and stigmatized activities, such
as hate crimes, as social media makes it easier to find like-minded people through online com-
munities and groups, and possibly to out oneself as someone having such views. We refer to this
as the coordination channel. Second, social media may influence individual opinions: previously
tolerant individuals might become exposed to intolerant views, while intolerant individuals might
end up in “echo chambers” (Sunstein, 2001, 2017; Settle, 2018) that might make their views even
more extreme. We refer to this as the persuasion channel.
     The main challenge in identifying a causal effect of social media is that access and consumption
of social media are not randomly assigned. To overcome this challenge, we follow the approach
    1 For example, according to the Center for the Study of Hate and Extremism, across thirty major cities in the U.S.,
the total number of hate crimes in 2018 was 42% higher than in 2010, following five consecutive years of increases.
See the Center’s 2019 report.
    2 See, for example, “How Everyday Social Media Users Become Real-World Extremists,” New York Times, April

25, 2018.
    3 See e.g. Enikolopov et al. (forthcoming), Manacorda and Tesei (2020), Fergusson and Molina (2020).

                                                          1
from Enikolopov et al. (forthcoming). This approach exploits the history of the main Russian social
media platform, VKontakte (VK). This online social network, which is analogous to Facebook
in functionality and design, was the first mover in the Russian market and secured its dominant
position with a user share of over 90 percent by 2011. VK was launched in October 2006 by
Pavel Durov, who was at the time an undergraduate student at Saint Petersburg State University
(SPbSU). Initially, users could only join the platform by invitation through a student forum of the
University, which had also been created by Durov. The vast majority of early users of VK were,
therefore, Durov’s fellow students of SPbSU. This, in turn, made friends and relatives of these
students more likely to open an account early on. Since SPbSU attracted students from across the
country, this sped up the propagation of VK in the cities these students had come from. As a result,
the idiosyncratic variation in the distribution of the home cities of Durov’s classmates had a long-
lasting effect on VK penetration. This allows us to use fluctuations in the distribution of SPbSU
students across cities as an instrument for the city-level penetration of VK.4 We then evaluate the
effect of higher VK penetration on hate crimes and attitudes towards other ethnicities using data
on hate crimes, collected between 2007 and 2015 by an independent Russian NGO, SOVA, as well
as newly collected data on hate attitudes from a survey experiment we designed and implemented.
    Using this instrumental variables approach, we first show that higher penetration of social me-
dia led to more ethnic hate crimes, but only in cities with a higher baseline level of nationalist sen-
timent prior to the introduction of social media. To proxy for baseline local nationalist sentiment,
we use the city-level vote share of Rodina (“Motherland”), an explicitly nationalist and xenopho-
bic party, in the 2003 parliamentary election, the last one before the creation of VK. We show that
the city-level impact of social media on hate crime victims positively and significantly depends on
the strength of pre-existing support of nationalists in the city: for example, a 10% increase in VK
penetration increased hate crimes by 25.8% in cities where Rodina received most votes, but had no
   4 Todeal with possibility that cities with taste for social media were also more likely to send students to SPbSU,
we control for the distribution of SPbSU students in cohorts several years older and several years younger than VK
founder.

                                                         2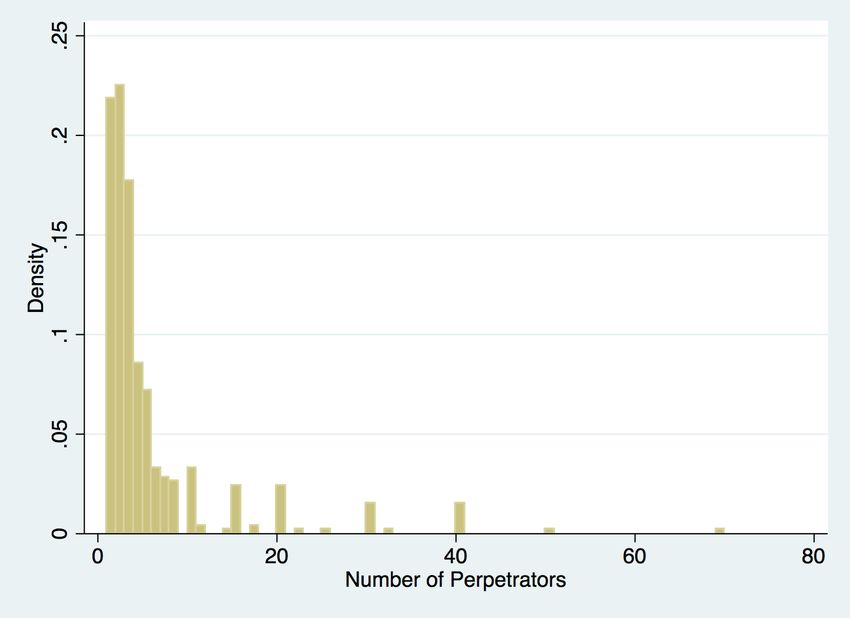
effect in cities where Rodina got minimal support. The effect being driven by areas with higher pre-
existing nationalism is potentially consistent with a mechanism of social media facilitating the co-
ordination of hate crimes among people already predisposed to disliking ethnic minorities. Further
consistent with this mechanism is our additional finding that the effects of social media penetration
in areas with higher support for Rodina was especially strong for crimes with multiple perpetrators.
    This heterogeneity with respect to pre-existing levels of nationalism is also consistent with the
literature on traditional media, which suggests that media effects often depend on a predisposition
of the population. For example, Chiang and Knight (2011) show that the effect of newspaper
endorsements was the most influential for moderate voters, while Adena et al. (2015) find that
radio propaganda by the Nazis in the 1930s was effective only in areas with historically high level
of antisemitism.5
    To understand if social media simply serves as a coordination device or if it can also change
opinions, we examine the persuasion mechanism by studying the effects of social media on xeno-
phobic attitudes. To that end, we designed and conducted an online survey experiment in the
summer of 2018, with over 4,000 respondents from 125 cities.6 The survey was framed as a study
of patterns of usage of social media and the Internet, to which we added our question of interest,
related to ethnic hostility.
    Given the possibility that a stigma, associated with directly reporting xenophobic views in
a survey, can prevent our respondents from truthfully reporting their opinions, we use the list
experiment technique. This is one of the main methods to elicit truthful answers to sensitive survey
questions (Blair and Imai, 2012, Glynn, 2013), and it has been shown to perform particularly
well in online surveys (Coutts and Jann, 2011).7 Specifically, respondents were asked about their
   5 Relatedly, Yanagizawa-Drott (2014) documents that the effect of traditional media on conflict (radio in the context

of 1994 Rwandan genocide) propagated through offline social interactions.
    6 This survey was pre-registered on the AEA RCT Registry website under entry AEARCTR-0003066.
    7 The intuition behind this technique is that the respondents are asked only to indicate the number of statements

with which they agree from a list. By adding the statement of interest to a random subgroup of respondents, one can
estimate the share of respondents agreeing with this statement without being able to identify who exactly agrees with
it. We discuss the procedure in more detail in subsection 3.2.

                                                          3
agreement with a statement (that we borrowed from existing surveys): “‘ I feel annoyance or
dislike toward some ethnicities.”
We find a positive effect of social media penetration on elicited ethnic hostility, i.e., the share
of respondents that hold xenophobic attitudes. The magnitude of the effect is particularly large in
certain subsamples, specifically younger respondents and those with lower levels of education, as
well as males. Those are precisely the groups more likely to use social media and to be engaged in
hate crime.8 Numerically, a 10% increase in VK penetration makes respondents 2.0% more likely
to agree with the hateful statement in the list experiment, with this magnitude going up to 2.8% for
younger respondents, to 4.4% for those with low education, and to 2.9% for males.
Furthermore, for the subset of respondents randomly assigned to the list not containing the
statement of interest (that is, the “control” list) we added the question about agreement with the
same statement as a direct question after the list experiment question. This allows us to examine
the effect of social media on ethnic hostility, as reported without the cover provided by the list
experiment. We do not find evidence a positive effect of social media on these direct, self-reported
xenophobic preferences. We also obtain similar (null) results if we use the answers to the same di-
rect question from a much larger, nationally representative survey of more than 30,000 respondents
conducted in 2011 by one of the biggest Russian survey companies, FOM (Fond Obschestvennogo
Mneniya, Public Opinion Foundation). Our findings, therefore, highlight the importance of prop-
erly eliciting sensitive attitudes – direct survey questions would have led to the incorrect conclusion
that there was a null effect.9
Our paper contributes to a growing literature on the impact of social media on polarization,
xenophobia, and hate crime. Allcott et al. (2020), Mosquera et al. (2020), and Yanagizawa-Drott
8 Thisgoes in line with the argument in Boxell et al. (2017) and Allcott and Gentzkow (2017) that the presumed
impact of social media should be higher for groups more likely to be affected.
9 One can also use this finding to infer whether social media changed the perceived acceptability of reporting
ethnic hostility in a survey (by comparing the effects on the measures with and without the cover provided by the list
experiment). Our results suggest no evidence that social media reduced the perceived stigma associated with reporting
ethnic hostility in a survey; if anything, the effects point in the opposite direction.
4et al. (2019) provide evidence that social media makes people’s political opinions more diverging.
Gentzkow and Shapiro (2011) finds that interactions online are less segregated as compared to
interactions offline with friends, colleagues, family members, or neighbors. At the same time, Hal-
berstam and Knight (2016) show that the segregation of communications on social media (Twitter)
is more pronounced and closer to the segregation in offline interactions. In contrast to all these
papers, we study more extreme outcomes, such as hate crime and hate attitudes.
Two concurrent papers also examine the relationship between social media and hate crimes.
Müller and Schwarz (2018) show that anti-refugee sentiment on Facebook predicts day-to-day
changes in crimes against refugees in Germany. These results, however, do not speak to longer-
lasting changes in the patterns of hate crime with the arrival of social media, and could instead re-
flect displacements of hate crime towards days with more xenophobic content. Müller and Schwarz
(2019) find that anti-Muslim hate crimes in the United States have increased in counties with high
Twitter penetration users, but only since the start of Donald Trump’s presidential campaign. These
findings are consistent with the previous literature on traditional media, which has found that top
politicians’ speeches can have an effect on people’s hate-driven behavior.10 However, their results
also imply that social media had no effect on hate crime in the absence of a xenophobic President,
or at least a major presidential candidate. Thus, despite important recent works on social media and
hate crimes, the question whether the introduction of social media per se can lead to a persistent
increase in hate crimes and xenophobia has remained open. Our paper fills this gap by providing
evidence of a persistent effect of social media penetration on both hate crimes and hate attitudes –
and an effect that is not driven by top politicians’ messages. Moreover, in contrast to the previous
literature, we examine the mechanisms behind the results.
Our paper also contributes to a larger literature on the effects of media and, in particular, social
media on individual behavior. Enikolopov et al. (forthcoming), using an identification approach
10 E.g. Adena et al. (2015) show that Hitler’s speeches was a major component of radio content in Germany since
January 1933, while Yanagizawa-Drott (2014) reports that the speeches by key government officials , including Prime
Minister Jean Kambanda, were an intergral part of RTLM radio propaganda in Rwanda.
5similar to ours, show that higher social media penetration increased the probability of political
protests in Russia in 2011. Focusing on the effects of the internet, Manacorda and Tesei (2020)
show that 2G penetration in Africa led to stronger cell-level protest participation, and Campante et
al. (2018) examine the impact of broadband internet on different forms of political participation in
Italy.11 In contrast to these studies, our paper looks at the impact on social media on hate crime,
and adds a survey experiment to further investigate underlying mechanisms. We also contribute to
the broader literature on the impact of social media on political economy outcomes.12 Bond et al.
(2012) show that political mobilization messages in Facebook increased turnout in the U.S. elec-
tions. Qin et al. (2017) find that publications in the Chinese microblogging platform Sina Weibo
predict future protests, strikes, conflicts, while Qin et al. (2019) show that the spread of information
over online social networks leads to the spread of offline protests and strikes in China. Enikolopov
et al. (2018) show that anti-corruption blog posts by a popular Russian civic activist had a negative
impact on market returns of targeted companies and led to a subsequent improvement in corporate
governance. Sophie Hatte and Zhuravskaya (2020) and Sen and Yildirim (2016) show that social
media affected reporting strategies of traditional media. Note that our contribution to this literature
is not about developing a new identification strategy for the effects of social media; it is instead
about understanding the longer-term effects of social media on an important set of outcomes, and
getting at the mechanisms behind these effects.
We also add to a growing literature studying the recent rise in populism and nationalist attitudes.
Bursztyn et al. (2019) and Enke (2019) study the 2016 U.S. election. Algan et al. (2017) show that
the Great Recession triggered a trust crisis and led to higher voting shares of non-mainstream, par-
ticularly populist parties. Guriev et al. (2019) show that 3G penetration around the globe promoted
populist voting and reduced government support.
11 Relatedly,Acemoglu et al. (2018) find that protest-related activity on Twitter preceded actual protest activity on
Tahrir Square in Egypt. Steinert-Threlkeld et al. (2015) show that the content of Twitter messages was associated with
subsequent protests in the Middle East and North Africa countries during the Arab Spring.
12 See Zhuravskaya et al. (2020) for a more detailed overview of this literature.
6The remainder of this paper proceeds as follows. We discuss our identification strategy, data,
and results on hate crimes in Section 2. In Section 3, we discuss our survey design and the results
on xenophobic attitudes. Section 4 concludes.
2 Social Media and Hate Crimes
2.1 Identification Strategy
Our empirical strategy for identification of the causal effect of social media penetration follows
the approach in Enikolopov et al. (forthcoming). In particular, we look at the penetration of the
most popular social network in Russia, VKontakte (VK), which had substantially more users than
Facebook throughout the whole period we analyze. For example, in 2011, te midpoint of our hate
crime data, VK had 55 million users in Russia, while Facebook had 6 million users. VK was
created in the fall of 2006 by Pavel Durov who at the time was a student at the Saint Petersburg
State University (SPbSU). The first users of the network were largely students who studied with
Durov at SPbSU. This made their friends and relatives at home more likely to open an account,
which let to a faster spread of VK in these cities. Network externalities magnified these effects
and, as a result, the distribution of the home cities of Durov’s classmates had a long-lasting effect
on VK penetration. In particular, the distribution of home cities of the students who studied at
SPbSU at the same time as Durov predicts the penetration of VK across cities. This prediction is
robust to controlling for the distribution of the home cities of the students who studied at SPbSU
several years earlier or later. This effect persists throughout the period between 2007 and 2016
which we analyze, although the magnitude of the effect decreases over time. Thus, the effect of
social media penetration is identified using cross-sectional variation in the number of VK users
across Russian cities, and is driven by the number of students from different cities who happened
to study at SPbSU at the time the network was created. The results of the first stage regression
7are reported in Table 1, and are also illustrated in Figure B1.13 The number of students in Durov’s
cohort is positively and significantly (at 1% level) related to subsequent VK penetration, while the
number of students in older or younger cohorts do not significantly predict VK spread. We also
show that even though VK penetration is correlated with nationalistic party support, future VK
penetration does not predict past nationalist party support, neither in the reduced form nor in the
IV specifications in columns (2)-(3) of Table 1.
However, for outcomes observed in the late 2010s, the first stage becomes weaker over time.
In most of our empirical tests, the strength of the instruments is not always high enough to make
inference using conventional thresholds for the first stage F-statistics. Throughout the paper, we
thus follow the recommendation in Andrews et al. (2019) and use the appropriate methods appli-
cable in our particular case. In particular, in all tables we report weak instrument robust confidence
sets developed by Chaudhuri and Zivot (2011) and Andrews (2017) and implemented in Stata by
Sun (2018). Likewise, in all tables we denote the significance level of the endogenous coefficients
based on these weak instrument robust sets and tests.
2.2 Data
Data on hate crimes comes from the database compiled by SOVA Center for Information and
Analysis.14 It is a Moscow-based Russian independent nonprofit organization providing infor-
mation related to hate crimes, which is generally considered to be the most reliable source of
information on that issue. The dataset covers incidents of violent hate crime, which include mur-
der, battery, and death threat. These data have been collected consistently since 2007, with some
incomplete data for 2004-2006. In the analysis we use data for 2007-2015. We classify all hate
13 Note that we use a more succinct set of controls than Enikolopov et al. (forthcoming), because we have a much
smaller number of cities and we face statistical power issues in the survey part of our analysis. The results of the
analysis of the effect on hate crime (full sample of cities) are quantitatively and statistically similar if we use exactly
the same list of controls as in Enikolopov et al. (forthcoming).
14 The database can be found at https://www.sova-center.ru/en/database/violence/
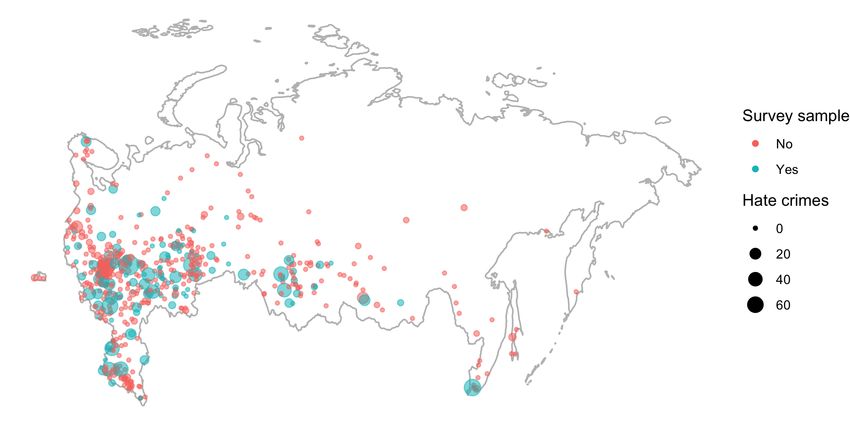
8crimes as “ethnic” or “non-ethnic” based on the type of victim reported in the database. Figures
1 and 2 show the number of hate crimes in general and ethnic hate crimes in particular in the
2007-2015 period across Russian cities on the map (for both the universe of cities and for the cities
included in our survey). Table 2 presents more detailed information on the number of victims for
each type. Based on the textual description of each incident in the database, we have also manu-
ally coded the number of perpetrators for every incident. Non-ethnic crimes are more likely to be
committed by single perpetrators (Figure 3), whereas ethnic hate crimes (Figure 4) are more likely
to be committed in groups, with the modal number of perpetrators being two. The average number
of recorded hate crimes and hate crime victims has been declining over time (see Figures B2 and
B3).15
A potential concern with this data is that there could be a differential likelihood of recording
crimes in cities with different social media penetration in a way that is consistent with our results.
For example, hate crimes might be more likely to be covered by mass media and get recorded
in the database if they caught attention on social media. Although we do not have evidence to
directly rule out this possibility, we believe that it is highly unlikely that ethnic hate crimes were
disproportionately reported in areas with both higher penetration of VK and a higher baseline
level of nationalist sentiment, and especially so for crimes with multiple perpetrators. We also
do a couple of additional tests to ensure that this possibility is not biasing our results. First, we
show that the effects are stronger in larger cities, where the role of social media on recording
crimes is likely to be lower, since traditional media are more likely to cover crimes in these cities
regardless of reports in social media. Second, the effect of social media becomes, if anything,
smaller over time, while potential bias in reporting should become stronger over time, as social
media penetration has been quickly increasing during the same time period (Figure B4).16 Finally,
15 This decline seems to be partly related to the large-scale government efforts to combat hate crimes and nationalistic
organizations during this time period.
16 The fact that the number of reported crimes and hate crime victims has been declining over time (Figures B2 and
B3) is also inconsistent with reporting bias related to social media penetration.
9our survey results on attitude changes are also consistent with social media having an effect beyond
mere reporting of hate crimes. We discuss the evidence against differential reporting in more detail
later in subsection 2.4, after summarizing the results.
The data on social media penetration and socioeconomic controls comes from Enikolopov et
al. (forthcoming). The sample consists of 625 Russian cities with a population over 20,000 accord-
ing to the 2010 Census.17 To measure social media penetration we use information on the number
of users of the most popular social media service in Russia, VK. In particular, we calculate the
number of VK users who report a particular city as their city of residence in 2011, the midpoint
for our hate crime data. We summarize the evolution of VK penetration over time in Figure B4.
We then use information on the city of origin of the students who studied at SPbSU. Specifi-
cally, we calculate the number of students coming from each city in five-year cohorts. We mostly
focus on three cohorts in our analysis: i) those who were born the same year as the VK founder
(1984) or within two years of it; ii) those who were born from three to seven years earlier than
the VK founder; iii) those who were born from three to seven years later than the VK founder.
Unfortunately, we do not have administrative data on students. Instead, following Enikolopov et
al. (forthcoming), we collect this data based on the information provided in public accounts of the
users of another social network, Odnoklassniki (Classmates), which was founded to help connect
former classmates with each other. Note that more than 80% of Russian Internet users had an
account in Odnoklassniki back in 2014, at the time these data were collected, and this share is
likely to be even larger for recent students, who studied around the time Pavel Durov studied at the
SPbSU. To deal with potential bias from our data collection, we control for Odnoklassniki pene-
tration throughout the paper. We further investigate potential biases associated with our method of
17 The exceptions are cities with similar names that caused problems with disambiguation in the data, as well as
Moscow and Saint Petersburg, which are excluded from the sample as outliers. Both Moscow and St Petersburg have
high levels of hate crime and high penetration of social media, thus their exclusion only leads to more conservative
estimates. Besides, given that the majority of students in Saint Petersburg State University were from St Petersburg
and Moscow, their year-to-year fluctuations exhibit less variation as compared to other cities, thus we cannot use our
identification strategy for the sample with these cities included.
10data collection in Appendix A.
As a measure of nationalist sentiment in a city before the creation of the VK social network we
use the vote share of the Rodina (“Motherland”) party in the parliamentary election of December
2003, the only election this party participated in and the last parliamentary election before the
creation of VK. This party ran on an openly nationalist platform. It received 9.2 percent of the vote
and got 37 of the 450 seats in the State Duma, the lower house of the Russian parliament. The data
on electoral outcomes come from the Central Election Commission of the Russian Federation. We
validate that the vote share for the party can serve as a proxy for nationalist sentiment in a city by
showing that it is positively and significantly correlated with ethnic hate crime in the subsequent
years, as well as with xenophobic attitudes revealed in the opinion polls (see Table B1).
City-level data on population, age, education, and ethnic composition come from the Russian
Censuses of 2002 and 2010. Data on average wages come from the municipal statistics of RosStat,
the Russian Statistical Agency. Additional city characteristics, such as latitude, longitude, year
of city foundation, and the location of the administrative center, come from the Great Russian
Encyclopedia.18
The data on attitudes towards other ethnicities come from a survey of over 4,000 individuals
that we conducted in the summer of 2018 in 125 Russian cities. The survey was administered by a
professional marketing firm, Tiburon Research, with a representative panel of urban Internet users
in Russia. The survey was not designed to create a representative sample of the cities, and, to be
able to conduct list experiment within each city, we tried to maximize the number of respondents
per city. The resulting median number of respondents per city is 39.19 The sample consists of 4,447
respondents, of which 2,221 were allocated to the control group and 2,226 to the treatment group.20
18 The electronic version of the Encyclopedia can be found at https://bigenc.ru/
19 On average, the cities in our survey sample were larger than the average city in the hate crime sample. It was done
so as we aimed to have a sufficient number of respondents in treatment and control group, to be able to do within-city
comparisons. Note that later on, to alleviate some concerns about the construction of our key variable, we repeat our
hate crime analysis for the sample of larger cities with population above 50,000, and our baseline results only become
stronger. Thus we do not expect any downward bias in the estimates because of our focus on the larger cities.
20 More specifically, we collected the data in two batches, the pilot and the main experiment. As part of the pilot,
11We also use data from the MegaFOM opinion poll conducted by FOM (Fond Obschestvennogo
Mneniya, Public Opinion Foundation) in February 2011. This is a regionally representative survey
of 54,388 respondents in 79 regions of Russia, of which 29,780 respondents come from 519 cities
in our sample. In particular, we use information on answers to exactly the same direct question
about hostility to different ethnicities that we asked in our survey in 2018.
2.3 Social Media and Hate Crime: Empirical Specification
Our main hypothesis is that social media penetration (specifically, VK penetration) has an
impact on hate crime. Thus, we estimate the following model:
HateCrimei = β0 + β1 VKpenetrationi + β2 Xi + εi , (1)
where HateCrimei is a measure of hate crime, which reflects either the total number of victims
of hate crimes in city i during the period 2007-2015, or the number of victims of particular
types of hate crime (ethnic or non-ethnic crimes, conducted by single or multiple perpetrators).
VKpenetrationi is the logarithm of the number of VK users in city i in summer 2011.21 This
endogenous variable is instrumented using the number of students from each city in a five-year
student cohort who have studied at the same year as the founder of VK, Durov, as well as one or
two years earlier or later. Xi is a vector of control variables that include the number of students
from the city in the other two five-year student cohorts, those that studied three to seven years
we surveyed 1,007 individuals from 20 cities. Individuals from this batch were randomized into three groups, with
one containing a statement about ethnic minorities as part of the list experiment, another containing a statement
about LGBTQ individuals, as well as a control group. As we found no reliable data on hate crimes against LGBTQ
individuals, we dropped the second group of 336, leaving us with 671 individuals from the pilot. As part of the main
experiment, we surveyed 4,034 individuals from 111 cities. In this batch, the cities were randomly chosen by the firm
we were working with, and since we had the data on VK penetration for only 105 of these cities, we had to drop 246
observations from six cities. Additional 12 surveys were incomplete, which left us with 3,776 observations from the
main part. In most analyses, we pool the two batches together, but our results are robust to looking at the second
batch only. The survey was approved by the University of Chicago Institutional Review Board (IRB18-0858) and was
pre-registered in the AEA RCT Registry (AEARCTR-0003066).
21 We add one to the variable in our logarithm measures to deal with zeros.
12earlier than Durov, and those that studied three to seven years later than Durov. It also includes
the following socioeconomic controls: the logarithm of the population, the indicator for being a
regional or a subregional (rayon) administrative center, the average wage in the city, the number
of city residents of different five-year age cohorts, the share of the population with higher educa-
tion in 2010 in each five-year age cohort, the indicator for the presence of a university in the city,
ethnic fractionalization, and the logarithm of the number of Odnoklassniki users in 2014. For all
specifications we report weak-instrument robust confidence sets.22 Similarly, for our heterogeneity
analysis we estimate the equation:
HateCrimei = β0 + β1 VKpenetrationi × Nationalist Supporti + β2 Xi + εi , (2)
where NationalistSupporti denotes the votes for the nationalist Rodina party in 2003 and Xi is a set
of controls that includes direct effects of VKpenetrationi , NationalistSupporti , and all the controls
just described above.
2.4 Social Media and Hate Crime: Results
Table 3 summarizes the results of estimating Equation (1) for the average impact of exposure to
VK on hate crime. While there is some significant relationship between social media penetration
and hate crime in OLS specifications (Panel A), there is no consistent evidence of a significant
effect of VK penetration on hate crime, for either ethnic- or non-ethnic- hate crime or for crimes
conducted by single or multiple perpetrators in the IV specification (Panel B). At the same time,
the confidence intervals do not allow us to rule out large effects (e.g., at maximum 66.0% increase,
22 As discussed above, we report weak instrument robust confidence sets developed by Chaudhuri and Zivot (2011)
and Andrews (2017) and implemented in Stata by Sun (2018) throughout the paper. We made a choice not to cluster
standard errors, given that hate crime, in contrast to political protests, is primarily a local phenomenon, and hate crime
patterns in cities 100-200 km apart are not related. Figures 1 and 2 illustrate these patterns. Moreover, if we regress
hate crime on region fixed effects, we find that the fixed effects are not significantly related to the patterns of hate
crime, neither individually nor collectively.
13i.e., 0.69 of a standard deviation of the dependent variable in column 1, Panel B), and only one out
of nine IV coefficients in the table is marginally significant.
However, these results mask an important heterogeneity of the effect with respect to the un-
derlying level of nationalism. People in cities with very few nationalists to begin with and people
from very nationalist cities can respond differently to the arrival of social media. To capture this di-
mension of heterogeneity into account, we interact VK penetration with a measure of pre-existing
nationalist support, as captured by the Rodina party vote share in 2003.
Table 4 summarizes the results of estimating Equation (2). Panel A reports OLS results, and
Panel B reports IV results. The nationalist party support variable is demeaned to simplify inter-
pretation of the direct coefficients. The OLS relationship is positive and significant for all total
hate crime and ethnic hate crime variables. It is presented visually in Figure 5, which illustrates
that the link between the number of victims of hate crimes and VK penetration is significantly
positive for cities with higher pre-existing levels of support for the nationalist party, while there is
no significant relationship in cities with low levels for support of that party.23
Panel B presents the results for the IV specification. In all the IV specifications except one
(column 8, Panel B), the effect of social media penetration on hate crime is significantly stronger
in cities with higher pre-existing level of nationalism. Numerically, the results imply that the effect
of a one standard deviation increase in social media penetration ranges from being close to zero
(non-significant with different signs) at the minimum level of nationalist party support to a 25.8%
increase in the total number of hate crime victims at the maximum level of nationalist support
(column 1 of Table 4, Panel B).
The full version of this table with complete interactions between Rodina support and the num-
ber of students in the cohorts above and below Durov’s is shown in Table B2. As one can see, there
are no significant interaction coefficients for the older cohort and nationalistic party support. The
23 In the picture, higher level of support is defined as being above the 85th percentile in the number of votes for the
party, for illustrative purposes. The variable that captures pre-existing level of nationalism, used in Table 4 and others,
is the actual vote share of the nationalist party (Rodina) in 2003, demeaned.
14interaction terms for the younger cohort are occasionally significant (columns 2 and 5 in Table B2),
but are never positive, consistent with idea that Durov’s cohort was special in terms of generating
hate crime in cities with high levels of pre-existing nationalism, and being among the first ones
to get VK is the most likely channel for that. These results further strengthen our identification
argument.24 OLS coefficients (Panel A of Table 4) are approximately three times smaller than
IV coefficients (Panel B of Table 4), which implies that some negative selection is going on; for
example, social media users are more likely to have higher levels of education, while most hate
crime perpetrators have lower levels of education.
The results indicate that in cities with high pre-existing level of nationalism, higher penetration
of social media led to a higher total number of victims of hate crimes. Note that our results hold
for the victims of ethnic and non-ethnic crimes, as well as of crimes conducted by either single
or multiple perpetrators, i.e., for different types of hate crime. Another important takeaway from
Table 4 is that the coefficients of interest are noticeably larger for the incidents that involved mul-
tiple perpetrators, i.e., acts of violence that require coordination.25 At the same time, the results
are also positive and significant for crimes committed by single perpetrators (with the exception of
non-ethnic crime in column 8), which suggests that while social media may have facilitated coor-
dination and thus contributed to hate crime, coordination alone may not fully explain the impact
of social media (though coordination broadly speaking may take other forms, such as providing
information on opportunities for committing crime to single perpetrators).
To interpret the evidence on the link between social media and hate crime victims presented in
Tables 3 and 4, it is also important to distinguish between the intensive and extensive margins. In
24 We also report reduced-form estimation results in Table B3. The interaction of pre-existing nationalism with the
size of Durov’s cohort is positive and significant in 8 out of 9 specifications. In contrast, the coefficients for older and
younger cohorts are much smaller and are mostly insignificant; if anything, 2 out of 18 coefficients in this table are
significant, and those are negative, not positive. These results are further consistent with VK’s impact on hate crime,
and, importantly, these results do not suffer from the weak instrument problem.
25 In the seemingly unrelated regressions specification, the difference between the interaction coefficients in columns
2 (single perpetrator) and column 3 (multiple perpetrators) is statistically significant at the 10% level; the differences
for ethnic and non-ethnic crimes are similarly large in magnitude.
15Table B4, we estimate Equation (2) with the number of crimes rather than the number of victims
as the dependent variable. The results suggest that the number of crimes responds to the introduc-
tion of social media and to the number of victims very similarly, both in terms of magnitude and
statistical significance. For example, the impact of a 10% increase in social media penetration on
the number of crimes is bounded by 24.8% for total crimes, a figure very similar to the maximal
effect on the number of victims. In other words, the increase in the number of hate crime victims
is well explained by the increase in the number of crimes, so it is the extensive margin that seems
to play the role.
We also attempt to understand the evolution of the impact of social media over time. The
beginning of our time period, 2007-2009, was the time of a rapid introduction of social media
into people’s lives, with the total number of VK users growing from about a hundred thousand
to more than thirty million, while by 2013-2015 the exponential growth had already stopped and
other platforms, such as Twitter, started to gain some popularity. At roughly the same time, fol-
lowing the Arab Spring and the protests in Russia in 2011-2012, the Russian government began to
regulate online content, which prevented openly xenophobic communities from being created and
sustained. We find that the effect of social media has been declining over time.26
Table 5 reports the results of placebo regressions for hate crime in the period 2004-2006, i.e.,
before the creation of the VK social network. The results indicate no significant effect of social
media on hate crime even in cities with maximum level of support of the nationalist party, and the
difference between these results and the results in Table 4 is statistically significant in seemingly
unrelated regressions framework. These findings are consistent with the premise that social media
26 If we examine the effect for the three 3-year sub-periods separately (see Table B5), one can see that the effects
are similar in size in 2007-2009 and 2010-2012, but become noticeably smaller and statistically insignificant in 2013-
2015. A reduced form version of this table is shown in Table B6. Note that in the latter table, the coefficients for the
later period (2013-2015) are significantly larger than the coefficients for the middle period (2010-2012) in seemingly
unrelated regressions framework, for total hate crimes, for total hate crimes, committed by multiple perpetrators, and
for ethnic hate crimes, committed by single perpetrators. At the same time, for the results in IV version of this table,
i.e. Table B5, we seem to lack the statistical power to make a proper comparison. We should also note that the
predictive power of the instrument in the first stage regression is going down with time (see Figure B5).
16has a causal effect on hate crime after the creation of VK in the end of 2006, in places with a higher
level of nationalistic party support.27
As we mentioned above, a potential concern is that the results are driven by differential likeli-
hoods of recording crimes that is correlated with explanatory variables. Although we do not have
direct evidence directly ruling out differential likelihoods of recording crimes, we can do a couple
of tests to alleviate this concern. First, we check if the effects that we identify negatively depends
on the size of the cities. Arguably, in smaller cities with fewer traditional media news sources
if any, reporting of hate crimes may be more dependent on whether they were discussed in social
media or not. This should make the measurement error in hate crime data stronger in smaller cities.
However, we find that, on the contrary, if we restrict the sample to cities with population above the
median, the results become only stronger (see Table B8). Second, if indeed social media makes
hate crimes more visible, this effect is supposed to be more pronounced as social media penetration
goes up with time. However, if anything, we observe the opposite: the magnitude of the effect of
social media is becoming smaller over time (see Tables B5 and B6). Finally, it is unlikely that
ethnic hate crimes were disproportionately more reported in areas with both higher penetration of
VK and a higher baseline level of nationalist sentiment, and especially so for crimes with multiple
perpetrators. We should also note that our results on attitude changes are also consistent with social
media having an effect beyond just the reporting of hate crimes (see the next section).
Overall, the results in Tables 3-5 indicate that social media had a positive effect on hate crime,
but only in places where the level of nationalism was already sufficiently high before the creation
of social media.
27 Note that the null results in Table 5 may also be driven by the fact that the data for this time period are incomplete,
in contrast to the later years. We also test whether the coefficients are statistically different for the period 2004-2006
and 2007-2015 in a pooled regression (see Table B7). In all specifications except one either the coefficient for the
direct effect of VK penetration or its interaction with the support of the nationalistic party or both are statistically
different from each other. Unfortunately, we cannot provide weak-instrument robust confidence intervals for this
specification, as the triple-difference specification turns out to be too demanding and the confidence intervals often
become degenerate and consisting of a single point.
173 Social Media and Hate Attitudes
While the results so far suggest a role of social media as a means of coordination of hate crime,
it is important to evaluate whether social media has also played a persuasive role. Indeed, it is
possible that social media made previously tolerant people more intolerant toward minorities, and
previously intolerant people even more intolerant, and this could also contribute to an increase in
hate crimes. As noted above, the results on crimes with a single perpetrator suggest that mech-
anisms other than coordination may be at play as well. To explore the persuasion channel, we
designed and conducted a survey aimed at measuring the true level of underlying nationalism.
3.1 Survey Setup
To elicit xenophobic attitudes we conducted an online survey in 2018. The survey was admin-
istered in 125 cities chosen by the survey firm to create a representative sample of Russian urban
Internet users and included a list experiment as part of it. This design (also called the “unmatched
count” and the “item count technique”) was originally formalized by Raghavarao and Federer,
1979 and further developed in recent works by Blair and Imai, 2012 and Glynn, 2013, among oth-
ers. It is a standard technique for eliciting truthful answers to sensitive survey questions. The list
experiment works as follows. First, respondents are randomly assigned to either a control group
or a treatment group. Subjects in both groups are then asked to indicate the number of statements
they agree with. In this way, the subject never reveals their agreement with any particular statement
(unless the subject agrees with all or none, which is something the experimental design should try
to avoid), only the total number of statements. In the control condition, the list contains a set of
statements or positions that are not stigmatized. In the treatment condition, the list includes all
the statements from control list, but also adds the statement of interest, which is potentially stig-
matized (and in both cases, the positions of statements are randomly rotated). The support for the
18stigmatized opinion can then be inferred by comparing the average number of statements the sub-
jects agree with in the treatment and control conditions. For recent applications of list experiments
in economics, see Cantoni et al. (2019) and Enikolopov et al. (2017).
In our case, the survey participants were asked the following question: “Consider, please,
whether you agree with the following statements. Without specifying exactly which ones you agree
with, indicate just the number of statements that you can agree with.” The respondents in the
control group were given four statements unrelated to the issues of ethnicity.28 The respondents
in the treatment group were given the additional fifth statement: “I feel annoyance or dislike
toward some ethnicities.” Here, we took the exact wording used by one of the leading opinion
polling firms in Russia in their regular large-scale surveys, which has the additional advantage of
making our results comparable with the results of the opinion polls by this firm (see subsection 3.4
for more detail). Respondents in the control group, after answering the question on the number
of statements they agreed with (which did not include the statement on ethnicities), were then
asked a direct question about annoyance or dislike toward some ethnicities. Overall, the share of
respondents who agreed with the xenophobic statement in the list experiment (i.e., the difference
between the average number of statements with which respondents in treatment and control group
agreed) was approximately 38 percent, while the percentage of respondents who admitted being
xenophobic in the direct question was 33 percent.
Before proceeding with our analysis, it is important to note one important limitation we face.
Due to the smaller number of cities in the survey sample (as compared to the full sample used in
the analysis of hate crimes), we are not powered to study the impact of social media penetration
interacted with pre-existing nationalism. Thus all the results in this section refer only to the average
effects of social media penetration.
28 The exact statements were the following: i) Over the week I usually read at least one newspaper or magazine;
ii) I want to see Russia as a country with a high standard of living; iii) I know the name of the Chairman of the
Constitutional Court of the Russian Federation; iv) Our country has a fairly high level of retirement benefits.
193.2 Elicited hostility, individual-level results
Given the randomization, comparing the mean number of positive answers between treatment
and control groups provides a valid estimate of the percentage of respondents who agree with
the sensitive statement about having xenophobic attitudes (Imai, 2011). However, our goal is to
estimate the impact of an independent variable (social media penetration) on the answer to this
sensitive question. Following Imai (2011) and Blair and Imai (2012), we use the regression model
with interactions to estimate how answers to the list experiment question depend on other param-
eters, in our case, characteristics of the respondent’s city. Formally, we estimate the following
model:
NumberOfStatementsi j = β0 + β1 Ti j + β2 Ti j × VK j + β3 VK j + β4 Xi j + εi j , (3)
where NumberOfStatementsi j is the number of statements respondent i from city j agreed with,
Ti j is the dummy variable for whether respondent i from city j was assigned to the treatment
group, and VK j is the measure of VK (social media) penetration in city j instrumented by the
number of students from the city who studied at SPbSU together with the founder of VK. Other
controls include older and younger cohorts of SPbSU students from a city, city-level controls, and
the interaction of pre-existing nationalism with the treatment dummy to account for the differential
response. Standard errors are clustered at the city level.
In this specification, the effect of social media penetration on the share of respondents in city j
who have xenophobic attitudes is captured by the coefficient β2 . In what follows, we also look at
subsamples, paying special attention to the groups more likely to be involved in hate crime: males,
young respondents (below the median age in the sample, which is 32), and respondents with lower
levels of education (below the median in our sample).29
29 Notethat we pre-registered heterogeneity by gender in our pre-analysis plan, but later we decided that these other
simple characteristics (being young and low-educated) are also likely to predict being a hate crime perpetrator, and so
20The results, presented in Table 6, indicate that social media increased elicited hostility to other
ethnicities, both on average and for subgroups that are more likely to engage in hate crime (male,
young, or low-educated).30 The results in column 1 imply that, on average, the elasticity of elicited
hostility with respect to social media penetration is 0.075. In other words, a 10% with this magni-
tude going up to 2.8% for younger respondents, to 4.4% for those with low education, and to 2.9%
for males. increase in VK penetration increases the share of those agreeing with the statement in
the list experiment by 2.0%. This magnitude goes up to 2.9% for males (column 2), 4.4% for those
with low education (column 4), and 2.8% for younger respondents (column 6).31 We do not find
any significant effect of VK for females, those with higher education, or older respondents, and
the magnitudes of the coefficients are considerably smaller for these groups. To put these numbers
in a perspective, the average city in our sample has about 355,000 people, of which 27.1% are VK
users. Our baseline coefficient (column 1 of Table 6) implies that 10% increase in VK penetration
lead to 2654 more people with xenophobic views in the average city.32
3.3 Elicited hostility, city-level results
In this subsection, we repeat the analysis above at the city level. In what follows we refer to the
variable NumberOfStatementsi j as yi j . Then, assuming that Equation (3) is a true data generating
process, we derive the city-level specification we would like to estimate. More specifically, we first
we added them to the analysis.
30 The number of cities varies slightly; it is 123 for older subsample, 124 for females and those with higher education,
and full sample of 125 for the rest of the categories. That happens because for some cities we do not happen to have
respondents in all categories.
31 We got the first number by dividing one tenth of the effect, 0.0075, by 0.376, the average share of those agreeing
with the xenophobic statement, as given by the difference between the number of options chosen by treatment and
control groups. For the other columns, similar calculations apply.
32 Note that we also have 58 people who do not use any social networks in our sample. If we repeat the estimation
of equation (3) for this subsample of people, we get a negative but not significant effect of VK penetration interacted
with a dummy for the list experiment option (magnitude −0.342, standard error 0.877). However, we are not able to
compute weak instrument robust confidence sets for this (very small) subsample of non-users.
21sum individual responses by city and treatment status:
∑ yi j = β0 ∑ 1 + β3 VK j ∑ 1 + β4 ∑ Xi j + ∑ εi j ;
Ti j =0 Ti j =0 Ti j =0 Ti j =0 Ti j =0
∑ yi j = (β0 + β1 ) ∑ 1 + (β2 + β3 ) VK j ∑ 1 + β4 ∑ Xi j + ∑ εi j .
Ti j =1 Ti j =1 Ti j =1 Ti j =1 Ti j =1
We then divide both sides of the last two equations by the number of respondents in each treatment
group in a city (∑Ti j =a 1) and take the difference. We get
" #
∑Ti j =1 yi j ∑Ti j =0 yi j ∑Ti j =1 Xi j ∑Ti j =0 Xi j
− = β1 + β2 VK j + β4 − + η j, (4)
∑Ti j =1 1 ∑Ti j =0 1 ∑Ti j =1 1 ∑Ti j =0 1
∑Ti j =1 εi j ∑Ti j =0 εi j
where we denoted ∑Ti j =1 1
− ∑Ti j =0 1
as η j to simplify notation.
All city-level controls that are not interacted with an extra treatment option Ti j cancel each
other in (4). For a conservative estimation without simple demographic controls, the only term that
was interacted and that differs between treatment and control group is NationalistSupport j × Ti j .
Thus, the city level specification reduces to
∑Ti j =1 yi j ∑Ti j =0 yi j
− = β1 + β2 VK j + β4,ns NationalistSupport j + η j . (5)
∑Ti j =1 1 ∑Ti j =0 1
We present the results of this estimation in Table 7.33 As one can see, the results are largely
consistent with the results at the individual level (Table 6), though the coefficients in Table 7 are
slightly larger in terms of magnitudes, potentially due to some spillover effects underestimated by
the specification used at the individual level. The relationship from this table, in the form of bin
scatter plot, is also illustrated in Figure B6.
33 Note that the number of observations is different for different specifications, as not all cities have a large enough
number of respondents to compute the difference between the mean number of options chosen by the members of
treatment and control in each subgroup. For robustness, we also report the results for the sample of cities with non
missing estimates for every category in Table B9.
22Overall, the results in Tables 6 and 7 indicate that social media penetration had a positive
effect on the share of people who have xenophobic attitudes, and more so among the groups of
respondents likely to be involved in hate crimes (and, in the case of younger and low-educated
individuals, groups that are arguably likely to be persuadable). These findings speak in favor of the
persuasive effect of social media on xenophobic attitudes.
3.4 Self-reported hostility
We also examine the effect of social media on direct, self-reported xenophobic attitudes. This
is estimated at the individual level using the following specification:
SelfReportedHatei j = β0 + β1 VK j + β2 Xi j + εi j . (6)
The results of this estimation are reported in Table 8, Panel A. The coefficient of interest, β1 ,
is generally not statistically significant and has a negative sign. For one particular specification in
which we look at the subset of younger respondents (column 6), the 95% weak-instrument-robust
confidence set lies entirely below zero.
To make sure that the lack of an effect on self-reported xenophobic attitudes is not a conse-
quence of the timing of the survey (almost twelve years after VK was founded) or the number of
respondents, we replicate this analysis using data from a much larger survey, conducted in Febru-
ary 2011.34 This survey contained a direct question on dislike toward other ethnicities with exactly
the same wording as the question we used to measure self-reported hostility in our survey.
The results of estimating Equation (6) based on this sample are presented in Table 8, Panel
B. These results indicate that, as in the case of the 2018 survey, there is no significant relation
between social media penetration and self-reported xenophobic attitudes. This null result holds
34 This MegaFOM opinion poll, conducted by FOM, has a regionally representative sample of 54,388 respondents
in 79 regions, of which 29,780 respondents come from the 519 cities in our sample.
23You can also read