Assessing social and economic outcomes from biodiversity 'no net loss' on infrastructure development Using Natural Capital Accounting A case study ...
←
→
Page content transcription
If your browser does not render page correctly, please read the page content below
Social & economic outcomes from biodiversity ‘no net loss’

  Assessing social and economic outcomes
          from biodiversity ‘no net loss’ on
               infrastructure development

                           Using Natural Capital Accounting

                                                                               -

                                                 A case study from Uganda

                                                             February 2019

                                                                      Page 1 of 47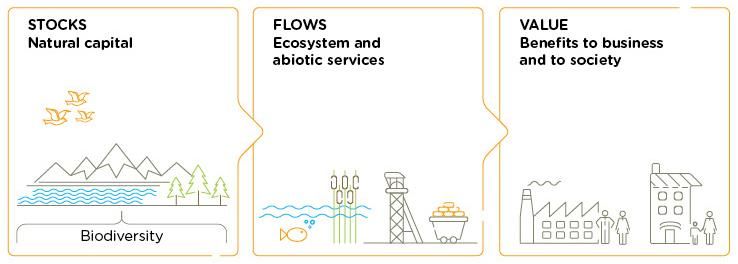
Social & economic outcomes from biodiversity ‘no net loss’

Contents

1.    Introduction ................................................................................................................................... 3

2.    Natural Capital Accounts of No Net Loss: what, why and how...................................................... 5

3.    Natural Capital Accounts of biodiversity by African countries .................................................... 14

4.    Contextual information to construct the NCA case study ........................................................... 16

5.    NCA case study of a sugarcane factory ........................................................................................ 17

References ........................................................................................................................................... 28

Appendix A: Contextual information for the NCA case study ............................................................. 31

Appendix B: Benefits from Uganda’s wetlands at international, national and local levels ................ 36

Appendix C: Example literature on monetary values of the benefits from Uganda’s wetlands ......... 39

Appendix D: Examples of dependencies and impacts on Uganda’s wetlands by various sectors ...... 45

Project team

The authors of this report are: Dr Julia Baker (Biodiversity Technical Specialist, Balfour Beatty) and
Milly Oakley (Imperial College London). E.J. Milner-Gulland (University of Oxford), Steven King and
James Vause (UN Environment World Conservation Monitoring Centre) and Joe W. Bull (Wild
Business) provided technical support and input.

Suggested citation

Baker, J. & Oakley, M. (2019) Assessing social and economic outcomes from biodiversity ‘no net
loss’ on infrastructure development, using Natural Capital Accounting – a case study from Uganda.
London, UK, Wild Business Ltd.

Acknowledgements

This report was funded by the UK’s Government’s Darwin Initiative Funding as part of
the project ‘Achieving no net loss for communities and biodiversity in Uganda’, (DI-
23019)

                                                                                                                                           Page 2 of 47
Social & economic outcomes from biodiversity ‘no net loss’
1. Introduction
Global spending on infrastructure development is expected to double between 2015 and 2030. This
investment in transport, energy, utilities and other infrastructure is essential to grow national
economies and keep pace with increasing populations (Bennett et al, 2017). However it is causing
significant biodiversity loss where there are no requirements to design, build or operate
infrastructure projects with ‘no net loss’ (NNL) or ‘net gain’ (NG) of biodiversity (Box 1).
Biodiversity loss from infrastructure projects has social and economic consequences because
people use, and depend on, benefits from functioning ecosystems (Box 1). Yet these consequences
are rarely quantified. As a result, mitigation efforts can fail to address these costs even when
projects seek NNL of biodiversity. There is also a missed opportunity for NNL to generate wider
benefits such as flood mitigation and climate regulation, as well as improving people’s wellbeing.
Natural Capital Accounting can be used to quantify the social and economic outcomes from a
project’s biodiversity impact. Making these outcomes explicit enables infrastructure projects to fully
adhere to the mitigation hierarchy (Box 1) and achieve NNL of biodiversity in ways that are fair and
sustainable for local people, society and the economy.
1.1 This report
This report is for infrastructure projects seeking NNL of biodiversity
The report responds to calls from Uganda’s government, investment and business sectors to
operationalise the concept of Natural Capital Accounting for infrastructure projects seeking NNL. It
is intended to support discussions by Uganda’s government, investment and business sectors on
establishing a Natural Capital Forum.
The report focuses only on biodiversity, as one component of natural capital. It describes how to
produce Natural Capital Accounts of losses and gains in biodiversity from infrastructure projects,
such as a new road, oil pipeline or dam. It illustrates these accounts using a fictitious case study of a
sugarcane factory that aimed to achieve NNL with regards to its impact on wetlands. The report’s
chapters are:
2 Natural Capital Undertaking Natural Capital Accounts of infrastructure projects
Accounts of No Net seeking NNL, and the benefits for governments, investors and
Loss businesses.
3 Natural Capital The extent of Natural Capital Accounting of biodiversity by African
Accounts by African countries, with a focus on Uganda.
countries
4 Contextual information Contextual information on Uganda’s wetlands used to construct
to construct the the Natural Capital Account case study, including stocks, flows of
Natural Capital Account benefits, and the monetary values of these benefits.
5 Natural Capital Account A Natural Capital Account of losses and ‘offset’ gains in wetlands
case study from the construction of a sugar cane factory in Uganda.
Page 3 of 47Social & economic outcomes from biodiversity ‘no net loss’
Box 1. Key concepts
Biodiversity
Defined by the Convention on Biological Diversity as “the variability among living organisms from all
sources including, inter alia, terrestrial, marine and other aquatic ecosystems and the ecological
complexes of which they are part; this includes diversity within species, between species and of
ecosystems”. In the case of NNL policies, biodiversity typically refers to a specific set of sub-
components of total biodiversity.
No Net Loss
Governments, investors and businesses worldwide are increasingly adopting NNL or NG biodiversity
targets for development projects. NNL is based on the concept that, after following the mitigation
hierarchy, any unavoidable biodiversity loss is counterbalanced by equivalent gains elsewhere
(Maron et al, 2018). This requires quantifying losses of biodiversity caused by a development
project as well as any gains, in order to demonstrate that the gains are equal to, or greater than, the
losses. Several publications exist on good practice for NNL (e.g. BBOP, 2012).
Mitigation hierarchy
A sequence of actions undertaken throughout a development project’s life-cycle. The first action is
to avoid negative impacts on biodiversity (e.g. re-locating a project to avoid sensitive habitats), then
to minimise impacts that cannot be avoided (e.g. undertaking construction activities outside of
breeding seasons). Where avoidance and minimisation are not feasible, the third action is to
remediate damage and then finally to fully compensate for any unavoidable residual biodiversity
loss, which can involve offsetting losses with gains elsewhere.
Biodiversity offsets
Measurable conservation outcomes resulting from actions designed to compensate for significant
residual adverse biodiversity impacts from development projects after following the mitigation
hierarchy. Offsets should aim to achieve NNL and preferably a NG of biodiversity (BBOP, 2012).
Ecosystem
An interacting system of both living components (e.g. plants, animals and microbes) and non-living
components (e.g. soil, water and air).
Ecosystem services are the benefits people obtain from ecosystems (Millennium Ecosystem
Assessment, 2005). They broadly comprise:
Provisioning services e.g. food, fibre, fuel and water.
Regulating services e.g. soil formation, climate control, flood regulation, disease control,
water purification and pollination.
Cultural services e.g. recreation, spiritual, educational and aesthetic value.
Supporting services are necessary for all other ecosystem services, e.g. the cycling of water
and nutrients. Some services are both supporting and regulating, such as erosion control.
Page 4 of 47Social & economic outcomes from biodiversity ‘no net loss’
2. Natural Capital Accounts of No Net Loss: what, why and how
2.1 What is Natural Capital?
Natural capital is:
“the elements of nature that directly and indirectly produce value or benefits to people, including
ecosystems, species, freshwater, land, minerals, the air and oceans, as well as natural processes
and functions” (NCC, 2016).
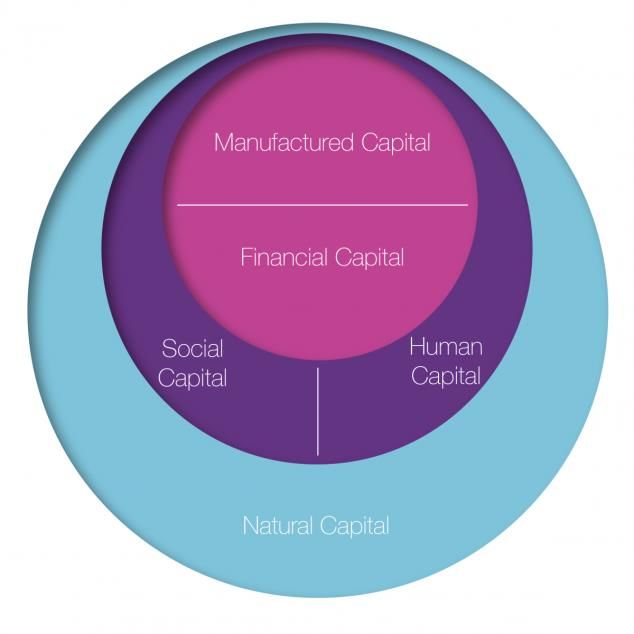
Natural capital underpins the wealth of a nation together with other types of capital including social
and financial capital (Figure 2). While natural capital often underpins the other types of capital, it is
the combination of all capitals that supports human well-being. On a farm for example:
Natural capital provides the fertile soils, pollinating insects and flows of water needed to
grow crops.
Social and human capital provides the knowledge of farming techniques, labour and the
institutions, such as cooperatives, to aid distribution.
Manufactured and financial capital provides the equipment and materials needed for
farming, such as tractors.
Figure 2: Forms of Capital
Source: IIRC, based on the Forum for the Future’s five capital model
Page 5 of 47Social & economic outcomes from biodiversity ‘no net loss’
The concept of Natural Capital (Figure 3) can be considered in terms of:
Stocks
Natural capital can be assessed and quantified as ‘stocks’. These stocks comprise biotic (living)
elements such as forests, wetlands and grassland ecosystems, and the biodiversity they support.
They also comprise abiotic (non-living) elements including minerals, fossil fuels and solar energy.
Flows of benefits
The biotic elements of Natural Capital generate flows called ecosystem services, which provide a
range of benefits for people such as food, fibre, energy and clean water.
Value
The combination of stocks and the flows of benefits are valuable to local communities, societies,
governments and businesses at local, national and international levels. These values can be
described in qualitative terms, such as the joy of walking through woodland. Other values can be
quantified and/or monetized, such as carbon storage. However, it is not always appropriate to
assign monetary values.
Figure 3: Stocks and flows of Natural Capital
Source: Natural Capital Coalition Protocol, 2016
Page 6 of 47Social & economic outcomes from biodiversity ‘no net loss’
2.2 What is a Natural Capital Account of No Net Loss?
This report describes Natural Capital Accounts of - only - the ecosystem and biodiversity
components of natural capital (hereafter collectively referred to as biodiversity). The purpose of
these accounts is to:
Assess and quantify the social and economic outcomes from a project’s biodiversity
impact in order to design fair and sustainable No Net Loss measures
Based on the Corporate Natural Capital Accounting framework (eftec et al, 2015), the main stages
of these Natural Capital Accounts (NCAs) are:
1. Assess and quantify the stocks
The first stage requires identifying the type and amount of biodiversity present, which is often
based on habitat. Broad classifications of habitats can be used, such as simply referring to
grassland, forest or wetland. Alternatively more detailed classifications can be used, for example
identifying specific types of wetland such as swamps and swamp forests. Then for each habitat, the
condition or quality is assessed and the area is measured.
2. Assess and measure the flows of benefits
The second stage is to identify the benefits (i.e. ecosystem services) that people obtain from each
stock of biodiversity, and who realizes the benefits at local, national and international levels. Then
benefits are measured using methods appropriate for the context. For example, to estimate
firewood collection by local people from a forest reserve, the number of ‘bundles’ of firewood
collected daily by each individual is used.
Measuring all benefits might not be possible, for example when data are limited or when measuring
the benefit (such as people’s cultural values associated with biodiversity) itself is not appropriate. In
these situations, the NCA should contain a descriptive account of all benefits as far as possible. It
should then measure benefits where possible, appropriate and most relevant for assessing the
social and economic outcomes of the project’s biodiversity impact.
3. Value the benefits
The final stage is to value the benefits that people obtain from the biodiversity stocks. Qualitative
descriptions should be used first. Where possible and appropriate, monetary value of the benefits
can be calculated. Note: NCAs do not assign monetary values to biodiversity itself. Rather, they
might involve calculating monetary values of the benefits that biodiversity provides to people (i.e.
the ecosystem services) where appropriate to do so.
Page 7 of 47Social & economic outcomes from biodiversity ‘no net loss’
2.3 Why undertake Natural Capital Accounts of No Net Loss?
International guidelines advocate that NNL projects should not make local people worse off (e.g.
BBOP, 2012). Fulfilling this ‘no worse off’ principle can be challenging, as it requires a
comprehensive understanding of how people are affected by losses and gains in biodiversity from
an infrastructure project. It also requires demonstrating that people are indeed no worse off in the
context of NNL (Griffiths et al, 2018).
NCAs can help to address these challenges. By quantifying the social and economic outcomes from
a project’s biodiversity impacts, they provide information to fully adhere to the mitigation hierarchy
and to design NNL activities that are fair and sustainable for people. Also by illustrating a project’s
true costs and benefits, NCAs can address concerns that the value of biodiversity is not adequately
reflected in traditional economic appraisals or Environmental and Social Impact Assessments (ESIAs)
(TEEB, 2010). Other benefits of NCAs include:
Governments
Governments face the twin challenge of growing the nation’s economy while protecting and
enhancing biodiversity. NCAs make explicit biodiversity’s contribution to the economy and the
financial risks from losing this contribution. NCAs also show the multiple benefits and inter-
dependencies between biodiversity, the economy and society. This is especially important where
nationally-significant infrastructure development can adversely affect local livelihoods.
Several governments are undertaking national NCAs using the System of Environmental-Economic
Accounting Framework, see Chapter 3 (UN et al., 2014). These national accounts provide an
important context for NCAs of individual infrastructure projects. For example, a national account
shows that all of the country’s wetlands are declining rapidly. An infrastructure project results in the
loss of one wetland, which is identified as having severe consequences for economic growth and
human well-being because it greatly exacerbates the national-level decline in wetlands.
Investors
Many investors have safeguard policies to minimise environmental and social impacts from their
projects. By providing a more comprehensive understanding of the socio-economic costs from a
project’s impacts and dependencies on biodiversity, NCAs help investors to screen projects for
compliance with their policies and to assess the sustainability of a project in the long-term.
Businesses
Businesses depend on natural capital, such as depending on clean water to produce tarmac for
building a new road. Businesses can also affect natural capital positively, such as improving air
quality, or negatively such as pollution. These dependencies and impacts generate costs and
benefits not only for the business but also for society and the economy. NCAs provide a mechanism
for understanding and quantifying dependencies and impacts on biodiversity, as well as the risks
and opportunities. This enables more informed decisions when designing, constructing, operating
and decommissioning infrastructure projects.
Page 8 of 47Social & economic outcomes from biodiversity ‘no net loss’
2.4 A check-list for Natural Capital Accounts of No Net Loss
NCAs can be undertaken as part of an ESIA or independently. NCAs can also incorporate measures
of a development’s losses and gains in biodiversity, which is typically from use of a biodiversity
metric. As well as following natural capital accounting methods (e.g. eftec 2017), these NCAs should
incorporate principles and methods for both NNL and ESIAs that include:
☐ Undertake the NCA as early as possible
Key decisions about an infrastructure project are often made during the early stages of its lifecycle,
such as when a project’s location is set during the feasibility stage. The earlier the NCA is
undertaken, the more it can inform decision-making to generate commercial benefits. For example,
avoiding biodiversity loss at a project’s scoping stage can avoid costs on lengthy consent processes
and extensive mitigation.
☐ Clarify the purpose and scope at the start
It is essential to clarify the purpose of the NCA, as well as how it will be used and who the intended
users are. This will inform the scope of the account, which might be limited by practicalities such as
access to data. An example statement on the purpose and scope of an NCA is:
This NCA is to inform the design of biodiversity NNL that is sustainable and fair for local people. It
only regards the development project’s direct and permanent impacts on biodiversity during
construction and operation. It does not reflect any indirect, temporary or cumulative impacts on
biodiversity, or the project’s dependencies on biodiversity, as access to data was limited.
Furthermore, monetary values in the NCA are only partial values that do not reflect the full value of
biodiversity. The NCA is intended to be used with the project’s biodiversity assessment, so that both
inform application of the mitigation hierarchy and the design of NNL for biodiversity and people.
The Natural Capital Protocol contains guidance on defining the purpose and scope of NCAs.
☐ Keep in impacts that are scoped-out from ESIAs
ESIAs can involve scoping out impacts on biodiversity that are not deemed significant (significance is
usually defined within national legalisation or ESIA guidelines e.g. IAIA). Whereas all impacts on
biodiversity are incorporated into designs of NNL and should be included within NCAs, especially if
the impacts generate adverse social or economic outcomes. For example, a public park that will be
lost to a development project might have low biodiversity value but be cherished by local residents.
ESIAs are typically undertaken as an iterative process whereby the impact assessment informs the
project’s design. NCAs can, and should, be included in this iterative process, although any
assumptions made during the early design stage should be clearly communicated.
Page 9 of 47Social & economic outcomes from biodiversity ‘no net loss’
☐ Avoid impacts on irreplaceable features
Development projects should avoid impacts on irreplaceable biodiversity features. Losses of these
features cannot be offset to achieve NNL. Including irreplaceable features in the NCA can help to
apply the mitigation hierarchy because the economic and social consequences of their loss will be
explicitly clear (and often more so than traditional ESIAs).
Some biodiversity features are irreplaceable to people, for example where people place strong
cultural values on a specific habitat in a specific place. Making explicit that these biodiversity
features are irreplaceable to people is essential to apply the mitigation hierarchy.
☐ Apply the mitigation hierarchy
Biodiversity NNL and ESIAs are founded on the mitigation hierarchy. NCAs help to apply the
mitigation hierarchy, especially by quantifying the costs to society and the economy from losses of
biodiversity. For example, a new factory causes the loss of woodland. The NCA quantifies the
resulting damaging impacts on air quality, climate regulation and flood mitigation, and the cost to
the government (and ultimately tax payers) to address these impacts.
☐ Define the geographical coverage
ESIAs of infrastructure projects typically cover a ‘zone / area of influence’, which can be defined as
the area over which ecological features may be subject to significant effects as a result of the
project and its activities. The zone of influence can be used to construct the NCA, while making sure
that direct, indirect and cumulative impacts on biodiversity from both the infrastructure project and
any associated biodiversity offset are covered.
☐ Clarify the baseline
Baselines of NCAs should be considered extremely carefully because the choice affects the results.
ESIAs involve establishing a baseline of biodiversity before construction starts. Change in baseline
conditions after the construction, operation and decommissioning stages are then determined. For
biodiversity NNL, the baseline is used to evaluate whether NNL is achieved and can be:
Static: status of biodiversity at a fixed point in time pre-works, which is compared to
biodiversity after the development project.
Dynamic: the anticipated rate of change in biodiversity without the development project
i.e. the counterfactual* based on future projections and/or assumptions.
*Counterfactuals compare the development project’s NNL with what would have happened to
biodiversity without the development1.
1 For more discussion on counterfactuals and other frames of reference to evaluate NNL, see Bull et al, 2014. Also see Maron et al, 2018
for more discussion on reference scenarios for NNL.
Page 10 of 47Social & economic outcomes from biodiversity ‘no net loss’
☐ Set timeframes
The timeframes of the NCA should be clarified, for example whether completing accounts for each
project lifecycle stage of construction, operation and decommission, and/or when the biodiversity
NNL outcomes are fully realised e.g. on maturity of a biodiversity offset. The choice might depend
on availability of data and other practicalities, but it should be justified with any implications for the
NCA fully acknowledged.
☐ Assess and value benefits, where appropriate
NCAs should describe all benefits that people obtain from biodiversity affected by an infrastructure
project, in qualitative terms as far as possible. NCAs then involve quantifying and assigning
monetary values to the benefits. However, it is often not possible or appropriate to quantify or
value all of the benefits, for example where people have strong cultural associations with
biodiversity. So NCAs usually involve selecting benefits to quantify and value. This selection can be
based on the significance of impacts from the infrastructure project, although it might depend on
availability of data. Either way, it is important to justify the selection and ensure that benefits not
quantified or valued are still represented in the NCA. It is also important to clarify the extent to
which biodiversity is, and is not, represented in monetary valuations, as monetary values ascribed
within NCAs are usually specific to situations and markets, and only cover part of the value
generated by biodiversity.
☐ Construct accounts for individual ecosystem services
NCAs should comprise accounts for individual ecosystem services. Ecosystem services should not be
grouped together to produce a single figure from which to make decisions. This is important for:
People affected by No Net Loss
NNL can affect different people in different ways. For example when people living near an
infrastructure project are negatively affected from the loss of biodiversity, but people living further
away benefit from ecosystem services generated by the project’s biodiversity offset.
NCAs are incredibly useful to make explicit who is affected - and how - in terms of losses and gains
in ecosystem service provision. But this relies on NCAs being constructed for individual ecosystem
services.
It also requires NCAs being undertaken at an appropriate level of assessment. For example,
assessing ecosystem service provision at the household level will detect impacts at the household
level, whereas village level assessments will only detect impacts at the village level and not to
individual households. These assessments should be undertaken at the level where significant
impacts on people from biodiversity losses and gains occur (see Bull et al, 2018 for more details).
Page 11 of 47Social & economic outcomes from biodiversity ‘no net loss’
Avoiding trade-offs and securing win-wins
Infrastructure projects seeking NNL of biodiversity can generate win-wins when the project is built
and operated with no overall loss of biodiversity or ecosystem service provision. But there can be
trade-offs to avoid, such as not providing one ecosystem service at the expense of another. NCAs
can help identify the trade-offs, but this relies on NCAs being constructed for individual ecosystem
services and at an appropriate level of assessment.
☐ Apply good practice principles to achieve NNL for both people and biodiversity
Good practice principles for development projects to achieve NNL for both people and biodiversity
have been published (Bull et al, 2018). NCAs can support application of these principles, thereby
ensuring good practice to design, implement and maintain biodiversity NNL projects that are fair
and sustainable to people. NCAs can also go beyond impacts on local people affected by a
development project and be used to assess impacts at national and international levels, such as
climate regulation
☐ Incorporate well-being
Monetary values cannot capture the cultural and social dimensions of people’s relationships with
biodiversity. Consequently, NCAs may miss how people are truly affected by NNL. This can be
overcome by combining NCAs with assessments of human well-being. Assessing human well-being
is part of the good practice principles for the social aspects of NNL (see above), which defines well-
being as:
A positive physical, social and mental state that encompasses the objective, material aspects of
people’s lives (e.g. housing, income, livelihoods, health, and the environment), relational aspects
(e.g. community networks and empowerment), and subjective components that capture individuals’
assessments of their own circumstances (i.e. how happy they are with their current situation).
☐ Assess both impacts and dependencies
ESIAs identify, evaluate and propose mitigation for impacts of development proposals before major
planning decisions are made. NCAs should incorporate both impacts and dependencies on
biodiversity. Dependencies are business activities that rely on biodiversity, such as those in Figure 4
and in Appendix D. Impacts and dependencies vary according to the life-cycle stage of an
infrastructure project. In some situations, an NCA might focus primarily on impacts, for example
under the Corporate Natural Capital Framework. However for NNL, including dependencies can be
essential to avoid and then mitigate impacts on ecosystem services (Sonter et al., 2018).
Page 12 of 47Social & economic outcomes from biodiversity ‘no net loss’
Figure 4: Examples of business dependencies on natural capital
Source: Natural Capital Coalition Protocol, 2016
☐ Consider a phased approach
A phased approach starting with piloting NCAs can help companies to progress to comprehensive
NCAs. For example a company pilots NCAs that only include direct impacts on biodiversity. It uses
the learning to adopt more detailed NCAs that include direct, indirect, temporary and cumulative
impacts on biodiversity, as well as project dependencies on biodiversity.
Page 13 of 47Social & economic outcomes from biodiversity ‘no net loss’
3. Natural Capital Accounts of biodiversity by African countries
3.1 African countries
The Gaborone Declaration for Sustainability of Africa (GDSA) was ratified by ten African Heads of
State in 2012, and includes a commitment to explore the valuation and measurement of natural
capital. In 2016, the GDSA commissioned a report on Natural Capital Accounting across the 10 GDSA
countries, plus Uganda and Madagascar (two countries that, at that time, had not joined the GDSA).
This report described each country’s progress in Natural Capital Accounting and ecosystem
valuation, focusing on public sector initiatives. It showed that many GDSA countries had started
national or sub-national NCAs to quantify various natural capital stocks. Energy, forest/timber and
water were the most common stocks being accounted for (Table 1). Some countries had
undertaken NCAs of particular habitats and had valued a subset of the flows of benefits from these.
For example, in 2009, Kenya produced an Environmental Economic Account for its forestry sector
that focused on timber and non-timber forest products (Reuter et al, 2016).
While progress had been made at a national level, there was no evidence of NCAs of infrastructure
projects.
Table 1. Past, current and planned national Natural Capital Accounting efforts in GDSA countries
in 2016. Adapted from Reuter et al, 2016.
Ecosystem Accounts
Aquatic resources
Forest/Timber
Lakes/Rivers
Wetlands
Minerals
Fisheries
Wildlife
Carbon
Energy
Water
Land
Soil
Country
Botswana
Gabon
Ghana
Kenya
Liberia
Madagascar
Mozambique
Namibia
Rwanda
South Africa
Tanzania
Uganda
Legend:
Expressed interest at
Past Efforts Current Efforts Future Efforts Lower priority
GDSA
Page 14 of 47Social & economic outcomes from biodiversity ‘no net loss’
3.2 Uganda
3.2.1 Uganda’s requirements for NCA
Several strategic reports and plans by the Ugandan government stipulate the need for NCAs. For
example:
The National Development Plan II (NDP II) for Uganda (GoU 2015) emphasises the need for
sustainable use and effective management of natural capital.
The Uganda Green Growth Development Strategy 2017/18-2030/31 (UGGDS) identified
five areas with the highest potential to achieve national development goals. Natural capital
management is one of these and focuses on tourism development, sustainable forestry,
wetlands and optimal water resource management. The UGGDS recommends that
Uganda’s government ‘undertakes comprehensive environmental economic accounts
across all sectors’ and that ‘the scope of NCAs should be wide, to capture socioeconomic
activity and to support future policy and economic activity’ (Uganda NPA, 2017).
In addition:
The State of the Environment Report for Uganda (NEMA, 2016b), recommends innovative
management approaches to ensure the environment continues to support human
development and well-being.
The National Biodiversity Strategy and Action Plan for Uganda (NBSAP II) (NEMA, 2016a)
contains objectives on strengthening the management of biodiversity and promoting
sustainable use.
3.2.2 Uganda’s NCA
An initial set of ecosystem accounts at the national level has been completed for Uganda. These
accounts quantified stocks for selected ecosystems using the System of Environmental-Economic
Accounting – Experimental Ecosystem Accounting (SEEA-EEA) framework. The accounts provide a
basis for assessing trends in the extent of ecosystems over time (UNEP-WCMC, 2016). However
there is no evidence of NCAs of infrastructure projects.
Various studies have been undertaken to identify the benefits people attain from Uganda’s
biodiversity. Some studies have assigned monetary values to these benefits, for example, an
economic valuation of Uganda’s forest resources in 2010 showed that the forest sub-sector
contributes 8.7% to Uganda’s GDP. However, none of these studies were formally undertaken for a
NCA but are independent and follow different methodologies. Nonetheless, they illustrate the
range of benefits people attain from Uganda’s biodiversity and possible monetary values of these.
Page 15 of 47Social & economic outcomes from biodiversity ‘no net loss’
4. Contextual information to construct the NCA case study
Chapter 5 presents a NCA of losses and gains in wetlands from the construction of a sugar cane
factory in Uganda. This chapter summarises the contextual information that was used to construct
the NCA – namely the stocks of Uganda’s wetland, the benefits from these wetlands to people and
the monetary values of these benefits. Further details are provided in Appendices A to D.
4.1 Stocks of Uganda’s wetlands
Uganda’s wetlands cover approximately 29,000 sq km, which equates to approximately 13% of the
country. However, Uganda’s wetlands have substantially declined with only 68% of wetlands
remaining from wetland coverage in 1964. The greatest losses have occurred in East Central areas
where only 35% of wetlands remain. Major causes of wetland decline include encroachment for
agriculture; over-harvesting for domestic and commercial use (e.g. fishing, wetland plants, clay);
and erosion from nearby farming practices.
4.2 Benefits from Uganda’s wetlands
Uganda’s wetlands provide benefits at international, national and local levels. Examples include
climate regulation at the international level, and water purification and flood attenuation at the
national level. At the local level, approximately 4,000,000 people live in and around Uganda’s
wetlands. Over 80% use wetland resources for their household food security needs. In addition,
Uganda’s wetlands are a principle supply of fresh water for human use and a major source of water
for farming. Rural communities rely on wetlands for various subsistence needs (e.g. food and
medicinal purposes) and for livelihood support (e.g. selling building materials).
4.4 Value of the benefits from Uganda’s wetlands
Various studies have been undertaken on the monetary value of Uganda’s wetlands. These
represent ad-hoc independent studies on certain benefits (not all) using different methods to assign
monetary values. Consequently the credibility of the studies cannot be assured. Nonetheless, they
are useful illustrations of potential monetary values of Uganda’s wetlands. Appendix B contains a
selection of these studies, from which example values of Uganda’s wetlands include:
Fish spawning at US$363,815 per year.
Livestock pastures at US$4.24 million per year.
Domestic water use at US$34 million per year.
Flood control at US$1.7 million per hectare per year.
Crop farming ranging from US$4.2 million to US$25 million per year.
Note that certain benefits from Uganda’s wetlands cannot be assigned monetary values, such as
cultural values (Appendix A).
4.5 Impacts and dependencies on Uganda’s wetlands
Various sectors of society and industry both affect and depend on Uganda’s wetlands, such as the
examples in Appendix D.
Page 16 of 47Social & economic outcomes from biodiversity ‘no net loss’
5. Natural Capital Account case study
This chapter presents a case study example of Natural Capital Accounting for an infrastructure
project seeking No Net Loss of biodiversity. The case study is fictitious. It regards losses and gains in
wetlands from the construction of a sugar cane factory in Uganda. It draws from research of
wetlands in Uganda and elsewhere in Africa, and focuses on wetlands because of their importance
to rural communities in Uganda. The NCA is based on the Corporate Natural Capital Accounting
method (eftec et al., 2015).
5.1 The case study: sugar cane factory construction
In this case study, the developer Kapari Ltd is constructing a factory to process sugar cane. The
factory’s location is in rural Uganda near to Kapari’s existing sugar cane plantations and to roads for
transporting the processed product to market. The factory was subject to an ESIA. Initially factory
construction resulted in substantial losses of the ‘Leandro’ Wetland. However after following the
mitigation hierarchy, the factory was re-located to avoid as much wetland loss as possible in order
to avoid and minimise both biodiversity and social impacts – biodiversity impacts from losses of this
ecologically valuable habitat; and social impacts as local communities depend on the wetland for
subsistence and livelihoods. The residual loss of wetland is 1500ha on the eastern side (out of a
total wetland area of 10,000ha). Recommendations from the ESIA first included comprehensive
measures to mitigate environmental and social impacts of factory construction and on-going
operations. Then a specific recommendation was made for a biodiversity offset to achieve NNL of
wetland habitat whilst ensuring that local communities are ‘no worse off’ as a result of NNL.
The ESIA contained an outline design of the wetland offset from a biodiversity perspective: the
offset will be located on degraded grassland of extremely low ecological value on the western
boundary of the wetland, and will be designed to be the same type of wetland, and to generate the
same ecological functions, as that lost.
Regarding the size of the offset, at the time of this case study there is no Ugandan metric for
measuring losses and gains in biodiversity from development in order to identify requirements for
NNL. So the ESIA proposed that the offset be x4 the affected area, i.e. the permanent loss of 1500ha
of wetland will be offset by the creation of 6000ha of wetland.
Consent for the sugar cane factory was granted because the factory will provide a substantial
number of jobs for local communities and will boost economic activity within the region. But
consent was granted with several conditions that Kapari Ltd has to discharge. These include the
establishment of a Trust Fund to finance a 50-year wetland offset management plan, and approval
by the regulators of a detailed design of the wetland offset that demonstrates NNL of wetland
habitat will be achieved whilst ensuring that local communities are ‘no worse off’.
Page 17 of 47Social & economic outcomes from biodiversity ‘no net loss’
5.2 Purpose and scope of the Natural Capital Account
Kapari Ltd’s immediate priorities are to discharge conditions of the consent so that factory
construction can start. The ESIA team propose that they undertake a NCA to identify measures for
ensuring that local communities are ‘no worse off’ from NNL. They also put forward that a NCA can
improve management of natural assets for the whole lifecycle of the factory thereby decreasing
operational risks over the long-term.
Kapari Ltd recognises the NCA will build on the ESIA by quantifying impacts of wetland loss on local
communities – and that by informing the offset design, will help to discharge conditions of the
consent. But they are uncertain of all benefits from a NCA, so only commission a NCA of losses in
wetland from factory construction. Subsequently at this stage, the purpose of the NCA is to inform
the design of the wetland offset so that local people are no worse off. The NCA will utilise
qualitative social and ecological assessments in the ESIA including the outline design of the offset,
but the scope excludes the full lifecycle of the factory as well as dependencies of factory operations
on natural capital.
After completing this baseline NCA, the ESIA team propose to update the NCA as part of an iterative
design process of the wetland offset. Kapari Ltd agree, so changes in ecosystem service provision
resulting from the offset are fed back into the design to ensure that the offset achieves the desired
biodiversity and social outcomes (Figure 5).
NOTE: in practice, NCAs are not yet mainstreamed within many industrial sectors and might be
undertaken after the ESIA to inform the detailed design stage. This case study reflects this situation,
while emphasising that, as noted in Section 2.4, the earlier a full NCA is undertaken of both impacts
and dependencies, the greater its commercial advantages.
Figure 5. Possible iterative design process whereby Natural Capital Accounts inform a detailed
design of Biodiversity No Net Loss for an infrastructure project
Initial natural capital
Outline No Net Loss NCA baseline including stocks & ecosystem
design the offset services incorporated
into NNL design
Final NNL design & NCA
NCA updated to capture
when desired Simultaneous updates of
change in stocks &
biodiversity & social the NNL design & NCA
ecosystem services
outcomes are achieved
Page 18 of 47Social & economic outcomes from biodiversity ‘no net loss’
5.3 Baseline before factory construction
The ESIA team complete the following baseline NCA:
5.3.1 Natural Capital Stocks
The Leandro wetland is a swamp within rural Uganda. It is not within a protected area. Ecological
surveys for the ESIA showed that the wetland provides habitat for various species including:
Plants: including Papyrus species, Acacia species, Phoenix species, Phraganites species,
Sorghastrum species and Cyperus species.
Birds: globally endangered species including the Shoebill stork (Balaeniceps rex; IUCN
conservation status is Vulnerable) and Fox’s weaver (Ploceus spekeoides), also habitat for
migratory water birds.
Fish: including Tilapia, lungfish and catfish.
Monkeys: including the red-tailed and black and white colobus monkeys.
The Leandro wetland is 10,000 hectares. The sugar cane factory will be located on its eastern side
and will result in the permanent loss of 1500 hectares. The offset is to be located on degraded
grassland of extremely low ecological value on the western boundary of the wetland (Table 2).
As part of the ESIA, local people were interviewed to assess social aspects of the wetland. This
showed that the Leandro wetland is part of local folklore history with many people describing that a
wetland has been present in that location for as long as they can remember, and that their
community currently has a range of uses and values associated with the wetland including
subsistence and livelihood needs, as well as cultural.
Table 2. Natural Capital Stocks Register
Stocks Baseline
Leandrow wetland Total wetland area 10,000 hectares
Area of wetland 1500 hectares
permanently lost from
factory construction
Degraded grassland area proposed for the wetland offset 6000 hectares
5.3.2 Ecosystem service provision (benefits to people)
The area of wetland to be affected by factory construction is used by approximately 9000
households, bordering the eastern side of the wetland, for various subsistence and livelihood
activities (Table 3). These include obtaining clean water for domestic use, food for subsistence,
resources for agriculture and building materials, as well as visiting sacred sites within the wetland as
part of long-standing cultural traditions. These households are rural farmers who depend on
natural resources for subsistence and livelihoods. Constructing the NCA also identified various
benefits the wetland provides for people at regional, national and international levels. These are
shown in Table 3 and include:
Page 19 of 47Social & economic outcomes from biodiversity ‘no net loss’
At regional and national levels, natural resources derived from the wetland (including fish and
building materials) are sold at town markets, stimulating economic activity. The wetland also
provides flood control that protects farmsteads, infrastructure and buildings, as well as waste water
treatment. By providing habitat for bird species of international conservation interest, the wetland
is a key site for international tourism that boosts local and national economic activity.
At the international level, key benefits include carbon storage and providing habitat for bird
species of international conservation interest.
Table 3. Key benefits to people generated by the wetland before factory construction
Ecosystem Key benefits Benefits to people*
service Locally Regionally & Internation
nationally ally
Provisioning Examples
Food Fish, wild game, fruit, grains ✔✔ ✔
Fresh water Storage & retention of water for ✔✔ ✔
domestic, industrial & agricultural use
Materials & fuel Logs, fuelwood, papyrus peat and ✔✔ ✔
fodder
Regulating Examples
Climate Source of & sink for greenhouse ✔✔ ✔✔ ✔✔
Regulation gases; influences local and regional
temperature, precipitation & other
climatic processes.
Water Retention, recovery & removal of ✔✔ ✔
Purification & excess nutrients and other pollutants.
Treatment
Nutrient cycling Storage, recycling, processing and ✔✔ ✔
acquisition of nutrients
Natural Hazard Flood control and storm protection. ✔✔ ✔
Regulation
Cultural Examples
Spiritual & Local spiritual sites ✔✔ ✔
Inspirational
Recreational Opportunities for tourism that ✔ ✔ ✔✔
generates economic activities
*Ticks indicate the relative importance of the benefits at each level of beneficiary (higher numbers = more important)
The area proposed for the biodiversity offset is degraded grassland that is of extremely limited use
or benefit to local communities bordering the western side of the wetland (approximately 12,000
households), or to society at national and international levels.
Page 20 of 47Social & economic outcomes from biodiversity ‘no net loss’
5.3.3 Value of the benefits
As described above, the wetland generates various benefits for people at local, national and
international levels. Several benefits are appropriate for assigning monetary values. For example,
the local and national economic activity resulting from tourism; the income that local fishermen
gain from selling fish to town traders as well as the income that town traders make from selling fish
at markets; and the plants that local people use as building materials.
NOTE: when undertaking NCAs in practice, usually a selection is made of the benefits (i.e. ecosystem
services) to assign monetary values. This selection can be based on significance to beneficiaries;
whether appropriate to assign a monetary value; and, the availability of good quality, credible data
for calculating monetary values.
Based on the data available from previous studies of Uganda’s wetlands, the following ecosystem
services were selected for monetary valuation:
Climate regulation
Flood control
Clean water for local domestic use
Pastures for cattle grazing
Fish spawning grounds
NOTE: the monetary valuations below are only for illustrative purposes. They are not intended to
represent the complete value of the wetland in the case study, especially given the variety of
ecosystem services it generates (as is true for many wetlands within Uganda). Rather this section
aims to illustrate the potential monetary values of specific ecosystem services – potential because
the calculations are based on previous independent, ad-hoc studies of Uganda’s wetlands that could
not be assured (see the Appendices for details), whereas in practice, NCAs should be developed from
both published literature and data gathered by field surveys.
Climate regulation and flood control
The wetland area to be affected by factory construction generates an annual benefit of
approximately US$397,500 in climate regulation. This represents benefits provided by the wetland
area in terms of carbon sequestration for local, national and international communities.
The wetland also generates an annual benefit of approximately US$10 million in flood control. This
represents the wetland’s properties as a natural ‘sponge’ that traps and slowly releases surface
water, rain, groundwater and flood waters, as well as slowing the speed of flood waters and
distributing them more slowly.
Page 21 of 47Social & economic outcomes from biodiversity ‘no net loss’
Monetary values of climate regulation and flood control were estimated from previous studies of
Uganda’s wetlands that used contingent valuation methods, including values derived from Karanja
et al, 2001, as cited in Kakaru, 2013 (see the Appendices for details). The degraded grassland
proposed for the wetland offset provides negligible climate regulation and flood control benefits
(Table 4).
Table 4. Baseline monetary values of climate regulation and flood control
Stock Benefit US$ per ha per year Baseline annual value
US$
1500ha of wetland Climate regulation 265 397,500
permanently lost Flood control 7240 10,860,000
from factory
construction
6000ha proposed Climate regulation n/a n/a
wetland offset on Flood control n/a n/a
degraded grassland
Clean water for local domestic use
The wetland area to be affected by factory construction provides clean water for local domestic use
for approximately 9000 households bordering the eastern side of the wetland. These households
depend on the wetland for domestic water, and this equates to an annual benefit of approximately
US$394,200. This monetary value was estimated from previous studies (including Kakaru, 2013)
that identified average household use of domestic water and price of water per m3 (approximately
US$2) (see the Appendices for details). The degraded grassland proposed for the wetland offset
provides no clean water for domestic use (Table 5).
Table 5. Baseline monetary values of cleaned water for local domestic use
Stock Benefit Baseline value
1500ha of wetland Average domestic water use per 197,100
permanently lost from household (m3/year)
factory construction Market price of water per m3 US$2
Gross annual value of clean water US$394,200
for domestic use by 9000
households
6000ha proposed wetland Clean water for local domestic n/a
offset on degraded grassland use
Page 22 of 47Social & economic outcomes from biodiversity ‘no net loss’
Pastures for cattle grazing
Households bordering the eastern side of the wetland regularly graze cattle within fringes of the
wetland area to be affected by factory construction. An estimated 3300 cattle graze within the
wetland, which equates to approximately a total annual benefit of US$40,900. This was calculated
using the cost of leafy feeds that farmers would have to buy if the wetland pastures were not
available for cattle grazing, which was estimated to be US 0.2 per animal per day from previous
studies (see the Appendices for details). The degraded grassland proposed for the wetland offset
provides negligible provision for cattle grazing (Table 6).
Table 6. Baseline monetary values of cattle grazing
Stock Benefit Baseline value
1500ha of wetland Cattle grazing within wetland 3300
permanently lost from fringes by local communities
factory construction Market price of leafy feeds US$0.2 per cattle per day
Value per day for all cattle US$660
Gross annual value of wetland US$240,900
pastures for cattle grazing
6000ha proposed wetland Cattle grazing provision n/a
offset on degraded grassland
Fish spawning grounds
The wetland area to be affected by factory construction contains fish spawning grounds up to an
estimated 500ha. Households bordering the eastern side of the wetland primarily use this as a
source of food for subsistence. There are several ways to estimate the monetary value of the fish
spawning grounds, for example by the market price of fish caught. The approach adopted here was
to estimate the monetary value of 1 hectare of fish spawning ground from previous research, which
was US$6.3/ha (see the Appendices for details). Hence, the 500ha of fish spawning grounds equates
to an approximate annual value of US$3150. The degraded grassland proposed for the wetland
offset provides no fish spawning grounds (Table 7).
Table 7: Baseline monetary value of fish spawning grounds
Stock Benefit Baseline value
1500ha of wetland Fish spawning ground 500ha
permanently lost from Fish spawning ground per hectare US$6.3
factory construction Gross annual value of wetland US$3150
fish spawning grounds
6000ha proposed wetland Fish spawning grounds n/a
offset on degraded grassland
Page 23 of 47Social & economic outcomes from biodiversity ‘no net loss’
Local cultural values
Local cultural values of the wetland were assessed as part of the NCA, building on the assessment in
the ESIA. The ESIA revealed that local people place strong cultural attachments on the wetland area
to be affected by factory construction, as there is a sacred site where water spirits are present. The
water spirits are worshipped by local people who take offerings to ask the spirits for various aspects
such as a good harvest, rainfall and a prosperous life. Local people also bathe in water nearby as
they believe this washes away bad luck, and some mix water with medicinal herbs to treat illnesses.
These cultural values were included in the NCA and the loss of the sacred site was addressed as part
of the factory development (Box 1).
Box 1. Addressing the loss of a sacred site
Factory construction will cause the permanent loss of a sacred site of local cultural value within the
wetland. Consultations for the ESIA with various local community members (to avoid consultations
with only local elites) revealed that local people felt that relocating the spirits was acceptable to
address this loss. The consultations also revealed that relocating spirits is an extremely sensitive
activity, requiring the relocation site to be nearby where the people who were visiting the original
sacred site can access, and to be directed by the local spiritual leader.
Kapiri Ltd commissioned the ESIA team to undertake a series of consultations over an extended
period of time, with various local community members (including poor, vulnerable and marginalised
groups) to produce a fully comprehensive plan to relocate the spirits that local communities accept.
Kapiri Ltd also committed funds to implement the relocation and to protect the relocation site from
construction activities and on-going factory operations.
Baseline Natural Capital Account
The wetland area to be affected by factory construction provides ecosystem services at local,
national and international levels. Five ecosystem services generate over US$11 million in benefits
per year. As these were only five out of all ecosystem services provided by the wetland, the actual
monetary value of the wetland will be substantially higher. In addition, local communities bordering
the affected wetland area place strong cultural values on sacred sites within the wetland. In
contrast, the degraded grassland proposed for the wetland offset is not of ecological value nor does
it generate any significant ecosystem services (Table 8).
Page 24 of 47Social & economic outcomes from biodiversity ‘no net loss’
Table 8. Summary of baseline Natural Capital Account of selected ecosystem services generated
by the wetland area affected by factory construction
Natural Capital Local people Benefits Annual Monetary Value (US$)
Stocks affected
1500ha of 9000 households Climate regulation 397,500
wetland bordering the
permanently lost eastern wetland Flood control 10,860,000
from factory side
construction Clean water for domestic 394,200
use
Cattle grazing provision 240,900
Fish spawning ground 3150
Local cultural value High cultural value on scared
site of water spirits
6000ha wetland 12,000 households All of the above Negligible
offset on bordering the
degraded western wetland
grassland side
5.4 Designing No Net Loss of Biodiversity using Natural Capital Accounting
With the baseline NCA, the ESIA team now commence the detailed design of the wetland offset.
They anticipate that the offset will take 20 years to be of a similar ecological status to the wetland
cleared for factory construction, where it achieves NNL of wetland habitat. So that offset planting
starts before losses of wetland are incurred, the planned timescale is:
2018: wetland baseline established
2019: offset implementation commences
2021: wetland cleared for factory construction
2039: offset reaches maturity
2069: completion of the 50 year wetland offset management plan
The next steps are to update the NCA as the offset design progresses, so that changes in wetland
stocks and ecosystem service provision resulting from the offset are incorporated into the offset
design. In practice this requires a detailed, careful approach. For illustrative purposes only, key
considerations include2:
Set the timescales
This stage of the NCA requires estimating ecosystem service provision, and the associated monetary
values, in 2039 when the wetland offset reaches maturity (i.e. is assumed to generate similar levels
of ecosystem services as the wetland cleared for factory construction), and in 2069 on completion
of the wetland offset management plan (i.e. after which protection of the offset is uncertain).
2 For a full list of considerations when constructing NCAs, please see ‘Developing Corporate Natural Capital Accounts’ (eftct et al, 2015).
Page 25 of 47You can also read