The Impact of Climate Change and Climate Variability on Groundwater Recharge in the Cauca Valley, Colombia - MSc thesis by Michiel Feijt
←
→
Page content transcription
If your browser does not render page correctly, please read the page content below
The Impact of Climate Change
            and Climate Variability on
          Groundwater Recharge in the
             Cauca Valley, Colombia

MSc thesis by Michiel Feijt
2015

Soil Physics and
Land Management
Group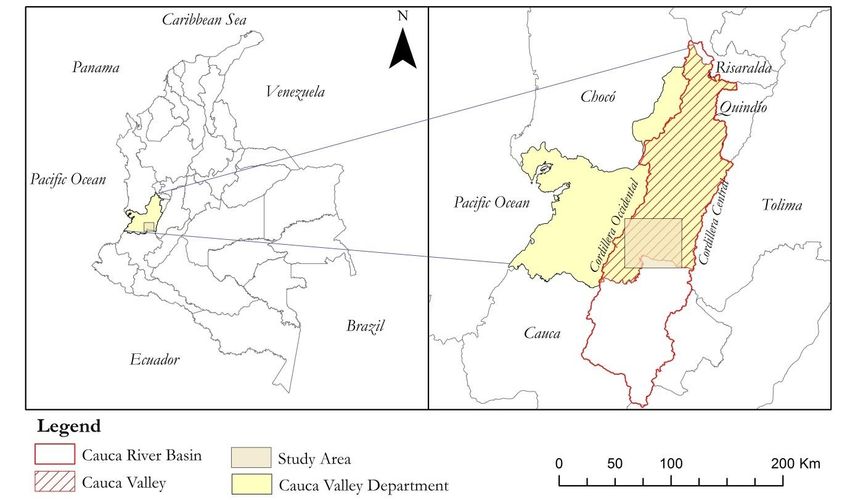
The Impact of Climate Change and Climate Variability on Areal
  Groundwater Recharge in Colombia’s Largest Sugar Cane
                  Region, Valle del Cauca

    Master thesis Soil Physics and Land Management Group
  submitted in fulfilment of the degree of Master of Science in
         International Land and Water Management at
            Wageningen University, the Netherlands

Study program:
MSc International Land and Water Management

Student registration number:
870312239030

Supervisors:
WU Supervisor:   dr.ir Martine van der Ploeg

Host supervisor: Marta Faneca Sànchez MSc

                 Micha Werner PhD MSc

Examiner:
                 ing. George Bier

Date:
09/2015

Soil Physics and Land Management Group, Wageningen University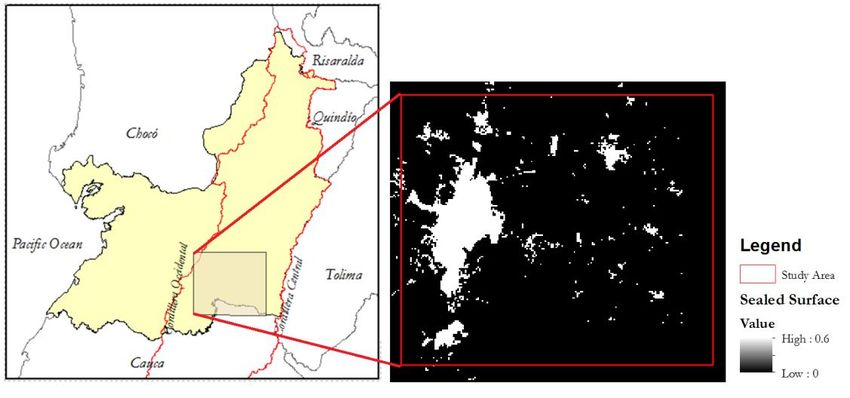
Abstract

The Cauca Valley is Colombia's largest sugar-cane producing area and this thirsty crop has a high
demand for water whole year round. During the dry seasons when the surface water table is too
low for water diversion, the farmers need to switch to groundwater extracting for irrigation. The
impact of the irrigation activities on the groundwater resources combined with the pressure of
climate change and the El Niño Southern Oscillation phenomenon ENSO is unknown.

The purpose of this study is to investigate the effects of long term climate change and short term
climate variability on groundwater recharge in a selected study area in the Cauca Valley,
Colombia. Furthermore to propose adaptation measures in order to mitigate the impact of
climate change. To achieve this meteorological data for precipitation and temperature was
collected. Climate scenarios were developed by adjusting these data based on climate change
projections published by Institute of Hydrology, Meteorology and Environmental Studies of
Colombia. The developed climate change scenarios represent the extreme 8.5 Representative
Concentration Pathway as described in the most recent Fifth Assessment Report of the IPCC.
The climate variability scenarios were developed using historical climate data sets, which were
resampled using the Nearest Neighbour strategy to generate new synthetic sequences.

To adjust the data sets several steps were taken using four different software tools. First the data
was analysed using the Standardized Precipitation Index to compare the weather stations. Second
the data was processed in Delft-FEWS, this is a climate forecasting GUI which is used for spatial
and temporal interpolation over the study area. Third, the generated grid was processed in a
python script that computes recharge over the study area based on climate conditions and
surface characteristics. And at last, this resulted in output files which contain recharge values and
can be visualized and used for calculations in iMOD. This is a hydrogeological model based on
MODFLOW and served as a tool in order to analyse and visualize the data.

The results of this research reveal that despite the projected increase in precipitation by IDEAM,
the recharge for the study area declines for the developed climate scenarios. Therefore
adaptation measures are proposed to keep the state of groundwater sustainable and adapt to
extremes in dry weather conditions for the future. These measures are in line with a by the
Colombian Government of Environment developed conceptual framework of climate change
which could be implemented by the water and agricultural sectors.

This research is conducted in the context of the ESCACES project initiated by Deltares institute
for applied research in the field of water, environmental authority Corporación Autónoma
Regional del Valle del Cauca, UNESCO-IHE Institute for Water Education and Netherlands
Enterprise Agency to encourage entrepreneurs in sustainable, agrarian, innovative and
international business.

                                                  i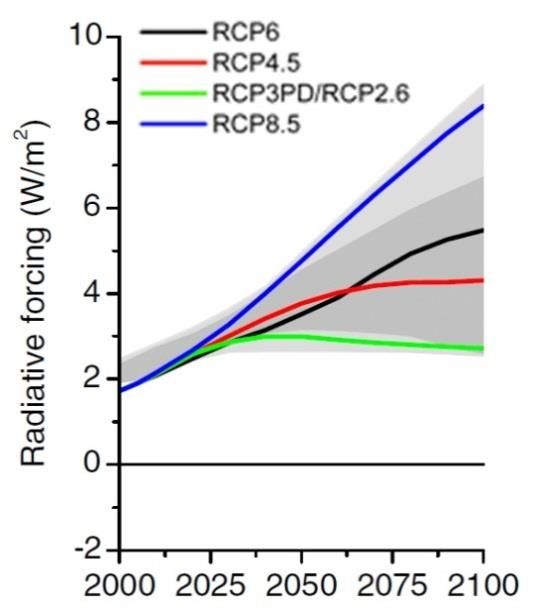
ii
Acknowledgement

First of all, I would like to express my very great appreciation to my supervisors Marta Faneca
Sànchez MSc and Micha Werner PhD for giving their time so generously. Their valuable and
constructive suggestions during the planning and development of this research work, their useful
critiques, and patient guidance has been very much appreciated.

I am particularly grateful for the feedback on my work given by dr.ir Martine van der Ploeg as
my supervisor from Wageningen University, and for helping me organizing the information and
assistance in keeping my progress on schedule.

I would also like to extend my special thanks to ing. Héctor Fabio Aristizábal for offering me a
working space for three months in the Water Resources Group of Corporación Autónoma
Regional del Valle del Cauca in Santiago de Cali. This made it possible to collect the data for this
research. And I wish to thank ing. Guillermo Céspedes López for helping me settling in Santiago
the Cali and his valuable suggestions to improve my work.

Finally, I wish to thank my parents for their support and encouragement throughout my study.

                                                 iii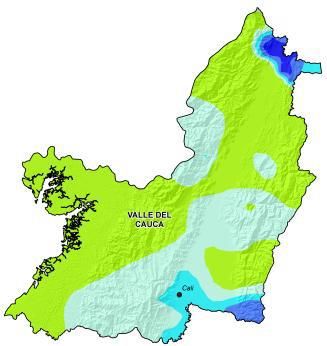
iv
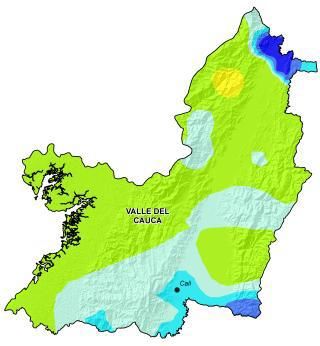
Table of Contents

Abstract ..........................................................................................................................................................i
Acknowledgement ..................................................................................................................................... iii
Table of Contents ....................................................................................................................................... v
List of Tables .............................................................................................................................................. vi
List of Figures............................................................................................................................................. vi

1. Introduction............................................................................................................................................. 7
     1.1 Background .................................................................................................................................... 8
     1.2 Problem statement ........................................................................................................................ 9
     1.3 Research Questions ...................................................................................................................... 9
     1.4 Objective of the study ................................................................................................................ 10
2. Concepts and Definitions .................................................................................................................... 11
     2.1 Study Area Description .............................................................................................................. 11
     2.2 Concept of Groundwater Recharge ......................................................................................... 14
3. Methodology ......................................................................................................................................... 19
     3.1 Data Collection and Data Sources............................................................................................ 19
     3.2 Boundary Condition and Model Concept ............................................................................... 21
     3.3 Used Research Tools for Data Analyses ................................................................................. 24
          3.3.1 Standardized Precipitation Index ................................................................................... 24
          3.3.2 Delft-FEWS ...................................................................................................................... 25
          3.3.3 Recharge Script ................................................................................................................. 27
          3.3.4 Irrigation ............................................................................................................................ 30
          3.3.5 iMOD ................................................................................................................................. 30
     3.4 Climate Scenario Development ................................................................................................ 31
          3.4.1 Climate Change Scenario................................................................................................. 31
          3.4.2 Climate Variability ............................................................................................................ 33
     3.5 Groundwater Indicator .............................................................................................................. 33
4. Results and Discussion ........................................................................................................................ 35
     4.1 Climate Change ........................................................................................................................... 35
     4.2 Climate Variability ....................................................................................................................... 41
     4.3 Discussion on climate change scenarios .................................................................................. 44
     4.4 Discussion on climate variability .............................................................................................. 45
     4.5 Calculation of Indicator ............................................................................................................. 46
     4.6 Adaptation Measures .................................................................................................................. 46
5. Summary, Conclusions, and Recommendations .............................................................................. 48
6. Bibliography........................................................................................................................................... 51
7. Appendix................................................................................................................................................ 54

                                                                                 v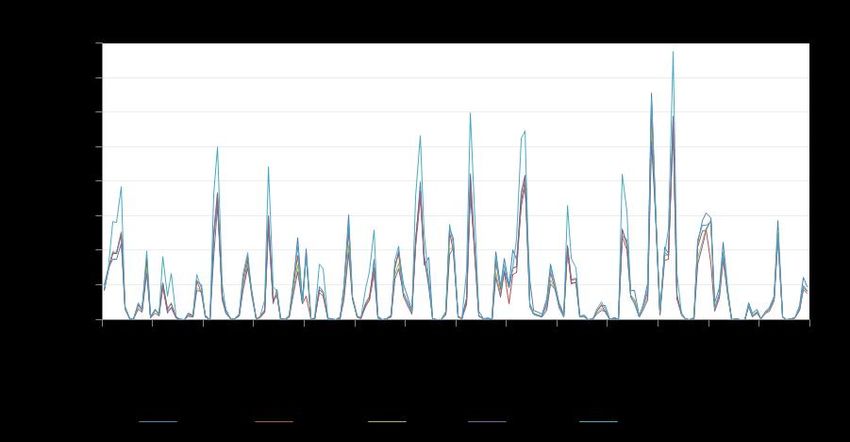
List of Tables

Table 1. Rainfall Calendar Cauca Valley department ....................................................................... 12
Table 2. Overview of the different data sources ............................................................................... 20
Table 3. Data of the initial climate dataset ........................................................................................ 20
Table 4. Weather conditions per SPI value......................................................................................... 25
Table 5. Overview of the PCRaster files and containing information ........................................... 29
Table 6. Overview of the applied formulas in the Recharge script .............................................. 30
Table 7. Developed climate change and climate variably scenarios ............................................. 31
Table 8. IDEAM RCP8.5 Projections Cauca Valley Department ................................................... 35
Table 9. Used factors to calculate the groundwater indicator....................................................... 46
Table 10. Drought adaptation measures for the Water and Agricultural sector ....................... 47

List of Figures

Figure 1. Location Study Area. ............................................................................................................... 11
Figure 2. Cross section of the Cauca Valley.......................................................................................... 13
Figure 3. Water fluxes in the Study Area. .............................................................................................. 14
Figure 4. Recharge Fluxes ........................................................................................................................ 16
Figure 5. Drought Dimension................................................................................................................. 17
Figure 6. Boundary Conditions ............................................................................................................... 21
Figure 7. 3D Visuazation and Cross-section......................................................................................... 22
Figure 8. Delft-FEWS Workflow. .......................................................................................................... 24
Figure 9. Data process Flowchart Delft-FEWS. .................................................................................. 27
Figure 10. Representative Concentration Pathways ........................................................................... 32
Figure 11. Spatial Distribution of Recharge .......................................................................................... 37
Figure 12. Average Recharge for all climate scenarios ........................................................................ 38
Figure 13. Recharge values in the study area calculated over the total time serie ........................... 38
Figure 14. Boxplot of Recharge values .................................................................................................. 40
Figure 15. SPI-12 Weather Station Alfonso Bonilla Aragón .............................................................. 41
Figure 16. SPI-12 Weather Station Univalle ......................................................................................... 41
Figure 17. Groundwater Permits ............................................................................................................ 42
Figure 18. Recharge Climate Variability Scenarios............................................................................... 43
Figure 19. Boxplot Recharge 1992. ........................................................................................................ 43
Figure 20. Sealed Surface Study Area ..................................................................................................... 45

PAGEBREAKsaf

                                                                         vi
1. Introduction
Water is essential for life, but its availability at a sustainable quality and quantity is threatened by
many factors, of which climate plays a leading role (IPCC, 2007). Climate change and climate
variability have been linked to global changes and show remarkable effects on the hydrological
cycle. It is expected that due to climate change the availability of groundwater resources will
significantly change (García González, 2007). This is a problem that has global impact on people,
industries and the environment. In 2008, the IPCC identified several gaps in knowledge related
to climate change and climate variability in relation to the availability of water resources. The
knowledge gaps were prioritized in need for further research. From these identified knowledge
gaps, the most important one was the need the improve understanding of climate change and
variability on the effects of groundwater resources (Bates et al. 2008). The prioritization of this
knowledge gap is because groundwater is the world’s largest storage of fresh water and functions
in many regions as the main source for fresh water and water reserve. Therefore, it has a key role
in sustaining primal human needs such as access to drinking water, food production and other
ecosystem services (Taylor et al. 2013). The IPCC emphasizes in their report that currently there
is not enough information available on how groundwater levels will develop under climate
change, and how it is affecting the current climate variability. The changes will result in economic
losses, social and environmental issues, especially the agricultural sector will be heavily affected
by changes in food production (Vincent, 2007; Brown and Funk, 2008). The effects of climate
change and variability have a direct impact on the groundwater recharge due to change in
infiltration by precipitation and indirect by groundwater extraction due to human activity. This is
already shown on a large scale in India and the Western United States where due to changes in
climate patterns and human activity the groundwater levels are declining (Scott and Shah, 2004).
On the other side, there are also studies that show that the intensification of rainfall due to
climate change leads to an increase in recharge, mainly in arid and semi-arid areas (Taylor et al.
2009). Evidence shows that climate change reached a point of no return due to the production
of carbon emissions. It is alarming that even if we stop the production of carbon emission
immediately that the process of warming of the oceans cannot be stopped (Blunden and Arndt,
2015). For this reason, information of local and regional impacts of climate change on
hydrological processes and water resources are becoming more important.
To see how these global changes and issues have an impact on the regional scale the following
research is conducted. The problem of the impact of climate on the recharge is studied by using
several research tools and hydrogeological model. This model is applied in the study area situated
in Colombia’s largest sugar cane producing regions Valle del Cauca. In this region the agricultural
sector is depending on groundwater resources for irrigation.
71.1 Background
The geographical location of Colombia brings complex hydro-climatological features. Colombia
has a lot of influences from the atmospheric circulations over the Pacific Ocean and the
Caribbean Sea, the Orinoco and Amazon River basins and the strong topographical gradient.
These conditions have a lot of influence on the atmospheric circulations (Poveda et al. 2001;
Poveda, 2010). This combined with the increasing temperature of the oceans influences the
atmosphere and affect natural phenomena’s like the El Niño Southern Oscillation (ENSO).
Several studies link the hydrological conditions in Colombia with the extreme phases of ENSO
(Mesa & Poveda, 1997; Carvajal, 2004; Poveda, 2004). For Colombia warmer sea surface
temperature (SST) refers to an El Niño which is associated with an reduction of precipitation
and droughts (Jiménez et al., 1998; Poveda, 2010; Córdoba-Machado et al. 2015). The cold SST
phase is referred to “La Niña” and is associated with an increase of precipitation. However, due
to the variations in climate through the country, the effects of the SST phase can be different
through the country. Studies show that during El Niño northern, central and western Colombia
are associated with a significant decrease in rainfall during the whole year. The south-western
region of Colombia shows the opposite behaviour. This illustrates the complexity and diversity
of the climate in Colombia.
The Cauca Valley is a region in the department “Valle del Cauca” located near the Pacific Ocean
in the southwest region of the country. The location close to the Pacific Ocean and between the
mountain ranges of the Andes makes it one of the regions most affected by climate in Colombia
(Jiménez et al. 2012). Due to climate change and climate variability it is expected that the water
availability in the Cauca Valley will change (Jimenez, 2012; Carvajal, 2013). Climate projections
show that the Cauca Valley will get a warmer climate and depending on the season an increase or
decrease in rainfall (IDEAM, 2015). How this affects the groundwater resources is unknown.
Another challenge is how the usage of the groundwater by the agricultural sector can continue
while maintaining economic development (Jimenez, 2012). These challenges are shown in a study
to quantify the vulnerability of the Rio Cauca River basin published in 2013. The study indicates
that the agricultural sector in the Cauca Valley is vulnerable to climate change and variability and
“requires immediate attention to taking priority actions and adaptation measures for the sector,
to maintain its competitiveness and income for farming communities” (CIAT, 2013). The
analyses show that production systems with greater technological support tend to have a better
adaptive capacity and are less sensitive to the changing climate. This observation indicates that
investments in technologies and production systems could be the best adaptation strategy in the
region to ensure high productivity in the future. Moreover, at the end of 2013 the department of
the Cauca Valley with the support of the Ministry of Agriculture has started the Agricultural
Development Plan which has led to investments in irrigation network to enhance the agricultural
production.
8Project background
This thesis is conducted within the context of the ESCACES project (Evaluación de las aguas
Subterráneas en Condiciones climÁtiCas ExtremaS). The objective of the project is to improve
understanding of the hydrogeological system of the Cauca Valley through data analyses and
river-wetland-aquifer relationships. This project was initiated by Deltares - an independent
institute for applied research in the field of water and subsurface and the Corporación
Autónoma Regional del Valle del Cauca (CVC) which is a regional environmental authority in
the Cauca Valley. The project is carried out in collaboration with UNESCO-IHE Institute for
Water Education, and supported by the Netherlands Entrepreneurial Agency.
1.2 Problem statement
Due to climate change it is unknown how the groundwater resources will develop in the future
in the Cauca Valley. Together with an expansion of the agricultural sector during the last few
decades the pressure on the groundwater resources has increased (Giraldo, 2014). The most
important crop in this area is sugar cane, which has an extremely high demand for water and
belongs to the group of the thirstiest crops (FAO, 56). Several million people live in the Cauca
Valley and they will be affected by the change in climate as well as the agriculture sector which
has an important contribution to the economy (Jimenez, 2012). Therefore, there is a need for
this study to examine the impact of changes in climate on the groundwater resources. This study
is conducted in a selected study area within in the southern region of the Cauca Valley.
1.3 Research Questions
To investigate the problem of climate change on the effects of groundwater recharge the
following research questions are formulated:
Main question
“What is the impact of climate variability on groundwater recharge in Cauca Valley, how is that
affected by climate change, and how can adaptation strategies contribute to mitigating that
change?
Sub questions
1) What are the effects of climate change and climate variability on the groundwater recharge in
the study area in the Cauca Valley?
a) What is the future climate projection for the Cauca Valley and how does this affect the
groundwater recharge in the study area?
b) What is the impact of extreme dry years on the groundwater recharge in the study area?
2) Which indicators can be used to measure the sustainability of the groundwater recharge?
3) Which adaptation strategies can be adopted by the public and private sector to improve the
state of the groundwater?
91.4 Objective of the study
This research seeks to answer the question how climate change and climate variability influences
the groundwater recharge rate of the groundwater resources in the study area in the Cauca Valley
in Colombia. Moreover it seeks to answer which measures could be implemented by the
agricultural and water management sector, including private and public sectors, in order to adapt
to the changes in the groundwater resources.
To answer the research questions this study aims to succeed in the following objectives. The
overall objective of this research is to collect climate data and use it to develop climate scenarios
to calculate recharge rates for the study area. Then the study aims to propose an indicator which
can be used to estimate the sustainability of the groundwater. The recharge rates are used to
calculate a sustainability indicator to analyse the change in state of the groundwater over a certain
time period of time. Finally climate change adaptation strategies are presented which are in line
with national policies in Colombia.
102. Concepts and Definitions
2.1 Study Area Description
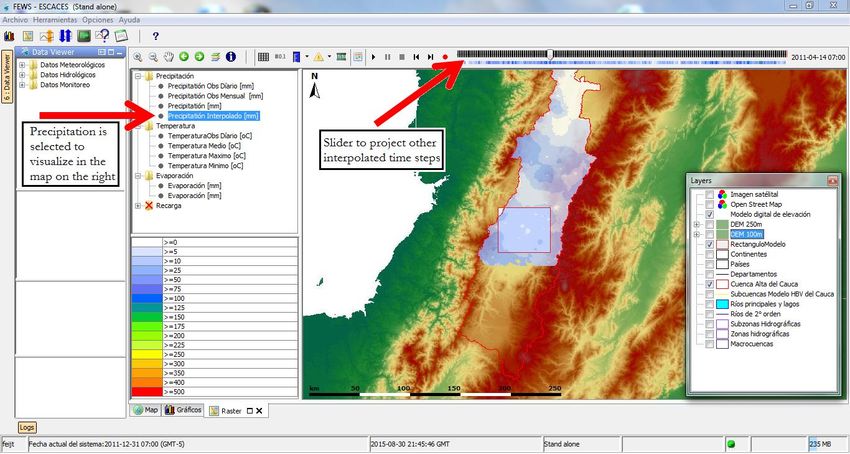
The study area is located in the department Valle del Cauca (Cauca Valley department) within the
brown rectangle of
Figure 1 and has a surface of 47km2. The study area includes a subsurface layer with an average
depth of 120 meter which is designated as “Unit A” where the recharge is studied. The study
area is situated between approximate 880 meter and 1000 meter above sea level in a valley which
is formed between two Andean mountain ranges Cordillera Occidental and Cordillera Central.
Figure 1 The location of the study area is shown in the brown rectangle and includes
approximate 120 meter subsurface. The red hatched area is the Cauca Valley, situated in the
Department Valle del Cauca (yellow) Source: author.
The study area was selected because it is one of the most intensive used areas in the Cauca River
Basin, in terms of agriculture, water consumption, human pressures and urbanization of the
cities Santiago de Cali, Jamundí and Palmira. The department is located in the southwest of
Colombia between 3° 05’ and 5° 01’ latitude N, 75° 42’ and 77° 33’ longitude and named after
the “Rio Cauca” the second most important river of Colombia after the Magdalena River. The
department borders five other departments, with Chocó, Risaralda and Quindío to the north,
Tolima to the east, Cauca to the south and facing the Pacific Ocean in the west.
The climate in the Cauca Valley department is characterized as tropical with relatively high
temperatures and uniform precipitation throughout the year. The Cordillera Occidental divides
the department into two regions, with on the west side of the mountain range the Pacific coast
11which is humid and full of jungle. And the Cauca Valley on the east side of the mountain range
of approximate 50 kilometre wide towards the Cordillera Central. The Cauca Valley has a
bimodal rainfall regime, which means that there are two rainy and two dry seasons per year
(Table 1). The first wet season starts after a transitions period of 40 days in March and ends at
the end of May (MAM). This is followed by a dry season June, July, August (JJA), which runs
until the middle of August and is followed again by three wetter months September, October,
November (SON) (Cenicaña, 2010).
Table 1
Rainfall Calendar Cauca Valley department
Source: Cenicaña, 2010
The formation of the Cauca Valley between the Cordilleras took millions of years. First the
Valley was filled with tertiary sediment from erosion of the Western and Central Cordilleras
(Figure 2). Then sediment transport of the Cauca River and its tributaries deposited quaternary
sediments which are mainly found at the foothills of the mountains together with large alluvial
fans. This process developed a layer 1000 meter thick and is divided into three levels, which are
called Unit A, B and C. Unit A has an average depth of 120 meter, followed by Unit B with a
depth ranging from 120 to 200 meters. Unit B is an impermeable layer of fine silt and clay, which
prevents water from infiltrating to Unit C. Unit B is important for protecting the water in Unit C
against pollution. Because of the low vulnerability and excellent water quality Unit C is seen as an
important groundwater reserve and therefore protected by legislations against excessive
groundwater abstraction.
12Figure 2 Cross section of the Cauca Valley (Gilboa and Guerrero, 1987; CVC, 2010).
The capital of the department is Santiago de Cali which is after Bogotá and Medellín the third
biggest city in population of the country with 2.3 million inhabitants (CIA, 2014). The
department is considered with a GDP of 9.3% as one of the most important departments of
Colombia after the departments Bogotá and Antioquia (Banco de la República, 2009). The
biggest contribution to the economy come from the sectors services, industry and agriculture
(BPS, 2014).
The agricultural sector covers the majority of the surface in the Cauca Valley with approximate
69%. The most commonly cultivated crop is sugar cane and its exploitation goes back to the
sixteenth century. It has characterised the valley over the centuries on its landscape and culture
due to the construction of irrigation canals and water storage reservoirs. Over the years,
sugarcane became the most important crop of the region and it created new opportunity to
develop new industries such as ethanol production for fuel. This economical developed caused
an increase in population and pressures on the environment in Cauca Valley. Nowadays sugar
cane has an even bigger role in the economy of Colombia with and export value of over 369
million US$ in 2006 (Escobar and Cristina).
According to the WWF Report “Agricultural Water Use and River Basin Conservation” sugar
cane is one of the four thirstiest crops together with, cotton, rice and wheat. The water
consumption by sugar cane varies according to the stage of development between 1200 and 1500
millimetre per year. Crop growth goes through three stages which are called the initial, mid-
season and late-season stage. These stages are expressed in crop coefficients named Kc values,
which indicate the amount of water a crop needs during a specific stage. Sugar cane has the value
of 1.25 the highest Kc value during mid-stage compared to other crops. The mid-stage for sugar
cane takes at least 180 to 220 days depending on cane type. Because a growing cycle takes
between the 320 and 480 days the cultivation of sugar cane demands a high amount of water all
year round (FAO-56). Depending on the humid and wind conditions the Kc ranges between 1.1
and 1.6 during mid-stage where the crop is full strength and needs consumes the most water
(Allen et al, 1998). According to the Colombian Sugarcane Research Center (Cenicaña) the
average Kc value for sugarcane during the complete grow cycle is Kc 0.7. This value includes the
initial, mid-season and late-season stages (Gonzáles et al., 2011). Besides the demand for water,
the root depth also has an important impact on the water cycle. Sugar cane can grow up to 2.5 to
3 meters high. The roots can develop a length that reaches between 1.2 and 2 meters deep. The
13deep roots intercept water which cannot percolate deeper to recharge the groundwater. This can
influence river flows as it intercepts run-off from the catchment into rivers (WWF, 2006).
2.2 Concept of Groundwater Recharge
Groundwater recharge is the central concept of this research. It is an important part of the
hydrological cycle where precipitation infiltrates into the soil and replenishes groundwater
supplies. It is defined as the volume of water that ingress into the saturated area of the soil where
it becomes part of the groundwater reserves. Not all the precipitation will lead to recharge and it
is depending on many factors. Figure 3 shows an overview of the studied water fluxes in the
study area which impact the groundwater recharge. It should be noted that for this study
recharge is studied using a vertical water balance approach and horizontal subsurface movement
is not taken into account.
Figure 3 Schematic representation of the water fluxes and layers of the study area.
The amount of water that infiltrates into the soil is calculated using the Curve Number Method
(curve number, or CN). The curve number is an empirical parameter and developed by the
USDA Natural Resources Conservation Service (USDA, 1986). This approach divides the
precipitation into the components infiltration and runoff. Infiltration is our main interest because
this volume may lead to recharge.
Runoff is calculated with the formula:
( )
( )
Where
Q = Runoff (mm)
P = Rainfall (mm)
14Smax= Potential maximum retention after runoff begins (mm)
Smax is related to the soil and land cover conditions of the watershed through the curve number.
Curve number has a range of 30 to 100 and is selected from a table developed by (USDA, 1986).
The table describes the curve number depending on soil type, soil infiltration and land use
resulting in:
Then the infiltration is the difference between the precipitation and runoff and calculated by
subtracting runoff from the precipitation
Overview of the infiltration process
Figure 4 shows the procedure when the fluxes precipitation or irrigated water enters the study
area. Precipitation is the main input flux and in this study the main driver for groundwater
recharge. The soil moisture, or water content, is also an important factor and quantifies the
volume of water that is stored between the pores of the soil. Once water is infiltrated it enters
the state “soil moisture” where it varies between field capacity and wilting point due to
evapotranspiration. The water can leave the soil again by evapotranspiration which is a combined
process of both evaporation from soil and plant surfaces and transpiration through plant
canopies. In the evapotranspiration process, the water is transferred from the soil and plant
surfaces into the atmosphere in the form of water vapour. If the soil moisture exceeds the
maximum soil moisture capacity (field capacity) water will infiltrate deeper into the ground below
the root zone (extinction depth). There it cannot be reached anymore by the roots of the plants
and cannot leave anymore by evapotranspiration. If this occurs then the water is recharged to the
groundwater. However, if the groundwater level is above the extinction depth it can be added
again to the soil moisture by capillary rise where the water could leave the soil by
evapotranspiration.
15Figure 4 Schematic representation from water fluxes entering and leaving the system. Source:
Author.
Climate
Climate is defined by the IPCC as “the average weather in terms of the mean over a certain time-
span and a certain area”. This is often measured over a period of at least thirty years. Climate
change refers to a change in the state of the climate and occurs for decades or longer periods
(IPCC, 2007). The climate variability is observed over a relatively short period of time and refers
to monthly, seasonal and annual values with regard to the average. Climate variability includes
inter seasonal variations (variations of two or three months) and annual (year on year). This
means that climate fluctuates above or below long-term averages (FAO; Cenicaña, 2008).
Depletion
Groundwater depletion forms an important aspect for this research since it indicates the state of
the groundwater. Depletion exists in many regions and is therefore described and defined by
several authors with different terminology. Depletion is sometimes referred to as groundwater
mining or groundwater overdraft (Korus and Burbach, 2009). Harou and Lund (2008) define
depletion as “overdraft” referring to “long-term groundwater extraction at unsustainable rates
manifested by steadily decreasing regional groundwater levels over a period long enough to
overlook seasonal and drought effects”. Konikow and Kendy (2005) refer to depletion to
describe groundwater overdraft that causes “persistent head declines in renewable aquifers” and
add that “groundwater depletion consists of a reduction of aquifer volume or a reduction in the
usable volume of fresh groundwater within an aquifer”. In this research groundwater depletion is
16defined as when the groundwater extraction is exceeding the groundwater recharge, and analysed
by calculating the volume being extracted divided by the volume being recharged.
Drought
Due to climate variability in the Cauca Valley droughts play an important role for the agricultural
sector. In general the farmers divide water from the rivers and streams but during dry seasons
the surface water is declined and to low so then have to switch to groundwater extraction. If a
drought occurs is heavily depending on the impact it has on the water users, the demand for
water in terms of quantity and quality and the availability at a particular location. This can be
different for every industry or individual and makes it hard to make one definition (IPCC, 2007).
Because of this difference, there are in general three different types of drought which can be
associated with changes in meteorological, soil, and hydrological conditions (Figure 5). The first
type of drought is a metrological drought, where the amount of precipitation falls below average
over a prolonged period of time. Second, we can define an agricultural drought when there is a
period below normal soil moisture that does not match the water requirements of a cultivated
crop. Finally, we talk about hydrological drought when the river stream flows, ground water
levels, lakes and reservoirs are below normal. In this research, the meteorological conditions are
taken as a starting point and used to analyse the impact on the hydrological conditions.
Figure 5. Dimensions of drought and its evolution over time (Wilhite, 2006; Werner, 2015)
17Adaptation
Adaptations are management responses to risks associated with climate variability and climate
change (Clifton et al. 2010). The IPCC 2007 defines adaptation as “Initiatives and measures to
reduce the vulnerability of natural and human systems against expected climate change effects.
This applies to policies and practices which can either reduce risks and / or realise opportunities
associated with climate change. Climate change is recognized by the government of Colombia as
a threat to social, economic and environmental development. To address these challenges, the
National Planning Department (DNP), together with the support of Ministry of Environment
and Sustainable Development (MED), the Institute of Hydrology and Environmental Studies
(IDEAM) and the National Unit for Disaster Risk Management (UNGRD) developed the
National Plan Adaptation to Climate Change (PNACCO). This is a conceptual framework that
gives guidelines for developing adaptation plans to reduce climate vulnerability. The framework
includes five principles how climate problems should be approached by the public and private
sector. These key principles are used in this thesis to develop climate adaptation measures which
could be applied in the Cauca Valley. In line with these principles, the Adaptation Support Tool
developed by the European Environmental Agency (EEA) is used to identify concrete
adaptation measures which are based on UKCIP, 2005; Adger et al. 2005; Prutsch et al. 2010;
Brown et al. 2011).
Principles National Plan Adaptation to Climate Change (PNACCO)
This list provides an overview of adaptation measures proposed by the Ministry of Environment
and Sustainable Development.
1. Implementation of adaptations measure which lead to measures that lead to restore
ecosystems to provide ecosystem services, implementation of hard and soft technologies
that reduce vulnerability for populations and infrastructure.
2. Combine adaptation with strengthen resilience since adaptation will not complete reduce
the risks for climate variability.
3. Regional land use planning must include sustainable adaptive development.
4. Generate information and knowledge to measure risk for decision making for planned
adaptation measures to reduce vulnerability and exposure.
5. Awareness raising about climate change in all public, private and population levels.
183. Methodology
This chapter provides an overview of the used methodologies in order to calculate the recharge
and to propose adaptation measures to mitigate the effects of climate change. The chapter
Concepts and Definitions gave a brief introduction of the used concepts to calculate recharge,
but more variables and formulas are involved. The total process is divided into three steps:
1. Data collection
- The collection of historical precipitation and temperature data to make an initial data set
of the Cauca Valley.
- Develop climate change and variability scenarios for different timescales in the future
using the initial data set.
2. Data processing
- To calculate groundwater recharge using four different software tools.
- Calculation and visualization of the recharge in graphs and spatial maps.
- Scenario development and computing.
3. Data analyses
- To formulate groundwater sustainability indicator to calculate the impact of the scenarios
on the state of the groundwater.
- To collect adaptation strategies that includes policies and technical measures that could
be implemented to contribute to the sustainability of the groundwater.
3.1 Data Collection and Data Sources
To calculate the recharge for the study area two variables were needed. The first step of the
research was to collect historical climate data of the variables:
- Daily precipitation values
- Daily temperature max, min and average values
The variables precipitation and temperature are essential because these are the main drivers for
infiltration and evapotranspiration. Within the ESCACES project there was already climate data
available to use but additional historical data was needed. The data was collected during a visit at
the head office of environmental authority Corporación Autónoma Regional del Valle del Cauca
(CVC) in Cali, Colombia. There is was possible to interact with workers and to use local
networks such as intranet databases to complete the data set. This lead to additional data sources
which are shown in Table 2. The visit in Cali made it possible to learn more about the study area
in the Cauca Valley and to familiarize with the context of the project and to get an impression of
the study area and culture of the region. These impressions were important for other parts of the
research to see which climate adaptation measures could be implemented into the region.
19Table 2
Overview of the different data sources
Dataset Source Description
Temperature ESCACES (project) Daily temperature values of weather
IDEAM (website) stations located in the Cauca Valley.
CVC (intranet database) Tmax, Tmin, Taverage between 1965-
WMO (website) 2013
Precipitation ESCACES (project) Daily precipitation values of weather
IDEAM (website) stations located in the Cauca Valley
CVC (intranet database) between 1965-2013
The precipitation data was collected from three different sources and combined into the “initial
precipitation dataset” (Table 3). This dataset has daily values in millimetres rainfall between 1
January 1965 and 31 December 2013. The starting date is 1965 and has 28 stations with
registrations increasing to 198 stations in 2013. The data set includes weather stations from the
whole Cauca Valley and study area, and is used during the data processing phase for computing
the Standardised Precipitation Index (SPI) and spatial interpolation between the weather stations.
Table 3
Data of the initial climate dataset
Precipitation Temperature
Time range 1965-2013 1973-2013
Interval Daily Daily
Number of stations 198 stations 40 stations
Unit mm °C
Format CSV, notepad notepad
For temperature data was available for the period 2000-2013 in the ESCACES project. Therefore
additional data was needed for extending the time series as far as possible back in history. As a
result, data was collected from two weather stations in the study area starting from 1973 and was
combined with the dataset of ESCACES. These two stations were selected because they had the
less missing values in comparison to other stations which had consecutive months or years of
missing data. The missing values for the two weather stations were corrected by applying a linear
interpolation when three or fewer days were missing between two dates by solving the formula:
20During the data process phase, the temperature was also used for a spatial interpolation of the
temperatures over the Cauca Valley. The availability of only two weather stations before the year
2000 is not ideal for this analysis since a higher number of weather stations would increase the
accuracy of the interpolated grid.
Because the climate data was collected from various sources it was needed to structure the data
to similar formats, such as file extensions, timestamps and geographical location. This resulted in
an initial dataset with all the collected precipitation and temperature values. The initial data set
was used as a starting point to develop climate scenarios and process the data through the
software tools.
3.2 Boundary Condition and Model Concept
The recharge is studied for the 47km2 study area (Figure 1) and the approximate 120 meter
subsurface layer underneath it (Unit A). It is assumed that the water flows vertically downwards
until it reaches the impermeable layer of Unit B. This means that no horizontal movement of
water of the subsurface layer is taken into account. To estimate the recharge, the study area is
divided into 250 meter vertical grids which is schematic represented in Figure 6. These columns
have an average depth of 120 meter and are varying depending on the upper head of Unit B.
Figure 6 Schematic representatiation of the study area. The study area is visualized in the two
green colors and include a subsurface layer of approximate 120 meter beneath the 47km2 surface.
The top boundary condition of the study area is the water flux that becomes available from
precipitation. As explained in the chapter Concepts and Definitions, precipitation entering the
system is divided by the Curve Number into runoff and infiltration. Since only vertical
movement is studied, runoff will not lead to infiltration into neighbouring cells. It is assumed
that runoff water is drained from the cell and is added to surface water. Infiltration that may
reach the groundwater flows downward through Unit A until it reaches the impermeable layer
Unit B.
Only water from precipitation is taken into account for the recharge calculation. Water that
infiltrates through rivers and streams is excluded from this research. The contribution from
21surface water is significant high, however, at date the model which calculates this volume is still
in development within the ESACES project and not calibrated yet.
The choice for studying infiltration only for Unit A is by making the assumption that water
cannot infiltrate through Unit B to replenish the confined aquifer of Unit C. However, as shown
in Figure 7 Unit A and C seems to be connected at the alluvial fans close to the mountain slopes.
Besides, the choice for studying Unit A is because the majority of the extraction wells are drilled
in Unit A which has the biggest impact on the groundwater table.
Figure 7 These figures show a 3D model and cross section of the study area. Unit B is clearly
visible as forming a boundary between Unit A and C. However, Unit B is very thin closer to the
mountain ranges where runoff from the mountains is able to replenish Unit C.
Note; 250meter grid cells are not visible in these figures.
Source: Author, images are captured using iMOD
22Recharge is spatial and temporal estimated for every grid cell in the study area. To do this, the
initial climate data set is processed in four steps using different software programs. This process
is done for all the climate scenarios and demand accuracy because of the time consuming length
of this process. The general steps of this process are presented in the flowchart of Figure 8. To
generate the final results the software tools had to be used in the presented chronological order.
The used software tools are:
1. Standardized Precipitation Index Program (SPI)
Used to standardize precipitation data to identify droughts and is used for scenario
building.
2. Delft-FEWS
A climate forecasting GUI initially developed for operational water management and
hydrological forecasting. In this research it is used for spatial interpolation of the
precipitation and temperature data and the preparation of input data for the Recharge
script.
3. Recharge Script
This is a Python based script developed in the ESCACES project. This script uses the
interpolated temperature and precipitation maps created in Delft-FEWS, together with
PCRaster maps containing characteristics of the study area, such as land use, root depth,
to calculate recharge per grid cell. It generates output files which can be read and
analysed in iMOD.
4. iMOD,
An on MODFLOW based hydrogeological software program which can be used for
computing water balances and visualize groundwater levels to analyse recharge rates of
the different climate scenarios.
23Figure 8 This workflow shows the order of taken steps to calculate recharge.
3.3 Used Research Tools for Data Analyses
3.3.1 Standardized Precipitation Index
The purpose of using the SPI is to identify a dry year in the collected climate data and to use this
year to develop a climate variability scenario. There are a wide range of methodologies available
to identify droughts but the choice for using the SPI is based on its simplicity and data
availability. In contrast to other drought indexes such as the Palmer Drought Severity Index and
Crop Moisture Index, the SPI only needs precipitation as an input parameter with a minimum of
30 and preferable 60 year or more of historical precipitation data (Edwards and McKee, 1997).
The Standardized Precipitation Index (SPI) makes it possible to compare rainfall periods by
standardizing the monthly totals of precipitation. The monthly totals are converted from
absolute values into indexes ranging from -0.0 to +0.0. The index transforms the precipitation
off different periods into a normal distribution with a mean of zero and a standard deviation of
one. The SPI gives the amount of standard deviation of the mean. 95 % of the standard
24deviations are between SPI -2 and SPI +2 and approximate 64% between SPI -1 and SPI +2.
When the precipitation values are indexed then this makes it easier to compare rainfall between
different periods and different stations. Positive values indicate greater than the mean and
represent wet periods where negative values indicate less than the mean and represent drought
(Table 4). According to McKee and others (1993), a drought event occurs at any time the SPI is
continuously negative and reaches intensity of -1.0 or less and the dry event ends when the SPI
becomes positive.
Table 4
Weather conditions per SPI value
SPI Values Category
≥ +2.00 Extremely Wet
+1.50 to +1.99 Very Wet
+1.00 to +1.49 Moderately Wet
-0.99 to +0.99 Normal
-1.00 to -1.49 Moderately Dry
-1.50 to -1.99 Severely Dry
≤ -2.00 Extremely Dry
Source: McKee et al. (1993)
3.3.2 Delft-FEWS
Delft-FEWS is a software infrastructure initially developed for operational water management
and hydrological forecasting. Delft-FEWS provides an open shell system for managing the
operational management process (Werner et al. 2013). Delft-FEWS can be deployed as the
stand-alone environment, as a fully automated client-server application, or as a web service
component within another forecasting system. It incorporates a set of data handling utilities to
transform data with disparate spatial and temporal scales. In this study, it is used as a stand-alone
environment and is not connected to an external real-time database. This stand-alone version
was built in the ESCACES project to import and process climate data. This process includes
workflows which are five steps in order to process the climate data and make it ready for the
following software tool the Recharge Script (Appendix
Appendix 1). The purpose of using Delft-FEWS is to import the climate data to create
precipitation and evaporation 250-meter grid files which are used as an input for the Recharge
script. For the ESCACES project workflows are developed to interpolate the data. The general
steps are following:
1. The climate data is imported into Delft-FEWS from a CSV, Notepad of Excel file
containing precipitation and temperature values. These values have a weather station
code to assign the climate data to the corresponding weather station, and a timestamp
25with the yyyy-MM-dd hh:mm:ss format. To avoid errors during the import of the data, it
is important to configure the system settings of the OS to this time format.
2. While the data is importing, Delft-FEWS runs a check in the background to identify
outliers. Delft-FEWS compares the imported data against maximum and minimum set
temperature and precipitation values for the region. If data exceeds this limit then a
warning message is shown in the log GUI. The user can then decide to take action or
ignore the message and continue with the next step.
3. When the data is imported the next workflow can be manually started which pre-process
the data. During this step the daily data is aggraded in monthly values and added and
saved in the Delft-FEWS database. From this database the further calculations are
conducted.
4. Once the data is stored in the database the nest workflows can be ran. Because of high
memory usage it is recommended to run the interpolation step by step over time periods
of maximum 5 years, depending on the processor. As an example for this research, the
initial climate data set of the years 2000-2013 is divided into 4 interpolation runs to
complete starting from 2000-01-01 07:00 until 2003-12-31 07:00 (Appendix 2).
5. The first interpolation workflow is to process the precipitation data. This workflow
makes monthly averages of the stations and interpolates these values using the closest
distance interpolation method to get best linear unbiased prediction. Then for every
station the difference between the monthly average and daily value is calculated. These
differences are interpolated by inverse distance method. Then the result is added or
subtracted to the monthly average to get the final result. Appendix 3 shows a daily step
of the time serie visualized in a map. The GUI looks similar for the workflows
temperature and recharge.
6. The next workflow uses the temperature max, min and average data to interpolate
evaporation. To do this first the temperature is interpolated by using the inverse distance
method, taking the elevation into account by applying the lapse factor. The lapse factor is
a factor which increases or reduces the temperature by 0.6 degrees Celsius for every 100
meter difference in elevation. Since the weather stations are located by coordinate system
Delft-FEWS applies the factors between the stations.
7. Now both evaporation as precipitation values are stored in the Delft-FEWS database.
8. By running the final workflow “Recarga”, Delft-FEWS creates the input for the recharge
script. It converts the stored data of the database into daily binary files. For every day
one precipitation and one evaporation file is created.
9. These files are input files for the Recharge Script and contain for every cell of the
250meter grid in the study area a value which of either temperature, or evaporation.
These binary files are the final output of Delft-FEWS and are named for precipitation
26pptn0000.000 and evap0000.000 for evaporation. The name of the file changes for every
day step e.g. evap0000.999 to evap0001.000, and so on.
Figure 9 This flowchart shows the data processing in Delft-FEWS.
3.3.3 Recharge Script
The recharge script calculates the recharge for every grid cell in the Cauca Valley. The script first
calculates the volume of water that infiltrates into the soil by using the Curve Number method.
Then it calculates how much of the infiltrated water will recharge. As explained in the
27Concepts and Definitions the infiltration is depending on the soil characteristics, land use and
water fluxes. All the information of the characteristics is stored in PC Raster files and presented
in Table 5. These characteristics are defined within the ESCACES project in collaboration with
Cenicaña (Center for Research of Sugar Cane). This is a scientific based research institution in
the field of sugar cane. Cenicaña is conducting research in the Cauca Valley since 1930 and has
therefore a long record of reliable information.
The process starts with preparing a run file (Appendix 4) which tells the script where to read the
input files and the destination folders to write the output files. The input files are stored in two
folders, a “static folder” and “variable folder”. Where the static folder contains the PC Raster
files and the variable folder contains the in Delft-FEWS generated precipitation and evaporation
files. For example, since the climate change scenario is computed over the period 2000-2013, the
variable folder contains 5113 days * 2 (precipitation, and evaporation) = 10.226 files, plus two
“map stack files” which tells the script which day stamp to assign. The script uses the map stack
files to combine for every day step the precipitation, evaporation and PCRaster files to compute
the recharge with the formulas in Table 6. Then at the end of a month the script generates an
RCH.idf (recharge.idf) file. This file contains an accumulation of all the daily recharge values and
is created at the end of every month. The RCH.idf files can be read in the next software tool
iMOD. The runtime of the script over the period 2000-2013 takes between one and a half and
two hours.
28You can also read