Economic Assessment of Alternatives for Auckland Cruise Terminal - Costs and Benefits - Prepared for: Panuku Development Auckland - Auckland Council
←
→
Page content transcription
If your browser does not render page correctly, please read the page content below
Economic Assessment of
Alternatives for Auckland Cruise
Terminal – Costs and Benefits

Prepared for: Panuku Development Auckland

Date: August 2018
Status: Final
Economic Assessment of Alternatives
   for Auckland Cruise Terminal – Costs
   and Benefits

  Panuku Development Auckland

  Document reference: PAN 005.18 Mooring CBA
  Date of this version: August 2018
  Report author(s): Rodney Yeoman & Greg Akehurst

  Disclaimer
  Although every effort has been made to ensure accuracy and reliability of the information contained in this report,
  neither Market Economics Limited nor any of its employees shall be held liable for the information, opinions and
  forecasts expressed in this report.

                                                                                              Market Economics Limited
                                                                                                 Level 5, 507 Lake Road
www.me.co.nz                                                                                  PO Box 331 297, Takapuna
                                                                                                     Auckland 0740, NZ
                                                                                                          P 09 915 5510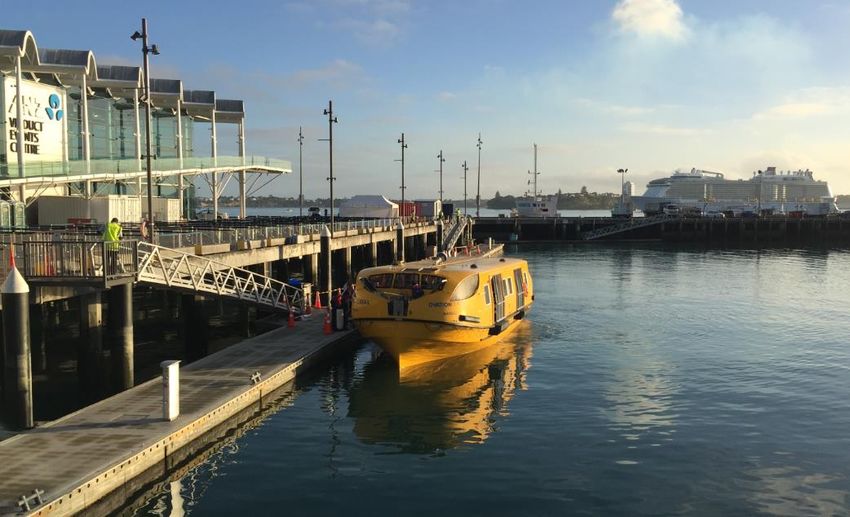
Contents
ABBREVIATIONS................................................................................................. 5

EXECUTIVE SUMMARY ....................................................................................... 6

1         INTRODUCTION ..................................................................................... 9

1.1       OBJECTIVES AND SCOPE.................................................................................. 11

1.2       INFORMATION SOURCES ................................................................................. 11

1.3       CAVEATS..................................................................................................... 13

1.4       STUDY STRUCTURE ........................................................................................ 13

2         APPROACH .......................................................................................... 15

3         CRUISE TERMINAL SOLUTIONS ............................................................. 17

3.1       DO NOTHING............................................................................................... 18

3.2       MOORING DOLPHINS – WITH GANGWAY ............................................................ 22

4         STAKEHOLDER GROUPS ....................................................................... 25

4.1       AUCKLAND COUNCIL AND CCO ........................................................................ 25

4.2       PORTS OF AUCKLAND LTD ............................................................................... 26

4.3       IWI AND HAPŪ ............................................................................................. 26

4.4       CUSTOMS AND BIOSECURITY............................................................................ 26

4.5       CRUISE OPERATORS....................................................................................... 27

4.6       CRUISE PASSENGERS AND CREW ....................................................................... 28

4.7       COMMERCIAL HARBOUR OPERATORS ................................................................ 28

4.8       AUCKLAND BUSINESSES .................................................................................. 28

4.9       AUCKLAND COMMUNITY ................................................................................ 30

4.10      NON-AUCKLAND REGION STAKEHOLDERS ........................................................... 30

5          COSTS AND BENEFITS OF SOLUTIONS................................................... 32

5.1       CONSTRUCTION COSTS AND BENEFITS................................................................ 33

5.2       OPERATIONAL COSTS ..................................................................................... 33

5.3       OPPORTUNITY COSTS..................................................................................... 33

5.4       CRUISE SPEND (PASSENGER, CREW AND VESSEL) ................................................... 34

5.5       RECREATIONAL VALUES .................................................................................. 34

5.6       CULTURAL VALUES ........................................................................................ 35

5.7       WIDER ECONOMIC EFFECTS ............................................................................ 36

5.8       ECOLOGICAL VALUES ...................................................................................... 37

5.9       TRANSPORT NETWORK ................................................................................... 37

5.10      AMENITY VALUES ......................................................................................... 38

5.11      COSTS AND BENEFITS - FINDINGS ...................................................................... 39

6          ECONOMIC VALUATION ....................................................................... 40

6.1       TEMPORAL AND SPATIAL ASSUMPTIONS ............................................................. 41

6.2       CONSERVATIVE FUTURE.................................................................................. 43

6.3       LIKELY FUTURE ............................................................................................. 58

6.4       HIGH FUTURE .............................................................................................. 62

7          CONCLUSIONS ..................................................................................... 67

REFERENCES..................................................................................................... 69

APPENDIX A – SENSITIVITY ANALYSIS............................................................... 72

APPENDIX B – NO GROWTH TEST ..................................................................... 75

APPENDIX C – PASSENGER SURVEY .................................................................. 78
Figures
FIGURE 1.1: OVATION OF THE SEAS VISITING AUCKLAND ........................................................................... 10

FIGURE 3.1: OVATION OF THE SEAS TENDERING PASSENGERS TO SHORE IN AUCKLAND .................................... 18

FIGURE 3.2: OVATION OF THE SEAS TENDER AT BERTH IN VIADUCT HARBOUR ............................................... 19

FIGURE 3.3: QUEENS WHARF EAST BASIN FOR FUTURE HANDLING OF TENDERING ......................................... 19

FIGURE 3.4: VIADUCT HARBOUR TENDER BERTHS AND PASSENGER FLOWS DIAGRAM ..................................... 21

FIGURE 3.5: PROPOSED MOORING DOLPHINS WITH GANGWAY AND EXTRA-LARGE VESSEL .............................. 22

FIGURE 3.6: PANORAMA OF PROPOSED MOORING DOLPHINS AND GANGWAY............................................... 23

FIGURE 5.1: AUCKLAND HARBOUR RESTRICTED AREAS – AUCKLAND COUNCIL............................................... 35

FIGURE 6.1: NEW ZEALAND CRUISE PASSENGERS BY ORIGIN MARKETS – 1999 TO 2015 ............................... 45

FIGURE 6.2: CONSERVATIVE FUTURE: FORECASTS OF EXTRA-LARGE VISITS, PASSENGERS AND CREW .................. 48

FIGURE 6.3: CONSERVATIVE FUTURE: DO NOTHING, DIRECT COSTS AND BENEFITS 2019-20 TO 2028-29 ($
MILLION) .......................................................................................................................................... 50

FIGURE 6.4: CONSERVATIVE FUTURE: MOORING DOLPHINS - WITH GANGWAY, DIRECT COSTS AND BENEFITS 2019-
20 TO 2028-29 ($ MILLION) ............................................................................................................... 55

FIGURE 6.5: CONSERVATIVE FUTURE: POLICY OPTION VS DO NOTHING, 2019-20 TO 2028-29 ($ MILLION) ..... 56

FIGURE 6.6: CONSERVATIVE FUTURE: POLICY OPTION VS DO NOTHING, NET PRESENT VALUE ($ MILLION) ......... 56

FIGURE 6.7: CONSERVATIVE FUTURE: DISTRIBUTIONAL IMPACTS OF POLICY OPTION, NET PRESENT VALUE ($
MILLION) .......................................................................................................................................... 57

FIGURE 6.8: LIKELY FUTURE: FORECASTS OF EXTRA-LARGE VISITS, PASSENGERS AND CREW ............................. 59

FIGURE 6.9: LIKELY FUTURE: DO NOTHING, DIRECT COSTS AND BENEFITS 2019-20 TO 2028-29 ($ MILLION) ... 60

FIGURE 6.10: LIKELY FUTURE: MOORING DOLPHINS - WITH GANGWAY, DIRECT COSTS AND BENEFITS 2019-20 TO
2028-29 ($ MILLION) ........................................................................................................................ 61

FIGURE 6.11: LIKELY FUTURE: POLICY OPTION VS DO NOTHING, 2019-20 TO 2028-29 ($ MILLION) ............... 62

FIGURE 6.12: LIKELY FUTURE: POLICY OPTION VS DO NOTHING, NET PRESENT VALUE ($ MILLION) .................. 62

FIGURE 6.13: HIGH FUTURE: FORECASTS OF EXTRA-LARGE VISITS, PASSENGERS AND CREW ............................. 63

FIGURE 6.14: HIGH FUTURE: DO NOTHING, DIRECT COSTS AND BENEFITS 2019-20 TO 2028-29 ($ MILLION) .. 64
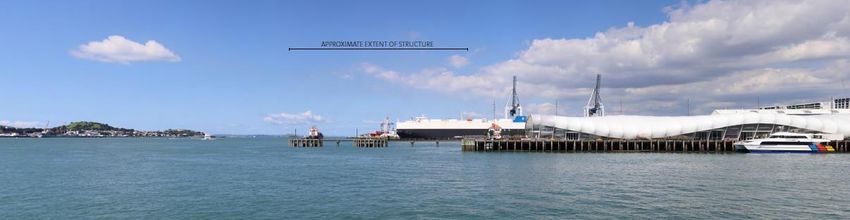
FIGURE 6.15: HIGH FUTURE: MOORING DOLPHINS - WITH GANGWAY, DIRECT COSTS AND BENEFITS 2019-20 TO
2028-29 ($ MILLION) ........................................................................................................................ 65

FIGURE 6.16: HIGH FUTURE: POLICY OPTION VS DO NOTHING, 2019-20 TO 2028-29 ($ MILLION) ................ 65

FIGURE 6.17: HIGH FUTURE: POLICY OPTION VS DO NOTHING, NET PRESENT VALUE ($ MILLION) .................... 66

FIGURE B.1: NO GROWTH: POLICY OPTIONS VS DO NOTHING, 2019-20 TO 2028-29 ($ MILLION) ................. 76

FIGURE B.2: NO GROWTH: POLICY OPTION VS DO NOTHING, NET PRESENT VALUE ($ MILLION) ...................... 76

FIGURE B.3: NO GROWTH: DISTRIBUTIONAL IMPACTS OF POLICY OPTION, NET PRESENT VALUE ($ MILLION)...... 76

Abbreviations

AC       Auckland Council

ATEED    Auckland Tourism, Events and Economic Development

CBA      Cost Benefit Analysis

CCO      Council Controlled Organisation

CMA      Coastal Marine Area

LSF      Living Standard Framework

NZCA     New Zealand Cruise Association

HSWA     Health and Safety at Work Act 2015

NPV      Net Present Value

M.E      Market Economics Limited

MSL      McKay Shipping Limited

OotS     Ovation of the Seas

Panuku   Panuku Development Auckland

PAX      Passengers

POAL     Ports of Auckland Limited

RCI      Royal Caribbean International

RFA      Regional Facilities Auckland

RMA      Resource Management Act 1991

RT       Renaissance Tours

SSOH     Stop Stealing Our Harbour

                                                             5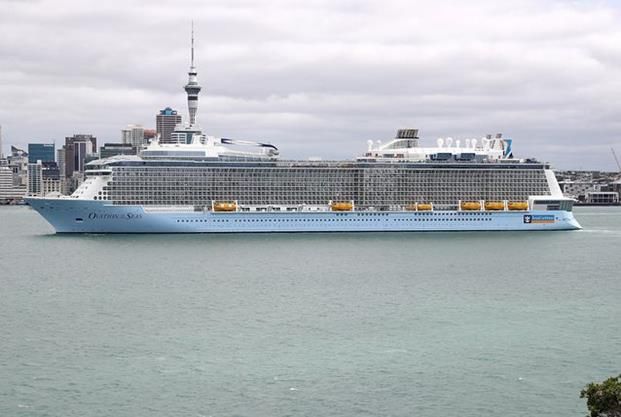
Executive Summary
Cruise tourism is a rapidly growing component of the tourism sector in Auckland and New
Zealand. Over the last decade and a half, the numbers of tourists undertaking a cruise in New
Zealand has grown by 13% per annum.1 In the last two season, economic activity generated
in Auckland Region by international cruise visitors has grown by 38%. Over this period the
growth in cruise tourism spend in Auckland Region was twice as fast as the total international
tourism sector in New Zealand (at 19%).2

Auckland is New Zealand’s cruise hub, being the main port capable of hosting exchange visits,
where cruises start and finish. Cruise vessel visits to Auckland continue to increase in number,
alongside increases in vessel size. These increases are spurred both by regional demand in
Australia and New Zealand, and by the rapid growth of cruise tourism in Asia.

Broadly, the ability or not of Auckland to host the number and increased size of vessels is likely
to have implications both regionally and nationally. Potential constraints on Auckland’s ability
to host cruise vessels will affect port calls across the rest of New Zealand and the tourism
sector overall. Auckland’s current cruise terminal facilities are unable to safely handle the
newer extra-large vessels (Quantum or Oasis class). Recent visits to Auckland by an extra-
large vessel (quantum-class Ovation of the Seas) with plans for future expansion in the number
of visits it makes, resulted in the need for an immediate solution to accommodate these
vessels.

Panuku has completed research and discussions with key stakeholders on the potential
immediate solutions for accommodating extra-large vessels. There are two options that have
been identified, Do Nothing (status quo tendering) and development of Mooring Dolphins
with a gangway at the end of Queens Wharf.

Panuku, other Council Controlled Organisations and Ports of Auckland have commissioned a
range of research to evaluate these potential solutions, including studies on engineering,
safety, heritage, planning, environmental, visual amenity, traffic and cultural engagement.

The objective of this study is to present an economic evaluation of the potential options for
handling extra-large vessels in Auckland. The economic evaluation applies standard methods,
commonly referred to as Cost Benefit Analysis and Economic Impact Assessment.

In summary, the results of the Cost Benefit Analysis and Economic Impact Assessment show
that the option of Mooring Dolphins with a gangway at the end of Queens Wharf produces a
net positive outcome for the Auckland community when compared with the Do Nothing
option. Notwithstanding the net positive position of the community, it is important to note
that the costs and benefits associated with most policy is likely to be unevenly distributed

1   New Zealand Cruise Association (2017) Passenger Manifest data 2002-03 to 2016-17.
2   Infometrics (2017) Auckland Economic Profile.

                                                                                              6
across different groups within the community. The distributional issues associated with this
policy option show that some stakeholder groups are likely to be in a net negative position.

The following key findings are important,

    •    The CBA and EIA reveals that the Mooring Dolphins with a gangway at the end of
         Queens Wharf will result in a net positive position relative to the current method of
         handling extra-large vessels (i.e. tendering).

    •    Based on the ‘Conservative Future’3, the CBA suggests that the community would be
         expected to be in a net positive position of at least +$30.4 million over the period to
         2028-29 (Net Present Value terms). Similarly, the results from the EIA shows that the
         Mooring Dolphins at the end of Queens Wharf would generate on average an
         additional direct contribution to GDP of $6.8 million per annum and 122 job
         equivalents in the Auckland Region.

    •    Under the ‘Likely Future’ scenario4, the CBA suggests that the community would be
         expected to be in a net positive position of at least +$107m in NPV terms, compared
         with the Do Nothing option. Again, the Mooring Dolphins option is preferred over
         the Do Nothing, i.e. it results in a positive position with a Benefit Cost Ratio (BCR) of
         8.3. Similarly, the results from the EIA shows that the Mooring Dolphins at the end of
         Queens Wharf would generate, on average an additional direct GDP of $26.5 million
         per annum and 669 job equivalents in the Auckland Region.

    •    Finally, under the ‘High Future’ scenario5, the Mooring Dolphins with a gangway
         option is still preferred over the Do Nothing, i.e. it results in a positive position with
         NPV of +$163 million or a Benefit Cost Ratio (BCR) of 12.0. Again, the best policy
         option is to construct the Mooring Dolphins with a gangway to meet the future needs
         of extra-large cruise vessels when they visit Auckland. The results from the EIA show
         that the net effect of building the mooring Dolphin option is positive, generating and
         estimated $39.5m in direct contribution to GDP and sustaining employment
         equivalent to 779 full time jobs.

    •    In terms of distributional effects, stakeholder groups that directly use the cruise
         terminal will have a net positive position (Ports of Auckland, Customs and Biosecurity,
         Cruise Operators, Cruise Passengers and Crew). More widely, Auckland Businesses
         and the Auckland Community both receive considerable net positive benefits if the
         Mooring Dolphins with a gangway is constructed.

3 The Conservative Future allows for low growth in the number of extra-large vessels that visit and the associated
cruise industry spend. However, the externalities associated with the Mooring Dolphins with a gangway are
maintained at the high estimate.
4 The Likely Future allows for likely growth in the number of extra-large vessels visits and the associated cruise

industry spend. This scenario also allows for some voyages to undertake an exchange.
5 The High Future allows for higher growth in the number of extra-large vessels visits and the associated cruise

industry spend. This scenario also allows for a greater number of voyages to undertake an exchange.

                                                                                                             7
•   Conversely, some stakeholder groups will be in a net negative position. Iwi/hapū,
        other commercial harbour operators and recreational users are expected to have a
        small net negative position.

In short, the economic evaluation favours the Mooring Dolphins with a gangway at the end of
Queens Wharf. The sensitivity analysis does not alter this position – while the amounts alter,
all scenarios remain net positive under all variations of assumptions. The CBA and EIA suggest
a net positive position for Auckland Community. As with most policy, there are some groups
that would be in a net negative position if the Mooring Dolphins with a gangway is selected.
Even in the unlikely event that there is “no growth” in the numbers of extra-large vessels
visiting Auckland the CBA results suggest that the Mooring Dolphins with a gangway at the
end of Queens Wharf would generate a net positive position.

Finally, we note that comparison of the distributional issues is beyond the scope of an
economic evaluation. In the assessment of the resource consent application for the Mooring
Dolphins with a gangway, the adverse and positive effects (or costs and benefits) of the activity
in different groups within the community will need to be considered.

                                                                                             8
1 Introduction
Cruise tourism is a rapidly growing component of the tourism sector in Auckland and New
Zealand. Over the last decade and a half, the numbers of tourists undertaking a cruise in New
Zealand has grown by 13% per annum.6 Over the last two seasons the growth in cruise tourism
spend in Auckland Region was twice as fast as the total international tourism sector in New
Zealand (38% compared to 19%).7
Auckland is New Zealand’s cruise hub, being the main port capable of hosting exchange visits,
where cruises start and finish. Cruise vessels visits to Auckland continue to increase in number
and the size of vessels is growing, spurred both by regional demand in Australia and New
Zealand and by the rapid growth of cruise tourism in Asia.
Broadly, the ability or not of Auckland to host the number and increased size of vessels is likely
to have implications both regionally and nationally. As such, potential constraints on
Auckland’s ability to host cruise vessels may affect port calls across the rest of New Zealand.
Auckland’s current cruise terminal facilities are unable to safely handle an increase in the
number of newer extra-large vessels (Quantum or Oasis class), which are over 320 metres long
and hold up to 6,000 passengers. In addition, the exchange activity of larger vessels (Voyager
class) is constrained by the existing facilities at the Princes Wharf cruise terminal. There are
long held concerns across the cruise industry that existing facilities in Auckland do not
adequately meet the needs of this high growth sector, and that these constraints are limiting
growth.8
Longer term solutions for cruise infrastructure have been examined through the Central
Wharves Strategy,9 but implementation of the preferred option is constrained by decisions
around the future of Port of Auckland, which is examined in the Port Future Study.10 The ‘Port
Future Study Recommendations Report’ of the Consensus Working Group, released in July
2016, stated that “cruise industry facilities should be retained and improved in Auckland’s city
centre”.11
More recently the proposed location of the Americas Cup base for 2021 has removed Wynyard
Wharf as a potential solution for the medium term.12 In order to provide safe and efficient
berthing for the extra-large vessels visiting Auckland in the near term, an immediate solution
is required to accommodate these vessels.
The recent visits to Auckland by a quantum-class vessel and the expected growth in visits by
this class of vessel in the short-term are driving the need for a solution in the near future.
6 New Zealand Cruise Association (2017) Passenger Manifest data 2002-03 to 2016-17.
7 Infometrics (2017) Auckland Economic Profile.
8 Cruise New Zealand (2010) Every Reason to party with Top Cruise Terminal.
9 Auckland Council (2017) Central Wharves Strategy.
10 Ernst & Young (2016) Consultant’s report to the Port Future Study.
11 Port Future Study (2016) Recommendations report of the Consensus Working Group.
12 Auckland Council (2018) Our Auckland 26 March 2018 - Auckland confirmed as America’s Cup host.
9Ovation of the Seas (‘OotS’) was the first quantum-class vessel to visit Auckland (See Figure
1.1). This 348 metre long vessel was not able to berth at the existing cruise terminal and was
required to ‘keep on station’ using Dynamic Positioning13 in the harbour, with passengers
being transferred ashore via the ships tenders (small boats). OotS visited Auckland in three
times in 2016/17 season (December 2016, January 2017, February 2017) and 2017/18 season
(December 2016, January 2017, February 2017). The vessel is booked to visit 7 times again in
2018/19 season and the brand new Majestic Princess (330m) is booked to visit 11 times.
Currently, the forward bookings for 2019/20 season suggest there is likely to be at least 14
visits to Auckland by extra-large vessels.14
Figure 1.1: Ovation of the Seas Visiting Auckland
Key stakeholders have been working together to develop potential near future solutions for
accommodating extra-large vessels.15 As a result of research and discussions with key
stakeholders, the preferred option for accommodating extra-large vessels is to extend the
berthage capacity of Queens Wharf through the addition of ‘mooring dolphins’. It is
anticipated that the mooring dolphins will provide capacity to enable the continued growth of
the cruise industry in Auckland. In September 2016, Panuku Development Auckland
(‘Panuku’) began the application process for resource consent to enable construction of the
mooring dolphins.
In October 2016, Panuku placed the resource consent process on hold whilst they provided
the newly elected Mayor and Council members additional information about the mooring
dolphin and alternative options.16 Market Economics (‘M.E’) was commissioned to carry out
an economic assessment of the costs and benefits associated with the alternatives for
handling extra-large vessels. This report is an update to that study to include the research
undertaken in 2018 to incorporate the latest cruise vessel bookings data,17 construction
13 Safety regulations prohibits extra-large vessels from anchoring in the harbour. This means OotS was required to
undertake station-keeping manoeuvres, which requires constant activity of the ships thrusters to remain in a fixed
location.
14 Ports of Auckland (2018) Cruise Vessel Bookings.
15 Panuku Development Auckland, Auckland Tourism, Events and Economic Development, Cruise New Zealand and
Ports of Auckland.
16 Radio NZ (17th October 2016) Waitematā Harbour Walkway consent put on hold.
17 NZCA data from 2017/18 season and POAL forward bookings for 2018/19 – 2019/20.
10information on the mooring dolphins18 and recent proposals for the base for the America’s
Cup defence in 202119.
1.1 Objectives and Scope
The objective of this study is to present an economic evaluation of the proposed near future
solution for handling extra-large vessels in Auckland. The economic evaluation in this study
applies standard methods that are commonly referred to as Cost Benefit Analysis (‘CBA’) and
Economic Impact Assessment (‘EIA’). In summary we have undertaken a CBA that will follow
the framework set out in Auckland Council and Treasury Primers.20
The scope of this study is to establish costs and benefits associated with different near future
solutions for handling extra-large vessels. In this study we use the term ‘extra-large’ to define
all cruise vessels over 320 metres.
This study focuses alternative visitation scenarios, which have been defined based on
discussions with the key stakeholders. The alternatives centre on the most likely outcomes
following the development of the mooring system to handle extra-large vessels. We note
that there may be other options which could be employed in the longer term following the
adoption or otherwise of the Port Strategy. Note also that there were other short-term
solutions investigated in earlier versions of this report. Subsequent research and events have
meant that these alternatives are no longer being considered.
The other objective of this study is to ensure that results from the research can be utilised for
the consent application process (as defined in the Resource Management Act). Recently,
Treasury adopted a Living Standards Framework (‘LSF’) which is intended to improve economic
policy advice.21 The LSF aligns closely to the purpose of Resource Management Act (‘RMA’) –
which is also concerned with well-beings, social, economic and cultural.22 Given the recent
release of the framework it has not been applied in this research. However, the principles of
adopting a more holistic approach to assessing the economic costs and benefits has been
adopted with the inclusion of tentative estimates of Recreational values as part of the
economic assessment.
1.2 Information Sources
As a key part of this study, M.E has met with industry representatives to collect information
about the alternative short-term solutions for Auckland’s cruise terminal. We note that during
the research phase of this project, there was significant uncertainty about the logistics of
18 Beca (2018) Preliminary costs for Mooring Dolphins with gangway – draft.
19 Auckland Council (2018) Our Auckland 26 March 2018 - Auckland confirmed as America’s Cup host.
20 Refer to The Treasury (2015) Guide to Social Cost Benefit Analysis and Auckland Council (2013). Auckland Council
Cost Benefit Analysis Primer. Internal publication.
21 The Treasury (2018) Intergenerational Wellbeing: Weaving the Living Standards Framework into public policy.
22 Resource Management Act, s5(2)
11handling extra-large vessels. In some instances, this logistical uncertainty has meant that we
collected data and information after the first visit of OotS (27th December 2016).
Notwithstanding the relative uniqueness of extra-large vessels and the logistical difficulties in
handling them, we have collected information from the following groups and used it to
provide estimates of the costs and benefits generated for the potential solutions for the
Auckland cruise terminal.
1. Panuku: provided the majority of financial information covering the construction of
the proposed mooring dolphin. Panuku has provided detailed information on
potential construction costs and engineering plans for the mooring dolphin options.
Panuku has also provided background research on coastal, environmental, and
cultural impacts, as well as heritage and visual issues associated with the proposed
options. Panuku is joint owner of Queens Wharf.
2. Ports of Auckland Limited (POAL): currently controls the day-to-day operation of
the Princes Wharf and Queens Wharf cruise terminals when a cruise vessel is in port.
We have collected operational and logistical information from POAL, which includes
estimates of costs associated with each of the potential future alternative cruise
terminal options.
3. New Zealand Cruise Association (NZCA): is the industry body that represents cruise
industry interests in New Zealand. NZCA has provided M.E with passenger and crew
data, along with schedules for future seasons (17/18 and 18/19) and expectations
for the medium term.
4. McKay Shipping Limited (MSL): is the shipping agent for most cruise vessels that
visit New Zealand. They play an important role as they provide a comprehensive
service that covers the bulk of purchases by cruise vessels whilst in New Zealand.
MSL has provided M.E with actual expenditure and the associated logistics of serving
quantum-class vessels under each of the potential short-term solutions.
5. Auckland Tourism, Events and Economic Development (ATEED): has a role in
promoting tourism and economic activity in Auckland, which includes developing
and enhancing the visitor experience and cruise tourism. ATEED has supported the
assessment of future cruise terminal options. A key input to this research is the
survey of passengers on the Ovation of the Seas, which was commissioned by ATEED
and conducted by Gravitas Research and Strategy.23 The survey covered 997
passengers from OotS and was conducted on the 14th January 2017 and 6th of
February 2017.24
6. Royal Caribbean International (RCI) and Renaissance Tours (RT): Royal Caribbean
own the first quantum-class vessel to visit Auckland (OotS) and Renaissance Tours is
RCI’s ground handler. RCI and RT have provided M.E with electronic boarding card
23 Gravitas Research and Strategy (2017) Survey of Activity and Spend of Ovation of the Seas Passengers.
24 The survey had 376 respondents that represented parties with a total of 997 passengers.
12data, which every passenger touches on and off if they exit the vessel while in port.
They have also supplied some qualitative data from the customer feedback forms
collected from OotS.
1.3 Caveats
The following caveats apply to the results of this study:
• Viability of Alternatives: M.E has not attempted to assess the viability of the near
future solution proposed to handle extra-large vessels in Auckland.
• Alternatives: during the initial stages of this process Panuku assessed a range of
alternatives to accommodate larger vessels. These have been discarded due to a
range of reasons (structural, political and operationally) that meant they were not
viable options. The assessment process has led to the currently proposed solution
tested in cost benefit terms in this report. M.E has not undertaken to establish
whether there are any other alternatives other than the very long term solutions
suggested in the past.25
• Construction work area: The Assessment of Environmental Effects report prepared
by Beca Ltd indicates that an appropriate construction work area is required from
which to conduct construction. Cost estimates have not been supplied for this and as
such, M.E has not included these in the CBA undertaken.26
1.4 Study Structure
This study is structured into the following chapters:
• Chapter Two describes the economic approach employed to undertake the evaluation
of the proposed near future solution for handling extra-large vessels in Auckland.
• Chapter Three provides a detailed description of the proposed option assessed in this
study.
• Chapter Four identifies the stakeholder groups that are likely to be affected as a result
of the proposed solution being implemented.
• Chapter Five conceptualises the range of costs and benefits expected to result from
the proposal being implemented. It also outlines how costs and benefits accrue to
each key stakeholder group.
• Chapter Six quantifies, where possible, the value of costs and benefits identified using
CBA method and how they accrue to each stakeholder group. The focus is on the
Auckland region, as most of the funding is likely to be drawn from Auckland and the
25 See Auckland Council (2014) Downtown Framework.
26 Beca (2018) Preliminary costs for Mooring Dolphins with gangway – draft.
13resource consent process will require detail at a regional level. This section also
outlines the economic impacts (EIA) associated with the proposed solution.
• Chapter Seven provides some concluding remarks about the likely economic
implications of the proposed solution for handling extra-large vessels in Auckland.
• Appendix A presents results from sensitivity analysis, which tests the robustness of
findings from the CBA to variation in key assumptions.
• Appendix B presents results from No Growth, which tests the whether the short-term
solution is the best under if we freeze activity at today’s condition.
• Appendix C provides survey script and summary statistics for OotS passengers.
142 Approach
In brief, this study developed a CBA which is consistent with the framework set out in Auckland
Council and Treasury CBA Primers.27 We have also ensured that results from this study match
the requirements of the RMA and can be used to support the assessment of effects for the
resource consent application for the Mooring Dolphins with a gangway.
The framework for a CBA of a project or policy is well defined in economics. The fundamental
steps are as follows,
1. Clearly define counterfactual and policy option(s): The correct definition of the
potential solutions, including counterfactual and policy option(s), is vitally important
as it directly impacts the range of costs and benefits examined, and the resulting
quantum. Generally, the counterfactual is defined as the ‘do nothing’, ‘do minimum’
or even ‘Business-as-usual’, whereas the policy option(s) allow for an intervention or
(more) change. While this step may seem relatively uncontroversial, the definition of
proposed solution or solutions may not always be straightforward and could evolve
over the study period (as has happened in this situation).
2. Identify who gains and who loses: in a CBA it is common practise to develop a list of
the people or groups that may be affected, either positively or negatively (maybe
both), by the alternative policy options. This assessment includes the direct financial
effects that fall on; POAL, Panuku, ATEED and Auckland Council, and wider economic
effects (experienced by the Auckland community, Iwi, the Auckland economy, Central
Government, the rest of New Zealand, etc.)
3. Identification of the costs and benefits: this step establishes a list of all costs and
benefits that may arise from the proposed solution. This step ensures that
researchers account for all costs and benefits including those that may be hard to
quantify. It is important to note that costs and benefits are not limited to market
valued transactions. The assessment of proposed solution should extend to include
non-market impacts, including externalities such as environmental affects and effects
on other users of the harbour. While these may not be included in monetary terms
they will be identified and quantified in terms of their significance (where
monetisation is not possible).
4. Valuation of the costs and benefits (over time): where possible the costs and benefits
will be quantified and monetised, where not possible, they will be identified and
categorised. We have drawn on information provided by ATEED, including capital
expenditure, operating expenditure, environmental assessment, hydrology reports,
27 Refer to
The Treasury (2015) Guide to Social Cost Benefit Analysis and Auckland Council (2013). Auckland Council
Cost Benefit Analysis Primer. Internal publication.
15and data from NZCA and POAL. These will be used to establish a time series of all costs
and benefits.
We concur with the Treasury guide which states that “Valuation of costs and benefits,
however, is usually more difficult. But this is not a reason not to make an attempt.
Even a rough, back-of-the-envelope attempt will convey some useful information to
decision-makers. In fact, just identifying the main costs and benefits, and summarising
them in a table on one page, often reveals surprisingly useful information”.28 In some
instances the CBA has drawn on international literature and assumptions to develop
estimates of certain costs and benefits, specifically the externalities associated with
the project.
5. Sensitivity Analysis: a final step in a CBA and economic modelling is to test sensitivity
of the outcomes to key assumption changes. All economic models apply assumptions
because an economy is too complex to replicate exactly in a mathematical system. It
is best practise to test the results from CBA and economic models by varying key
assumptions. This ensures that the findings are not overly ‘sensitive’ to changes in
these assumptions. In terms of the modelling of the short-term solutions, it will be
important to test assumptions around the discount rate, the life of the Mooring
Dolphins and gangway (10-15-20-25-30 years), impacts on passenger behaviour (of
the short-term solutions), the value of externalities and future growth of extra-large
vessels (see Appendix A for Sensitivity Analysis).
We consider that it is vital for the CBA to include these five key steps to ensure a robust
decision on the most appropriate short-term solution.
The study also estimates the level of economic activity generated in Auckland as a result of
the short-term solution. The EIA applied in this study is the same model as has been applied
in past studies of the New Zealand Cruise Industry.29 Similar modelling methods are applied
internationally for cruise industry and other tourism sectors.30 Details of the model are not
described within the body of this report. For further details, the reader should refer to one of
the previous studies of the New Zealand cruise industry.
Results of the EIA undertaken here are important because the cruise industry has a significant
role in Auckland’s economy (and New Zealand’s). Significant volumes of income are gained
from the cruise industry, which in turn generate direct and indirect economic activity and
sustains employment. Estimates of the wider economic effects captured within the EIA are
reported in terms of GDP (value added) and employment (job equivalents).
28 The Treasury (2015) Guide to Social Cost Benefit Analysis, p16.
29 Market Economics (2017) Economic Impact of 2016-17 Cruise in New Zealand.
30 See Cruise Lines International Association (2016) 2017 Cruise Industry Outlook.
AEC Group (2016) Economic Impact of the Cruise Industry in Australia, 2015-16.
163 Cruise Terminal Solutions
The first step in CBA is to define the proposed solution and establish the counterfactual. The
counterfactual solution is used as a ‘base line’ from which the policy option is tested. The
marginal difference between the counterfactual and the proposed option quantifies the effect
of the proposed solution has on the economy – both in positive and negative terms.
The counterfactual in this study has been called the “Do Nothing” solution. Do Nothing
assumes that extra-large vessels are handled using tenders (small craft) to move passengers
and other craft to service the vessel which moors or remains on station in the harbour. We
note that this solution is not a true ‘do nothing’ solution, as some new facilities will be
required.
In the lead up to this study, Panuku has assessed and discarded a range of alternative policy
option(s) that could be utilised as potential immediate solutions for handling extra-large
vessels in Auckland. Most of the options have been shown not to be feasible due to political,
engineering and operational reasons. At this time there is only one option remaining
consisting of the Mooring Dolphins with a gangway which is defined as follows,
Mooring Dolphins – with gangway: consists of two mooring dolphins (standalone,
broadly circular mooring platforms piled into the seafloor) placed in the harbour, centred
49 and 82 metres from the end of Queens Wharf. A gangway connects Queens Wharf
and the mooring dolphins to provide safe access for port employees.31 The public will
have access to the first section of the gangway when the infrastructure is not in use by
cruise ships, but not to either of the mooring dolphins.
M.E has not attempted to assess the viability of any of the previous options in this study. There
may be financial, legislative, safety, environmental, operational or political constraints that
could make these options impossible to deliver. M.E has not undertaken to establish whether
there are any other alternative policy options.
We acknowledge that the Auckland Council Downtown Framework from 2014 suggests four
longer-term alternative options for handling extra-large vessels.32 All of these options include
extending wharves around the existing cruise terminal (combination of extensions to Princes
Wharf, Queens Wharf, Captain Cook Wharf and Bledisloe Terminal). The costs of constructing
the wharf extensions associated with these alternatives would be orders of magnitude greater
than the options discussed in the following CBA.33 In addition the scale of these larger
extensions would likely have greater ongoing impacts (visual, environmental, recreational and
cultural) than the proposed option tested in this study.
31 Beca (2018) Preliminary costs for Mooring Dolphins with gangway.
32 Auckland Council (2014) Downtown Framework.
33 NZ Herald (11th September 2014) Auckland’s Wharves too short for liners. “cost of extending the wharves was in
the tens of millions of dollars.”
173.1 Do Nothing
The Do Nothing solution for handling extra-large vessels in Auckland used in this study is based
on the (recently) employed location of Viaduct Harbour applied to the yet to be developed
Queens Wharf east basin option. In short, extra-large vessels will remain ‘on station’ in the
harbour and the ship’s tenders transfer passengers to an onshore staging area (to date this
has been the Viaduct Harbour, although we note that with the America’s Cup Syndicate bases
about to be developed across this area, the tendering will be moved to Queens Wharf east
basin). The solution has been utilised to handle one extra-large vessel, OotS on six occasions;
27th December 2016, 14th January 2017, 6th of February 2017, 21st December 2017, 2nd January
2018 and 8th February 2018.
Figure 3.1: Ovation of the Seas Tendering Passengers to shore in Auckland
Source: Stuff (2016) The Ovation of the Seas: Cruise Ship lowers the lifeboats.
As far as we are aware, this use of tenders to handle cruise passengers is a first for Auckland.
The previous largest cruise vessel to visit Auckland was the Queen Mary 2 which was berthed
at the general cargo wharf (Jellicoe wharf). As Auckland is not a tendering port, there are no
specifically built tender pontoons near the existing cruise terminal.
Given the lack of facilities POAL undertook an assessment of potential disembark and embark
sites, including Queens Wharf34, Princes Wharf35, Maritime Museum36, and Viaduct Harbour.
34 To employ Queens Wharf as a passenger staging area, the construction of appropriate gangways and removable
pontoons is required to allow safe and efficient handling of tenders and passengers. The additional facilities would
cost in the order of $200,000. If Queens Wharf was the preferred tender site would likely incur relatively little
operational expenditure above that of general maintenance, as there are existing facilities for both passenger
arrival and departure (e.g. Shed 10 or the Cloud), MPI customs processing, and bus or coach parking. The centrality
and size of the area to the CBD would also allow for quick dispersal of passengers, thereby minimising congestion
issues.
35 The Princess Wharf option would have similar capital costs (gangways and removable pontoons) and operational
expenditure as the Queens Wharf option. However Princess Wharf was discounted as there is limited space for
coaches and other vehicles which could hinder passenger processing, also high volumes of ferry traffic could hinder
tender operations.
36 The Maritime Museum would require construction of additional pontoons to accommodate the tenders and
quite a lot of modification to the existing pontoons (approximated at $112,000). In addition, there are issues
18The preferred staging area was in Viaduct Harbour at Halsey wharf to the east of ANZ Viaduct
Events Centre, soon to be occupied by Americas Cup Syndicate bases (hence the need for the
shift to the Queens Wharf east basin). Figure 3.2 shows the Viaduct Harbour location which
was used to handle tendering for the OotS.
Figure 3.2: Ovation of the Seas Tender at berth in Viaduct Harbour
Source: M.E (2017) Tender from Ovation of the Seas berthed in Viaduct.
This will become an issue in the near future with the Viaduct Basin no longer being a transfer
or staging option. The proposed alternative will be used from the 2018/19 season as the
building of the syndicate bases commences in the Viaduct.
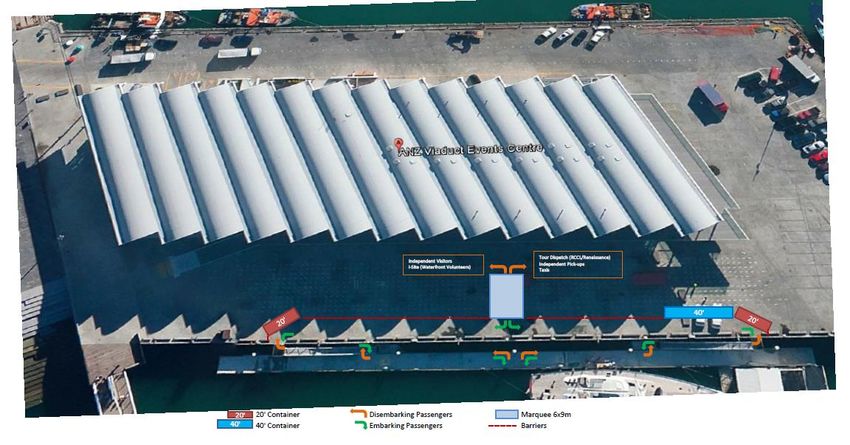
Figure 3.3: Queens Wharf East Basin for Future Handling of Tendering
around health & safety with the pontoons being fairly narrow and susceptible to ferry wash. There was also the
need to relocate some of the museum exhibits. The passenger area, although adequate for processing by MPI,
passengers had to exit via a ‘loading dock’ and walk some way to waiting coaches and tour vans.
193.1.1 Construction
The main reason that the previous Viaduct location was selected for handling tenders was that
the existing facilities required very little additional capital or construction. Existing pontoons
are wide (5 metres) and long (100 metres) with gangways up to the wharf on either end. This
length and width allow multiple tenders to dock and quick handling of passengers from the
tenders up to wharf level.
However, with the Queens wharf east basin option, there may be additional construction costs
as the area only has fixed facilities (Queens Wharf, jetty, larger staging areas etc) and no
pontons or gangways from which tendering can be undertaken.37
For the purposes of this study it is assumed (conservatively) that there is no additional
construction associated with the Do Nothing solution.
3.1.2 Operational
Alongside construction requirements, there are operational costs associated with the Do
Nothing approach. Aside from the existing pontoons (in the Viaduct) and wharfs (Queens
Wharf east basin), a core benefit of the locations is that they are relatively sheltered. The areas
are relatively protected from wave action and subject to limited water traffic, both of which
make for safer and faster disembarking and embarking of the tenders.
There is also sufficient room for vehicle parking, passenger dispersal, and biosecurity
processing. Some cost is incurred, however, by the use of the wharf (Panuku), and and any
pontoons needed (Panuku), alongside the cost for a biosecurity marquee.38 There may also
be other operational costs associated with the Queens Wharf east basin location.
Adding to these site-specific operational expenses, there are expenses incurred regardless of
the tender site. Due to safety regulations the extra-large vessels are not allowed to drop
anchor within the harbour. This means OotS was required to undertake Dynamic Positioning
manoeuvres, which requires constant activity of the vessels thrusters to remain in a fixed
location. In addition, a POAL Pilot will have to be present on the vessel at all times, while a
tug and crew will also have to be on standby. This means that the tendering will generate
addition expenses via fuel consumption costs, pilot fees and tug hire.
The Viaduct location could handle four tenders at one time and was able to process
approximately 1,200 passengers per hour, in total requiring approximately four hours to
transfer the majority of the OotS passengers ashore.39 The main bottleneck in the handling
occurred during the boarding of the tenders, both on the vessel where there was long queuing
37 To employ Queens Wharf as a passenger staging area, the construction of appropriate gangways and removable
pontoons is required to allow safe and efficient handling of tenders and passengers. The additional facilities would
cost in the order of $200,000.
38 The cost is estimated as less than $10,000 per day for pontoon, carpark and marquee hire.
39 Renaissance Tours (2017) Passenger and Crew handling data for Ovation of the Seas. 80% of passengers
disembarked between 7:00 am and 11:00am.
20in the morning peak (disembark) and onshore in the afternoon (embark).40 The movement of
the tenders on the harbour and unloading was relatively efficient, totalling less than 10
minutes for each tender.41 We note that the process of handling tenders has been developing
and improving. As such, future passenger tendering methods may result in improved
passenger handling efficiency over and above what is currently possible. Figure 3.4 shows the
current method of onshore processing.
Figure 3.4: Viaduct Harbour Tender berths and Passenger Flows Diagram
Source: ATEED (2016) Passenger Flow Diagram.
In comparison the Queens Wharf east basin has a number of jetties and Queens Wharf itself
where tenders can be handled. The processing efficiency of the new location will not be known
until the detailed plans on passenger flows and tender berths are developed. In this study it is
assumed that the Queens wharf east basin will have the same efficiency as the existing Viaduct
harbour location.
There are other health and safety implications of tendering and dynamic positioning. The
Harbour Master will not allow tendering or dynamic positioning to occur in the harbour if
winds exceed 25 knots - the vessel will be required to leave the harbour.42 As a result extra-
large vessels may be forced to cancel visits to Auckland resulting in a total loss of income. Such
an occurrence has happened recently in Dunedin when a forecasted storm triggered OotS to
bypass the port altogether, impacting heavily on tourism operators.43 Similarly, increased
operational costs may occur when poor weather causes: a) the vessel to leave harbour,
stranding passengers and incurring transport costs to other ports or b) the vessel to call
passengers back early, resulting in a partial loss of tourist spend.
40 Renaissance Tours interview. Note that ID Tours has now replaced Renaissance Tours as the ground handler.
41 M.E observation of tendering on the 6th February 2017.
42 Harbour Master (2017) Advice on Tendering of extra-large vessels.
43 Otago Daily Times (21st December 2016) Cancelled Cruise hits Tour Operator.
213.2 Mooring Dolphins – with gangway
A set of mooring dolphins and a gangway has been identified as preferred option for handling
extra-large vessels. The cruise industry has been suggesting for over half a decade that a
mooring dolphin should be built in Auckland, first suggested as a means to handle the 345
metre Queen Mary 2.44
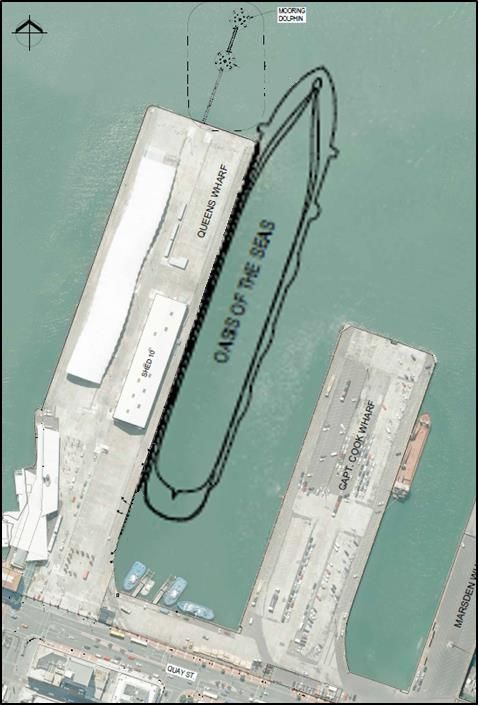
The current resource consent is for two mooring dolphins approximately 15 metres in
diameter, centred 49 and 82 metres from the end of Queens Wharf (a total of almost 90
metres into the harbour). Figure 3.5 shows the proposed mooring dolphins and gangway at
the end of Queens Wharf along with Oasis of the Seas at 362m (black outline) which is larger
than the OotS (348m).
Figure 3.5: Proposed Mooring Dolphins with gangway and Extra-Large Vessel
Source: Beca (2018) Locality Diagram and Extra-Large Vessel.
The mooring dolphins also includes a gangway from Queens Wharf which is 1.7 metres wide,
Figure 3.6 shows the panorama of the construction.45
44 Cruise New Zealand (2010) Every Reason to party with Top Cruise Terminal.
45 Boffa Miskell (2018) Proposed Upgrade of Queens Wharf Berthing Facilities Landscape and Visual Amenity Effects
Assessment Graphic Supplement.
22Figure 3.6: Panorama of Proposed Mooring Dolphins and gangway.
Source: Boffa-Miskell (2018) Panorama of Mooring Dolphins and gangway.
Relative to the tendering (Do Nothing) scenario, the key benefits of the mooring dolphins and
gangway relate to the increased ability of passengers (and crew) to go ashore as well as the
simplified logistics of servicing the vessel. There are also benefits in terms of allowing
exchanges to occur in Auckland, which is not possible using tenders. Given the historic trends
in the market, we consider that it is likely that extra-large vessels will undertake exchanges in
Auckland in the coming decade if the vessels are able to berth along side the wharfs. This is
significant in an economic sense as exchanges facilitate a large amount of additional spending
as up to 9,000 passengers either disembark or embark and leave on cruises.
3.2.1 Construction
There are obviously costs associated with the consent and construction of the Mooring
Dolphins and adjoining gangway. The Beca Preliminary Design Report outlines detailed
specifications of the mooring dolphins and the gangway construction.46 The following text
provides a high level summary of the works required. In brief, construction costs can be
categorised as moorings construction, gangway construction, wharf upgrades, and dredging
costs.
Construction of the moorings itself will incur costs through the boring and placement of
reinforced concrete piles, protective bollards, and acquisition of mooring capstan and is
expected to cost $7.89 million.47
Gangway construction incurs additional costs through the construction of the gangway itself,
along with support piles and pile caps on which to rest the gangway, which will cost $1.09
million.48 The moorings would not be accessible to the public.
Upgrades to Queens Wharf are also required to handle the large vessels, with wharf
strengthening and bollard placement required on the south-eastern end of the wharf to
accommodate the new vessels. The current fender at the northern end of the wharf also
requires replacing, so as to absorb the energy of berthing vessels thereby protecting the wharf.
In total the additional work would cost a further $1.14 million. 49
46 Beca (2018) Preliminary costs for Mooring Dolphins with gangway.
47 Ibid.
48 Ibid.
49 Ibid.
23Finally, to enable extra-large vessels to dock in the berth some dredging may be required.50
This dredging may be required to provide clearance under keel and allow for vessel
movements at berth. There is some uncertainty about the level of dredging required, which
could range from 2,000 to 25,000 m3, which could cost between $200,000 and $2 million. 51
The most recent estimate of dredging required is within this range.52
There would also be a contingency of $1.03 million to $1.22 million. 53
The total capital expenditure (including contingency) required to allow extra-large vessels to
berth at Queens Wharf is expected to range between $11.35 million to $13.33 million.
3.2.2 Operational
The operational use of the mooring dolphins and gangway will be administered by POAL. In
terms of operational expenses there may be some minimal expense to POAL and minimal
maintenance to the structure required. These costs may be offset by additional fees collected
by POAL, however in this study we have assumed that extra-large vessels will not pay any
additional fees to use the mooring dolphin. In brief the operation will be similar to existing
cruise vessels.
The passengers, crew, baggage and cargo will be handled via the existing facilities on the
Queens Wharf (shed 10). We note that Queens Wharf and Shed 10 is expected to be able to
handle at least 3,000 passengers arriving ashore each hour.54 Given the number of passengers
on an extra-large vessel, the handling would be almost free flow with minimal queuing (i.e. no
bottlenecks).55 This maximum is defined by the velocity of passengers through gangways,
which could be improved to match the demands of the extra-large vessels.
50 There is an existing consent in place to undertaking maintenance dredging.
51 Panuku (2016) Initial Costings of Mooring Dolphin and other improvements.
52 Beca (2018) Preliminary costs of Dredging for Mooring Dolphin.
53 Ibid.
54 Renaissance Tours (2017) Passenger handling data for Ovation of the Seas.
55 Renaissance Tours (2017) Passenger handling data for Ovation of the Seas.
244 Stakeholder Groups
The second step of cost benefit analysis is to establish the main groups that will be affected
by any decision on the Auckland Cruise terminal and the handling of extra-large vessels. We
refer to these groups as stakeholders who may have a direct or indirect influence over the
decision.
We consider that the bulk of benefits and costs will accrue to the following stakeholder groups
within Auckland region,
• Auckland Council and CCO (Panuku, ATEED, Auckland Transport),
• Ports of Auckland,
• Iwi and hapū with cultural interest in the area,
• Customs and Biosecurity,
• Cruise operators,
• Commercial Harbour Operators,
• Auckland Businesses (tourist operators, F&B & restaurants and retailers),
• Cruise Passengers and Crew, and
• Auckland Community56.
There are also potential impacts on other stakeholder groups outside Auckland region.
Importantly, the Central Government, other ports and other regional economies. These
groups are discussed briefly in the following sections. However, impacts associated with these
groups are not quantified in this study.
4.1 Auckland Council and CCO
The majority of the upfront construction costs will be funded by Auckland Council via either
the Council directly (as with Shed 10), its CCOs or the Ports of Auckland. However, Auckland
Council and ATEED (also a CCO) may also benefit from the new facilities, in that the increased
visitor activity will be stimulating the region’s economy. This additional economic activity has
implications for Auckland Council in terms of rates, as well as other services.57 The Council has
resolved that the construction costs will be recovered from the industry via a levy charged by
POAL. The rate, timing and application of the levy has yet to be determined but it could be
expected that the capital costs will be repaid within 10 years from completion. At a high level
56Which includes recreational users of the harbour.
57Additional economic activity can have implications in terms of demands on council services and property values.
In some case additional council services will be required which can create additional rates burden. In contrast
additional economic activity can cause property values to increase which can spread the rating burden across more
people.
25You can also read