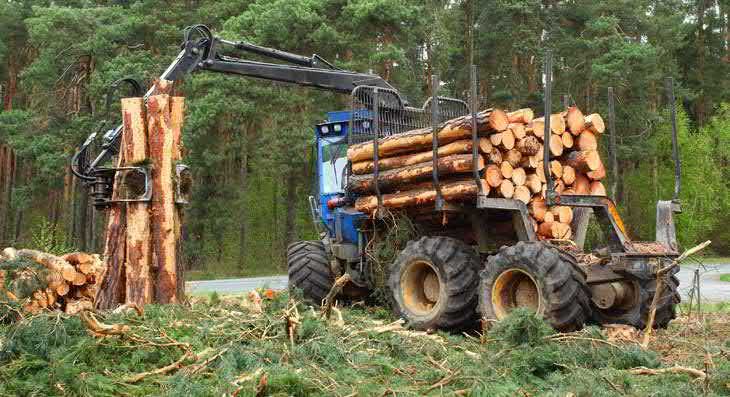
Russian Forest Sector Overview 2018 - With assistance from - EY
←
→
Page content transcription
If your browser does not render page correctly, please read the page content below
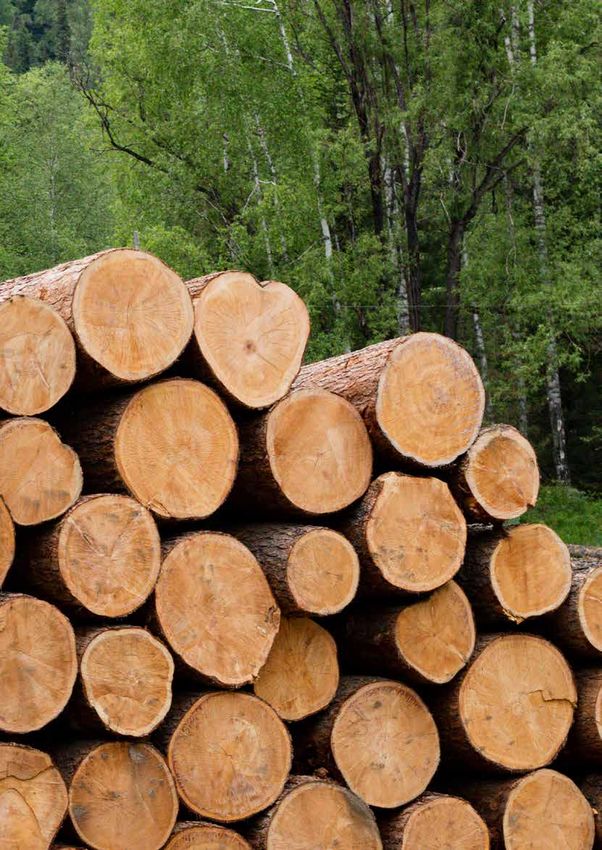
Russian Forest
Sector Overview
2018

       With assistance from
Contents
Introduction                               1
Russia’s forest resources                  2
Key facts and figures about fast-growing
forest industries                          5
Global production of forest products       6
Sawnwood                                   8
Wood pellets                               10
Pulp                                       12
Household and sanitary paper               14
Packaging materials (paper/paperboard)     16
Particle board                             18
OSB                                        19
MDF/HDF                                    20
Plywood                                    22
Forest sector innovations                  24
Investments                                26
Government support mechanisms              30
Conclusion                                 39
Contacts                                   40
Introduction
                                    Russia’s forest sector is growing rapidly. Growth across its many industries,
                                    including the production of OSB1, particle board and fuel pellets, has
                                    significantly outpaced Russian economic growth in recent years. However,
                                    considerable potential remains to be tapped to satisfy demand for forest
                                    resources and add more value to forest products. As investments in the Russian
                                    forest sector mostly come from private companies, it is essential to increase its
                                    appeal to investors to drive strong growth.
                                    The future of the forest sector is high on the agenda today. The authorities,
                                    including the responsible ministries and other government bodies, as
                                    well as development institutions, are currently focused on identifying and
Igor Prutov                         implementing solutions that can improve the investment attractiveness of the
Partner, CIS Forest                 sector and remove barriers to growth. On 20 September 2018, the Russian
Group Leader
                                    Government approved Russia’s Forest Sector Strategy until 2030 that is
+7 916 825 2309                     expected to help increase the sector’s share of domestic GDP from 0.5%
Igor.Prutov@ru.ey.com
                                    in 2016 to 1% in 2030.
                                    EY, with assistance from the Association of Specialists of the Pulp and Paper
                                    Industry (ASPPI), conducted a study to answer a key question: which forest
                                    industries in Russia have the greatest growth potential and what kind of
                                    support industry players need to leverage on the opportunities. The survey
                                    covered forest sector companies that hold from 50% to 70% of the market in
                                    their industry. Its findings are presented in this report.
                                    Our report includes the following main sections:
                                    • Russia’s forest resources
                                    • Key facts and figures about fast-growing forest industries
                                    • Investments
                                    • Government support mechanisms
Sergei Malkov
Management Board Member             We hope that our report can provide useful material to industry players,
of the Association of Specialists   investors and other stakeholders interested in the future of the Russian
of the Pulp and Paper Industry
                                    forest sector.
+7 925 000 1011
info@asspi.ru

                                    1 OSB   stands for oriented strandboard

                                                                                        Russian Forest Sector Overview 2018 |   1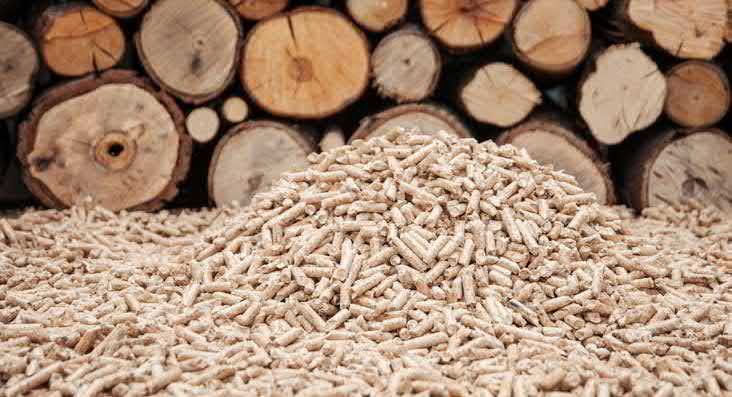
Russia’s forest resources
    Northwestern Federal                                                                                                               Far Eastern Federal
    District                                                                                                                           District
    Forest area:                                                                                                                       Forest area:
    888.6 million hectares                                                                                                             295.3 million hectares
    Standing timber:                                                                                                                   Standing timber:
    10,420 million cubic meters                                                                                                        20,490 million cubic meters
    Annual allowable cut:                                                                                                              Annual cutting area:
    119.7 million cubic meters                                                                                                         91.5 million cubic meters
    Harvesting volume: 44%                                                                                                             Harvesting volume: 18%
    of the annual allowable cut                                                                                                        of the annual allowable cut

    Central Federal                                                                                                                    Siberian Federal
    District                                                                                                                           District
    Forest area:                                                                                                                       Forest area:
    22.6 million hectares                                                                                                              276.7 million hectares
    Standing timber:                                                                                                                   Standing timber:
    3,972 million cubic meters                                                                                                         33,233 million cubic meters
    Annual allowable cut:                                                                                                              Annual cutting area:
    56.3 million cubic meters                                                                                                          267.5 million cubic meters
    Harvesting volume: 41%                                                                                                             Harvesting volume: 27%
    of the annual allowable cut                                                                                                        of the annual allowable cut

    Southern Federal                          North Caucasus                               Volga Federal                               Ural Federal
    District                                  Federal District                             District                                    District
    Forest area:                              Forest area:                                 Forest area:                                Forest area:
    3 million hectares                        1.7 million hectares                         37.8 million hectares                       69.5 million hectares
    Standing timber:                          Standing timber:                             Standing timber:                            Standing timber:
    526 million cubic meters                  278 million cubic meters                     5,691 million cubic meters                  8,124 million cubic meters
    Annual allowable cut:                     Annual cutting area:                         Annual cutting area:                        Annual cutting area:
    2.1 million cubic meters                  0.7 million cubic meters                     67.6 million cubic meters                   98.6 million cubic meters
    Harvesting volume: 30%                    Harvesting volume: 20%                       Harvesting volume: 48%                      Harvesting volume: 15%
    of the annual allowable cut               of the annual allowable cut                  of the annual allowable cut                 of the annual allowable cut

Russia is home to nearly one-quarter of                Countries with the largest forest                           The world’s largest timber
the planet’s forests. However, around 65%              area in 2017, % of the world’s                              producing countries in 2017,
of Russia’s forests grow in severe climate             forest reserves                                             million m3
conditions, which result in low productivity
and a fragmentary nature of growing                           Russia                            21%                           US                                           419
stock, as well as high harvesting and
                                                               Brazil                   13%                                 India                                     355
transportation costs.
                                                             Canada                8%                                      China                                   332
Around 76% of the country’s forests are
composed of coniferous species. Standing                          US               8%                                      Brazil                           257
larch trees, which have limited applications                   China           5%                                         Russia                         214
in the timber industry, account for a
considerable proportion of them.                          DR Congo            4%                                         Canada                     157

The annual allowable cut was established                   Australia          4%                                      Indonesia                  120
at 703 million cubic meters at the end                     Indonesia        2%                                          Ethiopia               112
of 2016 but no more than 30% of it is
normally harvested.                                           Sudan         2%                                        DR Congo               88

                                                                India       2%                                           Nigeria            76
In accordance with Russia’s Forest Sector
Strategy until 2030, the proportion is                        Others                                        32%
projected to increase to 41% as harvesting
is slated to rise to 286 million cubic meters          Source: Forest Areas, Les Online, Lesnaya Promyshlennost,   Source: Russian Regions. 2017 Social and Economic Indicators
to meet new demand from woodworking                    monitoring results as of 30 September 2018                  Report, the Unified Interdepartmental Statistical Information
                                                                                                                   System (UniSIS), EY analysis
companies.

2     | Russian Forest Sector Overview 2018
Felling and forest regeneration in Russia, thousand ha
1,200 147% 1,135 160%
1,071 1,074 1,065
1,017 1,013 140%
1,000 914 122% 923
112% 870
857 840 864 839 120%
821 816 829 813 803
800 734
671
100%
658 102%
622 75% 74%
600 88%
80%
84% 83% 81% 80%
60%
400
263
230
40%
195 191 171 197 187 187 182 178
200 20%
n/a
0 0%
2000 2004 2006 2008 2010 2011 2012 2013 2014 2015 2016
Final felling, thousand ha Forest regeneration, thousand ha incl. tree planting
Forest regeneration (ratio to final felling area)
Sources: Russia’s Ministry of Industry and Trade, Russia’s Forest Sector Strategy until 2030, EY analysis
Harvesting volumes are lower than the Russia’s Forest Sector Strategy until 2030 • A lack of skilled workers due to low
allowable annual cut due to the following: aims to increase the share of the forest wages in the sector, which are 60% to
• No access to remote forests from main sector in domestic GDP from 0.5% to 1%, 65% of the average in other industries.
railway lines, motorways or rivers the number of jobs in the forest sector
• A lack of legislative mechanisms
from 500,000 to 820,000, and all taxes
• Forest underutilization under forest to stimulate the construction and
paid by the sector from RUB 90 billion to
parcel lease contracts operation of forest roads and
RUB 190 billion.
• Lack of up-to-date data on forest uncertainty regarding the rights of
resources At the same time, the sector experiences a forest parcel leaseholders engaged in
number of problems, such as: the construction and operation of forest
• Inefficient forest regeneration to
roads. Forest roads do not fall within the
reproduce economically valuable species • Equipment wear (60% to 70% of
category of regional or local roads and
on the most productive and transport equipment is worn out). Efforts are
are not included in land-use planning
accessible forest land underway to replace it, with imports
schemes.
Areas of final felling have surpassed forest of woodworking equipment jumping
regeneration areas over the last decade. year-on-year by 60.7% in 2017 after • Unlike the pulp and paper industry,
dropping by 15.6% in 2016. Industry for instance, the logging industry
Felled areas that were never replanted players that participated in the survey is poorly consolidated, with its
reached 1.4 million hectares in 2010-16. also highlighted the urgent need to landscape consisting of many small
The ratio of forest regeneration to areas of upgrade production facilities. players. However, their consolidation
final felling dropped from 147% in 2000 to can become an imperative driven by
74% in 2016. initiatives to increase the production of
value-added wood products and tighter
requirements for giving projects priority
status.
Russian Forest Sector Overview 2018 | 3
Waste paper is an                            Forest roads, km per thousand ha
                                             of forest
                                                                                                            Waste paper collection and recycling
                                                                                                            in Russia, million t
essential feedstock                                                                                                  4.3                        4.6
                                                 Germany                                               45                                          3.7
                                                                                                                        3.5
Russia produced around 8.8 million tonnes                                                                                 3.3                        3.4
                                                   Austria                                    36
of waste paper in 2017. However, only
3.5 million tonnes, or 44% of the total                 US             10
amount, was collected. Retail networks,             Russia      1.4
publishing houses and offices are key                                                                                  2017                       2018
sources of waste paper.                      Source: Food and Agriculture Organization of the United
                                                                                                                                               (forecast)
                                             Nations, State of the World’s Forests (SOFO) 2016                        Recycling capacity
The recycling rate has increased tenfold
                                                                                                                      Paper recycled
since 2000 on the back of capacity
                                                                                                                      Paper collected
additions that extended total recycling
capacity 11-fold. Volumes of waste paper                                                                    Source: Lesnaya Industria magazine, issues Nos.7-8, 2018

collected have, however, fallen short of
investors’ expectations, with the current
                                             Trends that will shape Russia’s forest sector in the next three
shortage of waste paper estimated at
                                             to five years
around 1 million tonnes.

This shortage is behind the fact that only                                 Capacity additions                                                                     65%
a small share of paper and cardboard is                  Withdrawal of inefficient capacity                                                                        65%
made from recycled materials: 32% of total
production, compared with 72% in the EU.                        Advanced wood processing                                                        47%

The corrugated packaging market is a                         Logging industry consolidation                                                     47%
key driver of waste paper recycling, with
                                                                  Innovative wood products                                   29%
corrugated board production soaring more
than fourfold since 2000. Case materials,    Self-sustaining wood burning power stations                                     29%
which are used for the production of
corrugated board, are mostly made                                        Intensive forest use                                29%
from recycled paper. The proportion of
                                                Deployment of innovative equipment and                      12%
case materials with recycled content has                                        robots
increased more than sevenfold since
2000.                                           Inbound acquisitions (by foreign players)                   12%

                                                    Expansion of Russian players into new
                                                                                                            12%
                                                                                  markets

                                                       Outbound acquisitions (by Russian           0%
                                                                             companies)

                                                                                        Other                                29%

                                             Source: EY and ASPPI Survey

4   | Russian Forest Sector Overview 2018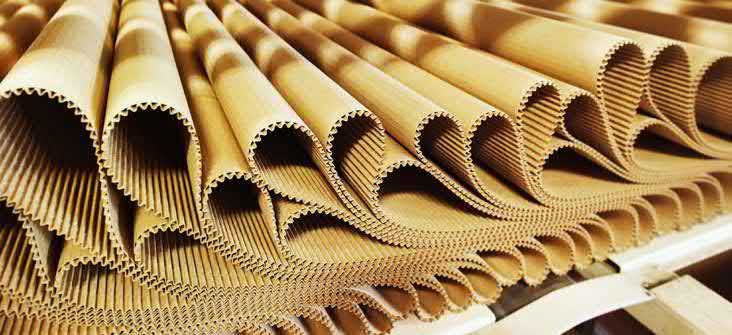
Key facts and figures about
fast-growing forest industries
This report provides an overview of key                 Respondents’ outlook on the forest sector in the next three
forest industries, except for furniture                 to five years
manufacturing. This analysis covers global
production figures, Russia’s share of the                                                                   Decline           ~ 0% /                       Growth
global market and growth rates in                                                                          1%-3% p.a.          p.a.         1-3% /p.a.          >3% /p.a.
2013-17.                                                 Sawnwood
Based on our survey (see the table on the                Wood pellets
right) and our analysis (see the next two
pages), we have identified the following                 Pulp
fast-growing industries in Russia:                       Household and sanitary paper

• Sawnwood                                               Particle board

• Wood pellets                                           MDF/HDF

• Pulp                                                   OSB

• Household and sanitary paper                           Paper (in general)

• Packaging materials (paper/paperboard)                 Cardboard (incl. container board)

• Particle board                                         Tallow oil

• OSB                                                    Plywood

                                                         Roundwood
• MDF/HDF2
                                                         Newsprint
• Plywood
                                                        Source: EY and ASPPI Survey
Below is an overview of the current
situation in these industries and their
prospects.

Overall, our survey findings are consistent
with both historical growth rates (see the              Global growth rates across industries
next two pages) and the global market
                                                         2012-16 CAGR                  5.9%                 1.4%             5.3%             16.5%                 7.9%
outlook (see the diagram on the right).
                                                         2016-30 CAGR                  1.7%                 1.8%              n/a             3.5%                  4.1%
Russia’s plywood production differs in
structure from that in the rest of the world                                               595
as local forests supply birch timber, a less                                                                    572
common feedstock abroad.
                                                                                      465
                                                                                                          440
                                                                                                       416
                                                                                  370

                                                                                                                                                                      291

                                                                                                                               225
                                                                2012
                                                                                                                            183
                                                                                                                                                                    160
                                                                2016
                                                                                                                                                              118
                                                                2030

                                                                                                                                                      47
                                                                                                                                                 28
                                                                                                                                            15

                                                                                   Sawnwood,          Pulp and paper,     Wood-based       Wood pellets,       Plywood,
                                                                                   million m3            million t      panels, million m3   million t         million m3

                                                        Source: Russia’s Forest Sector Strategy until 2030, FAOSTAT

2 MDF/HDF   stands for medium/high-density fiberboard

                                                                                                                               Russian Forest Sector Overview 2018 |        5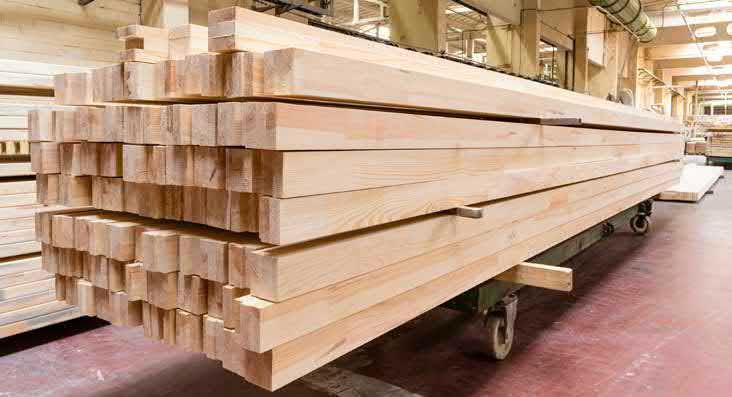
Global production of forest
products

    Global production                                        233.8                                      Industrial
                                                                                                        roundwood      10.5%
    in 2017 (USD million,                                    201.1
    nonlinear scale)                                                            Wood fuel
                                                             124.1
                                                             117.2               0.8%

                                                              82.9
                                                              77.7

                            Russia’s share                    53.2
                             of the global                                                  Recovered paper
                                market                        45.5
                                                              40.7                             1.2%       Wood chips
                                                              39.2                Charcoal
                                                              33.1
                                                                                                              3.4%
                                                              23.9                      0.1%
                                                              22.5
                 Newsprint            Mechanical pulp
                                                                                  Wrapping
                                                              19.0       3.3%     paper             Veneer
                  6.3%                       9.2%             11.8
                                                                     10.5
                                                               9.8                                   6.8%
                                                Fiberboard
                       Semi-                                   7.8
                       chemical   7.1%                               6.0
                       pulp                      3.8%          4.8
                                                                     4.0

                  -5.5            -2.6       -2.3 -1.2               0            0.4   0.7      1.1 1.2      1.2       1.3

     Source: EY analysis

6    | Russian Forest Sector Overview 2018
Fast-growing
               Packaging
      2.4%     materials
                                                                                        industries
                                 Sawnwood

                                  8.5%
                                                             Plywood
Chemical
Pulp
                                                             2.3%
                      Regenerated
 4.1%                 fibers

                          0.1%
             1.5%                       MDF/HDF

           Household                    2.9%
           and sanitary
           paper
                                            Particle board

                                                8.0%

                                                                          OSB

                                                                                                     Wood pellets
                                                                         3.3%
                                                                                                         4.3%

 1.6 2.1 2.2              2.5     3.3     3.9     4.2          6.3        7.3                             11.6
                                                                       2013-17 CAGR, % (non-linear scale)

                                                                                Russian Forest Sector Overview 2018 |   7
Sawnwood

Facts and figures about                     Demand for sawnwood is expected to rise
                                            further on the back of economic stability in
                                                                                           Top 5 sawnwood exporters, 2017

Russia’s sawnwood
                                                                                                                           Share
                                            the US and the EU.                                                Exports,
                                                                                                                          of global
                                                                                                              USD ‘000
exports and imports                         Russia’s Forest Sector Strategy until
                                                                                            Canada            8,330,940
                                                                                                                          exports
                                                                                                                            22%
                                            2030 foresees an increase in domestic
Global trade in coniferous sawnwood         sawnwood consumption to 22.6 million –          Russia            3,989,662     10%
increased by 28% to 126 million cubic       28.8 million cubic meters, with global          US                3,792,074     10%
meters in 2017 compared with 2008.          demand for Russian sawnwood, largely
                                                                                            Sweden            3,209,384      8%
                                            from China, projected to rise to
Coniferous sawnwood production in the                                                       Germany           2,141,912      6%
                                            26.9 million – 30.0 million cubic meters.
US reached a peak in 2017 compared with
                                            Sawnwood production in Russia is               Source: FAOSTAT.
the previous decade.
                                            projected to reach 49.5 million –
Canada’s coniferous sawnwood exports fell   58.7 million cubic meters. Russia plans
by 4.8% after the United States imposed     to sell it domestically and abroad,            Top 5 sawnwood importers, 2017
an anti-dumping duty on imports.            mainly to China.
                                                                                                                           Share
                                                                                                              Imports,
                                            Given the projected capacity withdrawal                                       of global
Sawnwood production in Finland also                                                                           USD ‘000
                                                                                                                          imports
increased to a peak compared with the       and utilization increases, capacity
previous decade. The growth was driven      additions of 7.3 million to 16.5 million        China             8,124,891     27%
by rising demand, including from China,     cubic meters are needed to meet demand          US                7,148,092     24%
where coniferous sawnwood prices had        in 2030.                                        Japan             2,128,126      7%
been rising for two years, reaching new
                                                                                            UK                2,086,459      7%
highs. Russia and North America offered
the cheapest sawnwood.                                                                      Germany           1,363,893      5%
                                                                                            …
                                                                                            Russia              7,001      0.02%
                                                                                           Source: FAOSTAT.

8   | Russian Forest Sector Overview 2018
Russia’s exports and imports of sawnwood
3% 7.8%
Germany’s share Japan’s share
of Russia’s exports of Russia’s exports
USD 118 million USD 306
million
Russia’s exports to Germany (443,000 tonnes)
in 2017 Russia’s exports to Japan
in 2017
5.1% 5.8% >50%
Egypt’s share Uzbekistan’s share China is the key market for Russia’s plywood,
of Russia’s exports of Russia’s exports accounting for over 50% of its exports
USD 201 million USD 229 million USD 1.96 billion (10.8 million tonnes)
Russia’s exports to Egypt Russia’s exports to Uzbekistan Russia’s exports to China in 2017
in 2017 in 2017
Source: Russia’s Federal Customs Service
Russia’s production, imports and exports of sawnwood, 2008-17
45,000
40,584
40,000 36,794
33,500 34,600 34,500
35,000 31,215 32,230
29,650
28,870
40,000 27,163 27,293 26,932
24,440
25,000 22,293
20,286 20,900
19,701
20,000 17,690
15,258 16,200
15,000
10,000
5,000
23 16 30 34 31 46 38 62 20 29
0
2008 2009 2010 2011 2012 2013 2014 2015 2016 2017
Production, thousand m3 Exports, thousand m3 Imports, thousand m3
Source: FAOSTAT, Russia’s Federal Customs Service
Russian Forest Sector Overview 2018 | 9Wood pellets
Facts and figures about Russia’s exports of wood pellets
by country, 2017
Global consumption of wood pellets,
2016
Russia’s wood pellets 3%
exports and imports 12% 8%
(in monetary terms) 4%
8%
4%
Global demand for wood pellets rose at a
5% 44%
CAGR of 11.5% from 2013 to 2017. This
rate, however, dropped by 9.4% in the EU,
the number one consumer of wood pellets 7%
globally.
Consumers of wood pellets can be divided 8%
into two groups: industrial companies and 81%
8%
households who use them to heat homes. 9%
Europe Japan and South Korea
Key drivers of demand for wood pellets Denmark UK North America Other
include dedicated government incentives, Italy Latvia
Sources: Russia’s Ministry of Industry and Trade,
the development of the legislative Belgium Finland
Russia’s Forest Sector Strategy until 2030
framework on renewable energy (EU, South Korea Other
Sweden
Japan) and subsidies for households (EU).
Source: Russia’s Federal Customs Service
10 | Russian Forest Sector Overview 2018Russia produced 1.34 million tonnes Top 5 exporters of wood pellets, 2017 Top 5 importers of wood pellets, 2017
of wood pellets in 2017, with domestic
demand being scarce. Nearly all of its Share of Share
Exports, Imports,
production is exported – sales abroad global of global
USD ‘000 USD ‘000
exports imports
surpassed production in 2017 amid sparse
imports. US 666,545 26% UK 1,237,328 43%
Canada 305,562 12% Italy 362,535 13%
Based on Russia’s Forest Sector Strategy
until 2030, domestic production of Latvia 186,531 7% Denmark 298,148 10%
wood pellets can rise to 2.7-5.1 million Austria 151,919 6% Belgium 179,638 6%
tonnes in 2030 depending on the market Russia 142,579 5% South Korea 173,121 6%
environment. Russia will continue to
Source: FAOSTAT Source: FAOSTAT
export most of its production, and its
share of the global market is projected to
increase to 5%-8%.
Russia’s production, imports and exports of wood pellets, 2012-2017
Global demand for wood pellets is
expected to rise to 41-52 million tonnes in 1,600 1,439
2030. Growth in industrial consumption 1,400
will depend on the success of initiatives to
1,200 1,073
increase the share of heat from renewable 935
1,000 879
energy sources in the global energy mix 729 744
800 1,343
(primarily in Europe, South Korea and
600 1,013
Japan) and the development of other 913 974
791 684
types of renewable energy such as wind 400
and solar. 200
1.11 1.47 1.34 2.18 2.80 4.89
0
Natural gas prices are another key factor 2012 2013 2014 2015 2016 2017
determining demand for wood pellets. Production, thousand t Exports, thousand t Imports, thousand t
Currently, there are no economic or Source: FAOSTAT, Russia’s Federal Customs Service
legislative drivers in Russia to support
significant growth in the domestic
consumption of wood pellets. Given
Russia’s low prices of natural gas and
firewood, the government should create
additional incentives to spur domestic
consumption of wood pellets, based on
the model of those adopted in Europe and
Japan.
The conversion of boiler houses to
biofuel is a promising direction for the
development of the domestic market.
Russian Forest Sector Overview 2018 | 11Pulp
Global demand for pulp rose at a CAGR Dissolving pulp is another key value- Top 5 exporters of bleached sulphate
of 1.4% from 2013 to 2017. Uruguay’s added product in the industry’s spotlight. pulp, 2017
production grew at an impressive annual However, its production in Russia is almost
Share
rate of 17.8%, outpacing other major non-existent. Exports,
of global
USD ‘000
players such as India (10.7%), Brazil exports
Thus, Russia’s share of the market of
(6.4%), China (6.2%) and France (6.0%). Brazil 5,213,361 19%
value-added, higher priced chemical pulp
Russia’s CAGR was 1.3%, the global
is small. Heavy investments are needed, Canada 4,409,138 16%
average. According to FAOSTAT, Russia
along with extensive government support, US 4,263,014 15%
ranks 10th globally in pulp production.
to modernize domestic pulp plants.
Chile 2,160,610 8%
The domestic pulp and paper industry is
Pulp production in Russia has grown Finland 1,939,876 7%
dominated by Soviet-era plants. Russia is
at a CAGR of 1.4% in the last decade.
a leading global producer of mechanical …
New pulp mills need to be built to propel
pulp – its output in the country increased Russia 933,511 3%
the industry. The most recent wave of
at a CAGR of 6.7% in 2013-17 against a
investments in the industry began in Source: FAOSTAT
2.3% drop globally.
2008-9, only to flatten out at
Bleached sulphate pulp is one of the RUB 33 billion a year since 2014. Top 5 importers of bleached sulphate
industry’s key and most promising pulp, 2017
products. Russia mainly produces
Share
unbleached sulphate pulp due to a Imports,
of global
USD ‘000
shortage of modern facilities. Russia ranks imports
second in its production globally after China 9,026,678 31%
the US.
US 2,600,580 9%
Germany 2,400,076 8%
Italy 1,964,167 7%
France 1,119,300 4%
…
Russia 105,671 0,4%
Source: FAOSTAT
12 | Russian Forest Sector Overview 2018Global consumption of pulp and paper Chemical pulp consumption in Russia and globally, 2017
products, 2017 80%
70%
14% 70% 63%
60%
50%
5%
40%
29%
30% 24%
20%
10% 7%
1% 1% 1% 4%
0%
0%
Bleached Unbleached Bleached Unbleached Dissolving
sulphate pulp sulphate pulp sulphite pulp sulphite pulp pulp
81% World Russia
Source: FAOSTAT
Chemical pulp* Semi-chemical pulp Mechanical pulp
*Excluding secondary fiber and pulp from fibers other
than wood
Source: FAOSTAT
Russia’s production, imports and exports of chemical pulp, 2008-17
6,000 5,463 5,552 5,669
5,193 5,314 5,325
5,010 4,922 5,080
5,000 4,610
4000
3,000
2,008 2,068 2,147 2,113
1,754 1,789 1,772 1,879
2,000 1,580 1,686
1,000
59 41 60 93 114 137 155 145 141 144
0
2008 2009 2010 2011 2012 2013 2014 2015 2016 2017
Production, thousand t Exports, thousand t Imports, thousand t
Source: FAOSTAT, Russia’s Federal Customs Service
Russia’s pulp industry project pipeline • A pulp mill upgrade by Segezha Group in • A pulp mill of China Paper in Amursk,
currently includes seven projects: the Yeniseysk district, Krasnoyarsk Krai Khabarovsk Krai (annual capacity:
(planned investments: USD 1.5 billion - 500,000 tonnes of sulphate pulp;
• A timber and chemical plant of
USD 3 billion) investments: USD 1.5 billion)
Siberwood LLC in the Yeniseysk district,
Krasnoyarsk Krai (annual capacity • A timber plant of Kraslesinvest JSC in • The Amazarsky pulp and paper mill in
930 million tonnes of pulp; investments: the Boguchany district, Krasnoyarsk Krai the Mogocha district, Zaibakalsky Krai
over RUB 115 billion) (annual capacity: 830,000 tonnes of (annual capacity: 230,000 tonnes of
pulp) unbleached sulphate pulp)
• A pulp mill in the Cherepovets district,
Vologda Region (annual capacity: • A pulp and paper mill of the Ilim Group
1.33 million tonnes of air float pulp; in Ust-Ilimsk, Irkutsk Region (annual
investments: EUR 2.2 billion) capacity: 130,000 tonnes of pulp;
planned investments: USD 1 billion)
Russian Forest Sector Overview 2018 | 13Household and sanitary paper
Global demand for household and sanitary Russia consumes around 3 kg of average. Russia’s annual output will reach
paper grew at a CAGR of 2.1% from 2013 household and sanitary paper per person 990,000 tonnes by 2030, estimates by
to 2017. The highest annual production annually, which is currently less than in the Ministry of Economic Development
growth was observed in Kazakhstan China. suggest.
(98.9%), followed by Morocco (97.4%) and
Kyrgyzstan (75.5%), owing largely to the Consumption levels in Russia are set to
low-base effect, compared with 8.3% in grow further, approaching the European
Russia.
Russia’s imports of household and sanitary
paper have declined since 2015 as a Per capita consumption of household and sanitary paper, 2008-17
result of a weaker Ruble and production
localization initiatives by foreign
22.1 22.1 22.0
manufacturers. This trend is in harmony 21.9 21.9 21.9 21.4 21.6 21.7 21.9
with the Russian government’s import
substitution agenda.
Toilet paper is the biggest segment, 15.3 15.6
accounting for around 75% of the total 12.8
output of household and sanitary paper. 11.9
11.0
According to a report by NeoAnalytics, 9.6
10.3
9.3 9.4
Russia’s production rose by 11% in 8.3
2017 year on year to 4,254 million rolls 6.5 6.7 6.7
5.9 5.9 6.1
of toilet paper. 4.4 4.8
5.6
4.3
3.0 3.0 3.2 3.0
The Russian market for household and 2.3 2.5 2.5
1.5 1.4 1.6
sanitary paper has been growing steadily
for a decade, with inelastic demand and
low penetration rates contributing to rising 2008 2009 2010 2011 2012 2013 2014 2015 2016 2017
production levels.
Russia China Poland US
Sources: EY analysis, FAOSTAT
14 | Russian Forest Sector Overview 2018Russia’s exports and imports of household and sanitary paper*
18.6% 33.7%
Germany’s share Kazakhstan’s share
of Russia’s imports of Russia’s exports
USD 14.2 million USD 31.6 million
Russia’s imports Russia’s exports
from Germany in 2017 to Kazakhstan in 2017
13.9% 14.0%
Poland’s share of Russia’s exports China’s share of Russia’s imports
USD 13.0 million USD 10.7 million
Russia’s exports to Poland in 2017 Russia’s imports from China in 2017
Source: Russia’s Federal Customs Service
* Including paper and other pulp products for household and sanitary use (manufactured in sheets or rolls with a width exceeding 36 cm, or rolls with a maximum width of 36 cm),
recorded in the Classifier of Goods for Foreign Economic Activity under codes 4803 and 4818
Russia’s production, imports and exports of household and sanitary paper*, 2013-17 Russia’s imports of household and
491 492 sanitary paper by product, 2017
500 445
420 11.5%
400 21.2%
333
300
200
1.7% 20.7%
100
31 6 51
30 7 6 14 5 32 6
0
2013 2014 2015 2016 2017 12.3%
Production, thousand t Imports, thousand t Exports, thousand t
Source: FAOSTAT, Russia’s Federal Customs Service
*Paper and other pulp products for household or sanitary use manufactured in sheets or rolls with a width exceeding 36 cm
32.6%
aper and other products with a width exceeding 36 cm
P
Russia’s imports and exports of household and sanitary paper* (4803)
(with a width below 36 cm), 2013-17 Toilet paper (4818)
70 Handkerchiefs and facial tissues (4818)
62 Tablecloths and napkins (4818)
60 57
Clothing and accessories (4818)
50
50 Other paper products (4818)
42
40 48
35 35
29 32 Source: Russia’s Federal Customs Service
30 26
20
10
0
2013 2014 2015 2016 2017
Imports, thousand t Exports, thousand t
Source: Russia’s Federal Customs Service
* Paper and other pulp products for household or sanitary use in sheets or rolls with a maximum width of 36 cm
Russian Forest Sector Overview 2018 | 15Packaging materials
(paper/paperboard)
Paper and paperboard packaging materials in 2017, and the year before growth Top 5 exporters of packaging materials,
comprise several products with varying topped 6%. The growth trend continued 2017
performance: for example, wrapping into 2018, with production of boxes
paper was on the decline between 2013 and cases made of corrugated paper or Share
Exports,
and 2017, while paperboard was growing of global
paperboard rising by another 5.4% in USD ‘000
exports
steadily. the first three months of the year.
US 7,503,789 16%
The fastest growing products in this E-commerce is a key driver of demand for
Germany 5,954,201 12%
market segment, both in Russia and packaging materials. According to the U.S.
globally, are listed below. Department of Commerce, online sales in Sweden 5,180,682 11%
• Containerboard. The output of 2017 soared by 16% against a 4.4% rise in Finland 3,621,243 8%
containerboard rose by 1% in 2017, total retail sales. The share of e-commerce China 3,378,533 7%
while the year earlier it increased by in total retail sales was 8.9% in 2017, up
…
over 5%. The growth was primarily from 8% the year earlier.
Russia 885,110 2%
driven by sustained demand from Over the first six months of 2017,
Source: FAOSTAT
retail chains. Russia produced around Russia’s e-commerce market grew by
459,000 tonnes of containerboard in 22%, as reported by the Association of Top 5 importers of packaging materials,
the first quarter of 2018, up 4.3% year Internet Trade Companies (AITC). Chinese 2017
on year. packaging manufacturers reap most of the
benefits from growing e-commerce sales Share
• Corrugated board. The production of Imports,
of global
corrugated board in the first quarter of in Russia, as the vast majority of goods USD ‘000
imports
2018 rose by 4% to 677 million square purchased online by Russian shoppers are
Germany 4,341,650 9%
meters, while growth for the entire year made in China (90% in 2016).
US 3,220,023 7%
of 2017 was 1.6%.
Italy 2,369,145 5%
• Folding boxes of corrugated paper or
Mexico 2,000,568 4%
paperboard. The production of folding
boxes in Russia rose by almost 5% Canada 1,923,862 4%
…
Russia 845,600 2%
Source: FAOSTAT
16 | Russian Forest Sector Overview 2018Russia’s exports and imports of packaging materials
USD 77.1 million USD 79.3 million
Russia’s exports Russia’s exports
to Belarus in 2017 to China in 2017
Exports comprised mostly Uncoated kraft paper and
cartons, boxes, cases, bags paperboard in rolls or sheets
and other paper or paperboard made up over 97% of exports
containers
USD 79.2 million USD 56.4 million
Russia’s exports to Italy in 2017 Russia’s exports to Kazakhstan in 2017
Exports comprised mostly uncoated kraft paper Exports comprised mostly cartons, boxes, cases, bags
and paperboard in rolls or sheets and other paper or paperboard containers
Source: Russia’s Federal Customs Service
Russia’s production, imports and exports of packaging materials, 2008-17
6,000 5,679 5,693
5,154
5,000 4,846 4,867
4,665
4,345
4,000 3,628
3,425
3,000 2,622
2,000 916
1,265 1,268 1,343
483 971 1,083 1,103
925 777 800
1,000
730 704 745 798 870 814 771 748 760
0
2008 2009 2010 2011 2012 2013 2014 2015 2016 2017
Production, thousand t Exports, thousand t Imports, thousand t
Source: FAOSTAT, Russia’s Federal Customs Service
Russian Forest Sector Overview 2018 | 17Particle board
Global demand for particle board Particle board exports account for around by 2030, up from the current 7 million
increased from 75 million cubic meters in 20% of Russia’s total domestic production. cubic meters to 7.5 million cubic meters.
2012 to 92 million cubic meters in 2017, Exports rose by 10% in 2017 from the Depending on the chosen growth scenario,
a CAGR of 4.2%. China and Europe are year earlier, with sales in the CIS market capacity additions will need to range
the world’s biggest consumers of particle accounting for 74% of total exports in between 0.5 and 2.1 million cubic meters
board, accounting for 25% and 40% of total 2017. Owing to ruble depreciation, exports to meet the demand in 2030.
global consumption, respectively. Between of particle board to Europe have almost
Particle board is mostly used in Russia in
2013 and 2017, demand for particle doubled since 2015. While local producers
furniture production that accounts for 70%
board in Russia was sluggish, falling an boosted their exports to China by around
of its total consumption (for thick MDF,
17,500 cubic meters on the back of a
average of 0.9% per year. this percentage is even higher). Thus, the
cheaper ruble and optimized transportation
economic health of the furniture industry
Despite the recent decline in consumption, costs, sales in that country remain relatively
may be regarded as a key driver of Russia’s
particle board remains a common small.
particle board and MDF market. The
construction material in Russia. While the
As stated in Russia’s Forest Sector Strategy domestic furniture industry grew at a CAGR
market for particle board is large, more
until 2030, domestic demand for particle of 8.7% in 2017, ranking fourth among
than one-third of production facilities are
board will grow an average of 0.7% per year 24 processing industries after automotive
over 35 years old. to reach 6.4 million cubic meters in 2030. manufacturing, pharmaceuticals and other
Russia produced 7.5 million cubic meters finished products. The year earlier, in 2016,
A total of 390,000 cubic meters of new
of particle board in 2017, and 6 million furniture production increased 5% year on
capacity should be brought on stream in the
cubic meters were consumed locally. year. It may therefore be presumed that the
Bryansk, Kemerovo and Kaluga Regions,
downward trend affecting domestic sales,
and another 0.5 million cubic meters are
which started in 2016 with a decline of over
expected to be added to existing capacity
13% in monetary terms, has ceased.
Top 5 exporters of particle board, 2017 Top 5 importers of particle board, 2017 Major importers of Russia’s particle
board, 2017
Share Share
Exports, Imports, 14%
of global of global
USD ‘000 USD ‘000
exports imports
26%
2%
Austria 703,467 13% Germany 566,770 11%
2%
Germany 538,018 10% Poland 337,261 7% 3%
France 360,447 7% US 333,457 6% 3%
Thailand 323,499 6% France 255,674 5% 6%
Canada 272,141 5% UK 248 117 5%
… … 6%
Russia 249,084 5% Russia 60,662 1% 26%
6%
Source: FAOSTAT Source: FAOSTAT
6%
Kazakhstan Kyrgyzstan
Uzbekistan China
Russia’s production, imports and exports of particle board, 2008-17
Azerbaijan Lithuania
8,000 Poland Ukraine
7,460
Tajikistan Other countries
7,000 6,634 6,723 6,591 6,573 Belarus
6,555
6,183
Source: FAOSTAT
6,000 5,751
5,429
5,000 4,562
4,000
3,000
2,000 1,016 1,703
764 784 1,544
575 562 1,257
411 377 423
231 324 430
1,000 472 248 229
253 233 254
0
2008 2009 2010 2011 2012 2013 2014 2015 2016 2017
Production, thousand m3 Exports, thousand m3 Imports, thousand m3
Source: FAOSTAT, Russia’s Federal Customs Service
18 | Russian Forest Sector Overview 2018OSB
Facts and figures about
Russia’s OSB exports
and imports
Global demand for oriented strandboard
(OSB) was 30.1 million cubic meters in
2017, with consumption rising at a CAGR
of 7.2% globally and 18.1% in Russia from
The announced capacity additions, which up 19.6% year on year. Estimates by the
2013 to 2017.
are expected to come on stream by 2023, Russian Ministry of Construction suggest
Consumption worldwide is on the rise are estimated at 1.8 million cubic meters that the trend will continue in 2018. Loan
as OSB is gradually replacing coniferous per year. subsidies for borrowers willing to buy
plywood and similar materials used prefabricated wooden houses can also
The balance between domestic supply and
in wooden buildings. The surge in give a boost to the construction market
demand for plywood and OSB depends on
OSB consumption is also attributed (interest rates are to be temporarily cut
both the economic situation in the country
to an expansion in wooden housing from 15% to 10%).
and macroeconomic fundamentals that
development as well as other construction
affect the construction sector, the main
and renovation activities. The US, Europe Major importers of Russia’s OSB,
consumer of plywood and OSB. According
and Canada are the world’s biggest OSB thousand m3
to Rosstat, new housing development
consumers, and they account for 58%,
in 2017 dropped 2.1% year on year, but Kazakhstan 41
20% and 8% of total global demand,
around 15.7 million square meters of
respectively. Ukraine 6
residential floor space were constructed
Due to the vibrant growth of local in Russia in the first quarter of 2018, UK 4
production, Russia’s OSB imports Source: Russia’s Federal Customs Service
(in monetary terms) declined for four
straight years until 2017, when a Top 5 exporters of OSB, 2017 Top 5 importers of OSB, 2017
moderate increase was observed. OSB
imports will continue to shrink as new Share Share
Exports, Imports,
capacity becomes available. of global of global
USD ‘000 USD ‘000
exports imports
Most of the OSB products manufactured
Canada 1,537,886 Share US 1,451,866 51%
in Russia are sold at the local market and
Romania 198,618 7% Germany 185,779 7%
are intended to meet domestic demand.
Starting in 2016, Russia discontinued OSB Belarus 144,992 5% UK 94,694 3%
imports from Canada and the US, with Latvia 133,126 5% Russia 83,651 3%
North American products now being fully
Germany 127,733 5% Belgium 68,673 2%
substituted by supplies from Russia and
…. Source: FAOSTAT
Belarus. The last batch from Canada was
delivered in December 2015, and around Russia 25,018 1%
80% of Russia’s OSB imports now come Source: FAOSTAT
from Belarus.
Russia’s production, imports and exports of OSB, 2008-17
Some of Russia’s OSB is supplied to
consumers in the Former Soviet Union
and European countries. 1,200
1,013
The domestic consumption of OSB 1000
reached that of plywood for the first time 800
797
710
ever in 2017. In the low-rise housing 571 618
547
segment, OSB is gradually replacing 600
390
low-grade plywood for uses such as roofs, 400 360
372 367 393
297 298
fencing, walls, ceilings and temporary 197
101
buildings. 200 30
9 68
114
64 37 40
20 15
0
2008 2009 2010 2011 2012 2013 2014 2015 2016 2017
Production, thousand m3 Exports, thousand m3 Imports, thousand m3
Source: FAOSTAT, Russia’s Federal Customs Service
Russian Forest Sector Overview 2018 | 19MDF/HDF
Facts and figures about MDF has a bright future on the Russian
market because of its superior properties
Top 5 exporters of MDF/HDF, 2017
Russia’s MDF/HDF that make it a good alternative to other Exports,
Share
of global
boards used in construction and furniture- USD ‘000
exports and imports making. As stated in Russia’s Forest Sector
exports
China 1,092,648 17%
Strategy until 2030, domestic demand
Global demand for MDF/HDF rose at a Belgium 602,475 9%
for MDF is expected to grow at an average
CAGR of 3.8% from 2013 to 2017. The
of 4% per year to reach 3.8 million cubic Germany 527,302 8%
key factors contributing to the rise were
meters by 2030. Thailand 389,611 6%
the growing popularity of laminate flooring
and the partial replacement of plywood Russia has expanded its MDF production Austria 317,337 5%
and particle board as inputs to furniture capacity by some 1.6 million cubic meters …
production. The highest compound annual since 2014, with another 0.6 million to be
Russia 251,405 4%
growth rates of MDF/HDF production from added by the end of 2018
Source: FAOSTAT
2013 to 2017 were observed in Columbia
The Strategy calls for further expansion
(40.9%), Russia (17.7%), Iran (16.9%) and
by bringing 2.3 million cubic meters of
Indonesia (16.9%). Demand in Kazakhstan, Top 5 importers of MDF/HDF, 2017
MDF/HDF capacity on stream in seven
Uzbekistan, Belarus and Turkey, which
of Russia’s constituent entities: the
have long been traditional export markets Share
Smolensk, Leningrad, Tomsk, Kaluga and Imports,
of global
for Russia, grew at a CAGR of 6.4% in the USD ‘000
Kaliningrad Regions, Khabarovsk Krai and imports
last five years.
the Republic of Tatarstan. US 1,072,221 16%
Russia produced 2.97 million cubic meters
Iran 399,735 6%
of MDF/HDF in 2017. With less than
0.26 million cubic meters brought into UK 331,060 5%
the country in 2017, imports make up a Canada 328,015 5%
modest share of domestic consumption. Japan 238,533 3%
Exports, by contrast, are on the rise:
…
around 0.9 million cubic meters were
exported in 2017, up by nearly 50% Russia 131,749 2%
compared with 2015. Source: FAOSTAT
20 | Russian Forest Sector Overview 2018Russia’s exports and imports of MDF/HDF
10.4% 18%
Romania’s share Kazakhstan’s share of Russia’s
of Russia’s exports exports
USD 28.2 million USD 49.8 million
Russia’s exports Russia’s exports
to Romania in 2017 to Kazakhstan in 2017
24.4% 22% 24.2%
Belarus’s share of Russia’s imports Uzbekistan’s share of Russia’s exports China’s share of Russia’s imports
Belarus is one of the key suppliers Uzbekistan is the top export China is the second-largest importer
destination
USD 49.8 million USD 58.5 million USD 49.3 million
Russia’s imports from Belarus Russia’s imports from China
in 2017 Russia’s exports to Uzbekistan in 2017
in 2017
Source: Russia’s Federal Customs Service
Russia’s production, imports and exports of MDF/HDF, 2008-17
3,500
2,970
3,000
2,595
2,500
2,230
2,000 1,885
1,500 1,316
1,171 1,197
1,078 1110
1,003 903
1,000 702 689 628 618
344 548
193 193 435
500 100 292 264
171 177 184 246 255
75
336
0
2008 2009 2010 2011 2012 2013 2014 2015 2016 2017
Production, thousand m3 Exports, thousand m3 Imports, thousand m3
Source: FAOSTAT, Russia’s Federal Customs Service
In the conservative scenario for the forest An additional 0.8 million cubic meters of
sector, the planned capacity of 4.9 million capacity may be required to meet demand
cubic meters is expected to be sufficient to under the optimistic scenario.
satisfy demand in 2030.
Russian Forest Sector Overview 2018 | 21Plywood
Facts and figures furniture sectors that are currently on
the rise due to brisk demand for housing,
Top 5 exporters of plywood, 2017
about Russia’s plywood fueled by population gains and rising per Exports,
Share
of global
capita income. USD ‘000
exports and imports exports
According to Russia’s Forest Sector
(in monetary terms) Strategy until 2030, demand for plywood
China
Indonesia
5,266,509
2,243,465
34%
14%
worldwide is set to grow at a CAGR of
Given the abundance of birch trees in local Russia 1,103,323 7%
4.3% to reach 291 million cubic meters
forests, birch plywood accounts for 95% by 2030. China, a key plywood market, Malaysia 1,052,774 7%
of Russia’s plywood production (62 out of has traditionally focused on coniferous Finland 637,305 4%
63 domestic mills produce birch plywood), rather than birch plywood. With less than Source: FAOSTAT
compared with 3%-4% globally. 1% of total consumption, demand for birch
Russia’s plywood production declined plywood will lag behind that for plywood
in 2017 for the first time since 2009 — in general and may rise by 2 million cubic
down 2.2% year on year — amid supply meters by 2030, owing largely to Russia
constraints caused by timber exports. and Europe. Top 5 importers of plywood, 2017
Strong demand for veneer logs in China
put more strain on an already tight supply. Share
Imports,
of global
Russia’s exports of birch veneer logs to USD ‘000
imports
China soared by 23% year on year
US 2,916,762 20%
to 1.6 million cubic meters in 2017.
Japan 1,477,245 10%
Alongside buoyant demand from the
Germany 866,804 6%
automotive industry, the consumption of
plywood is driven by the construction and South Korea 754,432 5%
UK 672,701 5%
…
Russia 37,027 0,3%
Source: FAOSTAT
22 | Russian Forest Sector Overview 2018Russia’s exports and imports of plywood
10.6% 12%
US’s share Germany’s share
of Russia’s exports of Russia’s exports
USD 8.8 million USD 9.5 million
Russia’s exports Russia’s exports
to the US in 2017 to Germany in 2017
15% 90%
Egypt’s share of Russia’s exports China’s share of Russia’s imports
Egypt is the main importer of Russian plywood China is the main exporter of plywood to Russia
USD 12.6 million USD 2 million
Russia’s exports to Egypt in 2017 Russia’s imports from China in 2017
Source: Russia’s Federal Customs Service
Russia’s production, imports and exports of plywood, 2008-17
3,500 3,759 3,729
3,540 3,607
3,000 3,303
3,150
3,040
2,500 2,689
2,458 2,470
2,592
2206
2,000 2,107 1,969
1,717 1,758
1,600
1,500 1,512
1,326 1,334
1,000
500 252 244 222
115 53 35 43 75 58 67
0
2008 2009 2010 2011 2012 2013 2014 2015 2016 2017
Production, thousand m3 Exports, thousand m3 Imports, thousand m3
Source: FAOSTAT, Russia’s Federal Customs Service
Russian Forest Sector Overview 2018 | 23Forest sector innovations
Innovative What innovative technologies are set to have the greatest impact
on forest industries?
technologies
Smart factory technology across the entire
65%
production chain
Digital technologies have become an
integral part of the business practices of UAVs to monitor forest health and prevent wildfires and
illegal logging
53%
companies in forest industries. Developers
of advanced woodworking equipment, Combining and processing multiple data flows within the
53%
which often has IoT functionality and can timber value chain
be easily integrated into smart factory
UAVs to take inventory of forests 29%
operations, share their latest solutions
at various international technology Digital authentication technology (aka digital passports)
29%
to combat illegal logging and illicit timber trade
exhibitions.
Real-time data on location, operating conditions, fuel
Introduced to the North American market consumption, potential malfunctions, etc.
29%
in 2017, a novel cloud-based platform
gives operators real-time dynamic access Blockchain to ensure production and
18%
commercial transparency
to data at each stage of production and
end-to-end control over the production Online market places and Internet platforms
18%
process from a smartphone. linking industry players and customers
Companies around the world develop
Source: EY and ASPPI Survey
machine-monitoring systems to collect
statistics, optimize workload and predict
changes in equipment performance.
• The KEDR forest monitoring system and • High-rise wooden buildings are
Forecasts by equipment manufacturers
a mobile application that helps forest already a global trend, with Norway
suggest that software costs will account
rangers detect illegal logging from being the trendsetter. Examples
for about half of equipment value by
satellite imagery are already in use in include an 18-story wooden high-rise,
2025.
Khabarovsk Krai. Plans for 2018 include approximately a 90-minute drive from
The augmented reality (AR) technology is the introduction of unmanned airplanes Oslo, that is scheduled for completion in
gaining ground in forest management and and helicopters with a range of hundreds December 2018, as well as a 51-meter-
the logging industry. It enables companies of kilometers. high 14-story apartment block in central
to create digital twins — real-world 3D Bergen that was commissioned in 2015.
• The Kirov Region launched a free mobile
models of cutting areas — to keep track
application in 2017 that allows users Many industry players agree that digital
of logging activities, obtain information
to locate a wildfire on an interactive transformation is critical to success.
about the current forest cover, monitor
map. The system has already helped to
growth and predict yields for the next 10 The pace of technology adoption is,
prevent several wildfires.
to 20 years. however, one of the biggest challenges
Wooden housing is becoming increasingly facing Russian companies, as their
Most respondents also marked
popular worldwide. Manufacturers are employees lack required skills and
remote forest monitoring involving
moving fast to bring to the market quality are not ready to benefit from existing
unmanned aerial vehicles (UAVs) and
wood-based materials as well as advanced technologies. Another impediment to
interactive maps among other promising
technologies designed to speed up the technology uptake is the lack of access
technologies.
construction process and make structures to high-speed Internet and mobile
more robust. communication, with production sites
being often located in remote areas.
• Owing to its production automation
center, a Japanese log-home
manufacturer is currently turning out a
house a day.
24 | Russian Forest Sector Overview 2018Innovative products • Biodegradable polymers are seen as a
competitive alternative to traditional
Much like their foreign peers, major
Russian manufacturers focus on
plastics. An example is lactic acid developing innovative wood products.
Global timber manufacturers and specialist
that is produced from hemicellulose
R&D institutes are extensively working on In the last two decades, biotechnology
extracts and is used as a monomer for
new materials, with the fastest-growing has found industrial applications in many
the production of biodegradable plastic
areas of research being innovative fields, including pulp production and
polylactide.
packaging and construction materials, processing, wood biotreatment and others.
biodegradable polymers and biofuels. • Innovative biofuels (butanol, bio-oil, Genetic engineering — in combination
syngas, biofuels from lignocellulosic with conventional breeding — provides
• Innovative packaging materials have
biomass, torrefied pellets, etc.) are opportunities for accelerating tree growth
improved physical and mechanical
more efficient than conventional and improving wood quality.
properties along with improved
biofuels, as they produce more energy
breathability and water resistance. They The cultivation of fast-growing trees with
with less carbon dioxide and are less
are made of natural ingredients and can reduced or modified lignin content is of
likely to catch fire during transportation
serve as a substitute for paperboard immense practical value for the forest
or storage.
and plastics. Materials with good barrier sector.
properties against fat, oxygen and odor Much attention has been paid recently
We believe that innovative materials have
are used for food packaging. to the concept of biorefining, where raw
great potential in forest industries owing
biomass is separated into fractions that
• Innovative materials, such as nanowood, to their eco-friendliness and consumer
are used to produce a wide range of
mineral hybrid fiber and hemicellulose- properties, and those players who are first
marketable products. Biorefineries can be
and lignosulphonate-based materials, to bring them to the market will gain a
integrated into pulp and paper mills or oil
are widely used in the construction significant competitive advantage.
refineries, with biomass transformation
sector. Along with improved fire
to be embedded in the processing value
resistance, they have a higher specific
chain.
strength than metals, ceramics, e-glass
fibers and many alloys, and can also • Hemicellulose oligomers, xylo-
be resistant to radiation and have oligosaccharides, phytosterols and
disinfecting properties. other products of the thermochemical
and biochemical conversion of wood
Separate mention should be made of
are widely used in the production of
materials that have the ability to restore
food supplements for medical and
their shape after deformation: molecules
pharmaceutical applications (prebiotics,
“remember” their original positions and
steroids, cancer-fighting drugs, etc.).
can quickly reassemble themselves.
Which of the following innovative wood products (their emergence
or proliferation) do you think will have the greatest impact on the market
in the next three to five years?
Innovative packaging materials 72%
Innovative construction materials 44%
Biodegradable polymers (as a substitute for plastics) 44%
Biodiesel 28%
Food supplements 11%
Other 11%
Source: EY and ASPPI Survey
Russian Forest Sector Overview 2018 | 25Investments
EY jointly with ASPPI conducted a survey
of industry participants in 2018 to identify Key investment areas
key aspects of the Russian forest sector
that make it attractive to investors.
Replacement of worn-out 76%
Despite the downside impact of country- equipment 76%
specific factors on investment appeal (see
Russia’s Forest Sector Strategy until 2030, Productivity enhancement
http://government.ru/docs/34064/), 71%
and cost management at existing
65%
industry companies are generally facilities
optimistic.
Efficiency improvements
Major market players pointed out key 71%
at existing facilities and cost
71%
areas for operational development and reduction
business process optimization, which
are essential to improve the investment Access to new 59%
climate in the sector. With strong markets 71%
government support designed to boost
investments in the forest sector, there is
Capacity and resource base
every reason to expect its rapid growth. 53%
build-up, increase in timber
65%
harvesting and processing
Below we present survey findings that
outline the current situation and market
Shift to higher-margin products
participants’ expectations. with a greater degree of
29%
processing 35%
Key investment Debt reduction and financial 24%
flexibility 35%
areas
Companies will continue to focus on Resource base expansion 18%
replacing worn-out equipment and through more forest land leases 47%
enhancing the efficiency of their existing
facilities in 2018.
Business acquisitions 12%
Companies intend to place greater in the forest sector 12%
emphasis on new markets compared
2017 2018
with 2017, as well as on building up their
capacity and resource base, and increasing
Source: EY and ASPPI Survey
timber harvesting and processing.
Some 47% of respondents are looking to
expand their resource base through more
forestland leases. How will your investment amount change in 2018 compared with 2017?
Most respondents (63%) expect their
investments to increase in 2018 compared 31%
with 2017, according to EY’s survey, with
25% 25%
around 13% of them planning more than
70% growth in investments year on year.
13%
6%
0%
-70% -40 -10% 10% 40% 70% Growth
rate
DECREASE NO CHANGE INCREASE
Source: EY and ASPPI Survey
26 | Russian Forest Sector Overview 2018The vast majority of forest sector
companies believe that the sector’s Cost reduction targets
attractiveness to investors has not
changed in the last five years.
Electricity 50%
Companies continue to expand their
businesses and reduce costs, with positive
Other energy sources 19%
effects on the sector’s investment appeal.
Despite the fact that more respondents
are planning to boost investments to build Spare parts and materials 50%
up capacity, increase their resource base
and enter new markets, we still believe
that lower costs and higher margins will be Debt capital 25%
the main drivers of the sector’s investment
appeal. Repair of fixed assets 19%
Some 30% of respondents expect their
EBITDA margin to grow by 3% to 5%, and Labor costs, including payroll 19%
almost 20% expect 5% or more growth and social charges
in their EBITDA margin in 2018. Growth
is likely to come from lower costs of Change in transportation 19%
energy and materials, as well as from debt
reduction, including debt under loans,
Diesel fuel, gas 6%
leases and factoring.
Other 13%
Source: EY and ASPPI Survey
How has the sector’s investment appeal How will your EBITDA margin change in 2018?
changed over the last five years?
Increase by 5%+ 18%
Improved 17%
Increase by 3% to 5% 29%
Declined 11%
No change 53%
No change 72%
Decrease by 3%+ 0%
Source: EY and ASPPI Survey
Source: EY and ASPPI Survey
Russian Forest Sector Overview 2018 | 27Information about the operating EBITDA margin of listed international companies
performance of Russian companies is hard 72%
69%
to come by. Information that is publicly
available – about the Ilim Group and the
Segezha Group – suggests that in terms of
50%
profitability Russian producers are on par
46%
with their international peers. 43%
37% 37%
The Russian government strongly 33%
supports investments in the industry. The
government has put together a program 21%
19% 20%
17%
of priority projects (see page 30), which 14%
currently includes 148 projects with total 15% 16% 15% 16%
designated investments of around RUB 4%
530 billion. 3% 4% 4% 4% 4%
So far, 53 projects, with investments 2013 2014 2015 2016 2017
totaling RUB 129 billion, have been Min Median Max Ilim Group Segezha Group
implemented according to the Russian
Sources: Capital IQ, companies’ FS
Ministry of Industry and Trade. The bulk
of the funds went to pulp and paper
production and timber processing,
according to 2017 data.
Implemented projects as a percentage of total priority
investment projects in the forest sector
Investments across industries, 2017
Pulp and paper
45%
53 projects production
have been Timber processing 34%
implemented, 24% Wood-based panels
15%
production
76% totaling
Other 6%
RUB 129 billion
Source: Russia’s Forest Sector Strategy until 2030
Implemented In progress
Source: Ministry of Industry and Trade
Top 5 priority investment projects by amount invested
Amount
Investor Region Project invested, RUB Status
million
Construction of a timber and chemical complex in the
Siberwood LLC Krasnoyarsk Krai 101,011 In progress
Yeniseysk district of Krasnoyarsk Krai
Upgrading of the Ilim Group’s manufacturing facilities in the
Ilim Group OJSC Irkutsk Region 53,200 In progress
Irkutsk Region
Establishing a timber processing facility of TsPK Polyarnaya in
TsPK Polyarnaya LLC Zabaikalsky Krai 28,010 In progress
the northeast of Zabaikalsky Krai
Kraslesinvest LLC Krasnoyarsk Krai Boguchany. A timber processing facility and a sawmill 27,222 In progress
Kronoshpan Kaluga LLC Kaluga Region Wood-based panels production facility 22,463 In progress
Total 231,906
Source: Ministry of Industry and Trade
28 | Russian Forest Sector Overview 2018You can also read