Te Awa Lakes Assessment of Economic Effects - Prepared for Perry Group Limited 12 October 2017 - Hamilton City Council
←
→
Page content transcription
If your browser does not render page correctly, please read the page content below
Te Awa Lakes
Assessment of Economic Effects
                Prepared for Perry Group Limited

                               12 October 2017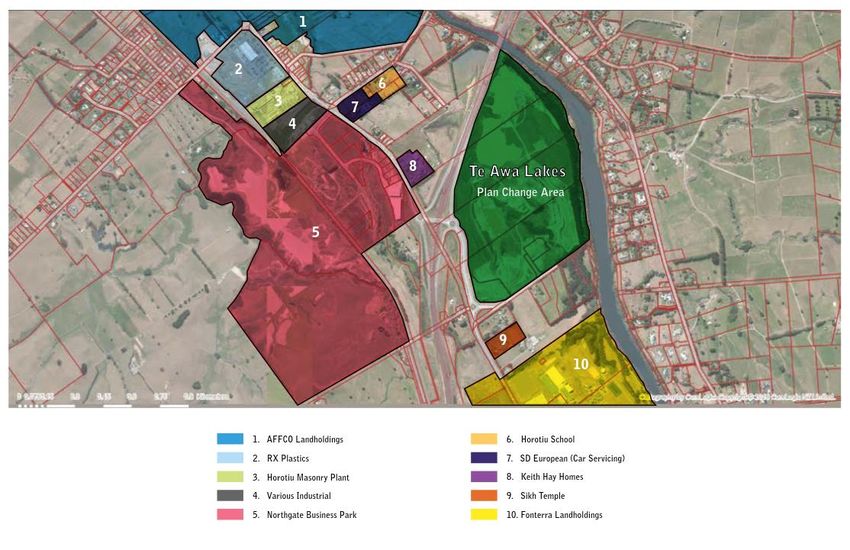
Document Quality Assurance
 Bibliographic reference for citation:
 RCG Limited 2017. Te Awa Lakes: Assessment of Economic Effects. Report prepared by RCG Limited for
 Perry Group Limited.

 Prepared by:                                  John Polkinghorne
                                               Associate Director
                                               RCG Limited

 Status: Final                                 Revision / version: 7                             Issue date: 12 October 2017

 Use and Reliance

 Every effort has been made to ensure the soundness and accuracy of the opinions, information, and forecasts expressed in this
 report.

 Information, opinions and forecasts contained in this report should be regarded solely as a general guide. While we believe
 statements in the report are correct, no liability is accepted for any incorrect statement, information or forecast. RCG disclaims
 any liability that may arise from any person acting on the material within.

 RCG Limited is the author of this report, and therefore holds all copyright and intellectual property rights relating to it. RCG
 requires that all parties permitted to use the report and the research contained within the report give full and correct
 acknowledgement of its authorship.

Template revision: 20170704 0000

File ref: Te Awa Lakes 07 07 2017.docx

Cover photograph: © Boffa Miskell Limited, 2017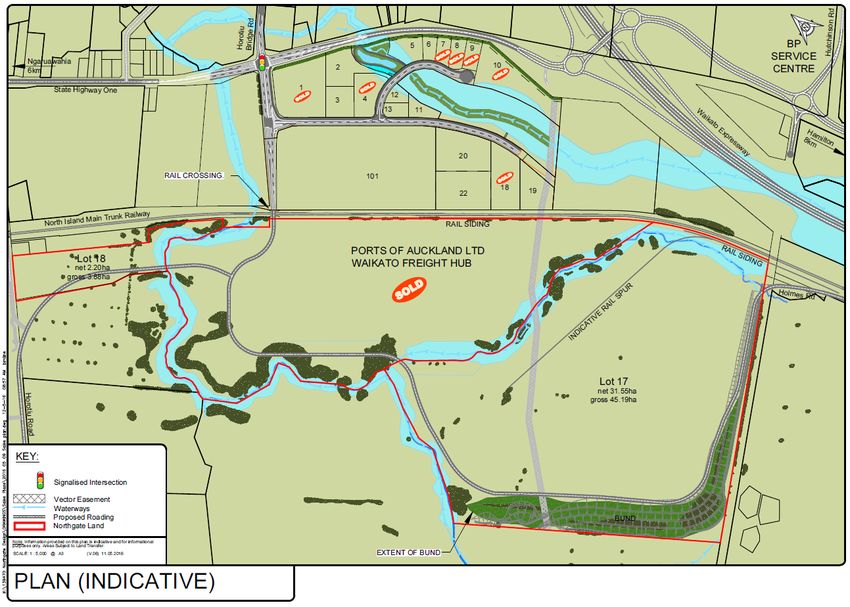
CONTENTS
1.0   Introduction                                               1

      Te Awa Lakes                                               1
      The Purpose of This Report                                 2
      Abbreviations                                              2

2.0   Nearby Land Uses                                           3

      Overview of Te Rapa North, Horotiu and Surrounding Areas   3
      Key Land Uses                                              3

3.0   Industrial Land Availability                               8

      Before Future Proof (The Mid-2000s)                        8
      After Future Proof (2009 Onwards)                          9
      Industrial Land Uptake                                     9
      The UNISA Program                                          11
      Property Market Research                                   12
      The Current Market (2017)                                  14

4.0   Industrial Consents Data                                   15

5.0   Housing Supply and Demand                                  17

      National Population Growth                                 17
      Local Population Growth                                    18
      Declining Household Sizes                                  19
      Stats NZ Projections                                       19
      NIDEA Projections                                          21
      Housing Demand and Supply                                  21
      House Prices and Affordability                             22

6.0   Tourism in the Waikato                                     24

      Tourism and the New Zealand Economy                        24
      Forecasting Tourism Spending                               24
      The Commercial Accommodation Monitor                       25
      The Waikato RTO                                            25
      Overall Guest Night Trends                                 26
      Occupancy Rates                                            27
      Regional Tourism Estimates                                 28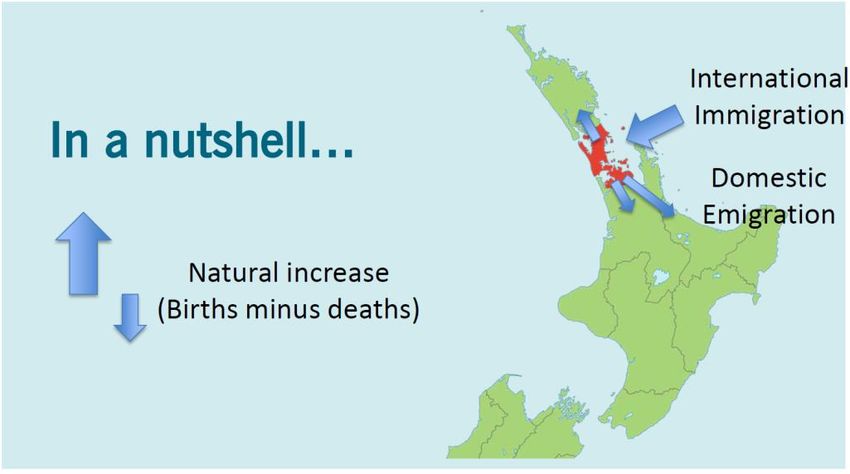
Hamilton Hotel Demand Assessment         30
       Hotel Demand in Other Cities             31
       Cycle Tourism                            32
       Summary                                  32

7.0    Te Awa Lakes Tourism Effects             35

       Tourism Benchmarks and Visitor Numbers   35
       The Adventure Park at Te Awa Lakes       35
       Accommodation at Te Awa Lakes            36
       Te Awa Lakes Tourism Effects             36
       The Hamilton CBD                         37
       Summary                                  38

8.0    Retail Demand                            40

       Retail Demand from Households            40
       Floor Space Demand                       41
       Retail Demand from Visitors              42
       Retail Demand from Other Shoppers        43
       Centre Assessment Reports                43
       Conclusions                              44

9.0    Response to Peer Review                  46

       Industrial                               46
       Residential                              48
       Tourism                                  49
       Retail 51

10.0   Conclusions                              52

       The Industrial Market                    52
       The Adventure Park and Accommodation     52
       Retail at Te Awa Lakes                   53
       Housing at Te Awa Lakes                  53
       Overall Conclusions                      54
Figures
Figure 1-1: Te Awa Lakes Context. Source: RCG ......................................................... 1
Figure 2-1: Northgate Business Park Concept Plan. Source:
www.northgatepark.co.nz/Documents/Northgate-Overall-
Concept-Plan-June-2016.pdf ................................................................... 5
Figure 2-2: Adjacent Landuses .................................................................................... 7
Figure 3-1: Hamilton Industrial Land Sales & Prices. Source: CBRE via
Strategic Risk Analysis Ltd ..................................................................... 10
Figure 4-1: New Industrial Floor Space Consented (New Zealand-wide).
Source: Stats NZ building consent data for new “factories,
industrial, and storage buildings” ......................................................... 15
Figure 4-2: New Industrial Floor Space Consented (Waikato Sub-Region).
Source: Stats NZ building consent data for new “factories,
industrial, and storage buildings” ......................................................... 16
Figure 5-1: NZ Population Growth 1992-2016. Source: RCG, Stats NZ ..................... 17
Figure 5-2: Auckland Population Flows. Source: RCG ............................................... 18
Figure 5-3: Stats NZ Population Estimates and Projections for Hamilton.
Source: RCG, Stats NZ ............................................................................ 20
Figure 5-4: Homes Consented in the Future Proof Area. Source: RCG, Stats NZ ...... 22
Figure 6-1: Waikato RTO Accommodation for the Year Ended March 2017.
Source: Commercial Accommodation Monitor ..................................... 26
Figure 6-2: Moving Annual Total (MAT) Guest Nights in Hamilton City.
Source: Commercial Accommodation Monitor ..................................... 26
Figure 6-3: Domestic and International Guest Nights in the Waikato RTO.
Source: Commercial Accommodation Monitor ..................................... 27
Figure 6-4: Domestic Visitor Spending in the Waikato RTO. Source: MBIE,
RCG ........................................................................................................ 29
Figure 6-5: International Visitor Spending in the Waikato RTO. Source: MBIE,
RCG ........................................................................................................ 29
Figure 6-6: Visitor Spending in the Waikato RTO ($m, Year Ended Mar 2017).
Source: MBIE, RCG................................................................................. 30
Figure 8-1: Retail Spending from Te Awa Lakes Households. Source: RCG .............. 40Figure 8-2: Floor Space Demand from Te Awa Lakes households (in m2).
Source: RCG ........................................................................................... 41
Figure 8-3: ‘Small Format’ Floor Space Demand from Te Awa Lakes
households (in m2). Source: RCG .......................................................... 411.0 Introduction
Te Awa Lakes
1.1 Te Awa Lakes is a proposed mixed-use development in Hamilton City, 11 km from central
Hamilton travelling along Te Rapa Road.
1.2 Figure 1.1 below shows Te Awa Lakes outlined in red, with the Waikato Expressway along its
western boundary. Note that the areas west of the Expressway are in the Waikato District, and
are not part of the current plan change:
Figure 1-1: Te Awa Lakes Context. Source: RCG
1.3 At present, the 62-hectare plan change area has Te Rapa North Industrial zoning. This zoning
allows 7 hectares to be developed for industrial purposes prior to 2021, with another 23
hectares available after 2021. The remaining 30 hectares would not be developable until
rezoned. This would only happen when infrastructure was in place, and only if there was no
threat of oversupplying land. Industrial demand and supply issues are considered at the city,
sub-region and regional level, as outlined later in this report.
1.4 The Te Awa Lakes site has been used for sand quarrying, but these operations are in the
process of being disestablished.
1
RCG | Te Awa Lakes | Assessment of Economic Effects | 4 July 20171.5 Perry Group, the landowner and developer of Te Awa Lakes, is now working towards a mixed-
use development for the site, via a private plan change process. Proposed uses include an
“Adventure Park”, along with related tourism and accommodation uses, and residential
housing.
1.6 An initial stage of development opened in 2016, and included a retail ‘service centre’ with BP
and several retail tenancies, and a community bike park. These uses were approved via an
Indicative Development Plan process, which enabled 7.63 hectares of development (only
partially completed).
The Purpose of This Report
1.7 RCG has been engaged by Perry Group to assess the economic effects of the plan change.
1.8 Our report is necessarily quite wide in scope. We have had to consider the proposed uses for
the site (tourism, commercial, and residential), as well as the uses allowed under the existing
zoning (industrial, albeit with large-scale development deferred). This wide variety of uses must
also be considered within the planning framework, including the Regional Policy Statement,
Future Proof and Partly Operative District Plan.
1.9 Other relevant documents include the National Policy Statement on Urban Development
Capacity and the Hamilton Housing Accord.
1.10 Our report works through the following steps:
• Analysis of various industrial indicators in the Future Proof area to gauge demand and
supply;
• Analysis of residential demand and supply in the Future Proof area;
• Information on the local and national tourism industry, and the potential for tourism-
related uses at Te Awa Lakes, and flow-on benefits as a result;
• Retail demand modelling and comments on Centres Assessment Report matters;
• Conclusions on the overall economic effects of the proposed plan change.
Abbreviations
1.11 Our report uses the following abbreviations:
• GDP – Gross Domestic Product
• LFR – Large Format Retail
• NIDEA – National Institute of Demographic and Economic Analysis
• RTO – Regional Tourism Organisation
• Stats NZ – Statistics New Zealand
• SRA – Strategic Risk Analysis Ltd
• UNISA – Upper North Island Strategic Alliance
2
RCG | Te Awa Lakes | Assessment of Economic Effects | 4 July 20172.0 Nearby Land Uses
2.1 Te Rapa North was transferred from the Waikato District to Hamilton City in 2011. It is defined
as the area “bounded by Horotiu in the north, the Waikato River to the east, the… [Waikato
Expressway] in the west, and Ruffell Road to the south”.1 The same definition is used in the
Waikato Regional Policy Statement.
2.2 Horotiu is part of the Waikato District, and consists of those areas west of the Waikato
Expressway.
2.3 Te Rapa North and Horotiu are adjacent to one another, separated only by the Waikato
Expressway. Effectively, they operate as a single node from an industrial location perspective.
Overview of Te Rapa North, Horotiu and Surrounding Areas
2.4 Both Te Rapa North and Horotiu contain a mix of rural uses, country living uses (lifestyle blocks
etc) and industrial uses. Many of these uses have been there for many decades, predating
Hamilton’s northwards expansion in places like Rototuna, Flagstaff and Rotokauri.
2.5 The village of Horotiu is home to several hundred people. The larger town of Ngaruawahia
(with more than 5,000 people) is just 5 km further north.
2.6 To the south of Te Rapa North, the Pukete Farm Park is a major recreational land use along
both sides of Pukete Rd, covering some 90 hectares. The Te Rapa area, centred around Te Rapa
Rd, is a mixed industrial/ retail hub. Most of the retail uses are contained in The Base shopping
centre, and along Te Rapa Rd itself.
2.7 Rotokauri is a major growth node for Hamilton, with a range of uses being provided for as laid
out in the Structure Plan. These include industrial uses between the railway line and the
Waikato Expressway, other ‘employment’ uses west of the Expressway, and residential uses
beyond that.
Key Land Uses
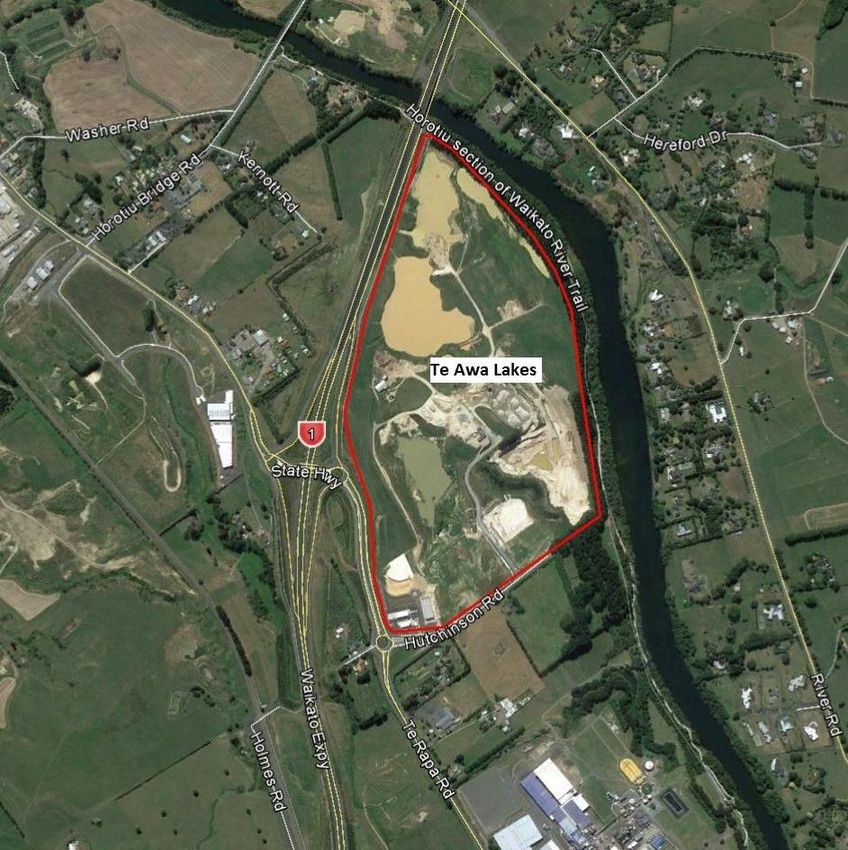
2.8 The marked-up aerial photo attached at the end of this chapter shows the key non-rural land
uses in Te Rapa North and Horotiu. The ‘key land uses’ described below are numbered as 1-10
on this aerial photo.
AFFCO Landholdings (map reference 1)
2.9 The AFFCO Horotiu meat processing and rendering plant has been on the site since 1915.2 It is
AFFCO’s largest capacity beef plant. This operation “is one of the biggest employers in the
Waikato, paying around $22 million per year in wages and salaries”, “employs approximately
1 http://www.hamilton.govt.nz/our-council/news/Pages/default.aspx?newsItem=1679
2 http://www.affco.co.nz/locations/processing/
3
RCG | Te Awa Lakes | Assessment of Economic Effects | 4 July 2017500 staff at peak”, and “makes a direct annual contribution of around $110 million to the
Waikato regional economy”.3
2.10 AFFCO owns approximately 70 hectares of land in Horotiu, including areas of undeveloped land
around the plant. We are unsure as to AFFCO’s future plans for this land, and the nature of
AFFCO’s operations may preclude neighbouring development. However, some of the land may
become available for development in the future.
2.11 We note that a dairy processing plant has been consented on part of the AFFCO land, by Open
Country Dairy Ltd.
RX Plastics (map reference 2)
2.12 This is a 9.1 hectare site, approximately half of which has been built on for RX Plastics (including
a building, and storage/ display areas). The other half appears to be undeveloped.
Horotiu Masonry Plant (map reference 3)
2.13 This plant is owned by AML Ltd, a joint venture between Holcim and Allied Concrete.
Various Industrial (map reference 4)
2.14 This site is occupied by Kiwi Timber Supplies, Machinery and Marine, and PotBlack (a pool table
factory and shop).
Northgate Business Park (map reference 5)
2.15 Northgate Business Park is a major industrial park development, with stage one already
subdivided. The total area available for development will be around 100 hectares.
2.16 Waikato Milking Systems was an early tenant for the park, with buildings completed in 2013
and 2014. Several other sites in stage one have been sold, to Universal Precast, Speedwall Ltd
and Waikato Chocolates.4
2.17 Ports of Auckland have purchased 33 hectares of land for a freight hub, and began construction
in late 2016. The port will develop its operations here gradually, and we understand that Ports
of Auckland sees this as a ten year project.5
2.18 The first stage of the freight hub will provide earthworks, services and a road connection, along
with “a small 1-2 ha container pavement… [which will be] the starting point to open the freight
hub… this stage is planned to be complete by late 2017/ early 2018”. 6 Beyond this timeframe,
future stages will “happen organically with construction of further areas of pavement and
warehousing to keep up with demand”.
3“AFFCO NZ Limited Horotiu Processing Plant: Application for Resource Consents Assessment of Environmental Effects”, June
2015. Retrieved from https://www.waikatoregion.govt.nz/assets/PageFiles/39263/Appln%20and%20AEE.pdf
4 http://openwaikato.co.nz/invest/Detail/4043/waikato-welcomes-ports-of-auckland
5 Personal communication from John Olliver of Bloxam Burnett & Olliver
6 “Waikato Freight Hub” pamphlet, Ports of Auckland
4
RCG | Te Awa Lakes | Assessment of Economic Effects | 4 July 20172.19 As such, although Ports of Auckland has purchased a large area of land to safeguard its future
expansion, ‘uptake’ of the land will happen progressively rather than all at once.
Figure Error! No text of specified style in document.-2: Northgate Business Park Concept Plan. Source:
www.northgatepark.co.nz/Documents/Northgate-Overall-Concept-Plan-June-2016.pdf
Horotiu School (map reference 6)
2.20 Horotiu School is a primary school with some 240 students.
SD European (map reference 7)
2.21 This site is partially occupied by SD European, a vehicle servicing company. The landowner also
owns two neighbouring houses and undeveloped land on the corner of Horotiu Bridge Rd and
Great South Rd.
Keith Hay Homes (map reference 8)
2.22 This site consists of showhomes for Keith Hay Homes.
Sikh Temple (map reference 9)
2.23 This is a temple used by the Sikh community in the Waikato.
5
RCG | Te Awa Lakes | Assessment of Economic Effects | 4 July 2017Fonterra Landholdings (map reference 10)
2.24 Fonterra’s Te Rapa manufacturing site was established in 1967 and has 500 employees.7
2.25 As with AFFCO, Fonterra owns substantial areas of undeveloped land around its plant, including
some 70 hectares between Te Rapa Rd and the railway line (across the road from the main
plant). The Waikato Regional Policy Statement aims to “enable the development of a cluster of
dairy related industrial activities”, and Fonterra’s land would be an obvious place for this to
occur.
2.26 We are unsure as to Fonterra’s future plans for this land, but some of it may become available
for development in the future. We understand that, as with Te Awa Lakes, a 7 ha portion of the
land currently has ‘live’ industrial status, with another 23 ha of development possible after
2021.
7 http://nzdairies.com/nz/en/About/Our+Locations/NewZealand/Te+Rapa
6
RCG | Te Awa Lakes | Assessment of Economic Effects | 4 July 2017Figure Error! No text of specified style in document.-3: Adjacent Land uses
3.0 Industrial Land Availability

3.1          This chapter gives a brief overview of the supply and demand dynamics for industrial land in
             the Waikato, over the last decade and into the future.

3.2          This can be summarised as follows:

              •    Mid-2000s: industrial land shortage in Hamilton, with high prices and very little vacant
                   land;
              •    2009: Future Proof strategy sets out a land release programme for industrial land across
                   the sub-region, in a large number of dispersed areas;
              •    2016: Regional Policy Statement directs industrial land supply to be focused in “Strategic
                   Nodes”, rather than dispersed;
              •    2017: the Hamilton land market appears healthy compared with other NZ cities and the
                   Hamilton situation in 2007.

Before Future Proof (The Mid-2000s)
3.3          According to the Future Proof website, “an industrial land shortage has in the past been a
             major issue for the sub-region”.8 By the mid-2000s, this was a major policy concern.

3.4          Bayleys research from 2007 notes: “The lack of suitably zoned industrial land in Hamilton is
             pushing up land values as well as rental rates. Over the last year indicative land values have
             increased from between $120 to $170 to between $140 and $190 per square metre in
             Frankton, with reports that this could soon top out at $200 per square metre… The demand for
             industrial land in Te Rapa has increased further with values now ranging between $260 and
             $350 per square metre compared to $195 and $275 per square metre recorded 12 months
             ago”.9

3.5          Bayleys mentioned the proposed Rotokauri Structure Plan as helping to “alleviate the shortage
             of land in the future”.

3.6          A 2007 report by Andrew Mead at Hamilton City Council outlined that vacant industrial land
             was in short supply.10 Based on our reading of that report, it showed that there was 40
             hectares of vacant industrial land in Hamilton, with only 16 hectares “actually available for
             industrial development” – the remainder being landbanked or planned for non-industrial uses.

3.7          A 2008 report by Strategic Risk Analysis Ltd (SRA),11 also gives some insight into the conditions
             of the time. This includes high land values driven in large part by speculation, and out of step
             with what industrial occupiers could actually afford to pay. SRA refer to “a chronic shortage of
             land available for industrial development at affordable prices”.

8
    http://www.futureproof.org.nz/page/56-what-are-our-focus-areas+business-and-industrial-land+industrial-land
9   “Hamilton Regional Focus”, Bayleys, 2007
10
 “Hamilton Industrial Land Study”, authored by Andrew Mead, Policy Analyst, Strategic Unit, Hamilton City Council, and dated
May 2007
11“Developer Perceptions: Greenfield industrial subdivisions”, June 2008. Retrieved from
http://www.futureproof.org.nz/file/SubregionalIndustrialReport.pdf

                                                               8
                                  RCG | Te Awa Lakes | Assessment of Economic Effects | 4 July 2017
After Future Proof (2009 Onwards)
3.8 In response to the shortages of the mid-2000s, the Future Proof program identified a number
of areas for industrial land expansion, and tools for ensuring that industrial land supply was
protected.
3.9 The “Growth Strategy & Implementation Plan 2009”, produced by the Future Proof partners,
outlines provision for 1,927 hectares of new industrial land in the 50 years to 2061. This is split
across three periods (2011-2021, 2021-2041, 2041-2061) and a range of areas, including
“Strategic Nodes” such as Te Rapa North and Horotiu.
3.10 Subsequent reviews found that this level of provision was actually significantly more than the
likely requirements, which could add to a new problem – one of oversupply. This could have
resulted in an inefficient and dispersed urban form. 12
3.11 As such, the Waikato Regional Policy Statement eases back on the level of provision. Policy 6.14
states that “new industrial development should predominantly be located in the strategic
industrial nodes in Table 6-2”, with these nodes having an allocation of 1,148 hectares over 50
years.
3.12 Many of the Strategic Industrial Nodes have now been at least partially zoned for industrial use,
and along with vacant zoned land in other areas (e.g. Te Rapa), the supply and pipeline
situation now appears much less constrained than it was in the mid-2000s.
Industrial Land Uptake
3.13 The work programmes to create the Future Proof report and Waikato Regional Policy
Statement have involved detailed analysis of industrial land uptake, both in the past and
projected in the future. These analyses have been important in determining how much
industrial land should be provided, and over what timeframe.
3.14 The SRA report cited in paragraph 3.7 shows historical information on industrial land uptake in
Hamilton City, based on “sales net of resales, largely reflecting sales by developers to end-users
but including some sales to spec buyers”. This information, which SRA sourced from real estate
agency CBRE, is reproduced below with land uptake shown as a black line:
12 http://www.futureproof.org.nz/file/Business-Land-Review/future-proof-business-land-reconciliation-081210.pdf
9
RCG | Te Awa Lakes | Assessment of Economic Effects | 4 July 2017Figure Error! No text of specified style in document.-4: Hamilton Industrial Land Sales & Prices. Source:
CBRE via Strategic Risk Analysis Ltd
3.15 Based on this data, uptake of industrial land in Hamilton averaged 8.2 ha per annum over 1992-
2008. The SRA report notes that: “Some people interviewed suggested the annual demand for
land was significantly more than 8.2 ha, but this will partly reflect the double counting of land
sales (i.e. sales by developers to investors plus the resales by investors to end-users), while it is
possible that the CBRE data does not include some of the land sales outside Te Rapa and
Frankton”.
3.16 The Hamilton Industrial Land Study estimated industrial land uptake at 11.95 ha per annum
over 2002-06, using a methodology “based on building consents data”. However, building
consents are focused on the area of buildings, not the area of the land they sit on. It is not clear
whether the report converts the consented building area to an estimated land area, based on
assumptions around site coverage, or whether it has simply added up the site areas for all
industrial-zoned properties which had building consents approved over 2002-2006. The report
mentions that “past take up rates reflect significant retail development in the industrial area”,
so we believe the latter is more likely. In fact, the uptake may be doubly overstated, as it could
include both retail uses on industrial land, as well as new or extended buildings on existing
industrial sites (rather than new greenfields land being developed for the first time).
3.17 Overall, this study covers a short time period, during a time of strong economic growth, and
has a somewhat unclear methodology. As such, its figure of 11.95 ha per annum should be
treated with caution. In our view, though, this figure seems to support the earlier figure of 8.2
ha per annum for Hamilton City, over a long time period which included several economic
cycles.
3.18 The 2009 Future Proof report, covering the entire sub-region rather than just Hamilton City,
notes: “The starting point for determining probable need is the average consumption rate of
industrial business land over the last 10 years of 18 hectares per year [across the sub-region]. It
is noted that this consumption rate includes a wide mix of uses… Looking ahead, an annual
average consumption rate of 27 hectares has been assumed, given: the trend toward larger-
10
RCG | Te Awa Lakes | Assessment of Economic Effects | 4 July 2017footprint developments, a tendency for landowners to land bank, larger areas needed for low-
impact stormwater management, and the need for surplus capacity to accommodate economic
cycles”.13
3.19 Notwithstanding the different data sources and time periods, it seems that industrial land
uptake in Hamilton has historically averaged around 8 hectares per annum, versus 18 hectares
for the entire sub-region. The 2009 Future Proof report states a desire to provide for more
rapid uptake of 27 hectares per annum across the sub-region, but it actually recommends that
even more land than this be made available: 1,927 hectares, as noted in paragraph 3.9of our
report.
3.20 However, the Future Proof Business Land Review report from 2010 estimated that “the
subregion will require some 805ha (Gross Developable Area) of industrial land to 2061”. 14 This
is equivalent to 16 hectares per year, similar to historical rates of uptake.
3.21 Policies in the Waikato Regional Policy Statement provide more than enough land to cater for
this expected demand in the Future Proof sub-region, with 1,148 hectares (23 hectares per
year) in the Strategic Industrial Nodes alone. Much of this is already zoned. As shown in Table
6-2 of the Regional Policy Statement, 337 hectares is allocated in the 2010-2021 period, or 31
hectares a year, with the rate slowing beyond 2021.
3.22 As such, the Future Proof sub-region is more than adequately provided for in terms of future
industrial land supply, for both the medium term (to 2021) and the longer term. Given the
modelled and historical rates above which suggest 16-18 hectares a year uptake, the area of
land enabled in the Regional Policy Statement could in fact create an oversupply. This could
undermine the goal of a spatially efficient economy.
The UNISA Program
3.23 The Upper North Island Strategic Alliance (UNISA) is “an agreement to establish a long term
collaboration” between councils in the upper North Island “for responding to and managing a
range of inter-regional and inter-metropolitan issues”.15
3.24 The UNISA program so far has focused on subjects related to freight, ports and industry. A 2015
report found that the area of occupied industrial land across the UNISA area had risen “from
approximately 7,300 hectares to approximately 9,500 hectares” between 1996 and 2012.16
This is an uptake of 137.5 hectares per year across the Northland, Auckland, Waikato and Bay
of Plenty regions.
3.25 Unfortunately, the report does not break down the increase at the territorial authority (or even
regional) level. As an indication, though, Hamilton City accounted for 7.7% of industrial floor
space consented in the UNISA area over 1996-2012, and the Future Proof sub-region accounted
for 10.6%. If the same proportions held true for land uptake, Hamilton’s uptake would have
been 10.6 hectares per year, and the overall sub-region’s uptake would have been 14.6
hectares per year. These results are in the same ballpark as those in paragraph 3.22.
13 “Growth Strategy & Implementation Plan 2009”, Future Proof
14 “Future Proof Business Land Review: Summary Report of Findings and Recommendations”, Latitude Planning Services, 2010
15 www.hamilton.govt.nz/our-city/regional-alliances/UNISAfreightstory/Pages/default.aspx
16 “Upper North Island Industrial Land Demand”, BERL, February 2015
11
RCG | Te Awa Lakes | Assessment of Economic Effects | 4 July 20173.26 Sections 4 and 5 of the 2015 UNISA report also outline a detailed methodology for predicting
future industrial land requirements. The report works through this approach for the Northland
region. Significant resources are required to carry out this methodology, and in practise we
expect that it would generally be used in collaboration with councils, who can provide key
inputs.
3.27 The UNISA report explains the two different types of models – the more commonly used
‘labour supply’ models, and ‘industry demand’ models. According to the report, “there is wide
variation in the demand for industrial land under labour supply models, and less extreme
variation under industrial demand models”, and as such the latter type of model is preferred.
3.28 We consider that both types of model should be ‘sense checked’ against historical data, which
is reasonably straightforward to obtain. We summarise some of the previous land uptake
estimates above, and historical building consent (floor space) data in chapter 4.0 below.
Property Market Research
3.29 This section summarises research from Colliers and Bayleys on the Hamilton industrial market,
and the New Zealand market generally. Other agencies, such as JLL, CBRE and Knight Frank, also
produce industrial research from time to time, but they focus on the larger markets rather than
Hamilton.
Colliers
3.30 According to 2016 research from Colliers,17 average warehouse net rents in Hamilton are
$81/m2, with average (industrial) office net rents in Hamilton at $129/m2. Average yields are
7.8%, with 297 ha of industrial zoned vacant land in the Waikato. Demand and supply are both
expected to increase, suggesting a growing industrial market in Hamilton.
3.31 These rents are lower, and the yields are higher, than for the other main centres covered by
Colliers – with the exception of Dunedin, which has warehouse rents of $68/m2, office rents of
$113/m2, and yields at 8.6%.
3.32 By comparison, Auckland has the tightest industrial market with warehouse rents of $103/m2,
office rents of $196/m2, and yields at 6.8%. Auckland vacancy rates are at record lows of 2.2%,
which should drive further development in the market. Colliers refer to “relentless occupier
demand” in Auckland.
3.33 Colliers note: “Hamilton’s recent boost to leasing activity reduced vacancy rates and kept the
pressure on investors when bidding for prime space. Land supply remains a vital component of
the sector’s health with recent uptake by the Ports of Auckland [at Northgate Business Park]
generating opportunities for others”.
3.34 Colliers also note: “In a sector that is showing growing levels of optimism and activity, the one
disconnect is the significant amount of land supply currently zoned or with the potential for
future industrial zoning as identified in the District Plan by Hamilton City Council”.
17“New Zealand Industrial” report, Colliers, July 2016. Retrieved from
http://www.colliers.co.nz/find%20research/industrial/industrial%20research%20report%202016/
12
RCG | Te Awa Lakes | Assessment of Economic Effects | 4 July 20173.35 Colliers International’s 2016 Vacant Industrial Land survey showed that there is currently 297
ha of land available, with a further 527 ha of non-industrial zoned land earmarked for potential
future industrial use. In the past year, industrial zoned land absorption increased to 41ha with
prominent sales like Ports of Auckland’s purchase of 33ha boosting demand and generating
opportunities.
3.36 Our reading of this is that Colliers see Hamilton as currently being well supplied, or even
oversupplied, with industrial land. Their second paragraph appears to state that the
“significant” amount of zoned or potential land is a challenge for the “optimism and activity” in
the sector, i.e. an oversupply could actually hurt the market.
3.37 Summarising the Colliers report on the nationwide industrial sector, it would be fair to note
that the sector is expanding, with supply shortages in some cities (especially Auckland).
Hamilton does not currently seem to be subject to these same issues, and indeed may be at risk
of an oversupply.
Bayleys
3.38 Bayleys cover Hamilton industrial in their autumn 2016 Marketbeat report, “Hamilton Regional
Report”.18 This includes data to March 2016. The Bayleys survey covers approximately 690,000
m2 of floor space in Te Rapa, Frankton, Te Rapa North and Avalon, and indicates generally low
vacancy rates for industrial buildings, with almost no vacant floor space in Te Rapa North.
3.39 Bayleys note: “With all major land use consents now gained, earthworks for the major inland
port at Ruakura are likely to commence within 12 months. The port will support the
requirements of a range of freight users who are expected to locate within the adjacent
logistics hub. Major investment going into road and rail connections will see Ruakura act as an
enabler of freight flows, which are expected to double over the next 20 years”.
3.40 Bayleys also note: “The tight market conditions are, in fact, prompting some rural land owners
close to popular industrial areas such as Te Rapa/Gateway to consider offering unserviced bare
land to the market”.
3.41 Again quoting from Bayleys: “The latest Bayleys Research industrial vacancy survey for
Hamilton shows that conditions remain tight across all the major traditional industrial areas. As
at March 2016 the overall vacancy rate was a low 5.4%, up just marginally from the previous
year’s 5.1%”.
3.42 We note that Bayleys’ vacancy comments above refer to industrial buildings, rather than
industrial land. In our view, they reflect a reasonably healthy market for industrial floor space,
with vacancies sufficiently low that they should prompt additional development.
3.43 Bayleys estimated that rents had been roughly flat over the previous 12 months, and expected
this to remain the case for the next 12 months.
18 http://www.marketbeat.co.nz/hamilton-regional-autumn-2016/
13
RCG | Te Awa Lakes | Assessment of Economic Effects | 4 July 2017The Current Market (2017)
3.44 Industrial sites are being offered for sale or lease in various areas around Hamilton and the
Waikato. These include Te Rapa Gateway and Northgate Business Park, as discussed in chapter
2.0.
3.45 Te Rapa Gateway is currently advertising industrial sites for sale at $240-$300/m2, for newly
subdivided sites between the Waikato Expressway and railway line. 19 This is a similar price
level to the values given by Bayleys in their 2007 research.
3.46 The availability of land in this price range ten years on indicates how severe the shortage of
land was in 2007 – or at least, how far out of step land values were with fundamentals.
Furthermore, interest rates are much lower in 2017 than in 2007, and low interest rates tend to
inflate land prices (the interest costs of funding a land purchase are lower, making high prices
more bearable).
3.47 Northgate Business Park is also selling land, although the prices are not listed on its website.
We expect that prices would generally be lower than those offered at Te Rapa Gateway, as the
location is more remote.
3.48 Te Rapa itself has also been seeing development. A vacant 0.93 hectare site at 169-181 Maui
Street was recently put up for sale by tender closing 9 March 2017. Several other sites are
available for sale or lease on Kahu Crescent and The Boulevard.
3.49 Titanium Park is a planned industrial park of around 65 hectares, which surrounds Hamilton
Airport. Planning approval for the estate was granted in 2009, and Torpedo7 (now part of The
Warehouse Group) became an early occupier, buying a 12 hectare site in 2011. In June 2017,
packaging and recycling business Visy was announced as having purchased an 8.5 hectare site.
Various other sites are available for sale. Again, prices are not listed on the website.
3.50 As of July 2017, earthworks for Ruakura are underway, with the first stage of the inland port
aimed to open in the first half of 2019. Landowner Tainui Group Holdings has formed a joint
venture with LINX Cargo Care Group to develop and operate the inland port.20
3.51 Other industrial sites within Ruakura are likely to be available in the short term, to complement
the inland port activity. Home building is also underway in the northern parts of Ruakura,
between Greenhill Rd and Carr Rd. The first homes have already been completed.
3.52 It is also worth noting that parts of the former Franklin District, including Pokeno and Tuakau,
have been transferred into the Waikato District. Technically, these areas are now part of the
Waikato sub-region, although in practise they are more closely tied to the Auckland market:
they are very close to Pukekohe, and with easy access to the wider Auckland area.
3.53 Pokeno is seeing rapid residential growth, with the major Pokeno Village Estate subdivision and
smaller developments such as Kowhai Downs. The Gateway Business Park is also underway: the
Yashilli dairy plant opened in 2015 on a 6.7 hectare site, and Hynds Group is also developing a
manufacturing site. Various smaller sites are being offered for sale or lease.
19 http://www.terapagateway.com/site-plan/, retrieved 24/3/2017
20 http://auckland.scoop.co.nz/2017/06/tgh-and-linx-join-forces-at-ruakura/, retrieved 3/7/2017
14
RCG | Te Awa Lakes | Assessment of Economic Effects | 4 July 20174.0 Industrial Consents Data
4.1 Building consent data provides an accurate, consistent indicator of industrial development and
growth. However, it does not fully capture industrial use of land. For example, an industrial
property may include yards, carparks, and land set aside for future expansion.
4.2 The figure below shows how much floor space has been consented across New Zealand over
the last 27 years, for years ended March 1991-2017:
Figure Error! No text of specified style in document.-5: New Industrial Floor Space Consented (New
Zealand-wide). Source: Stats NZ building consent data for new “factories, industrial, and storage buildings”
4.3 These floor areas exclude alterations to existing buildings. In the early 1990s, alterations made
up around 40% of industrial consents by value, but today the figure is 15%-20%. Consents data
also excludes demolition of old industrial buildings, and conversion of industrial buildings to
other uses (e.g. retail or residential. Overall, consents data on ‘new’ industrial floor area should
be a good indicator of industrial expansion.
4.4 Consents have fluctuated significantly over the last 27 years, due to economic cycles and other
factors. The long-term average is 852,000 m2 of new floor space consented a year.
Development fell behind this average in the years ended March 2010-2013, reflecting the
Global Financial Crisis and recession, and has exceeded it for the last four years, reflecting an
economic rebound and somewhat of a ‘catch up’ on the previous four years.
4.5 Consents in the Waikato area have been more ‘lumpy’, as is generally the case for regional
markets – the timing of individual developments can make a big difference to the figures,
whereas these factors tend to cancel out at the national level.
15
RCG | Te Awa Lakes | Assessment of Economic Effects | 4 July 20174.6 The chart below shows the floor space consented in the combined Hamilton, Waipa and
Waikato territorial areas:
Figure Error! No text of specified style in document.-6: New Industrial Floor Space Consented (Waikato
Sub-Region). Source: Stats NZ building consent data for new “factories, industrial, and storage buildings”
4.7 The long-term average for the Waikato sub-region is 49,800 m2 of new floor space consented a
year. Notwithstanding the ‘lumpiness’ issue, the sub-region has followed similar trends to New
Zealand, with consents generally below average in the years ended March 2009-2013, and
above average in the last four years.
4.8 We also note that the years ended March 2003-2007 (essentially the period covered by the
2007 Hamilton Industrial Land Study) had particularly high activity, especially the years ended
March 2005 and 2006 where consents were more than double the long-term average.
4.9 Since April 1990, around 67% of new industrial development in the Waikato sub-region has
been in Hamilton City, measured either by value or floor area. The Waikato District had around
20% of new development measured by value or 18% by floor area, and the Waipa District had
around 12% of new development measured by value or 14% by floor area.
4.10 Industrial trends, and land uptake, could change in the future. However, the picture for New
Zealand-wide building consents (Figure Error! No text of specified style in document.-5) shows
a reasonably steady level of activity, albeit affected by upturns and downturns. There is no
clear evidence of consents (and likely land demand) trending upwards or downwards, and as
such historical trends are likely to give a good guide for land uptake. The UNISA report also
seems to support this, noting that “the trends in each industry are relatively slow-moving”.
16
RCG | Te Awa Lakes | Assessment of Economic Effects | 4 July 20175.0 Housing Supply and Demand
5.1 This chapter looks at housing supply and demand in Hamilton and the surrounding districts.
5.2 We begin by looking at population growth, the key driver of housing demand. We look at
recent trends (record migration, etc), and projections for the future.
5.3 We then look at housing supply, i.e. building consents information. We also briefly comment on
house prices and affordability.
National Population Growth
5.4 At the national level, population growth comes from:
• Natural increase (births minus deaths – reasonably consistent from year to year);
• Net international migration (immigration minus emigration – can fluctuate dramatically
from year to year).
5.5 These two sources of population growth are shown in Figure Error! No text of specified style in
document.-7 below:
Figure Error! No text of specified style in document.-7: NZ Population Growth 1992-2016. Source: RCG,
Stats NZ
5.6 Net migration has been at record levels for the last three years, continuing into 2017.
International immigration has been the dominant factor in NZ’s population growth over this
17
RCG | Te Awa Lakes | Assessment of Economic Effects | 4 July 2017time. However, past experience shows that migration flows can turn around very quickly, and
the government announced a tightening of immigration policy in April 2017. 21
5.7 Even so, it seems likely that on average, immigration in the future will be higher than it has
been historically. For example, recent projections from Stats NZ assume higher levels of
migration than had been used in the past.
Local Population Growth
5.8 At the local level, population growth comes from natural increase and international migration
as above, as well as from internal or domestic migration.
5.9 Domestic migration is harder to quantify than births, deaths or international migration.
Although Stats NZ estimate its effects from year to year, it is only in the 5-yearly censuses that
we get an accurate picture.
5.10 However, some of the key trends which we expect to continue are that, on a “net” basis,
Auckland will continue to lose people to neighbouring regions such as the Waikato, 22 and that
this loss will be greater when there is housing pressure in Auckland.
Figure Error! No text of specified style in document.-8: Auckland Population Flows. Source: RCG
5.11 This is certainly the case at the moment: Auckland is building fewer than 10,000 homes a year,
but is targeting 13,000 a year under the Auckland Plan, and needs to build 15,000 a year based
on current population growth levels. This is adding to an Auckland housing undersupply which
has been building since at least 2008.
5.12 The result has been a house price boom which started in Auckland and spread around the rest
of the country, and more demand for homes in places like Hamilton and Tauranga, which
provide more affordable housing than Auckland.
21
https://www.immigration.govt.nz/about-us/media-centre/news-notifications/skilled-migrant-category-changes
22
This trend has been in place since the late 1990s. See https://www.greaterauckland.org.nz/2014/10/09/northward-
drift-no-more/
18
RCG | Te Awa Lakes | Assessment of Economic Effects | 4 July 20175.13 However, there would still be strong growth in Hamilton even if Auckland was able to fully
meet its housing need. Hamilton has grown significantly over many decades, and is expected to
continue this growth. This is illustrated by the projections later in this chapter.
Declining Household Sizes
5.14 Another driver of new housing demand is the long-term, internationally recognised shift
towards fewer people per household. This arises in part due to people having fewer children,
but more due to people living longer – most of the growth is in “empty nester” households.
5.15 However, places like Auckland and Hamilton have bucked the trend in recent years – between
the 2001 and 2013 censuses, Auckland’s average household size stayed flat at 3.0 people per
household, and Hamilton’s stayed flat at 2.8. We view the Auckland result as being evidence of
the city’s struggle to keep up with its housing needs over the long term. The Hamilton picture
may be more complex, but is at least in part a reflection of these same issues.
5.16 For the Waikato district, though, the average household size fell from 3.0 to 2.9 between 2001
and 2013. For the Waipa district, the average household size fell from 2.8 to 2.7.
5.17 Over the long term, these demographic trends are likely to mean that household growth (and
demand for housing) is faster than population growth. This is also reflected in Stats NZ
projections.
Stats NZ Projections
5.18 Stats NZ produces a wide range of projections – for both population and households, and at the
national, local and even area unit level. For this report, we focus on their subnational
population projections, which were released in February 2017. 23
5.19 These show growth occurring in Hamilton, as well as in the Waikato and Waipa districts. Figure
Error! No text of specified style in document.-9 below shows the three sets of projections for
Hamilton City:
23
http://www.stats.govt.nz/browse_for_stats/population/estimates_and_projections/SubnationalPopulationProjections_HOTP2013
base-2043.aspx
19
RCG | Te Awa Lakes | Assessment of Economic Effects | 4 July 2017Figure Error! No text of specified style in document.-9: Stats NZ Population Estimates and Projections for
Hamilton. Source: RCG, Stats NZ
5.20 Based on the latest ‘medium’ projections from Stats NZ, Hamilton City will have a population of
224,800 people by 2043. Under the ‘high’ projection, the figure would be 250,400, and under
the ‘low’ projection it would be 199,300.
5.21 The Waikato and Waipa districts are also projected to grow strongly. Based on ‘medium’
projections, the Waikato district’s population will grow from 66,500 in 2013 to 101,700 in 2043.
Waipa’s population will grow from 48,700 in 2013 to 65,900 in 2043. On a percentage basis,
Waikato is expected to grow at roughly the same rate as Hamilton City, whereas Waipa is
somewhat slower.
5.22 Stats NZ’s subnational household projections are now somewhat out of date – they are based
on an earlier set of population projections than the ones above. They will be revised in
December 2017, and the ‘medium’ projection is likely to be revised upwards.
5.23 However, the existing household projections are still useful as an indication of potential
housing demand. Based on the ‘medium’ projections:
• Hamilton is expected to add 23,600 households between 2013 and 2038, or 948 a year on
average;
• Waikato is expected to add 10,800 households between 2013 and 2038, or 432 a year on
average;
• Waipa is expected to add 5,800 households between 2013 and 2038, or 232 a year on
average.
20
RCG | Te Awa Lakes | Assessment of Economic Effects | 4 July 20175.24 We see these projections as being conservative, especially in the short to medium term. As
noted above, they are likely to be revised upwards in December 2017. Furthermore, household
numbers are likely to grow faster in the early years of the 2013-2038 period than in the later
years, as our ageing population means that the rate of growth will slow over time.
5.25 Looking at Stats NZ’s ‘high’ projections for the 2013-2023 period, Hamilton is expected to add
1,320 households a year, Waikato 610 households a year, and Waipa 380 households a year.
NIDEA Projections
5.26 The National Institute of Demographic and Economic Analysis (NIDEA) has also produced
several reports with projections for Hamilton and the Waikato. These were last updated in
November 2016, with population and household projections at the ‘area unit’ level. 24
5.27 Looking at NIDEA’s ‘medium’ projections for the 2013-2031 period, Hamilton is expected to add
1,427 households a year, Waikato 644 households a year, and Waipa 509 households a year. 25
5.28 This implies an even higher level of growth than the Stats NZ ‘high’ projections, due to NIDEA
using different assumptions about household types.
5.29 In our view, Hamilton is likely to stay on a medium/ high growth track for the foreseeable
future. It will take many years for Auckland to make inroads into its housing shortage, and in
the meantime the Waikato will be an attractive destination for new migrants and former
Aucklanders.
Housing Demand and Supply
5.30 Councils across New Zealand use a range of approaches for looking at housing demand and
supply. However, building consents are a very common measure of housing supply, as they are
nationally consistent and long-term data is available.
5.31 Figure Error! No text of specified style in document.-10 below shows the number of homes
consented in the Hamilton, Waikato and Waipa districts, on a ‘moving annual total’ basis:
24 http://www.futureproof.org.nz/file/wise_2016update_cau_report_final_19-nov-2016.pdf
25 Table A3 of the NIDEA report linked above
21
RCG | Te Awa Lakes | Assessment of Economic Effects | 4 July 2017Figure Error! No text of specified style in document.-10: Homes Consented in the Future Proof Area.
Source: RCG, Stats NZ
5.32 Building consents in all three territorial authorities are currently running at near-record levels.
However, even this level of ‘supply’ is still struggling to keep up with demand. As shown in the
graph above, consenting activity dropped off significantly in 2008-2012, and has only reached
the current highs in the last 2 years or so. However, population growth continued throughout.
5.33 In the last 2-3 years, population growth has been even stronger. According to population
estimates from Stats NZ, Hamilton’s population grew by 11,000 between June 2013 and June
2016. With an average household size of 2.8, this would require 3,929 new homes, or 1,300 a
year. As shown in the graph above, Hamilton was well short of this in 2013-2016. However, the
Waikato and Waipa districts seem to have come closer to balancing their ‘supply’ and
‘demand’.
5.34 Using the same kind of simple metrics, we estimate that Hamilton’s housing supply has fallen
short of meeting demand for each year from 2008-2016 (although it exceeded demand over
2003-2007). Over the 2008-2016 period, we estimate that there was demand for 9,109 homes
in Hamilton City, with only 7,081 homes supplied.
5.35 These figures assume a constant average household size, but assuming a declining household
size would show an even higher demand result, and a larger undersupply.
House Prices and Affordability
5.36 Like most other parts of New Zealand, Hamilton house prices rose strongly in the years leading
up to 2007, and dropped slightly in 2008. According to QV data, house prices grew modestly
22
RCG | Te Awa Lakes | Assessment of Economic Effects | 4 July 2017over 2009-2014, and have risen rapidly beginning in the second half of 2015. Only Auckland and
Tauranga have seen faster growth over 2007-2016.
5.37 The average house value in Hamilton has now reached $537,000, up from $379,000 two years
ago.26
5.38 Although many of the factors driving this house price growth are national (low interest rates,
record migration, rising construction costs etc), we believe that Hamilton’s proximity to
Auckland, and relatively affordable housing compared to the larger city, are also major factors.
5.39 However, affordability is a growing issue, especially for Hamiltonians who have seen house
prices increase dramatically in the last two years, with incomes not rising to match. According
to Interest.co.nz, Hamilton’s ‘median multiple’ – the ratio of median house prices to median
household incomes – now sits at 6.34, higher than the New Zealand average of 6.21 and all
other cities except Auckland and Tauranga.27
5.40 These issues will be addressed in more detail by the Hamilton City Council this year, as the
recently signed Housing Accord is aimed at increasing housing supply and improving
affordability in the city.
5.41 The Housing Accord aims to deliver 1,300 sections and dwellings consented in 2017, with 1,400
in 2018, and 1,500 in 2019. This will require further growth in consenting activity, to record
levels over the next few years.
5.42 The Housing Accord affirms that housing supply and affordability are key issues in Hamilton,
and require short term action. Hamilton City Council should be looking at ways to meet the
shortfall now.
5.43 In the last 10 years, growth has been concentrated in the northeast – Rototuna and Flagstaff –
but these areas are getting closer to reaching capacity. Most of the major subdivisions are close
to completion, with the main exception being land around the proposed Rototuna town centre,
owned by the Kimpton family. Providing for future growth will require action in growth nodes
across the city, including Ruakura, Rotokauri, Peacocke and elsewhere – potentially including Te
Awa Lakes.
5.44 Te Awa Lakes is well suited to new housing, being close to employment nodes such as Te Rapa
and Horotiu (including the sub-regional centre at The Base), and close to Horotiu Primary
School.
26 Data from https://www.qv.co.nz/property-trends/residential-house-values, for May 2015 compared with May 2017
27 Data from http://www.interest.co.nz/property/house-price-income-multiples, for May 2017
23
RCG | Te Awa Lakes | Assessment of Economic Effects | 4 July 20176.0 Tourism in the Waikato
6.1 This chapter gives an overview of relevant tourism trends in Hamilton, the Waikato and New
Zealand generally. This information is not specific to Te Awa Lakes, and it is included for
background and as a starting point for our site-specific analysis in chapter 7.0.
Tourism and the New Zealand Economy
6.2 Tourism’s overall contribution to the New Zealand economy is recorded in the Tourism Satellite
Account, published by Stats NZ. The latest account covers the year to March 2016. This outlines
the following figures:
• Total tourism expenditure is $34.7 billion, with $20.2 billion of that from domestic
tourism;
• International tourists spent $14.5 billion, equal to 20.7% of New Zealand’s total exports of
goods and services. Tourism was the country’s largest export earner, beating out dairy
products;
• Tourism’s ‘direct’ contribution to GDP was $12.9 billion, or 5.6% of total GDP;
• Tourism had a further ‘indirect’ GDP contribution of $9.8 billion, or 4.3% of GDP. This
covers value added further up the value chain as a result of tourist purchases – for
example, when a tourist buys a retail product, the retailer’s value added is a ‘direct’
contribution to GDP, and the value added by the wholesaler and manufacturer is an
‘indirect’ contribution.
• Tourism employs 188,136 people, 7.5% of the nationwide total.
6.3 Tourism cuts across a number of industries, and the ‘direct’ contribution to GDP is the
preferred measurement when comparing to more traditional industries such as agriculture.
‘Indirect’ contributions can be thought of as flow-on or multiplier effects.
Forecasting Tourism Spending
6.4 Forecasting tourism spending growth is extremely difficult. The industry is prone to upturns
and downturns, and spending is particularly affected by the strength of the dollar. Over the
long term, upturns and downturns should cancel out to some extent, so that a smoother rate of
growth can be assumed.
6.5 The government has produced regional tourism forecasts in the past, but now forecasts are
only available at the New Zealand level. The latest MBIE forecasts assume that international
tourism spending will grow at an annual rate of 5.3%-6.7% in the following five years,28 which
is as far out as the forecasts go.
28http://www.mbie.govt.nz/info-services/sectors-industries/tourism/tourism-research-data/international-tourism-
forecasts/2017-2023-forecasts
24
RCG | Te Awa Lakes | Assessment of Economic Effects | 4 July 2017You can also read