Ahmedabad, India Scaling Up with Contiguous Replication of Town Planning Schemes - World Bank Group
←
→
Page content transcription
If your browser does not render page correctly, please read the page content below
Public Disclosure Authorized

                               CASE
                                 1    G R E AT E R T H A N PA R T S

                               Ahmedabad, India
                               Scaling Up with
                               Contiguous Replication of
Public Disclosure Authorized

                               Town Planning Schemes
                               Madhu Bharti and Shagun Mehrotra
Public Disclosure Authorized
Public Disclosure Authorized

                                                                      Editors
                                                                      Shagun Mehrotra, Lincoln Lewis,
                                                                      Mariana Orloff, and Beth Olberding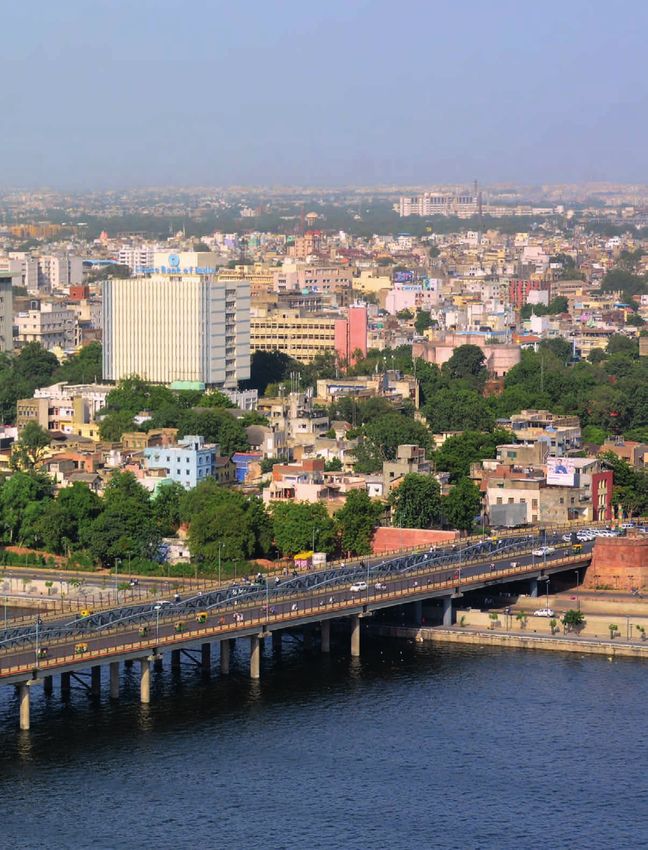
© 2020 International Bank for Reconstruction and Development / The World
Bank 1818 H Street NW, Washington, DC 20433
Telephone: 202-473-1000; internet: www.worldbank.org

Some rights reserved.

This work is a product of the staff of The World Bank with external contri-
butions. The findings, interpretations, and conclusions expressed in this
work do not necessarily reflect the views of The World Bank, its Board of
Executive Directors, or the governments they represent. The World Bank does
not guarantee the accuracy of the data included in this work. The boundaries,
colors, denominations, and other information shown on any map in this work
do not imply any judgment on the part of The World Bank concerning the
legal status of any territory or the endorsement or acceptance of such
boundaries.

Nothing herein shall constitute or be considered to be a limitation upon or
waiver of the privileges and immunities of The World Bank, all of which are
specifically reserved.

Rights and Permissions

This work is available under the Creative Commons Attribution 3.0 IGO
license (CC BY 3.0 IGO) http://creativecommons.org/licenses/by/3.0/igo. Un-
der the Creative Commons Attribution license, you are free to copy, distribute,
transmit, and adapt this work, including for commercial purposes, under the
following conditions:

Translations—If you create a translation of this work, please add the following
disclaimer along with the attribution: This translation was not created by The
World Bank and should not be considered an official World Bank translation.
The World Bank shall not be liable for any content or error in this translation.

Adaptations—If you create an adaptation of this work, please add the following
disclaimer along with the attribution: This is an adaptation of an original
work by The World Bank. Views and opinions expressed in the adaptation
are the sole responsibility of the author or authors of the adaptation and
are not endorsed by The World Bank.

Third-party content—The World Bank does not necessarily own each
component of the content contained within the work. The World Bank
therefore does not warrant that the use of any third-party-owned individual
component or part contained in the work will not infringe on the rights of
those third parties. The risk of claims resulting from such infringement
rests solely with you. If you wish to reuse a component of the work, it is
your responsibility to determine whether permission is needed for that
reuse and to obtain permission from the copyright owner. Examples of
components can include, but are not limited to, tables, figures, or images.

All queries on rights and licenses should be addressed to World Bank Publi-
cations, The World Bank Group, 1818 H Street NW, Washington, DC 20433,
USA; email: pubrights@worldbank.org.

Cover design: Oliver Uberti
Typesetting: Puntoaparte

Disclaimer—The report contains preliminary research, analysis, findings,
and recommendations. The information is circulated to stimulate timely
discussion and critical feedback and to influence ongoing debate on
emerging issues.

Citation—Bharti, Madhu and Shagun Mehrotra. 2020. “Metropolitan
Ahmedabad: Scaling Up with Contiguous Replication of Town Planning
Schemes.” In Volume II of Greater Than Parts: A Metropolitan Opportunity,
edited by Shagun Mehrotra, Lincoln L. Lewis, Mariana Orloff, and Beth
Olberding. Washington, DC: World Bank.
CASE
  1    G R E AT E R T H A N PA R T S

Ahmedabad, India
Scaling Up with
Contiguous Replication of
Town Planning Schemes
Madhu Bharti and Shagun Mehrotra

                                       Editors
                                       Shagun Mehrotra, Lincoln Lewis,
                                       Mariana Orloff, and Beth Olberding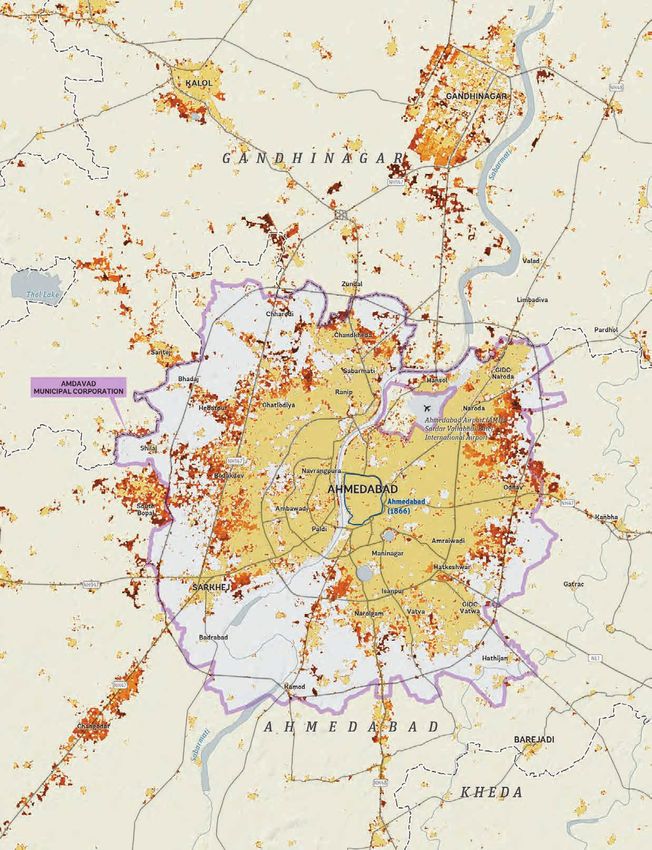
CASE STUDY 1: METROPOLITAN AHMEDABAD

                  Scaling Up with
                  Contiguous
                  Replication of Town
                  Planning Schemes
                                                        Madhu Bharti and Shagun Mehrotra

Ahmedabad
       IN DIA N
       OC E A N

                                    Citation—Bharti, Madhu and Shagun Mehrotra.
                                    2020. “Metropolitan Ahmedabad: Scaling Up
                                    with Contiguous Replication of Town Planning
                                    Schemes.” In Volume II of Greater Than Parts:
                                    A Metropolitan Opportunity, edited by Shagun
                                    Mehrotra, Lincoln L. Lewis, Mariana Orloff, and
                                    Beth Olberding. Washington, DC: World Bank.

                                    The Synthesis Report offers a range of
                                    integrated solutions (Mehrotra 2020).
                       AHMANABAD                   BANGALORE                          MEXICO CITY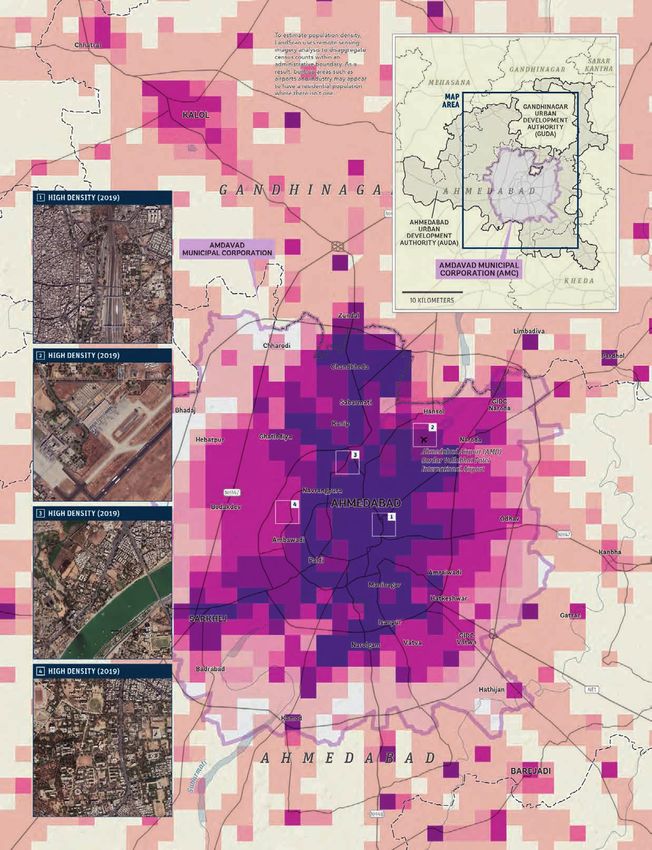
iii
TABLES
Table 1 Population growth, 1991–2019
Table 2 Chronological progress of Ahmedabad’s
development plan and implementation,
1965–2014
Table 3 Average trip length and road density,
Ahmedabad vs Bangalore
FIGURES
Figure 1 Integrated planning model
Figure 2 Sectors addressed by the case
CONTENTS Figure 3 3D population density distribution
Figure 4 Sardar Patel Ring Road with aggregated
The Metropolitan Context 3 town planning schemes
Figure 5 Town planning scheme process
Integration 8 and timeline
Figure 6 City-wide solution
Implementation 9 Figure 7 Population density, 2000
Figure 8 Population density, 2017
Financing 23 Figure 9 Overlay of density levels, 2000–2017
Global Environmental Benefits: MAPS
Outcomes and Scale-up 24 Map 1 Urban expansion, 1985–2015
Map 2 Population density, 2017
Conclusion 28 Map 3 Ahmedabad Urban Development
Authority Draft Development
Density 31 Plan, 2021
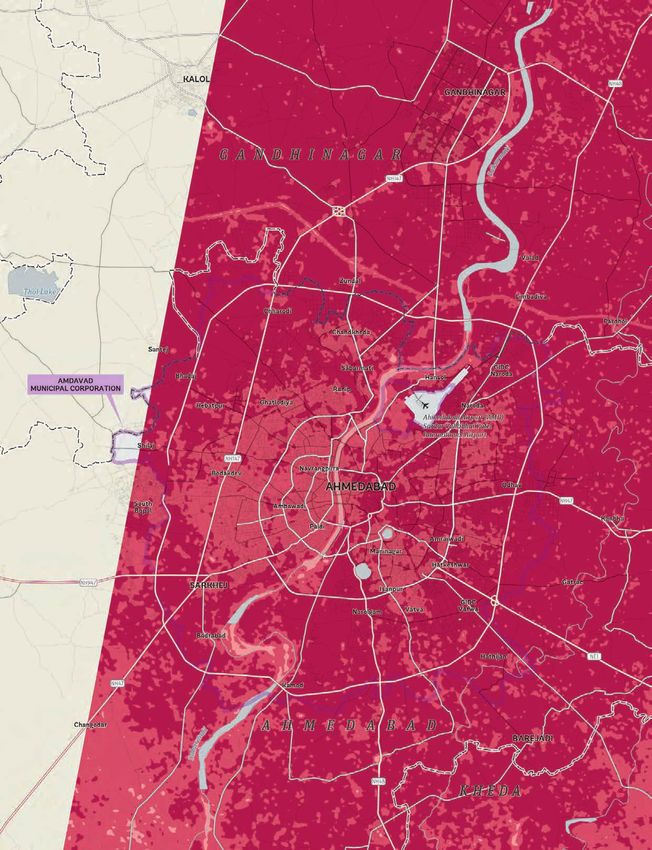
Map 4 Urban heat map, 2018
References 33
BOXES
Abbreviations 33 Box 1 Urban innovations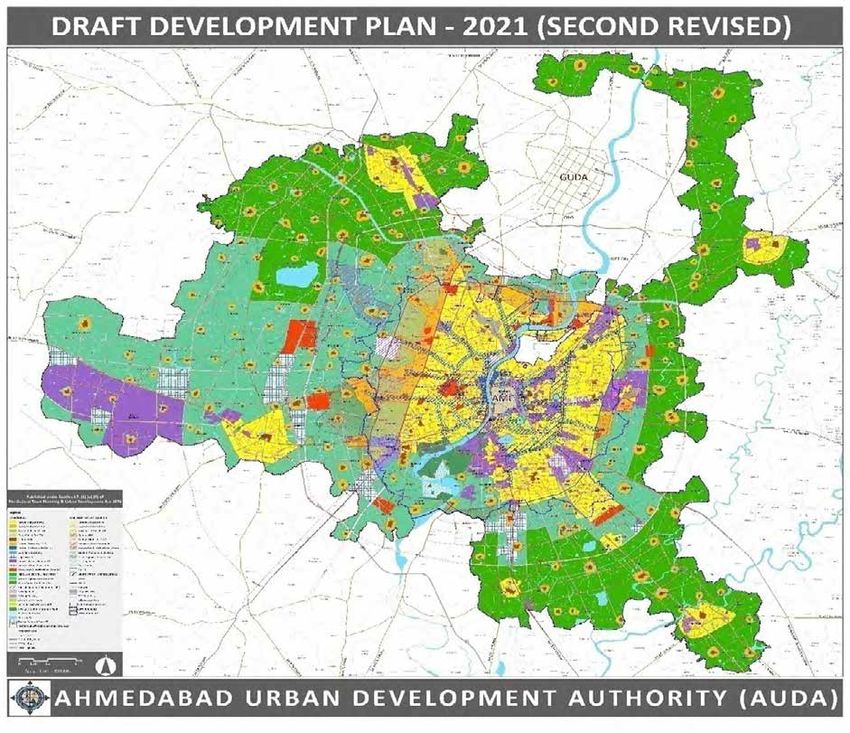
1    |   GREATER THAN PARTS

                                               THE SOLUTION

       Making space for high-density mixed land
      use and integrating peri-urban expansion by
     replicating contiguous town planning schemes

Figure 1
Integrated
planning model
Source: Mehrotra
2020 with data from
Government of Gujarat,
India, in Ballaney 2008.

                                               KEY FINDINGS

     Nearly 100 micro town                  The city has expanded its              TPS use a participatory form of
 1                                     2                                      3
     planning schemes (TPS) were            fiscal space through improved          land readjustment to enable in-
aggregated into the 76km Sardar        property valuation, tax coverage,      frastructure expansion without land
Patel Ring Road project. An afford-    and collection. Reorganizing           acquisition. These compact, mixed-
able housing zone along the road,      land into accessible plots with        use urban extensions contribute
supported by a national program,       integrated urban infrastructure        to relatively shorter average trips,
has reduced congestion and             has unlocked land value capture        limiting travel-based emissions,
housing pressure, while increasing     opportunities too. In 1998 it issued   and curtail sprawl. Market-driven
connectivity and densities. The        India’s first municipal bond without   incentives also encourage private
bus rapid transit system (BRT) has     a state guarantee.                     developers to rehabilitate slums at
already provided city-wide mobility                                           higher densities.
in Ahmedabad; a metro link to Gand-
hinagar is expected to further unify
this emerging metropolitan area.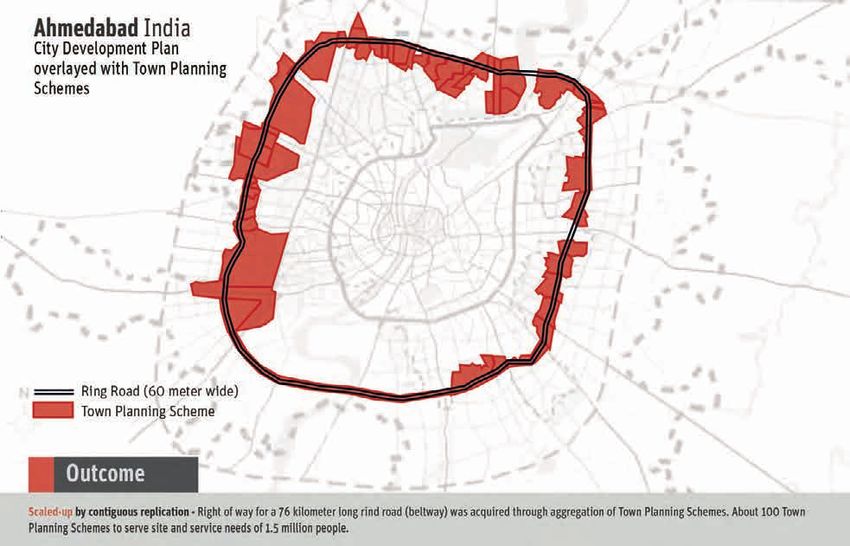
AHMEDABAD: SCALING UP WITH CONTIGUOUS REPLICATION OF TOWN PLANNING SCHEMES      |   2

IDEA IN BRIEF

Metropolitan authorities can establish a macro-planning or region-
al spatial framework with a development plan and flexibly utilize
town planning schemes to finance and implement integrated
development of the urban periphery.                                                      Transport

   Ahmedabad offers policymakers a well-structured model of met-
ropolitan integrated planning that combines a development plan                           Energy

(DP) with town planning schemes (TPS). By utilizing the develop-
ment plan—a metropolitan regionwide masterplanning approach                              Water

for land use and infrastructure coordination—Ahmedabad has
established a vision and framework to shape its rapid expansion                          Solid Waste

over the next decade while setting guidelines to curtail sprawl.
   The TPSs translate the DP vision into action. These TPSs use                          Financing

a land-pooling mechanism of one to two square kilometers,
employing participatory planning to design, finance, and deliver                         Governance

integrated infrastructure and social services while creating mixed-
use extensions to the city. This enables local bodies to anticipate                      Climate Change

and steer metropolitan urban growth through a close collaboration
with peri-urban land owners and negotiation with other stake-                            Biodiversity

holders. Under its 2011 DP, Ahmedabad is crowding in density by
integrating transportation networks, making space for mixed land
use, and developing peri-urban infrastructure, such as the Sardar
Patel Ring Road, a beltway developed by aggregating nearly 100
town planning schemes. Ahmedabad's DPs and TPSs work hand in
hand to create their own metropolitan integrated planning process,
which has the demonstrated benefit of integrated planning that
                                                                                 Figure 2
delivers compact urban growth while meeting the social and eco-                  Sectors addressed
nomic aspirations of its citizens.                                               by the case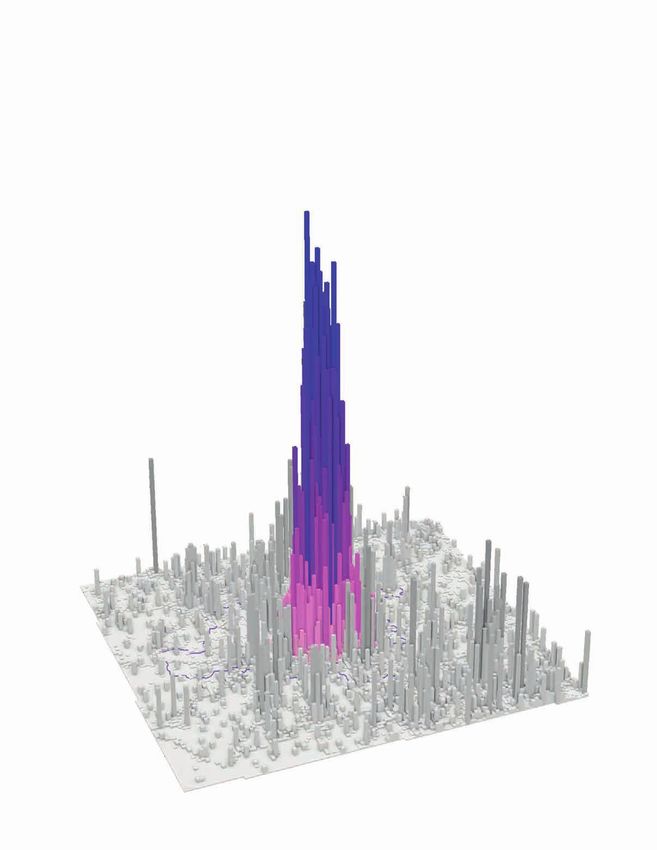
3 | GREATER THAN PARTS
The Metropolitan Context
BACKGROUND
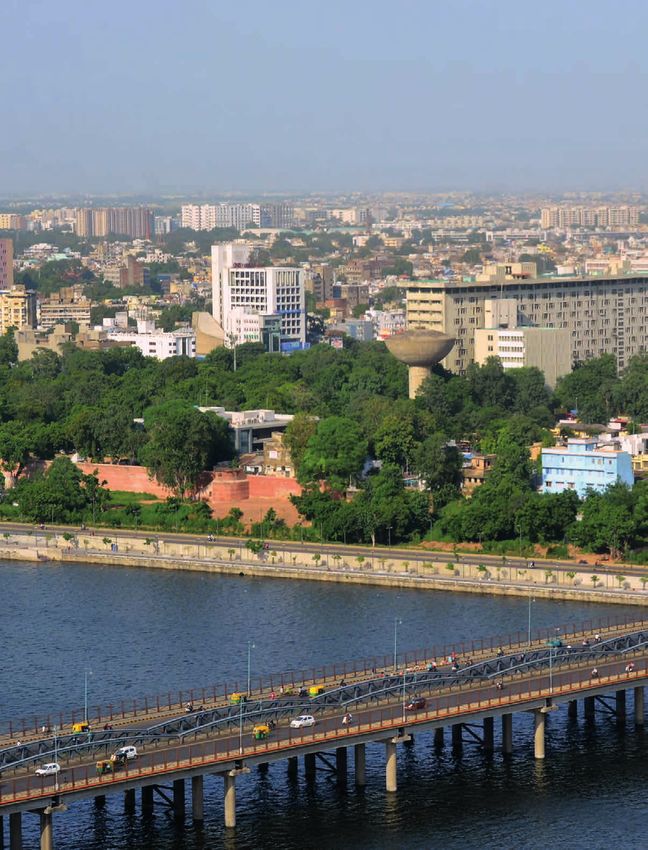
Ahmedabad is situated in west-central India on a generally flat plain along
both banks of the Sabarmati River. This strategic sitting amid a vast agricultural
catchment allowed the earlier primate city to expand uninhibited with a poly-
centric urban growth pattern. While this geography has provided Ahmedabad
significant development advantages, the relative ease of development has also
presented significant challenges to the meaningful coordination of strategies
and integration of the metropolitan area’s population growth.
During the early twentieth century, Ahmedabad gradually transformed from
its functional role as a center of trade and commerce to become a textile manu-
facturing hub, a “Manchester of the East.” As part of a national industrialization
policy,1 after the formation of Gujarat in 1960, the new state government planned
industrial townships near Ahmedabad2 industrial plots with basic amenities and
subsidies were built by the public sector to create jobs and shape the growth of
the city using area-based integrated urban planning. Ahmedabad drew migrant
laborers from Uttar Pradesh, Bihar, and Orissa (Yagnik and Sheth 2011).
During the 1960s, Ahmedabad served as the capital of Gujarat state, prior to
the creation of the new planned capital city of Gandhinagar. With the decline of
its textile industry in the 1980s, the historic city lost population as peri-urban
expansion occurred toward the western part of the city across the Sabarmati
River. Since 2000, the city area has further expanded beyond the municipal
corporation limits in the eastern and western metropolitan areas. The historic
core, a walled city, retains its rich built heritage with ‘pols’, a traditional housing
type, embedded within a dense urban morphology. This core was designated as
India’s first World Heritage City by UNESCO in 2017. Metropolitan Ahmedabad is
shown in Map 1.
1 The Industrial Policy Resolution was adopted by the Indian parliament in 1956. This resolution was a comprehensive
economic policy on the country’s industrial development and guided the development of urban manufacturing clusters for
several decades thereafter.
2 Three locations—at Naroda, Odhav, and Vatva in the far eastern part of the city—were identified for industrial development
and established by 1962.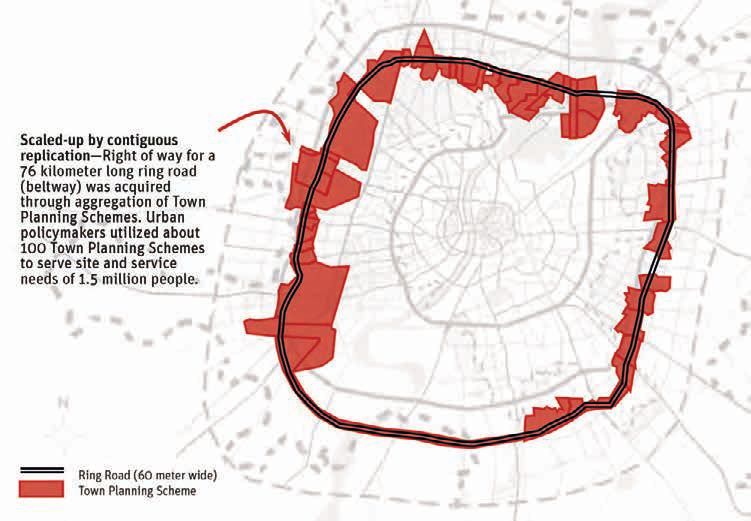
MAP 1
URBAN
EXPANSION
1985–2015
Urban extent by year

1866   1985   1990    1995   2000 2005   2010   2015

         AMDAVAD Municipal
        Corporation boundary

              District boundary

                     Primary road

SOURCES: GERMAN
AEROSPACE CENTER (DLR);
IDOM: NASA SRTM 30m;
OpenStreetMap Contributors

              4
MAP PROJECTION: UTM ZONE 42N,
WGS-84 DATUM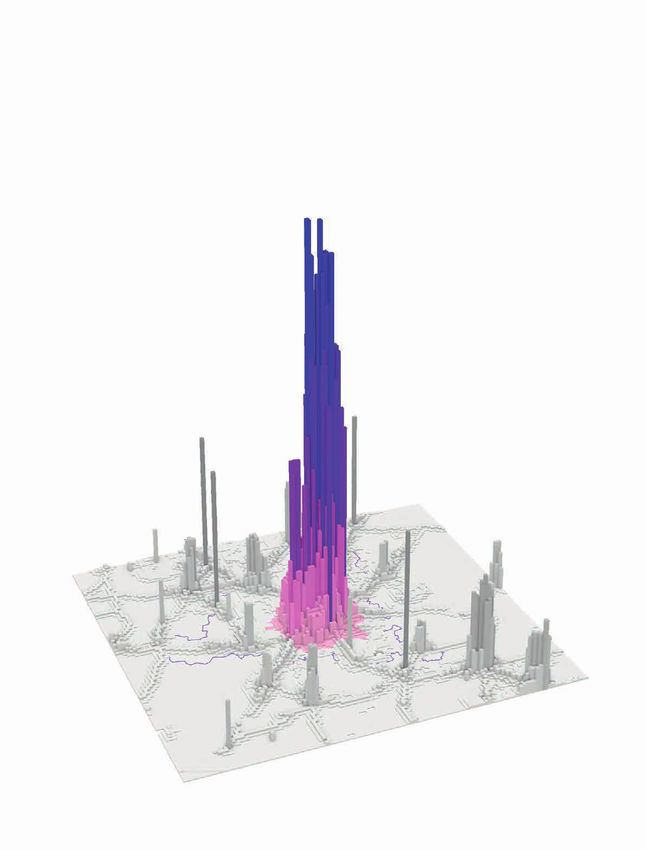
5   |    GREATER THAN PARTS

                                               Ahmedabad has experienced significant population growth in the last 30 years,
                                               as shown in Table 1, and today it ranks among the 19 fastest-growing cities in
                                               the world (Kotkin 2010). By 2030, Ahmedabad is expected to account for 21
                                               percent of Gujarat state’s urban population and 43 percent of its GDP (Sankhe et
                                               al. 2010). It has an export-led industrial economic base, mainly consisting of the
                                               pharmaceutical, chemical, textile, and garment industries.

        TABLE 1. POPULATION GROWTH, 1991–2019
                                                        City—                                  Metropolitan Area—
                                          Ahmedabad Municipal Corporation Limit        Ahmedabad Urban Development Authority

                                     1991          2001          2011        2019    1991        2001        2011         2019

        Population
                                   2.88             3.5          5.5          6.6     4          5.2          6.4         8.3
        (millions)

        Annual growth
                                      -             2.15         5.7          2.5     -          3.0          2.3         3.7
        rate (%)

Source: All data except for 2019               In rapidly urbanizing India, Ahmedabad, with a current population of 6 million
from the Census of India, 1991,
2001, 2011; the 2019 figure has                nested in an urban agglomeration of 7.6 million, is projected to become one of
been interpolated.
                                               seven Indian mega-cities by 2030 (UNDESA 2019). Metropolitan development
Note: Interpolation for 2019 based
on 2021’s projection for AMC                   is stimulated by mega-projects, such as Gujarat International Finance Tec-City,
in AUDA’s Draft Comprehensive
Development Report, 2021.                      Smart Mission projects, and the Delhi–Mumbai Industrial Corridor passing
                                               through the state of Gujarat in proximity to Ahmedabad. The city is a growing
                                               urban hub offering job opportunities and improving living conditions, and it has
                                               an active real estate market.
                                                  Metropolitan Ahmedabad, administered by the Ahmedabad Urban Devel-
                                               opment Authority (AUDA), includes the Ahmedabad Municipal Corporation
                                               (AMC),its rapidly expanding peri-urban areas, and its densely populated
                                               core walled city. These are shown in Maps 1 and 2. By 2031, the Ahmedabad
                                               urban agglomeration is expected to have a population of 1.66 million beyond
                                               the municipal jurisdiction. This increase in population is also expected to be
                                               accompanied by the spatial expansion of Ahmedabad.
                                                  Ahmedabad has curtailed sprawl, defying a global trend of declining urban
                                               population densities (Map 2). Between 2000 and 2013, while Ahmedabad’s
                                               population grew by 2.1 percent annually on average, the urban extent
                                               expanded at a slower pace of 1.9 percent every year (Angel et al. 2012). AUDA
                                               administers a metropolitan area of around 1,900 square kilometers, about a
                                               quarter of which is under AMC municipal jurisdiction. Since 2010, with the
Figure 3
3D population                                  announcement of the Sardar Patel Ring Road, the city has expanded along this
density distribution                           metropolitan beltway.
MAP 2
POPULATION
D E N S I T Y 2017
Population per square
kilometer
200 1,000 2,500 5,000 10,000 20,000
AMDAVAD Municipal
Corporation boundary
District boundary
Primary road
SOURCES: LANDSCAN; NASA
SRTM 30m; OpenStreetMap
Contributors
4
MAP PROJECTION: UTM ZONE 42N,
WGS-84 DATUM7 | GREATER THAN PARTS
Revenue
The AMC is increasing its financial autonomy. Actual municipal revenue for
the last three years has increased by one-third from $358 million to $408.8
million.3 While federal and state transfers to the AMC have been decreasing, its
own-source revenue has increased by an average of 23 percent per year, of which
the non-tax revenue has been increasing at a faster pace. There is potential to
further increase revenue. Over five consecutive fiscal years (2014–2018), the
AMC fell short—75 to 85 percent—of the targeted revenue collection set at the
beginning of the fiscal year. This shortfall is due to a combination of poor tax
administration, poor revenue collection, and overestimation.
Expenditure
For the fiscal year 2018–19, the AMC has a budget estimated at $986.73
million, which is equally divided into recurrent expenditures and capital
expenditures for urban asset development. For the last five years, the actual
capital expenditure components have been significantly lower than the budget
allocations—between 65 and 75 percent of the allocations for each year. Under
spending indicates the AMC’s inability to start or complete some projects on
time. Nevertheless, recurrent expenditure has been in the range of 85 to 90
percent of the proposed budget, due to regular payments for salaries, retirement
benefits, and other obligations of the AMC.
The AMC has developed a capital investment plan with 2031 as the horizon
year (Bhavsar 2018). With increasing municipal revenues, the city is expanding
investment for capital improvements in trunk infrastructure, including roads,
the bus rapid transit system (BRT), and the Sabarmati Riverfront Development.
For the riverfront project, the city has borrowed from financial institutions. The
AMC dedicates about 20 percent of its expenditure to service debt.
Under a national urban investment program, the Jawaharlal Nehru National
Urban Renewal Mission, the city received federal transfers for urban devel-
opment projects like the BRT system. These federal transfers were contingent
upon leveraging state and local government resources and expediting municipal
finance reforms that the AMC implemented. With a strengthening of municipal
finances, the city is able to tap capital markets and derive further value from
urban land.
The AMC pioneered municipal bond issuance and continues to generate
resources through market borrowing. It was the first municipal corporation in
India to issue a municipal bond without a state guarantee, which occurred in
1998 with a bond valued at $141.16 million. In January 2019 it raised about $28
million (Indian rupee 200 crore) for urban infrastructure development through
a municipal bond issuance.
3 Here and throughout this chapter, all dollar amounts refer to US dollars.AHMEDABAD: SCALING UP WITH CONTIGUOUS REPLICATION OF TOWN PLANNING SCHEMES | 8 EVOLUTION OF RESOURCES The city is expanding use of land value capture tools for financing urban development. The value of these land-based finance tools has been constantly increasing over the last few years and in fiscal year 2016 was nearly $211.74 million. The AMC’s share of municipal revenue collected from premium Floor Space Index (FSI)4 is increasing exponentially, from 10 percent in 2009 to 60 percent in 2016. Most of the premium FSI—to create higher-intensity urban development—is sold along the Transit Oriented Zone along the BRT and metro corridors. Since 2013, the contribution to revenue from development fees has also been increasing. The city owns substantial marketable land, which is estimated potentially to generate another $412 million per year. Since the AMC improved its property valuation, tax coverage, and collection, its property tax revenue has been steadily contributing about 20 percent of municipal revenue, and this is expected to increase. Integration HOW INTEGRATED PLANNING IS DEFINED AND ADOPTED Gujarat has a well-developed legislative framework for metropolitan-level integrated urban planning. The Gujarat Town Planning and Urban Development Act (GTPUDA) requires defining a metropolitan zone for planning purposes. That zone should far exceed the municipal limits of the primate city that is expected to experience urban growth. This enables better planning for the metropolitan agglomeration (Ballaney 2008). Urban planning in Gujarat is is a two part procedure outlined in the Town Planning Act. Part one of the process is to create a development plan for the entire metropolitan area. The second part is to prepare a town planning scheme for sub-sections of the development zone. The development plan outlines macro-level strategic direction for growth and envisions the integrated development of metropolitan infrastructure. This integrated urban development plan adopts a system of systems approach weaving together a wide range of issues from land development to land use zoning, to peri-urban expansion areas, to regulations to determine density and built form. It also identifies land for public uses, such as road network and transportation, water supply and sewerage, stormwater drainage, open spaces and green areas, environment and pollution control, and land reclamation. This decadal development plan is intermittently adjusted to reflect the ever-changing 4 Premium FSI is allowance for additional built area per plot of land offered at a fee.
9   |   GREATER THAN PARTS

                             metropolitan context. Public participation is part of the process of creating and
                             updating the development plan (Ballaney 2008).

                             The Town Planning Schemes
                             TPSs are parts of the development plan. On the metropolitan periphery, in
                             anticipation of urban expansion large tracks of land are identified and subdivid-
                             ed into one-to-two-square-kilometer patches. Then every such patch of one or
                             two square kilometer identified has a TPS (micro-plan) engaging up to 250 land
                             owners through rigorous and interactive public participatory processes. The
                             town planners utilize a combination of land pooling, readjustment, and land
                             deductions to reconfigure agriculture land parcels into rectilinear urban land
                             plots with access roads and land set aside for public purposes such as schools,
                             healthcare, parks, and affordable housing. Physical infrastructure systems
Town Planning
                             are designed and land value capture tools are utilized to finance the provision
Schemes are                  of these basic services that include access to electricity, water, transport,
a form of land               embedded in a mixed land-use configuration that integrates institutional,
readjustment for             recreational, commercial, and residential uses (Ballaney 2008; Mahadevia, Pai,
expanding urban              and Mahendra 2018).
                                In effect, the TPS is a form of land readjustment for expanding urban
infrastructure
                             infrastructure without any compulsory land acquisition. It is an equitable, par-
without any                  ticipatory, and cost-effective method of development and urban expansion that
compulsory land              provides amenities for trade and business activities for residential, commercial,
acquisition.                 and industrial areas in the city.

                             Implementation
                             Ahmedabad has combined the use of a development plan and TPSs to achieve
                             spatial and urban systems integration at the metropolitan scale. Both the develop-
                             ment plan and TPS are statutory plans, prepared at different scales and levels of
                             resolution. Under the provisions of the Gujarat Town Planning and Urban Devel-
                             opment Act of 1976, the state of Gujarat setup AUDA to guide metropolitan-level
                             development of the AMC and its 146 surrounding villages. The development plan
                             establishes a 20-year spatial coordination vision and framework to integrate
                             urban development with guidelines for urban systems coordination.

                             DEVELOPMENT PLANS
                             Ahmedabad’s development plan was first sanctioned in 1965 (DP1965) under
                             the Bombay Town Planning Act of 1954, and since then has been revised approx-
                             imately every 10 years. Upon each revision, AUDA’s limit has been increased and
                             new villages and municipalities have been included in the development area.
AHMEDABAD: SCALING UP WITH CONTIGUOUS REPLICATION OF TOWN PLANNING SCHEMES | 10
Similarly, the AMC also revises its boundaries periodically; in the last revision,
the AMC added 469 square kilometers of area to its boundary. This increases the
coverage of municipal services and amenities for the larger population outside
the original municipal limits.
Through the iterative revision of development plans (in 1965, 1975, and
1982 by the AMC and in 1987, 2002, and 2013 by AUDA), a successive pattern
of ring roads around the city and radial roads cutting through these concentric
roads have been built. A review of these successive development plans reveals
that implementation in the early years was weak, but has strengthened
overtime (Table 2).
TABLE 2. CHRONOLOGICAL PROGRESS OF AHMEDABAD’S DEVELOPMENT PLAN
AND IMPLEMENTATION, 1965–2014
Year Plan Issues/Remark
Development of eastern industrial areas of Naroda, Vatva and Odhav.
Establishment of planned industrial estate, Gujarat Industrial Development
1965 DP1965, AMC Corporation (GIDC) led to job opportunities and increases in population.
Informal and low-income residential areas came up outside the municipal boundary. AMC
proposed a green belt around the city to contain the development.
No action was taken for the implementation of DP1965 for land acquisition. Residential development
1975 Revised DP1975, AMC started to occur as infilling between the corridors and along the municipal boundary, hence the
land use of reserved land (previously for green belt) was changed to use for public housing.
As land acquisition failed, under GTPUDA the land could not be re-acquired /
re-designated if not acquired within 10 years of declaring intention. As one of the
1975 1987 DP2001, AUDA strategies to achieve the housing goal, the complete “green belt” area was reserved
for public housing by different agencies. Though many public housing projects were
not executed around the city, nor were they developed in the green belt area.
1997 DP2011, AUDA Applying the basis principle of TPS, AMC returned 50% of the plots back to the owners. Owners
filed a case against AMC. AMC vs Ahmedabad Greenbelt Khedut Mandal was resolved in 2013.
Finally, in the revised development plan of 1997, the land reserved for “public housing for different
government organizations” was de-reserved. The area was still proposed as “restricted residential
utility services and other uses zones.” In 1999, the plan was revised. All reservations were removed.
2002 Revised DP2011, AUDA The area was declared an R1 Zone (restricted residential utility services and other uses). The SP
Ring Road was proposed as a voluntary contribution of land owners to the city’s development.
Compensation at market rates was given after development of TPS in the areas around the ring road.
New schemes were proposed through the TPS mechanism, under which up to 50%
2014 New TPSs of land can be acquired by the authority for development of amenities.
Source: Compiled from DP (AMC) 1965, revised DP (AMC) 1975, DP (AUDA) 1987, DP (AUDA) 1997, revised DP (AUDA) 2011, SC (2014).11 | GREATER THAN PARTS
Why the city grew on the periphery
In Ahmedabad’s DP1965, a green belt 240 meters wide was proposed on private
agricultural land covering a total area of 8.4 square kilometers. At this time,
Ahmedabad had an area of just 93 square kilometers (AMC 1975) (it now has an
area of 1,900 square kilometers), of which the green belt covered 9 percent. The
main objective of the green belt was to restrict urban sprawl and regulate and
balance open versus built development. It was also meant to protect the natural
and semi-natural environment and act as a sink for urban pollution.
However, the green belt proposal met resistance from land owners, who
were unhappy with the compensation for land transfers and registered their
complaints in court. As a consequence, the AMC was unsuccessful in acquiring
the land. Over time, both land owners and non-land owners encroached on these
reserves to build houses. In 2013, the Supreme Court of India ordered that land
holdings be apportioned between land owners and the AMC in the amounts of
60 and 40 percent, respectively.5
Additionally, during the 1980s and 1990s the city rapidly expanded beyond
the municipal corporation limits, leading to fragmented urban expansion,
particularly along the western fringes of the city. This fragmented development
outside the city limits was partly attributed to the Urban Land Ceiling and
Regulation Act of 1976 (now repealed), under which the excess urban private
land was acquired by the government, thereby leading to an artificial increase in
land prices within the city limits. Consequently, formal housing development for
middle- and low-income households shifted outside the city limits, leading to
unregulated and haphazard development in the new areas, such as the western
villages of Bopal and Ambli.
Managing Sprawl: Ahmedabad Development Plan 2021
The Ahmedabad Development Plan 2021 (DP2021), with a horizon year of 2021,
envisions Ahmedabad as a livable, environmentally sustainable, and efficient city
for all its citizens, one with robust social and physical infrastructure, and a distinct
identity (AUDA 2014a). Half of the focus of the development plan of Ahmedabad
is related to setting metropolitan urban development goals, while the other half
is related to achieving the goals with plan implementation, coordination, and
management (Adhvaryu 2011). The overarching vision of the plan is in its planning
and growth management principles, including compact growth, land-use transport
integration, a green network, environmental sustainability, and affordable housing
development. The key approach taken in AUDA’s DP2021 is its use of zoning as a
planning tool, which has become important in helping to manage growth, regulate
density, and organize land use within the urban area. DP2021 is shown in Map 3.
5 This order was applicable to lands under the green belt in the Ahmedabad Development Plan 1965. By 2017, three draft TPSs
on the western green belt had been sanctioned by the government of Gujarat; they are now under implementation.AHMEDABAD: SCALING UP WITH CONTIGUOUS REPLICATION OF TOWN PLANNING SCHEMES | 12 Map 3 Ahmedabad Urban Development Authority draft development plan, 2021 Ahmedabad Development Plan 2021 incorporates several mechanisms to rein in Source: AUDA 2014b. sprawl and shape a compact city structure, with high density in zones having acces- sible public transport (ITDP 2013). The plan includes specific provisions to promote affordable housing. It also offers flexibility in permitted land use in each zone, thus retaining the mixed-land-use approach for urban planning. Some researchers have pointed to the dis-junctures between planning, governance, and poverty alleviation, because the plan did not integrate the concerns of the poor. That neglect may be attributed to the plan’s primary emphasis on land use allocation while neglecting socioeconomic disparities (Mahadevia, Joshi, and Sharma 2009). The development plan aims to achieve a desired density and has followed a graded-intensity zoning method in its planning. The R1 Zone is a high-intensity zone, which can be maximized with an overlay zone of transit-oriented development (TOD). The R2 Zone is a medium-intensity zone, located beyond the ring road. The
Swami Vivekananda Bridge,
previously known as
Ellis Bridge, was the first road
connection linking the western
and eastern parts of Ahmedabad
across the Sabarmati River.
Source: Tejas Patel/ 500px via
Getty Images.
15   |   GREATER THAN PARTS

                              R3 Zone is the primary residential area in the city, characterized by individual
                              housing such as bungalows and farmhouses. This last zone also permits such uses
                              as educational and cultural activities, party plots6, and public utility buildings.
                                 Local area plans are for the smallest unit of planning, making possible new develop-
                              ment on already built-upon land or in an area such as the heritage zones within the old
                              walled city. This mechanism works on the principle of incentivizing redevelopment and
                              encouraging compact development by increasing the FSI. At the same time, local area
                              plans also identify additional land to be acquired and rezoned as public right-of-way to
                              add new streets, improve pedestrian connectivity, and increase green cover.
                                 The revised development plan emphasizes some basic principles. Projects
Ahmedabad                     are designed to be fair and desirable for landholders, whose property rights are
                              respected. Projects are developed with a commitment to ensure legal feasibility,
Development Plan
                              financial viability for the development authority, and financial desirability of
2021 incorporates             developers interested in Public-Private Partnership (PPP) ventures.
several                          In the revised DP2021, overlay zones aim to steer urban expansion and popula-
mechanisms to                 tion density by utilizing TOD strategies, a central business district, and affordable
rein in sprawl and            housing zones. In these zones higher FSI has been proposed, and FSI-related
                              incentives are also suggested. The General Development Control Regulations (GDCR)
shape a compact
                              suggest that the revenue would be generated from the FSI proposed in the Transit
city structure,               Oriented Zone and be used for rapid public transport projects. Various categories of
with high density             new roads are proposed as part of improving connectivity in the local area.
in zones having                  In 2013, AUDA assembled a committee headed by the commissioner to
accessible public             decide the modalities for disposing of public land. The committee prepared the
                              land disposal regulation of 2013 for the leasing of public land, whereby the
transport.
                              committee decided the base price (based on the market price of land), which was
                              ratified by the standing committee (Government of Gujarat 2002). After this, the
                              land was put up for lease through an auction for a maximum lease of 99 years,
                              with the condition that the approved land use will be followed.
                                 Under DP2021 for the AUDA area, preparations for a physical network of roads
                              and infrastructure for developing the urban area have been completed. Likewise,
                              for city-level projects under the plan, land acquisition and preparation of
                              detailed TPSs have been completed. TPSs have also been developed to earmark
                              plots for public use and provide amenities for each plot.
                                 To implement the development plan, Ahmedabad has experimented with
                              several urban development interventions, resulting in a laboratory for learning,
                              as explained in Box 1. These interventions range from retaining traditional use
                              of pooling and readjustment—lessons gained from the earlier industrial worker
                              housing—to creative use of instruments such as additional FSI and the transfer
                              of development rights to induce private developer participation while improving
                              publicly provided metropolitan mass transit options.
                              6 A party plot is a large area of open land, often consisting of a small service building with changing rooms, toilets, storage, and
                              a hall, laid out for conducting social events like weddings and parties.
AHMEDABAD: SCALING UP WITH CONTIGUOUS REPLICATION OF TOWN PLANNING SCHEMES | 16 BOX 1. URBAN INNOVATIONS Peri-urban Sanand Industrial Estate At the metropolitan periphery, Sanand, a small municipality with 41,500 people, covering 41 square kilometers, was identified in Ahmedabad’s metropolitan development plan 2021 as a growth center and zoned for industrial use. The government of Gujarat acquired 5,000 acres of land from land owners—at prices greater than the market rate—to give momentum to industrial development. When Tata Motors built an automobile manufac- turing plant in 2008 for its low-cost compact car Nano, Sanand drew other manufacturers of automobile parts and accessories (Business Standard 2015). The area emerged as a rapidly developing industrial manufacturing cluster. As a result areas in close proximity to Sanand, particularly around the Sardar Patel Ring Road along the southwestern edge of Ahmedabad, have seen a boost in real estate development, which has dispersed the urban population toward Ahmedabad’s metropolitan periphery (Mishra 2016). Bus Rapid Transit System The bus rapid transit system (BRT) project was launched in 2009 to cover 88 kilometers. Ahmedabad BRT, also known as Janmarg, is operated by a munic- ipal corporation subsidiary. Prior to the BRT, the public transport operated by the city had limited routes and unreliable service. Ahmedabad BRT now caters each day to about 160,000 passengers, up from 25,000 passengers per day in 2009. The BRT has an operational fleet of 250 buses and 153 bus stations over a network of 88 kilometers, with an average bus speed of over 28 kilometers per hour, offering an efficient city-wide mobility option. Ahmedabad–Gandhinagar Metro Corridor The Ahmedabad–Gandhinagar Metro rail project will connect the eastern and western parts of the city (DMRC 2014). This rapid transit system will strengthen inter-municipal mobility in the metropolitan agglomeration and anticipates urban expansion along the metro corridor. As per the general development regulations, all land within 400 meters of the metro and BRT corridors is zoned for TOD with an enhanced FSI, thus intensifying the development along the transport corridors. This sort of urban densification linked with mobility investment succeeds in avoiding sprawl by crowding in integrated and compact development. FSI Incentives for Private Developers to Rehabilitate Slums Implementation of the Slum Rehabilitation Policy by the AMC started in March 2010 under a PPP with real estate developers. The main objective of this policy was to provide slum dwellers with clean, permanent housing
17   |   GREATER THAN PARTS

                              along with legal tenure. Under the scheme, the developers were provided
                              with higher FSI, which they could sell at market rates to generate resources
                              for building the slum redevelopment units. Kalish Nagar at Sabarmati
                              and Lakhudi Talavadi at Naranpura are successful examples of such
                              pilots (Government of Gujarat 2013). The city is ready for large-scale
                              redevelopment through intensified use of land (FSI), building connectivity,
                              and developing amenities. This private developer-led model builds on the
                              success of the integrated approach of the Slum Networking Project in the
                              1990s, which partnered with slum dwellers and the private and public
                              sectors to deliver better access to water, sanitation, education, health, and
                              livelihood opportunities. Thirty-four slum areas in Ahmedabad, represent-
                              ing about 11,500 households, benefitted from the initiative, which was
                              then scaled up in another 13 areas (WSP 2007).

                              Affordable Housing Zone
                              In 2013, AUDA sanctioned a zone for an affordable housing scheme in the
                              revised DP2021. This zone is proposed along the 73.5-kilometer stretch of
                              the SP Ring Road and is intended to accommodate an additional 1.5 million
                              residential units. The availability of this land for affordable housing and the
                              active role of private developers have given a boost to the housing sector and
                              increased the affordable housing supply in the city. Locations in the zone along
                              the ring road, like Bopal, Sheelaj, and Vaishnodevi Circle, became the prime
                              hubs for the mid-to low-segment home buyers and saw significant demand in
                              the real estate market (Economic Times 2019). Other affordable housing schemes
                              outside this zone were built in 2013 under the Mukhya Mantri GRUH Yojana
                              (Government of Gujarat 2013).

                              Sabarmati Riverfront Development
                              The Sabarmati Riverfront Development Authority generated city-level
                              open spaces along the river. In partnership with private developers, the
                              project is reclaiming 58,598 hectares of land along the riverfront, of which
                              21 percent is to be sold for residential and commercial development with
                              a revenue potential of $68.88 million (EPC 1998). The rest of the area is
                              proposed to be developed as green open space, sports facilities, and other
                              public areas. For the central business district to be developed along the riv-
                              erfront, a special FSI is provided. Additionally, the city has introduced use
                              of transferable development rights for compensating owners of cultural
                              heritage buildings and to encourage conservation of the urban morphology
                              of this historic walled city, which is situated along the riverfront and
                              designated a UNESCO World Heritage Site.
AHMEDABAD: SCALING UP WITH CONTIGUOUS REPLICATION OF TOWN PLANNING SCHEMES | 18
Figure 4 Sardar Patel Ring Road with aggregated town planning schemes
Source: Mehrotra 2020 with data
The city has a good network of roads totaling 2,399 kilometers. This includes from Government of Gujarat, India,
five rings and 17 major roads in a radial pattern, with a road density of 5.15 in Ballaney 2008.
kilometers per square kilometer covering 90 percent of the city. The network is
enhanced by 12 bridges across the Sabarmati River. Because the predominant
form of land use promoted by the development plan is mixed-use, the average
trip distance of 5.02 kilometers is significantly lower than that in other cities of
the same size in India.
The Sardar Patel Ring Road
The Sardar Patel Ring Road was conceptualized in the 2001 revised development
plan to facilitate integrated urban development along the metropolitan periph-
ery of Ahmedabad. AUDA envisaged the SP Ring Road along the outer periphery
as facilitating the movement of heavy regional traffic that does not need to enter
Ahmedabad. In developing this metropolitan beltway, as shown in Figure 1, it
adopted an integrated approach by aggregating a series of TPSs.
The SP Ring Road was launched as a PPP project to integrate the outer grow-
ing areas of the city and accommodate future urban growth. AUDA’s chairman at19 | GREATER THAN PARTS
the time motivated the land owners to take part in a PPP, recognizing the value
proposition of:
• private land values enhanced by infrastructure development;
• land owners being offered deductions for pooling and reconfiguring
their land; and
• land sales without immediate compensation for individual land parcels.
Land measurements and records were kept by AUDA, and land owners were
compensated after the SP Ring Road was built. This was possible due to several
meetings held by AUDA officials, led by the chairman, a political leader who
earned the trust of the landlords through a public engagement process.7
Demand for better infrastructure services and a need for expanded road
transportation soon emerged from the rapid real estate development along the
western section of the SP Ring Road. Industrial development along the eastern
axis of the ring road also drove up demand. The revised development plan 2001
responded by proposing the development of 64 square kilometers of urban land
within the ring road and a widening of the road. The 60-meter-wide ring road
was proposed to reduce traffic congestion on peripheral roads, separate regional
and urban traffic, increase connectivity, and steer the metropolitan expansion of
Ahmedabad (UMC 2007).
Widening this metropolitan beltway to four lanes in Phase 2 of the project
utilized a built-operation-transfer mechanism for private participation. The
construction and operation of this project resulted in planned development
and management of the rapidly urbanizing metropolitan fringe. Subsequently,
the clusters and locations along the SP Ring Road drew rapid real estate
development of residential and industrial areas at beltway intersections such
as Vatva, Narol, Vaishnodevi Circle, Bopal, and Jundal (Magicbricks 2016). The
automobile manufacturing industrial development clustered around Sanand
and the pharmaceutical industry development clustered at Changodar are also
attributable to the development of the SP Ring Road.
Town Planning Schemes
The TPSs are local-area or block-level plans, usually encompassing an area of
one to two square kilometres each. These are usually prepared on green-field
sites, consisting primarily of agricultural land that has been identified as a
prospective urban development area. Sometimes, the TPSs are also proposed
on areas that may already be facing haphazard development. Such areas, when
7 Discussion with Prof. Himanshu Thakkar, retired town planner, AUDA, on August 31, 2019.AHMEDABAD: SCALING UP WITH CONTIGUOUS REPLICATION OF TOWN PLANNING SCHEMES | 20 covered by TPS, can be provided with services and amenities and experience increases in land prices (AUDA 2014a). The preparation of development plans and TPSs follows a participatory process in which land owners are consulted at various stages, from the notification to the final valuation of their land and settlement. Throughout this process, margins are maintained along all the major roads and developed following the requirements of the area and budgetary provisions. This process gives the AMC positive control over the design and the timing of the urban growth, along with stakeholder participation at each stage. After the draft scheme is prepared, a meeting of land owners8 is called, and all are requested to give suggestions and raise objections if they have any. Based on the inputs received from land owners and other citizens, the draft TPS is finalized. The state government appoints a town planning officer, who issues individual notices to each land owner and finalizes the preliminary TPS. This officer works out the valuation for each land owner and provides a final plot number. Figure 2 lays out the normal sequence and timeline for the decisions necessary in designing and establishing each TPS. The TPS approach works at the micro-level by pooling all the land originally under different owners and redistributing it in a properly reconstituted form, after deducting the land required for open spaces, social infrastructure, services, housing for the economically weaker sections, and the road network. Land for public utilities and infrastructure is provided through a land-pooling mecha- nism, the government using 25 to 50 percent of the land for roads, open spaces, and other public purposes (including 5–10 percent of it for sale). The remaining 50 to 75 percent is returned to the original owners, who benefit from an increase in their land value. The original plots are returned to the landlords as final plots, each bearing a new land survey number for identification, known as its FP, or final plot number. The residents receive the final plots with all the new amenities and services. Each plot under the TPS has direct access to the road, thus increasing its potential market value. This process enables the local authority to develop the land without actually acquiring it, so the financial burden on the local body is reduced to a minimum as the development expenses get offset by the land generated for public purposes. Part of this public-purpose land is sold by the local authority to finance urban infrastructure development (see Figure 3). 8 The original owners of the landholding title, as cited in the land revenue documents.
21   |     GREATER THAN PARTS

Figure 5 Town planning scheme process and timeline

                                  Declaration of intent to prepare the TPS
                                  Surveys of area and boundary delineation
            Draft
                                  Publication of draft TPS
         (16 + 3 months,          Invitation of public objections/ suggestions regarding draft TPS
           if needed)
                                  Submission of draft TPS to state government
                                  Sanction of draft TPS by state government

                                  Appointment of TPO
                                  Preparation of preliminary TPS
                                  Laying out of roads and plot reconstitution
     Preliminary
                                  Hearing of grievances and appeals by the TPO on plot reconstitution
         (11 + 9 months,          Submission of preliminary TPS to state government for sanction
            if needed)
                                  Sanction of preliminary TPS by state government

                                  Tabulation of costs of infrastructure, betterment charges, and compensation
                                  Hearing of grievances and appeals by the TPO on financial issues
            Final                 Preparation of final TPS
           (4 months)             Sanction of final TPS

Source: Adapted from Mahadevia,      By adopting such an integrated urban development approach, the city has
Pai, and Mahendra 2018.
                                     implemented a planned and phased growth, equitably spread, and well connect-
                                     ed. Since 2000, the built-up area has spread in all directions along the transport
                                     corridors toward the five growth centers of Sanand and Kalol in the western
                                     part, Dehgam in the northeast, and Bareja and Memdabad in the southeast part
                                     of city. This is evident in the continuous and balanced spatial growth of the
                                     city along the SP Ring Road. The equitable and well-connected growth can be
                                     attributed to the well-thought-out mechanism of city planning that integrates
                                     the development plans with TPS and urban-level projects.

                                     ACTORS

                                     The Constitution of India states that all activities related to urban development,
                                     land development, and housing are in the domain of the state governments. The
                                     government of India, through its Ministry of Urban Development and Ministry
                                     of Housing, Poverty Alleviation and Employment, formulates the guidelines and
                                     provides financial assistance to certain centrally sponsored schemes, such as
                                     the Jawaharlal Nehru National Urban Renewal Mission, Rajiv Awas Yojna (RAY),
AHMEDABAD: SCALING UP WITH CONTIGUOUS REPLICATION OF TOWN PLANNING SCHEMES | 22
and Pradhan Mantri Awas Yojna-Urban (PMAY-U). These urban development To achieve
guidelines and fiscal transfers to finance projects evolve with the electoral cycles
integrated planning
and governance priorities.
At the state level, the Gujarat Department of Urban Development and Urban
in peri-urban
Housing (UD&UH) is headed by a minister (through an election to the state legis- areas outside
lative assembly) and is assisted by the senior administrative officials, primarily the boundaries
from the Indian administrative services. All the sub-organizations function of the municipal
as line departments directly under UD&UH; these include urban local bodies
corporation limits,
(e.g., municipal corporations, municip alities), urban development authorities,
the town planning and valuation departments, the Gujarat Municipal Finance
the state government
Board, and the Gujarat Housing Board. set up AUDA, which
has a jurisdiction
INSTITUTIONAL ARCHITECTURE
of 1,866 km2 and
The AMC is an administrative body covering 468.92 square kilometers. The is tasked with
area is part of the Ahmedabad City sub-district (taluka/tehsil) of 474.51 square
undertaking or
kilometers.9 This sub-district primarily consists of the AMC, with marginal
contributions from other urban and rural areas.
overseeing planned
To achieve the objective of integrated planning in peri-urban areas outside development and
the boundaries of the municipal corporation limits, the state government set-up growth across
AUDA. The development authority has a jurisdiction of 1,866 square kilometers all the rural and
and is tasked with undertaking or overseeing planned development and growth
urban local bodies
across all the rural and urban local bodies within its area. AUDA consists of
non-elected officials who are vested with planning powers, particularly concern-
within its area.
ing land use and infrastructure.
PRIVATE PARTICIPATION
Private real estate developers are building affordable housing to complement
the structured urban expansion and its associated infrastructure development.
The performance of the state housing board responsible for provision of housing
in urban areas has been severely inadequate (Dave 2003). Private developers10
9 Census 2011, Table A-1 (Number of Villages, Towns, Households, Population and Area).
10 According to the Gujarat Institute of Housing and Estate Developers Association (GIHED), there are about 450 developers
registered in Ahmedabad. Additionally, there are many developers who are not members of GIHED but contribute to the supply
of housing stock in the city.23 | GREATER THAN PARTS
fill the housing gap by building a range of housing types—from high-density
apartment complexes to standalone houses—to meet market demand.
Private developers were previously unable to access the affordable housing
development subsidies and grants available to the public sector (Srivastava
2015). Now, with the introduction of the PMAY-U (a national housing program),
there is a level playing field that offers incentives for affordable housing to the
private sector as well. The affordable housing zone along the SP Ring Road has
become the new hub for real estate.
Financing
FINANCING THE TOWN PLANNING SCHEMES
TPS implementation is financed through internal generation of resources. This
approach reserves a proportion of the land for AUDA and AMC to auction in the
open market for residential and commercial use. Funds generated through these
land sales are used by AUDA and AMC to finance the development of infrastruc-
ture in the local area. These TPS infrastructure construction expenditures are
recorded in the municipal budget under specific departments, such as for water
supply and road construction. Income from the sale of public land parcels is
accounted for as capital income.
AUDA financed the development of city-wide arterial road networks identified
under the development plan. To sustain such investments, AUDA continues to
accumulate funds, mainly through the sale of public land parcels, levies of improve-
ment charges, and the sale of FSI. As of March 2019, it had more than $150 million.
Commercializing unused or underutilized public land through sale or lease,
reclassification of land use, and enhanced density can unlock resources adequate
to finance city-wide infrastructure, slum upgrading, and slum prevention. A total
of about 33 square kilometers (about 12 square miles) of land in Ahmedabad is
public and marketable land (Ballaney et al. 2013). About one-third of this land is
vacant, owned by AMC, and located within an approved TPS area. Official govern-
ment records estimate the land value as in the range of Rs 20,000 to Rs 30,000
($278 to $417, averaging about $350) per square meter. The market value of this
public urban land is about 40 to 50 percent higher than the official estimates;
approximately $412 million.AHMEDABAD: SCALING UP WITH CONTIGUOUS REPLICATION OF TOWN PLANNING SCHEMES | 24 Global Environmental Benefits: Outcomes and Scale-up CURTAILING SPRAWL Metropolitan Ahmedabad has reduced the carbon footprint of its urbanization because of its curtailment of sprawl. Over three decades, 1990–2020, the densities within the urban built-up area and urban extent boundary have either increased or remained stable.11 This compact city development is achieved by converging the rate of land consumption to matching, or staying below, the pace of population growth (see Table 1).The Ahmedabad metropolitan area has combined the development plan and contiguous TPSs to intensify the utilization of existing peri-urban land. Between 2000 and 2013, Ahmedabad added about 52 square kilometers of built-up area. One-third of this area was in-filled within existing urban areas and another half was added as compact urban extensions on the periphery. Likewise, during the preceding decade (1989—2000), half was built up as infill and one-third was added through compact extensions (Atlas of Urban Expansion 2020). However, there is room for improvement. Some residential zoning has led to lower-density development with a patchwork of unintended green open spaces. The development plan 2021 has the R1 and R2 residential zones, limiting built area to a maximum of FSI 0.8 (ratio of floor area to total area). In these residen- tial zones, the built-up area (or ground coverage) makes up 40 percent of the plot area and construction is capped at two floors. DE-CARBONIZING MOBILITY Ahmedabad has twice the road density of Bangalore, allowing better access to land. By adopting a mixed-land-use approach to physical planning, Ahmedabad has formed itself into a polycentric urban structure with multiple destinations within its metropolitan area. Ahmedabad has de-carbonized its urban mobility, with average trip lengths of about 5 kilometers, as compared to 8 kilometers in Bangalore, which has comparable population densities (Table 3). 11 Angel et al., 2012; Atlas of Urban Expansion, 2020.
25     |    GREATER THAN PARTS

     TABLE 3. AVERAGE TRIP LENGTH AND ROAD DENSITY, AHMEDABAD VS BANGALORE
                                                                                                                              Road density
                           Density (people per                                                                                (Road length in kilometers
     City                  square kilometer)                        Average trip length (km)                                  per square kilometer)

     Ahmedabad                          12,000                                             5.02                                                 5.15

     Bangalore                          11,800                                             7.79                                                 2.47

     Source: World Bank analysis, based on data from the Census of India (2011), Ministry of Urban Development, Government of India; World Resources Institute; AMC;
     and Bruhat Bengaluru MahanagaraPalike (Center of Excellence in Urban Transport–CEPT University 2013).

                                              The modal share of public transport has nearly doubled in the last decade and
                                              is expected to grow further with up-zoning—increasing FSI—along transport
                                              routes. With the introduction of a BRT in the city between 2008 and 2018, the
                                              modal share of public transport grew from 10 to 17 percent. The Ahmedabad
                                              metro rail service initiated operations in 2019 and is expected to contribute
                                              to expanding public transport options. Non-motorized transport—walking and
                                              cycling—accounts for 46 percent of the modal share.

                                              MITIGATING MUNICIPAL EMISSIONS
                                              Ahmedabad Municipal Corporation produces about 700,000 tons of carbon
                                              dioxide-equivalent (CO2) emissions each year. These emissions are associated
                                              with AMC’s direct provision of city services, like water treatment and supply,
                                              wastewater collection and treatment, solid waste collection and management,
                                              and public transport services (Ahmedabad Municipal Transport Service and
                                              BRT).
                                                 AMC aims to become carbon-neutral, with a near-term target of reducing
                                              carbon emissions by 54 percent by 2025 (TOI 2019). To achieve its carbon
                                              neutrality, the city has outlined a de-carbonization pathway with eight goals
                                              (IIMA et al. 2009). The plan adopts specific time-bound targets, to include:
                                                    • using renewable wind energy to cater to almost 50 percent of the AMC area;
                                                    • installing rooftop solar power systems on public buildings;
                                                    • reusing 70 percent of treated wastewater;
                                                    • adopting energy efficient wastewater treatment technology;
                                                    • utilizing circular economy approaches to become a “zero waste city” by 2022;
                                                    • making a 100 percent switch to electric vehicles;
                                                    • increasing green cover from 25,000 to 1 million trees; and
                                                    • adopting green building standards for affordable housing.
You can also read