Review of Whakatane and Ohope Residential Growth Strategy 2009
←
→
Page content transcription
If your browser does not render page correctly, please read the page content below
Report

Review of Whakatane and Ohope Residential Growth
Strategy 2009
Prepared for Whakatane District Council (Client)

By Beca Carter Hollings & Ferner Ltd (Beca)

23 July 2009

© Beca 2009 (unless Beca has expressly agreed otherwise with the Client in writing).

This report has been prepared by Beca on the specific instructions of our Client. It is solely
for our Client’s use for the purpose for which it is intended in accordance with the agreed
scope of work. Any use or reliance by any person contrary to the above, to which Beca has
not given its prior written consent, is at that person's own risk.
Review of Whakatane and Ohope Residential Growth Strategy 2009

Table of Contents
1     Introduction.............................................................................................................1
      1.1     Background ................................................................................................................. 1
      1.2     Purpose of Report ....................................................................................................... 1
      1.3     History of Growth Options ........................................................................................... 1
      1.4     Methodology ................................................................................................................ 4
      1.5     Structure of Report ...................................................................................................... 5
2     Strategic Direction..................................................................................................6
3     Population Profile and Future Demands ..............................................................8
      3.1     Introduction.................................................................................................................. 8
      3.2     Population Profile ...................................................................................................... 10
      3.3     Dwelling Profile.......................................................................................................... 18
      3.4     Housing Affordability.................................................................................................. 28
      3.5     Summary ................................................................................................................... 30
4     Capacity of Residential Zoned Land...................................................................31
      4.1     Vacant Land .............................................................................................................. 31
      4.2     Infill Potential within the Residential Zone................................................................. 32
      4.3     Land with Subdivision Potential................................................................................. 33
      4.4     Summary of Existing Residential Land Supply in 2016 and 2021 ............................ 33
      4.5     Matching Demand and Supply .................................................................................. 34
      4.6     Summary ................................................................................................................... 35
5     Constraints and Opportunities............................................................................36
      5.1     Introduction................................................................................................................ 36
      5.2     Study Areas ............................................................................................................... 36
      5.3     Infrastructure ............................................................................................................. 38
      5.4     Land Tenure .............................................................................................................. 41
      5.5     Environmental............................................................................................................ 42
      5.6     Social and Cultural .................................................................................................... 48
      5.7     Summary ................................................................................................................... 52
6     Assessment of Future Growth Options..............................................................54
      6.1     Introduction................................................................................................................ 54
      6.2     Future Growth Options .............................................................................................. 54
      6.3     Assessment Criteria .................................................................................................. 58
      6.4     Comparative Assessment of Options ........................................................................ 64
      6.5     Summary of Growth Options Assessment ................................................................ 66
7     Preferred Options .................................................................................................67
      7.1     Staging....................................................................................................................... 67

                                                                                                                        Beca // 23 July 2009 // Page ii
                                                                                                                     4251415 // NZ1-1904026-15 0.15
Review of Whakatane and Ohope Residential Growth Strategy 2009
List of Figures
Figure 1.1 – Future Growth Options in Whakatane Urban Area .......................................................................... 3
Figure 3.1 – CAU Boundaries (2001 Census Base) ............................................................................................ 9
Figure 3.2 – Whakatane District Age Groups by CAU (2006 Census) .............................................................. 12
Figure 3.3 – Whakatane District Projected Population Growth Scenarios (2006-2031) .................................... 17
Figure 3.4 – Whakatane Urban Area Projected Population Figures (2006-2031) ............................................. 18
Figure 3.5 – Occupancy for Dwellings – Whakatane District (2006 Census) .................................................... 20
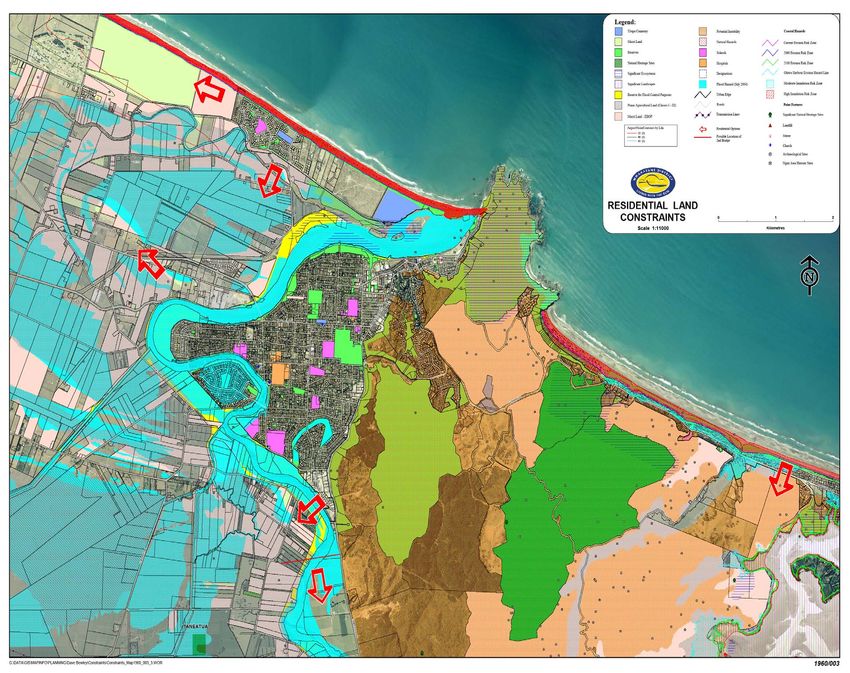
Figure 5.1 – Constraints to Development Mapping ........................................................................................... 37
Figure 6.1 – Option 1: Coastlands.................................................................................................................... 55
Figure 6.2 – Option 4: Black’s Farm ................................................................................................................. 56
Figure 6.3 – Option 7/8: Maraetotara Valley..................................................................................................... 57
Figure 6.4 – Option 11: Medium Density Inner Town (CBD) ............................................................................ 57
Figure 6.5 – Option 11: Medium Density Inner Town (Kope) ........................................................................... 58
List of Tables
Table 3.1 – Whakatane District Population Growth 2001-2006......................................................................... 10
Table 3.2 – Urban Area Population ................................................................................................................... 11
Table 3.3 – Whakatane District Population Age ................................................................................................ 12
Table 3.4 – Ethnicity – Whakatane District (2001-2006) ................................................................................... 14
Table 3.5 – Labour Status by Census Area Unit ............................................................................................... 14
Table 3.6 – Whakatane District Income Range (2001-2006)............................................................................. 16
Table 3.7 – Whakatane Urban Area Personal Income Range (2006) ............................................................... 16
Table 3.8 – Average Occupants per Dwelling ................................................................................................... 19
Table 3.9 – Household Composition – CAUs (2006 Census)............................................................................ 21
Table 3.10 – Number of New Dwellings in Whakatane Urban Area (2006-2008).............................................. 22
Table 3.11 – Urban Infill Development 2000-2006 ............................................................................................ 23
Table 3.12 – Preliminary Household Projections – Whakatane District (2011-2021) ........................................ 25
Table 3.13 – Projected Additional Households – Whakatane District................................................................ 25
Table 3.14 – Preliminary Household Projections – Urban Whakatane (2011-2021) ......................................... 26
Table 3.15 – Projected Additional Households – Urban Whakatane ................................................................. 26
Table 3.16 – Comparison of Dwelling Projections for Whakatane Urban Area ................................................. 27
Table 3.17 – Housing Data for Urban Whakatane, 2006 Census...................................................................... 28
Table 3.18 – Average Rateable Values in urban Whakatane (2007) ................................................................ 29
Table 4.1 – Vacant Land ................................................................................................................................... 31
Table 4.2 – Land with Infill Potential.................................................................................................................. 32
Table 4.3 – Land with Subdivision Potential...................................................................................................... 33
Table 4.4 – Existing Residential Land Supply (available at 2016) ..................................................................... 34
Table 4.5 – Demand and Supply ....................................................................................................................... 35
Table 5.1 – Reserves Provision......................................................................................................................... 50
Table 6.1 – Future Growth Options ................................................................................................................... 54
Table 6.2 – Comparative Assessment of Whakatane Residential Growth Options ........................................... 60
Table 6.3 – Summary Assessment for each Growth Option.............................................................................. 64
Table 7.1 – Fu ture Urban Growth Demand and Available Supply .................................................................... 68
Beca // 23 July 2009 // Page iii
4251415 // NZ1-1904026-15 0.15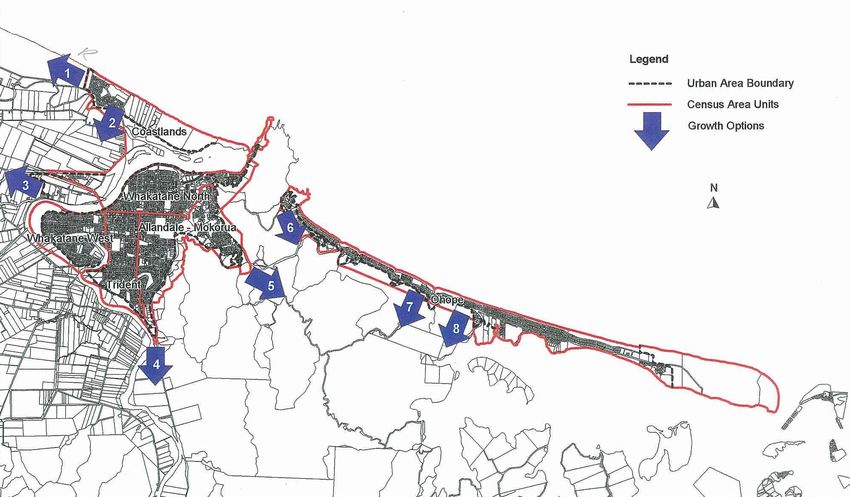
Review of Whakatane and Ohope Residential Growth Strategy 2009

Appendices
Appendix A - Thornton Opportunities and Constraints Data

                                                                    Beca // 23 July 2009 // Page iv
                                                                 4251415 // NZ1-1904026-15 0.15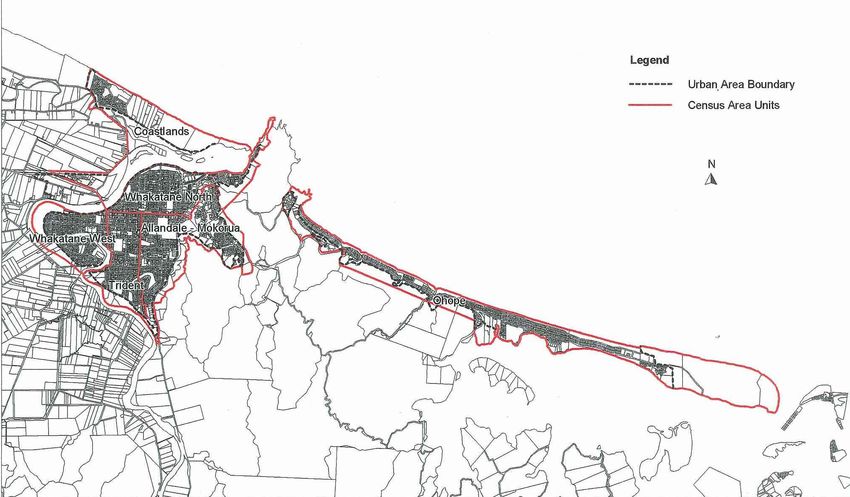
Review of Whakatane and Ohope Residential Growth Strategy 2009

1        Introduction

1.1      Background

In late 1997, Whakatane District Council (WDC) commissioned Beca Carter Hollings & Ferner Ltd
(Beca) to prepare a Residential Growth Strategy for Whakatane and Ohope for the next 20 years.
The Strategy was published in September 2000.

The study assessed eight different options for future greenfield residential development based on
an infill rate of 30% and the uptake of existing vacant land within Trident and Whakatane (North and
West). It was estimated at the time that between 20 to 30 hectares of new residential greenfield
areas would be needed to support the predicted level of housing growth in Whakatane and Ohope
for the coming 20 years. From the eight options investigated, two preferred sites were identified.
These were Piripai West (Coastlands) and Pohutukawa Avenue East (Ohope).

Since this study was undertaken in 2000, Beca has been asked to review the Residential Growth
Strategy in light of more recent statistical data (Census 2006) and the completion of a number of
other development strategies for the Council. Key information of relevance to this strategy includes
the full findings from the 2001 and 2006 Census; latest population projections (2007); the significant
flood events in July 2004 and May 2005; recent retail developments including “the Hub”
development on State Highway 30; changes in housing preferences; harbour developments; a
transportation study; an industrial land strategy; and updated building consent data.

1.2      Purpose of Report

The purpose of this report is to review the Whakatane and Ohope Residential Growth Strategy that
was completed in September 2000 for the WDC. The report uses census data from both 2001 and
2006 and WDC building consent statistics (2000-2008) to review the eight development area
options. In addition, the review of the strategy includes an analysis of a number of other locations
that Council has requested be investigated. The report concludes by identifying the preferred sites
for future residential growth of the Whakatane and Ohope urban area. It is intended that the public
be consulted on the findings of this study prior to decisions being made on changes to zone
boundaries.

1.3      History of Growth Options

In the original Residential Growth Strategy for Whakatane and Ohope (September 2000), the
following eight future growth location options were examined with regards to infrastructure, natural
hazards, environmental, social and cultural constraints and opportunities:

      1. Piripai West (Coastlands)
      2. Keepa Road
      3. Board Mills West
      4. Whakatane South
      5. Mokorua East
      6. Kohi Point South
      7. Maraetotara/Bluett Road
      8. Pohutukawa Avenue East.

                                                                                    Beca // 23 July 2009 // Page 1
                                                                                 4251415 // NZ1-1904026-15 0.15
Review of Whakatane and Ohope Residential Growth Strategy 2009
These have been revisited and updated with the latest constraints and opportunities information,
including natural hazards data associated with the significant flood events in July 2004 and May
2005.
Two additional sites at Thornton and Edgecumbe were also added to the review process. However,
upon preliminary analysis, Thornton was then discarded as an option due to its distance from
central Whakatane, anticipated increased demands upon existing community facilities and the need
for costly water and wastewater infrastructure and stopbank upgrades.
In this July 2009 update, the original eight future growth location options, plus Edgecumbe, plus two
additional options (Rewatu Road and medium density development in CBD and Kopeopeo) have
been assessed against the 2001 and 2006 Census, building consent data and other Council
strategy documents including a transportation study and an industrial land strategy.
These eleven options are:
1. Coastlands
2. Keepa Road
3. Board Mills West
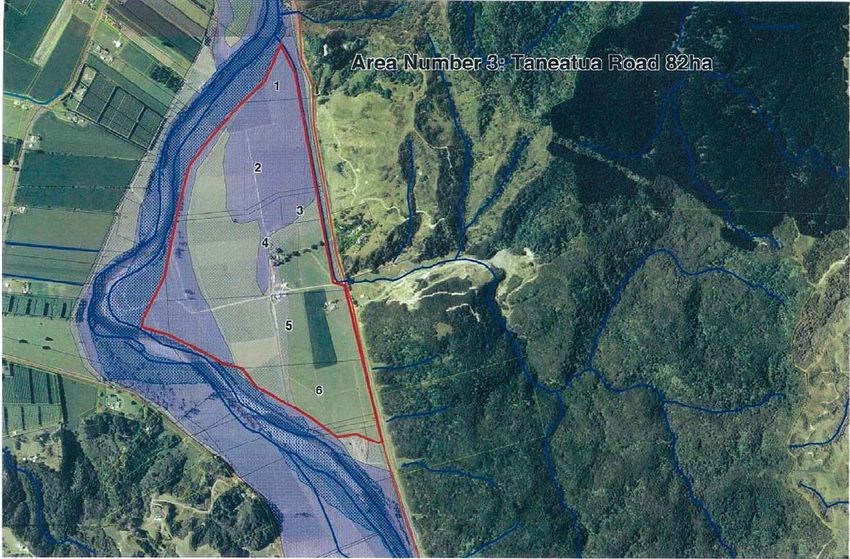
4. Whakatane South/Taneatua Road
5. Mokorua East
6. Kohi Point South
7. Maraetotara/Bluett Road
8. Pohutukawa Avenue East
9. Edgecumbe
10. Rewatu Road
11. Medium density infill (CBD & Kopeopeo).
These options are shown in Figure 1.1 on the following page and are assessed in chapter 6 of this
report.
Beca // 23 July 2009 // Page 2
4251415 // NZ1-1904026-15 0.15
Review of Whakatane and Ohope Residential Growth Strategy 2009

                                                         Figure 1.1 – Future Growth Options in Whakatane Urban Area

                                            11

 10

                                                                                                                         Beca // 23 July 2009 // Page 3
                                                                                                                      4251415 // NZ1-1904026-15 0.15
Review of Whakatane and Ohope Residential Growth Strategy 2009
1.4 Methodology
The methodology used in this report is similar to that which formed the basis of the 2000
Residential Growth Strategy.
This review has been undertaken in the following three phases:
Phase One – Review of Information
Phase One involved a review of the latest information available for the Whakatane District,
including:
Updating census data to reflect revised 2001 and 2006 Census data; and
Reassessment of the projected number of dwellings likely to be required over the next 20
years in Whakatane and Ohope urban areas, and calculation of a total land area required for
future residential development.
Phase Two – Identify Future Demand
Phase Two required the identification of future housing demand, based on an opportunities and
constraints analysis of the areas under scrutiny. This phase included:
Updating of Council GIS data and plots with particular emphasis on natural hazards, on the
basis of recent flood and land instability events in the study area;
Assessment of roading, water, sewer and stormwater spare capacity;
Updating of the assessments of the options under review; and
Reconsideration of constraints and opportunities plan (including natural hazards data such
as flooding, inundation and land instability).
Phase Three – Assessment of Options
Phase Three required an assessment of the options for future residential growth in the area
surrounding urban Whakatane including:
Consideration of assessment criteria in light of recent Council strategies (including
transportation, industrial retail and the Harbour Development Strategy);
Assessment of the various options;
Consultation with landowners and general public (yet to be undertaken); and
Recommendation of any statutory tools that should be considered.
Beca // 23 July 2009 // Page 4
4251415 // NZ1-1904026-15 0.15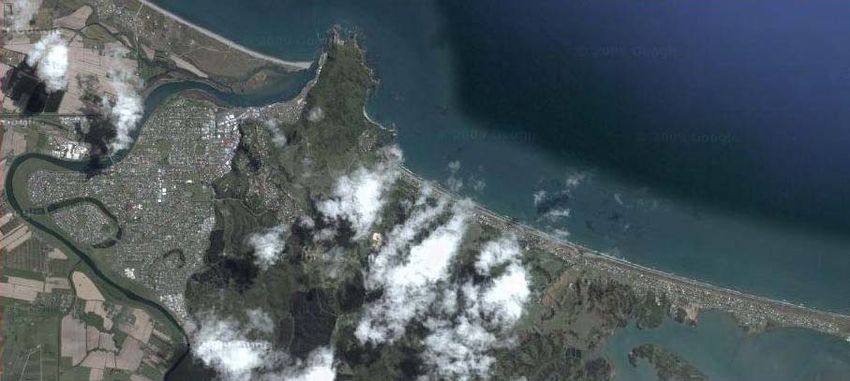
Review of Whakatane and Ohope Residential Growth Strategy 2009

1.5      Structure of Report

The structure of the report is as follows:

Section 1         Introduction                       Outlines background and purpose of this report in
                                                     relation to the original 2000 Strategy, as well as the
                                                     methodology implemented for undertaking the review of
                                                     the Strategy.
Section 2         Strategic Direction                Describes the strategic issues facing the District as a
                                                     whole as well as the Whakatane and Ohope study area.
Section 3         Population Profile and             Reviews the nature of the future Whakatane and Ohope
                  Future Demands                     population and subsequent demand expected for
                                                     housing and reserves using 2001 and 2006 Census data.
Section 4         Capacity of Residential            Reviews current land supply against future demand for
                  Zoned Land                         Whakatane and Ohope.
Section 5         Constraints and                    Analyses the results of sections 3 and 4 to identify
                  Opportunities                      whether (and where) urban expansion is needed.
Section 6         Assessment of Future               Greenfield options for meeting future demands for
                  Growth Options                     housing are identified and assessed. The costs and
                                                     benefits of these options are compared, resulting in the
                                                     identification of preferred options.
Section 7         Preferred Options                  Indentifies the recommended options for future growth in
                                                     the Whakatane urban area, and the next stages required
                                                     to investigate further.

                                                                                           Beca // 23 July 2009 // Page 5
                                                                                        4251415 // NZ1-1904026-15 0.15
Review of Whakatane and Ohope Residential Growth Strategy 2009
2 Strategic Direction
WDC has prepared, or is in the process of finalising, a number of documents that provide a
strategic direction for future growth in the District. These include:
Whakatane Retail Strategy (prepared and adopted late 2005);
Industrial Land Strategy (joint Whakatane and Kawerau Districts 2007);
Whakatane Transportation Study, including Whakatane Township Network Investigation
Report (August 2007); State Highway 2 Alternative Routes Scoping Study (2008); and
Walking and Cycling Strategy (October 2007);
Whakatane Airport Master Plan (2008)
Harbour Development Strategy;
Whakatane Proposed District Plan;
Whakatane Long Term Council Community Plan 2009-2019.
Another study that has a bearing on this strategy is the study on affordable housing that was
recently prepared for the BOP region by the Centre for Housing Research Aotearoa New
Zealand (CHRANZ), “Affordable Housing in the Bay of Plenty Region – A Solutions Study”
(August 2007).
These documents identify a number of issues of relevance to the future growth of Whakatane
and Ohope, including:
The need to identify land for future residential development, including both greenfield
residential and in-fill development;
The need for a strong working relationship between Kawerau District Council and
Whakatane District Council, particularly in light of the findings of the Industrial Land Strategy;
Coastal parts of the District will continue to experience considerable development pressure;
The need to consider the roading implications of further residential growth west of the
Whakatane River, including whether another bridge is required and where such a bridge
should be located to assist in providing State Highway route security to Whakatane;
The need to provide choice including affordable housing;
Demand for apartment complexes and more intensive development;
The development of larger floor retailing in Whakatane, such as ‘The Hub’ on State
Highway 30;
Need to develop a long-term vision for industrial land use in Whakatane and Kawerau,
including a “hierarchy” of industrial areas and an Economic Development strategy to
encourage new business into the districts;
Potential relocation of sewage treatment plant away from western entrance to Whakatane,
and consideration of alternative disposal system;
Reticulation of water supply for all areas east of Rangitaiki River, Te Teko and Edgecumbe
townships; and
Planned improvements in recreation and leisure activities over the next ten years.
Beca // 23 July 2009 // Page 6
4251415 // NZ1-1904026-15 0.15Review of Whakatane and Ohope Residential Growth Strategy 2009
The Proposed District Plan acknowledges that rural settlements (such as Edgecumbe and
Murupara) have sufficient land to accommodate expected growth for the next twenty years, and
seeks to identify land suitable for urban growth in Whakatane and Ohope, albeit that
Edgecumbe has been considered as an option for urban growth as a “dormitory suburb” to
Whakatane.
Beca // 23 July 2009 // Page 7
4251415 // NZ1-1904026-15 0.15Review of Whakatane and Ohope Residential Growth Strategy 2009
3 Population Profile and Future Demands
3.1 Introduction
This section of the report provides an overview of population and housing trends in the District
with the objective of determining the future demand for residential growth in urban Whakatane
and Ohope.
In order to undertake this assessment a number of sources have been used. These include:
2001 Census (i.e. March 2001) data from Statistics New Zealand;
2006 Census (i.e. March 2006) data from Statistics New Zealand and statistical analysis
undertaken by Sean Bevin from Economic Solutions Ltd;
Population projections from Statistics New Zealand, using 2006 Census data base (i.e. using
June years), cited as ‘Population Projections, 2006 (base) - 2031’;
The EBOP-commissioned report prepared by University of Waikato, entitled ‘Demographic
Forecast 2051: Movement and change in population and households in the Bay of Plenty’,
August 2006;
Household projections from Statistics New Zealand, prepared using 2006 Census data, cited
as ‘Area Unit Population Projections by Territorial Authorities, Age and Sex, 2006(base)-
2031’; and
Building consent statistics, from WDC, updated to June 2008.
Figure 3.1 shows the scope of the Whakatane Urban Area as defined for the purposes of the
2000 Growth Strategy. Within this study, the Whakatane Urban Area is assumed to be the
same, and consists of the following Census Area Units (CAUs):
Coastlands;
Whakatane North;
Whakatane West;
Trident;
Allandale – Mokorua; and
Ohope1.
All assessments of population characteristics have used the ‘Population Usually Resident’2, as it
excludes temporary fluctuations in population numbers (for example, due to people visiting an
area for a holiday, business, or some other extraordinary event).
1
The CAU Port Ohope has been excluded from this assessment as it has a population usually resident of
0 as at the 2001 Census.
2
The Population Usually Resident refers to the population that has resided in a given subject area for
more than three months, with the exception of school boarders (whose usual residence is defined as their
home when not at school).
Beca // 23 July 2009 // Page 8
4251415 // NZ1-1904026-15 0.15Review of Whakatane and Ohope Residential Growth Strategy 2009
Figure 3.1 – CAU Boundaries (2001 Census Base)
Beca // 23 July 2009 // Page 9
4251415 // NZ1-1904026-15 0.15Review of Whakatane and Ohope Residential Growth Strategy 2009
3.2 Population Profile
3.2.1 District-wide Population
At the time of the 2006 Census the usually resident population of the Whakatane District was
33,300 (16,956 female and 16,341 male) – an increase of 435 or 1.3% on the 2001 Census
figure, against a national population gain of 7.8%, and a Bay of Plenty regional population gain
of 7.5% for the 2001-2006 period. In comparison, the Whakatane District population suffered a
decline in the region of -312 people or -0.9% between 1996-2001. However, during the last
census period, the Whakatane District recorded the fourth highest rate of population gain out of
the six districts in the Bay of Plenty region.
The growth and decline of population within the Whakatane District over the 2001-2006 Census
period varies by locality (see Table 3.1 below).
Table 3.1 – Whakatane District Population Growth 2001-2006
2001 2006 Change % growth Ave. Ave.
CAU Pop. Pop. in Pop. in Pop. annual annual
change growth %
Ohope 2760 2856 96 3.5% 19 0.7%
Matata 666 642 -24 -3.6% -5 -0.7%
Taneatua Community 753 792 39 5.2% 8 1.0%
Edgecumbe Community 1668 1626 -42 -2.5% -8 -0.5%
Te Teko 630 627 -3 -0.5% -1 -0.1%
Whakatane North 3141 3114 -27 -0.9% -5 -0.2%
Coastlands 636 873 237 37.3% 47 7.5%
Whakatane West 3057 3084 27 0.9% 5 0.2%
Trident 3093 3159 66 2.1% 13 0.4%
Allandale-Mokorua 3819 3867 48 1.3% 10 0.3%
Orini 585 576 -9 -1.5% -2 -0.3%
Maraetotara 96 108 12 12.5% 2 2.5%
Poroporo 588 570 -18 -3.1% -4 -0.6%
Otakiri 3585 3609 24 0.7% 5 0.1%
Rotoma 1716 1863 147 8.6% 29 1.7%
Matahina-Minginui 1584 1464 -120 -7.6% -24 -1.5%
Waimana 654 615 -39 -6.0% -8 -1.2%
Urewera 1875 2022 147 7.8% 29 1.6%
Murupara 1962 1836 -126 -6.4% -25 -1.3%
TOTAL 32,868 33,303 435 1.3% 87 0.3%
Note: ‘2001 pop’ & ‘2006 pop’ data based on actual census data (March-Feb year).
Beca // 23 July 2009 // Page 10
4251415 // NZ1-1904026-15 0.15Review of Whakatane and Ohope Residential Growth Strategy 2009
In general, the Whakatane Urban Area has experienced population growth, while many rural
areas have experienced population decline. The highest rate of population growth occurred in
Coastlands (7.5%), which reflects the national trend of people moving closer to the coast.
3.2.2 Whakatane Urban Area Population
The population of the Whakatane Urban Area in 2006 was 16,953. This is an increase of 2.7%
since the 2001 Census. Between 1996 and 2001 the population of the urban area rose by
1.8%, and between 1991 and 1996 when there was a 4.5% increase in the population of the
urban area.
Table 3.2 – Urban Area Population
Whakatane Urban Area Census Population Usually Rate of Growth
Resident
1986 14,899
1991 15,510 4.1%
1996 16,212 4.5%
2001 16,506 1.8%
2006 16,953 2.7%
20 Year Average 3.3%
3.2.3 Age Structure
Table 3.3 summarises Whakatane District age groups from 1986 to 2006. While the proportion
of those aged between 15 and 64 years has remained relatively constant, at between 61.4%
and 62.6%, there is a declining proportion of the population in the 0-14 year age group (30.2%
in 1986 dropping to 25.5% in 2006. At the same time, the proportion of the population aged
over 65 years is increasing (from 7.9% in 1986 to 12.6% in 2006, which is 0.3% higher than the
national average). The trend of a declining younger population and an increase in the older
members of the community reflects the national trend of an aging population; with decreasing
birth rates and increased life expectancy.
Furthermore, there has been a drop in the younger members of the labour force, presumably
due to people leaving the area to find work and seek further education. For example, in 1991,
those 15-19 year olds (born between 1971-1976) who had just entered or were about to enter
the workforce or tertiary education numbered 2,910. Ten years on, the adjusted age group of
25-29 year olds (born 1971-1976) numbered 1,947. The loss of young people to other areas,
and the loss of children they will have in the future, indicates that population within Whakatane
could age at a faster rate than the country as a whole.
Beca // 23 July 2009 // Page 11
4251415 // NZ1-1904026-15 0.15Review of Whakatane and Ohope Residential Growth Strategy 2009
Table 3.3 – Whakatane District Population Age
Year % 0-14 yrs % 15-64 yrs % 65+ yrs
1986 30.2 62 7.9
1991 28.3 62.6 9.2
1996 27.6 62 10.3
2001 27.2 61.4 11.4
2006 25.5 61.9 12.6
New Zealand (2006) 21.5 66.2 12.3
Note: 1986 –2001 data from 2001 Census. 2006 data from 2006 Census.
The median age of the population in the Whakatane District in 2006 was 36 years (the same as
the national median), compared to 31.4 years in 2001. Similarly, the median age in urban
Whakatane is increasing, up to 38 years in 2006 compared to 35.1 years in 2001. In
comparison, the national median age in 2006 was 36 years, up from 34.8 years in 2001 and
33.0 years in 1996.
The age structure within the District is variable. Figure 3.2 below shows the spread of
population within four age groups for each CAU, based on 2006 Census data.
Figure 3.2 – Whakatane District Age Groups by CAU (2006 Census)
100%
90%
80%
70%
60%
Over 65 years
35-64 years
50%
15-34 years
40% Under 15 years
30%
20%
10%
0%
Ta ata
ko
Po ra
a
ri
nt
pe
th
ua
ro
i
ge ua
i
t
a
a
a
be
rin
nu
ne s
es
ar
ki
om
er
an
e
nd
ta
or
Te
po
ho
or
Ed eat
ta
at
m
id
O
gi
W
up
w
to
N
m
la
ro
ah Rot
ok
O
M
cu
Tr
O
in
re
e
ur
ae
n
ai
st
ne
T
M
M
U
W
M
oa
ar
ta
ta
a-
e-
M
ka
C
ka
in
al
nd
ha
ha
at
W
la
W
M
Al
Beca // 23 July 2009 // Page 12
4251415 // NZ1-1904026-15 0.15Review of Whakatane and Ohope Residential Growth Strategy 2009
The graph shows that in 2006 the following CAUs had younger populations:
Murupara, Taneatua, Waimana and Te Teko, a greater proportion under 15 years, and under
34 year olds;
Maraetotara and Coastlands, fewer over 65 year olds;
Whakatane North, Trident and Ohope, higher proportion of over 65 year olds; and
Ohope, Coastlands, Otakiri and Maraetotara, higher proportion of 35-64 year olds.
These age structure figures show that in 2006 the working age population (15-64 years) was
generally smaller in rural areas, such as Murupara, while in new urban growth areas (namely
Coastlands and Maraetotara) the working age population made up a greater proportion of the
total population. It is notable that Trident has a significantly lower proportion of working age
population than the other urban CAUs.
The general trend of an ageing population, based on the 1986-2006 Census data, correlates
with the decreasing household size, (with an increase in the number of families with children
older than 15 years and/or who have left home). This trend has a consequential effect on
market demand for the housing stock, for example an increased demand in retirement housing
and ‘retirement village’ type housing. Emergence of these housing trends are most likely to
concentrate in areas of ‘older’ populations, most likely in Ohope, Whakatane North, and Trident
or in high cost coastal areas which attract the higher end of the commercial retirement market.
Overall, urban Whakatane generally has an older population while the rural CAUs had more
youthful populations.
3.2.4 Ethnicity
At the time of the 1996 Census, 53% of the Whakatane District identified themselves as
European, a decline of 7% since 1991. Five years on in 2001, this trend had reversed and 67%
of the population identified themselves as European, an increase of 14% since 1996. However
in 2006 this trend once again reversed with just over 58% of the population defining themselves
as European (see note 3 below Table 3.4 for explanation of this). Comparatively, in 2001 and
2006 approximately 40% identified themselves as Maori, an increase of 2% from 1996. The
number of people who identified themselves as Pacific Island or Asian has remained relatively
static between 2001 and 2006. It should be noted that some people have identified themselves
as belonging to more than one ethnic group hence the figures in the table below do not total one
hundred percent.
Beca // 23 July 2009 // Page 13
4251415 // NZ1-1904026-15 0.15Review of Whakatane and Ohope Residential Growth Strategy 2009
Table 3.4 – Ethnicity – Whakatane District (2001-2006)
European Maori Ethnic Pacific Asian Ethnic Middle Other
Ethnic Groups Group Peoples Groups Eastern, Latin Ethnicities2
Ethnic Groups American &
African
2001 2006 2001 2006 2001 2006 2001 2006 2001 2006 2001 2006
Whakatane 67.0% 58.4% 42.2% 42.2% 2.1% 2.2% 1.3% 1.6% N/A 0.2% 0.2% 10.3%
NZ 80.1% 67.6% 14.7% 14.6% 6.5% 6.9% 6.6% 9.2% N/A 0.9% 0.7% 11.2%
Notes:
1. Based on 2001 & 2006 census data.
2. Includes all of the people who stated each ethnic group, whether as their only ethnic group or as one of
several ethnic groups. Where a person reported more than one ethnic group, they have been counted once in
each applicable group.
3. ‘Other’ in 2006 includes ‘New Zealander’ and additional ‘other’ groups, which probably accounts for the
significant decrease in ‘European’ ethnicities and corresponding increase in ‘other’ ethnicities, between 2001
and 2006, both nationwide and in Whakatane.
The proportions shown in the table above do not reflect the national 2006 picture, particularly
with regards to the proportion of Maori. A comparison to New Zealand figures shows that
across the country 67.6% of the population identify themselves as European, 14.6% as Maori,
9.2% as Asian and 6.9% as Pacific Islander. It is projected that the proportion of Maori and
Pacific Islanders in the national population will continue to increase because of the younger age
structure and higher fertility rates typical of these ethnic groups.
3.2.5 Employment
Over 55% of the Whakatane District labour force (aged over 15 years) was gainfully employed
at the time of the 2001 Census. This represents a slight proportional increase on the 1996
Census where 53% were employed. Of those employed at the time of the 2001 Census, 40.9%
were in full time employment and 14.3% were in part time employment. These 2001 figures are
slightly higher for the Whakatane Urban Area compared to the rest of the District outside the
Urban Area. Table 3.5 below summarises the proportion of the population usually resident by
labour status for CAUs within the District, as of 2001.
Table 3.5 – Labour Status by Census Area Unit
Employed Non-
Status Non
Unemployed Labour
Full-time Part-time Identifiable
Force
Ohope 47% 15% 2% 32% 4%
Whakatane North 39% 14% 4% 40% 2%
Coastlands 60% 15% 2% 20% 3%
Whakatane West 41% 15% 7% 33% 4%
Trident 37% 14% 5% 41% 3%
Allandale-Mokorua 46% 16% 3% 33% 2%
Matata 40% 10% 5% 39% 4%
Taneatua 31% 10% 11% 31% 16%
Edgecumbe 44% 14% 7% 34% 2%
Beca // 23 July 2009 // Page 14
4251415 // NZ1-1904026-15 0.15Review of Whakatane and Ohope Residential Growth Strategy 2009
Employed Non-
Status Non
Unemployed Labour
Full-time Part-time Identifiable
Force
Te Teko 31% 9% 12% 42% 7%
Orini 35% 14% 12% 34% 6%
Maraetotara 50% 14% 4% 18% 7%
Poroporo 42% 14% 9% 33% 4%
Otakiri 57% 17% 3% 21% 2%
Rotoma 45% 12% 6% 32% 5%
Matahina-Minginui 43% 16% 6% 31% 4%
Waimana 34% 17% 7% 36% 5%
Urewera 45% 13% 5% 27% 9%
Murupara 32% 12% 10% 40% 7%
Urban Whakatane 45% 15% 4% 33% 3%
Rest of District 41% 13% 7% 32% 6%
Whakatane District 42% 14% 6% 32% 5%
NZ 48.4% 14.4% 3.4% 30.4% 3.4%
The proportion of the District-wide population that is unemployed rose slightly to 7.7% in 2001
(up 0.2% from 1996 Census), but dropped to 6.0% in 2006. This compares to a national
average in 2006 of 3.4%. The unemployment rate of urban Whakatane continues to be lower
than the district average. Those rural communities with unemployment rates above ten percent
in 2006 include Te Teko (12%), Taneatua (11%), Orini (12%), and Murupara (10%). In
comparison, Ohope and Coastlands had the lowest unemployment rates in the District at 2%.
Employment figures by industry show that in 2006 Agriculture, Forestry, Fishing and
Manufacturing, and Retail Trade continue to employ the most people in the District, as they did
in 2001.
3.2.6 Income
It is evident from Table 3.6 below that personal income levels in the District are rising at a
steady rate. There is an increase in the medium income of $5,800.00 between the 2001 and
2006 census. The most marked change is in the high income bracket (earnings over $50,000),
which saw a 4% rise between 2001 and 2006. This is slightly below the New Zealand national
average at 16% for the $50,001+ (2006 Census).
With regards to income range, 2006 Census data showed there is little difference between
urban Whakatane and the District as a whole. However both the average and median personal
incomes are slightly higher in the urban area compared with the rest of the District.
Beca // 23 July 2009 // Page 15
4251415 // NZ1-1904026-15 0.15Review of Whakatane and Ohope Residential Growth Strategy 2009
Table 3.6 – Whakatane District Income Range (2001-2006)
< $15,000 $15,001 - $30,000 $30,001 - $50,000 $50,001 +
2001 42% 21% 14% 10%
2006 31% 23% 17% 14%
NZ (2006) 30% 22% 21% 16%
Note: The figures in this table do not total 100% because a number of people choose not to specify their
income.
Based on 2001 & 2006 Census data.
Table 3.7 – Whakatane Urban Area Personal Income Range (2006)
< $20,000 $20,001 - $30,000 $30,001 - $50,000 $50,001 +
Ohope 32% 15% 20% 24%
Whakatane North 46% 16% 17% 11%
Coastlands 32% 13% 22% 24%
Whakatane West 45% 14% 17% 11%
Trident 46% 16% 15% 10%
Allandale-
Mokorua 39% 14% 20% 17%
Urban Area
average 40% 15% 19% 16%
In 2006, Ohope and Coastlands had the highest median and average personal incomes in the
District, which is to be expected given the cost of property near the coast. The median personal
income in these CAUs was $28,900 in Ohope and $31,200 Coastlands. In comparison,
Waimana, Taneatua and Te Teko had the lowest median incomes in 2006 (in the order of
$16,000).
We note that the drop in low income earners and the increase in higher income bands is
attributable in part to decreases in unemployment in the period by 729 people and an increase
in salary and wage earners of 1,119 people. The medium income changed over the five year
period by $5,800.00 from $15,900 to $ 21,700 (a change of 36%). In the same period the
Consumer Price Index changed by 13.3%.
The most significant point is that at 2006, 31% of the working age population of the district had
income levels below $15,000. In the urban area, 40% of the working age population had an
income lower than $20,000. When considered in the light of housing costs this is a significant
and compelling issue.
3.2.7 Future Population Trends
The population projections in this section use 2006-base projections of the population usually
resident in each area unit and cover the period to 2031 at five yearly intervals.
The projections were generated by Statistics New Zealand, using 2006 census data as a base
(i.e. for years commencing June 30). For comparison’s sake, the actual census populations of
Beca // 23 July 2009 // Page 16
4251415 // NZ1-1904026-15 0.15Review of Whakatane and Ohope Residential Growth Strategy 2009
the district in 2001 and 2006 are also plotted (i.e. March populations). It is noted that while the
actual census populations do not match the projections, this is, in part, due to the different time
periods represented. However, it is evident from earlier population projections that the rate of
change between 2001 and 2006 using ‘actual census’ data is similar to the rate of change
between 2001 and 2006 for the medium and high projections (2001-base).
Figure 3.3 below provides population projections (2006-base) for the Whakatane District, based
on the following three growth scenarios, with varying assumptions for fertility, mortality and
migration:
High projection – assumes high fertility, low mortality and high net migration;
Medium projection – assumes medium fertility, medium mortality and medium net migration;
and
Low projection – assumes low fertility, high mortality and low net migration.
These projections are based on a number of assumptions and it is important to recognise that
they reflect the changes in population size, based on current characteristics of the population
structure and, as such, are indicative of popu-++lation numbers rather than accurate
predictions. The low population projection shows continuing population decline over the
following 25-year period, from approximately 34,500 in 2006 to approximately 30,000 in 2031.
The medium projection predicts an initial rise in population numbers, but a decline over the
longer term to eventually be below 2006 levels (i.e. 34,200 in 2031).
However, the high population projection shows population increasing to 38,300 in 2031. In
comparison to national trends for population growth, and even comparatively to the rest of the
Bay of Plenty region, the high growth rate in the Whakatane District continues to be lower.
Figure 3.3 – Whakatane District Projected Population Growth Scenarios (2006-2031)
40,000
37,500
Projected Population
35,000
32,500
30,000
27,500
25,000
2006 2011 2016 2021 2026 2031
Year
Low Scenario Medium Scenario High Scenario
Note: Projected data sourced from ‘Area Unit Population Projections by Territorial Authorities, Age and Sex,
2006(base)-2031’.
Beca // 23 July 2009 // Page 17
4251415 // NZ1-1904026-15 0.15Review of Whakatane and Ohope Residential Growth Strategy 2009
For the Whakatane Urban Area, the population projections (2006-base) indicate an increase in
population under the high projection, from approximately 17,500 in 2006 to almost 20,000 in
2031. Under the medium projection, an initial increase eventually reaches a plateau and then
declines slightly to approximately 17,800 in 2031. Under the low scenario, population declines
to less than 16,000 in 2031.
Figure 3.4 – Whakatane Urban Area Projected Population Figures (2006-2031)
22,500
20,000
Projected Population
17,500
15,000
12,500
2006 2011 2016 2021 2026 2031
Year
Low Scenario Medium Scenario High Scenario
Note: Projected data sourced from ‘Area Unit Population Projections by Territorial Authorities, Age and
Sex, 2006(base)-2031’.
3.3 Dwelling Profile
3.3.1 Occupied Dwellings3
Over the last decade, the number of occupied dwellings in the Whakatane District has increased
from 11,202 in 1996 to 11,931 in 2006. This equates to a 6.5% increase in the last ten years.
In the five years from 2001-2006, there was a 3.2% increase in the number of occupied
dwellings. In general, the location of dwelling growth in the District correlates to population
growth. However, the exception is Matata and Edgecumbe where there has been an increase
in the number of occupied dwellings but a decrease in population. Similarly, Orini has
3
Refers to any building or structure occupied by one or more persons on census night. In this regard will
include any self-contained living area, such as caravan, house, unit or flat within a dwelling. However,
these figures do not include empty dwellings, baches or holiday homes, dwellings under construction or
dwelling unoccupied on census night as residents were away (for more than one night)
Beca // 23 July 2009 // Page 18
4251415 // NZ1-1904026-15 0.15Review of Whakatane and Ohope Residential Growth Strategy 2009
experienced a decline in population growth but has seen no change in the number of occupied
dwellings.
With regard to the urban area, Coastlands recorded a 42% increase in the number of occupied
dwellings between 2001 and 2006, representing an absolute increase of 87 dwellings, which
makes up almost a quarter of the total number of additional dwellings (372) in the district. Other
areas of urban Whakatane have recorded increases in the number of occupied dwellings of
between 3.8% and 5.2%, with only Whakatane North recording a decrease in the number of
dwellings (-1.7% or 21 less dwellings). Matata (1.3%) and Otakiri (4.8%) on the outskirts of
urban Whakatane have also registered growth in the number of occupied dwellings since 2001.
Rural areas have experienced a mix of increased and decreased occupied dwelling numbers.
The increase in the number of occupied dwellings in urban Whakatane has been greater than
the population growth of the area, with an increase in occupied dwellings of 4.5% between 2001
and 2006, compared with 2.7% population growth over the same period.
The disproportionate increase in the number of dwellings over the last census period (in
comparison to the total population) correlates to changing household composition.
Table 3.8 – Average Occupants per Dwelling
1991 1996 2001 2006 Change (1991-2006)
Whakatane District 3.08 2.96 2.84 2.79 -0.29
Urban Whakatane 2.83 2.75 2.63 2.67 -0.16
New Zealand Total 2.85 2.82 2.73 2.77 -0.08
Note: Based on actual census data
Table 3.8 indicates that between 1991 and 2001 the average number of occupants per dwelling
has declined. Since 2001, it has remained steady in Whakatane District as a whole and
increased in urban Whakatane from 2.63 occupants in 2001 to 2.67 in 2006. Overall, this
general downward trend equates to more dwellings and smaller household sizes, with an
ageing population and an increasing number of post child-rearing households. The figures also
point to the population tending to be older in urban areas compared to rural areas. It is
noteworthy that household occupancy has increased in the last Census period, which goes
against projections. However, it is expected that the downward trend will continue given the
ageing population across New Zealand. It is expected, however, that household occupancy
rates in Whakatane will not decrease at the same rate as other urban areas throughout the
country, given the higher proportion of Maori in the area. This is because the demographic
profile of the Maori population shows a more youthful population than European, and Maori
households also tend to be larger.
3.3.2 Dwelling Characteristics
The majority of dwellings in Whakatane District are occupied by one family households at just
over 70%, with the second largest group being single person households at just over 21%.
Again this is indicative of an ageing population, with a greater number of sole occupant
dwellings.
Beca // 23 July 2009 // Page 19
4251415 // NZ1-1904026-15 0.15Review of Whakatane and Ohope Residential Growth Strategy 2009
Figure 3.5 – Occupancy for Dwellings – Whakatane District (2006 Census)
80
70
60
50
Percentage
40
30
20
10
0
One-Family Tw o-Family Three- or More Other Multiperson One-Person Unidentifiable
Household Household Family Household Household Household
Dw elling Type
Note: Based on 2006 Census data
At the time of the 2006 Census, the majority of dwellings were privately owned by the usual
resident population (62%), with 31% of usual residents living in dwellings they do not own (e.g.
renting or living in a family home without the owners). These figures follow the national trend of
an increasing number of people renting rather than owning their home. Within the Whakatane
urban area, home ownership rates are similar to the district, however in Trident (37%) and
Whakatane North (38%) the proportion of usual residents that do not own their own home is
higher, while in Coastlands this is significantly lower at 20% being rented.
The household composition of CAUs within the Whakatane District is shown below in Table 3.9
using 2006 Census data. This table shows that Coastlands (82%) has the highest proportion of
one-family households in the District, reflecting the nature of Coastlands as a growth area for
single middle-income families. Whakatane North (31%) and Trident (29%) have the largest
proportion of one-person households reflecting the older age of the population of these CAUs.
Beca // 23 July 2009 // Page 20
4251415 // NZ1-1904026-15 0.15Review of Whakatane and Ohope Residential Growth Strategy 2009
Table 3.9 – Household Composition – CAUs (2006 Census)
One Three or Not
Two Non- One Person
Family More Elsewhere
Families family Households
only Families Specified
Ohope 71% 1% 0% 4% 22% 3%
Whakatane
North 61% 2% 0% 4% 31% 1%
Coastlands 82% 2% 0% 3% 10% 2%
Whakatane
West 74% 4% 0% 3% 16% 2%
Trident 64% 2% 0% 3% 29% 2%
Allandale-
Mokorua 68% 2% 0% 3% 26% 1%
Matata 68% 5% 0% 3% 21% 1%
Taneatua 71% 5% 0% 3% 15% 8%
Edgecumbe 70% 3% 1% 3% 23% 1%
Te Teko 66% 9% 2% 6% 13% 2%
Matahina-
Minginui 70% 4% 0% 3% 22% 2%
Waimana 73% 5% 0% 3% 14% 3%
Urewera 73% 4% 0% 2% 16% 4%
Murupara 68% 5% 0% 4% 21% 2%
Ohope 71% 1% 0% 4% 22% 3%
Matata 68% 5% 0% 3% 21% 1%
Taneatua 71% 5% 0% 3% 15% 8%
Edgecumbe 70% 3% 1% 3% 23% 1%
Te Teko 66% 9% 2% 6% 13% 2%
In 20014 in the Whakatane District, approximately 77% of dwellings were separate private
dwellings, while 23% of dwellings were classed as ‘other private dwelling’ (i.e. units or joined
houses). The highest concentration of ‘other private dwellings’ is in the following CAUs:
Whakatane North (33.8%);
Trident (28.0%);
Ohope (27.9%); and
Allandale-Mokorua (26.7%).
These were most concentrated in the CAUs with higher proportions of the 65 years and over
age cohort.
4
This data is not available for the 2006 Census.
Beca // 23 July 2009 // Page 21
4251415 // NZ1-1904026-15 0.15Review of Whakatane and Ohope Residential Growth Strategy 2009
3.3.3 Unoccupied Dwellings
Unoccupied dwellings are those dwellings not occupied at any time within 12 hours from
midnight on Census night. In Whakatane District, approximately 10.1% of all dwellings were
unoccupied at the time of the 2006 Census (up from 8.3% in 2001). This is a continuation of the
increase seen between the 1996 and 2001 Census years. It is significant that the number of
unoccupied dwellings in the District is steadily increasing, from 708 in 1996, to 1,041 in 2001, to
1,338 in 2006 (an increase of 29%).
Of further note is that the highest proportion of unoccupied dwellings in urban Whakatane in
2006 was within the Ohope CAU (32.7%). This is largely attributed to the high number of
baches and holiday homes in the beach area.
In absolute terms, the number of unoccupied dwellings in Matahina-Minginui continued to
increase, from 51 in 1996, 102 in 2001, to 135 in 2006. This reflects the population decline in
the same period of seventeen percent (292 people).
3.3.4 Dwelling Demand since 2006
Based on Census dwelling and population data, coupled with recent building consent data,
Table 3.10 shows the number of new dwellings (including apartments) in the Whakatane Urban
Area.
Table 3.10 – Number of New Dwellings in Whakatane Urban Area (2006-2008)
Building Building
2001 Census 2006 Census
Consents Consents June 2008
Total Total
Issued FY Issued FY Total
Dwellings Dwellings
06/07 07/08
Whakatane 6,270 6,546 89 69 6,704
Urban Area
Infill Development
Analysis of building consents issued for Whakatane, Ohope and Coastlands 2000-06 provides
an estimate of recent infill development (see Table 3.11 below). Infill development can be
defined as development or subdivision of already occupied land in the residential zone with
additional lots for residential development. This is typically small-scale low rise and occurs on
lots of 2,000m² or less (see Section 4.2).
Based on a 5-year average (2000-2006), about 48% of new building consents issued in the
urban area since 2000 were for infill development (excluding apartments). We propose to use
an assumed rate of infill (exclusive of apartment living) uptake of 20% over the next 10-20
years, which reflects the constraint of land availability over time. As discussed in section 4.3,
this infill uptake is expected to decrease over time as infill sites are developed.
Beca // 23 July 2009 // Page 22
4251415 // NZ1-1904026-15 0.15Review of Whakatane and Ohope Residential Growth Strategy 2009
Table 3.11 – Urban Infill Development 2000-2006
Total Building No. of Consents for
% Infill
Consents issued Infill
2000/2001 120 39 33%
2001/2002 102 32 31%
2002/2003 109 33 30%
2003/2004 70 65 93%
2004/2005 59 50 85%
2005/2006 74 32 43%
2006/2006* 33 20 61%
TOTAL (2000-2006) 567 271 48% average
* denotes part-Financial Year July-December 2006
Apartment Developments
A recent change in new dwelling characteristics is evident since the 2000 Strategy was
published. There have been a number of building consents issued for apartment developments
in urban Whakatane and Ohope. Specifically, these include:
Beach Point Apartments, Ohope (building consent was issued in FY 2002/03 for 42 units);
Horizon Apartments, Ohope (building consent issued in FY 2004/05 for 12 units);
Port Ohope Apartments, Ohope (building consent issued in FY 2005/06 for 31 apartments);
Waterfront Quays, Whakatane (building consent issued in FY 2005/06 for 22 apartments);
White Isles, Whakatane (building consent issued in FY 04/05 for 15 apartments); and
Quayside, Whakatane (consent issued FY 2007/08 for 43 apartments).
Analysis of this data indicates a recent trend of 1 or 2 apartment developments each year, with
an average of about 25 units per development. It is unlikely that the pace of this trend will
continue in the long-term given the market demand and population base of the area, as well as
availability of suitable land. However there will always be some apartment development each
year.
3.3.5 Future Dwelling Demand Based on Statistics NZ Population Projections
Population projections are available for each CAU in the Whakatane District for low, medium
and high growth scenarios. Projections for the number of households within each CAU are only
available for the medium growth scenario. However, using the assumption that household
occupancy rates would remain constant between growth scenarios (i.e. that the occupancy
rates for the medium growth scenario are applicable for low and high growth scenarios), the
projected number of dwellings under low and high growth scenarios were able to be determined.
These are shown for both the district as a whole, and for the urban area of Whakatane, in
Tables 3.12 and 3.13 below.
Beca // 23 July 2009 // Page 23
4251415 // NZ1-1904026-15 0.15Review of Whakatane and Ohope Residential Growth Strategy 2009
The dwelling projections are based on the following assumptions:
1. While population growth in Whakatane is lower than the New Zealand average growth
rates, the growth rates in urban Whakatane are more comparable to the NZ average and
therefore the national projections are considered to be generally more valid within the urban
areas;
2. The national trends project continued growth in the number of dwellings at a faster rate than
population growth;
3. National trends indicate a continued decrease in occupancy rates, with an increasing
proportion of 1, 2 and 3 person dwellings.
4. The CAU trend of increasing age and a corresponding decrease in occupancy per dwelling
will continue. However, it is considered that the occupancy rate for the District will not be as
low as the national average due to the higher proportion of the population of New Zealand
Maori ethnicity (whose population is not ageing at the same rate as the general population);
5. Based on national and District trends, growth will continue to be dominated by urban
Whakatane, with the rate of population decline in rural areas increasing through ‘natural’
population change and net migration loss (two notable exceptions to this are the rural fringe
and the coast rural areas); and
6. The household projections are based on 2006-base population projections provided by
Statistics NZ to Whakatane District Council which have been calculated by WDC based on
both occupied and unoccupied dwellings. Unoccupied dwellings typically account for about
10% of the dwelling profile.
Beca // 23 July 2009 // Page 24
4251415 // NZ1-1904026-15 0.15You can also read