EU Regular Economic Report - MODEST RECOVERY, GLOBAL RISKS

Page created by Jeffrey Schmidt
 
CONTINUE READING
EU Regular Economic Report - MODEST RECOVERY, GLOBAL RISKS
EU Regular Economic Report
MODEST RECOVERY, GLOBAL RISKS
EU Regular Economic Report - MODEST RECOVERY, GLOBAL RISKS
Standard Disclaimer:

This volume is a product of the staff of the International Bank for Reconstruction and Development / The World Bank. The findings,
interpretations, and conclusions expressed in this paper do not necessarily reflect the views of the Executive Directors of The World Bank
or the governments they represent. The World Bank does not guarantee the accuracy of the data included in this work. The boundaries,
colors, denominations, and other information shown on any map in this work do not imply any judgment on the part of The World Bank
concerning the legal status of any territory or the endorsement or acceptance of such boundaries.

Copyright Statement:

The material in this publication is copyrighted. Copying and/or transmitting portions or all of this work without permission may be a
violation of applicable law. The International Bank for Reconstruction and Development/The World Bank encourages dissemination of its
work and will normally grant permission to reproduce portions of the work promptly. For permission to photocopy or reprint any part of
this work, please send a request with complete information to the Copyright Clearance Center, Inc., 222 Rosewood Drive, Danvers, MA
01923, USA, telephone 978-750-8400, fax 978-750-4470, http://www.copyright.com/. All other queries on rights and licenses, including
subsidiary rights, should be addressed to the Office of the Publisher, The World Bank, 1818 H Street NW, Washington, DC 20433, USA, fax
202-522-2422, e-mail pubrights@worldbank.org.
EU Regular Economic Report - MODEST RECOVERY, GLOBAL RISKS
EU Regular Economic Report
MODEST RECOVERY, GLOBAL RISK

Europe and Central Asia Region
The World Bank

Final Report
2015

Document of the World Bank
EU Regular Economic Report - MODEST RECOVERY, GLOBAL RISKS
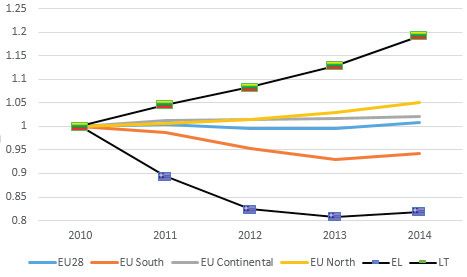
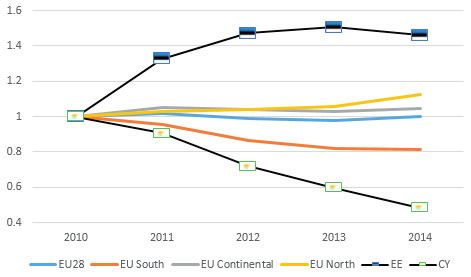
TABLE OF CONTENTS

NOTES AND ACKNOWLEDGMENTS                 4

SUMMARY                                   5

RECENT ECONOMIC DEVELOPMENTS              7

OUTLOOK                                   23

FOCUS NOTE: EXPORTS AND GROWTH RECOVERY   35

ANNEX 1. KEY CHARTS                       47
NOTES AND ACKNOWLEDGMENTS

This is the inaugural issue of the EU Regular Economic Report (RER), which is designed to be a semiannual publication
of the World Bank. The objective of the RER is to present economic developments and prospects in the European Union (EU),
with a special focus on countries most engaged with the World Bank in EU Central and Eastern European countries (EU-CEE),
and in particular Bulgaria, Croatia, Poland, and Romania.

The report allows the benchmarking of countries relative not only to neighbors, but also to EU subgroups. The
subgroupings used in this Report are drawn from the World Bank report “Golden Growth: Restoring the Lustre of the European
Economic Model” (2012). They provide a basis for clustering countries with similar economic characteristics and linkages (see
map): EU North comprises Denmark, Estonia, Finland, Ireland, Latvia, Lithuania, Sweden, and the United Kingdom; EU South
comprises Bulgaria, Croatia, Cyprus, Greece, Italy, Portugal, Malta, Romania, Slovenia, and Spain; and EU Continental comprises
Austria, Belgium, the Czech Republic, France, Germany, Hungary, Luxembourg, the Netherlands, Poland, and the Slovak Republic.
The RER also contains a Focus Note on an issue of economic policy interest in the EU.

The Report is co-authored by Ewa Korczyc, Matija Laco and Theo Thomas, with inputs from Doerte Doemeland, Paulina Hołda,
Stella Ilieva, Leszek Kasek, Sanja Madzarevic-Sujster, Catalin Pauna, Suzana Petrovic, and Emilia Skrok.

Aggregates are calculated as either weighted averages, sums, or simple averages. The following conventions apply: (i) aggregates
for data relating to the domestic economy, growth rates and ratios, contributions to gross domestic product growth or value
added growth, external trade indicators, as well as fiscal accounts—deficit and debt—are weighted by GDP valued at purchasing
power parities (PPPs) in 2012 as a share of total GDP, (ii) aggregates for short-term high frequency indicators, retail sales and
industrial production, are weighted by applying Eurostat’s turnover and production weightings for total retail trade and total
industry; (iii) aggregates of economic sentiment indicators, and non-performing loans, are calculated as simple averages, (iv)
aggregates for labor market indicators, employment and unemployment rates, are weighted by labor force in 2013; (v) aggregates
for inflation are weighted by final consumption expenditure in 2013; (v) and aggregates of financial sector indicators (credit,
deposits) are weighted by their shares in the total. The data appearing in the Regular Economic Report are compiled by the World
Bank staff and reflect data available by end-May 2015.

The team would like to thank Ivailo Izvorski (Practice Manager) and Satu Kahkonen (Director), from the Macroeconomics and
Fiscal Management Global Practice at the World Bank, Mamta Murthi (Director, Central/South Europe and Baltics) and other
colleagues for their guidance in the preparation of this report. The team is grateful for the comments on earlier drafts received
from colleagues in the World Bank, and Central Banks and Ministries of Finance.
SUMMARY
Growth is slowly picking up in Europe against a backdrop of diverging global trends. The EU economy expanded by 1.3
percent in 2014 after no growth in 2013, thanks to rising consumer confidence, which bolstered consumption, and a pick-up in
investment. However, Europe’s recovery has lagged behind other OECD economies over the past four years, with the exception of
Japan, and real GDP levels are barely 3 percent higher than in 2010, compared to about 10 percent higher in the US.

EU North and Continental are leading the modest recovery. The pick-up was particularly strong in Germany, Hungary,
Ireland, Poland and the UK. EU South finally returned to growth in 2014 following significant financial and economic restructuring,
and despite growing concerns about financial strains in Greece and generally weak global trade. Confidence in the modest
recovery reflects gradually improving labor markets—increasing employment, low inflation and growing real wages—combined
with the boost from lower food and oil prices. The ECB’s expanded Quantitative Easing (QE) program has also driven bond yields
and the Euro lower, supporting exporters and, as bank balance sheets improve, the gradual pick up in credit. The drag from fiscal
consolidation is also set to moderate while inflation bottoms out in 2015.

Most EU Central and Eastern European countries (EU-CEE) will continue to grow above the Euro area average. The
Czech Republic, Hungary, Poland, Romania and the Slovak Republic are expected to be some of the fastest growing economies
in the EU, with growth of over 2.4 percent, based on robust domestic demand, and continued export growth as the EU recovery
gathers pace. Investment should also continue to pick up with overall activity, but high corporate debt, ongoing financial
deleveraging and high non-performing loans continue to weigh on prospects for a swift recovery. In Croatia, economic activity is
expected to recover at a very modest pace, based on exports and EU financed investments, after a six-year recession. In Bulgaria,
the recovery is constrained by the need to tighten fiscal policy as fiscal deficit widened due to expenditure over-runs and weaker
than expected revenues in 2014.

While the risks to the outlook are balanced, there are significant concerns. These include: (i) an upsurge in financial market
volatility as the US, EU and Japan implement divergent monetary policies; (ii) a sustained period of low growth and subdued
inflation will continue to put pressure on EU countries’ public finances, as revenues remain subdued and debt levels high; (iii)
low returns on investment and incomplete bank reforms would reduce the availability of new lending for investment; and (iv)
regional risks emanating from ongoing financial strains in Greece, the planned EU-referendum in the UK, and ongoing tensions in
Ukraine. On the upside, lower oil prices, the ECB’s QE and firming labor markets should continue to support consumption in the
short-term.

Exports have driven the growth recovery in several EU-CEE countries. Bulgaria, Poland, Romania, and to a lesser extent
Croatia, have seen exports grow significantly faster than in most other EU countries. One of the key factors has been the role of
FDI in helping countries integrate into global value chains and ‘push’ exports. However, FDI has declined significantly in recent
years, which puts renewed emphasis on reforms to promote FDI and sustain export growth, through improving skills, reducing
regulatory barriers to businesses, providing supportive infrastructure investment, encouraging innovation and efficient labor and
capital markets.

Growth and structural policies have resulted in marked differences in EU-CEE trends in poverty and shared
prosperity. In Poland poverty is continuing to decline as unemployment levels are back at levels not seen since 2008, real wages
are growing and well targeted tax credits are helping low income families. In Romania, improving employment conditions and
support to vulnerable categories have resulted in a steady decline in poverty rates. In Bulgaria, poverty remains above pre-crisis
levels, as job losses have been most severe in low-skilled jobs and fiscal consolidation has reduced the scope for increases in social
transfers. Croatia’s recession and high unemployment has resulted in a steady rise in poverty despite efforts to target benefits to a
guaranteed minimum income.

 Real GDP growth, percent                          2014                         2015f                            2016f
 EU                                                1.3                            1.8                              2.0
 of which
 Bulgaria                                          1.7                            1.1                              2.0
 Croatia                                           -0.4                           0.5                              1.2
 Poland                                            3.4                            3.6                              3.6
 Romania                                           2.9                            3.0                              3.2

Source: Eurostat, EC and World Bank calculations
RECENT ECONOMIC
DEVELOPMENTS
RECENT ECONOMIC DEVELOPMENTS
   page 8

GROWTH IS SLOWLY PICKING UP IN EUROPE AGAINST A
BACKDROP OF DIVERGING GLOBAL TRENDS AND POLICIES
Growth finally returned to Europe in 2014, and the pace has gradually strengthened, based on growing consumer
confidence, which bolstered consumption, and a pick-up in investment. The EU economy expanded by 1.3 percent in
2014 as domestic demand rose, especially private consumption (Figures 1-2). This comes after zero growth in 2013, and recession
in 2012. Europe’s recovery after the initial financial crisis in 2008 and the second recession in 2012-13 has lagged behind
developments in other OECD economies over the past four years, with real GDP levels in Europe less than 3 percent higher
than in 2010, compared to an economic expansion of close to 10 percentage points in the US, around 15 percentage points in
Korea and Mexico, and 20 percentage points in Turkey and Chile. Only in Japan, where growth has been subdued for over two
decades, were levels similar to those of Europe. One of the reasons for the prolonged downturn and sluggish recovery in the
EU resulted from the need to gradually unwind unsustainable credit and housing booms, which particularly impacted many
EU South countries, as well as Ireland, the UK, and EU central and eastern countries (EU-CEE), and the emergence of structural
imbalances that manifested in high current-account deficits, the loss of competitiveness and ultimately the rapid accumulation of
both private and then public sector debt.

 Figure 1. EU North and Continental countries are Figure 2. As domestic consumption becomes the main
 leading the recovery                             driver of growth in most regions

 Contributions to GDP growth, 2010-14, percentage points                     Contributions to GDP growth, 2013-14, percentage points

    2,5                                                                          Final consumption    GFCF     Net exports    Stocks and stat discrepancy   GDP
    2,0                                                                          4
                                                                                 3
    1,5
                                                                                 2
    1,0                                                                          1

    0,5                                                                          0
                                                                                -1
    0,0
                                                                                -2
   -0,5                                                                         -3

   -1,0                                                                         -4
            2010              2011         2012         2013          2014            2013     2014     2013      2014       2013    2014      2013     2014
                                                                                          EU 28         EU Continental         EU South          EU North
                   EU South      EU Continental   EU North     EU28

 Source: Eurostat, World Bank staff calculations                             Source: Eurostat, World Bank staff calculations

The EU’s recovery is taking hold against a backdrop of diverging global trends and policies. Overall, global growth is
estimated to have been 2.6 percent in 2014, only slightly higher than 2012 and 2013. Growth in the US was 2.4 percent, bolstered
by robust private investment, a surge in consumption and easing fiscal consolidation. In Japan, a technical recession ended in the
fourth quarter of 2014, with output remaining little changed, as both consumption and exports improved. China is also managing
a gradual slowdown in growth, to a still impressive 7.4 percent, while overall growth in the BRICS1 slowed from 5.4 to 5 percent.
Low oil prices have led investors to reassess the growth prospects of oil-exporting countries and have contributed to capital
outflows, reserve losses, sharp depreciations, or rising sovereign spreads, including in Russia, Venezuela, Colombia, Nigeria, and
Angola. These financial strains could imply adverse spillover effects for partner economies, through trade and financial linkages,
including remittance flows. Conversely, oil-importing regions like the EU have gained additional fiscal and monetary space to
support activity. Nonetheless, global trade remains surprisingly weak, even though financing conditions are benign, growing by
less than 4 percent in 2013 and 2014—well below the pre-crisis average of 7 percent a year. The slowdown is due partly to a drop
in demand and partly because world trade seems less sensitive to changes in global activity. The diverging growth trend, between
the US and Europe, has led to speculation that the US Federal reserve may start to gradually raise monetary policy rates no earlier
than late 2015, while the ECB and Japan are committed to a sustained period of Quantitative Easing and low policy rates.

1 Brazil, Russia, India, China and South Africa.
page 9

Growth rates have picked up most strongly in EU Continental and EU North2. The impact of the euro-crisis looks to be
finally starting to abate, with progress having been made to strengthen bank balance sheets, and ongoing moves toward the
banking union that should improve supervision and regulation, while the downward spiral of fiscal adjustment and weakening
growth appears to be easing. As concerns over the impact of the crisis, particularly in EU South, have gradually declined,
companies and households are becoming more willing to invest and spend. All three sub-regions of the EU posted positive
growth in 2014, for the first time since 2010. There has been strong economic expansion in EU North, of 2.5 percent, largely driven
by consumption in the UK and Ireland, while the Baltic countries witnessed some of the fastest growth rates in the EU, all above
2 percent. The solid growth in EU Continental, in particular the German and Polish economies, was more balanced between
consumption and investment. Following three years of recession, EU South, which was worst affected by the financial crisis, finally
returned to growth after several years of financial and economic restructuring, registering a 0.5 percent increase in aggregate
output, driven by domestic demand, despite growing concerns about financial strains in Greece.

Growth was well above average in Central and Eastern EU countries, as strengthening domestic demand helped to
rebalance growth. Hungary and Poland were amongst the fastest growing economies in the EU in 2014, with growth of 3.6
percent and 3.4 percent respectively, with only Ireland growing faster, at 4.8 percent. Growth in the Baltic countries3, the Czech
Republic, Slovakia and Slovenia all exceeded 2 percent in 2014, as domestic demand picked up across the region to reduce the
previous reliance on net exports. Growth remained robust in the Baltics, despite the slowdown in some of their major trading
partners, with Finland’s economy contracting by 0.1 percent (the third year of recession) and Russia’s growth slowing to 0.6
percent. In Poland, strong domestic demand became the main driver of growth, including a notable rebound in fixed investment,
reducing the previous reliance on net exports. In Bulgaria, GDP expanded by 1.7 percent in 2014, compared to 1.1 percent in
2013, boosted by the gradual improvements in labor markets, falling prices and a recovery in investment by EU funded projects.
In Romania, economic growth reached 2.9 percent in 2014, compared to 3.5 percent in 2013, supported by strong private
consumption—up 4.7 percent—based on robust wage growth despite investment remaining subdued by the modest rate of
absorption of EU funds. Croatia’s recovery is lagging behind other neighbors, relying mainly on a rebound in exports, which was
more than offset by the continued contraction in all components of domestic demand, as GDP declined by 0.4 percent in 2014,
the sixth year of negative growth that has seen the economy shrink by some 13 percent.

Flash estimates of GDP, as well as high-frequency leading indicators, suggest that economic activity in the EU
continued its gradual recovery in early 2015. In the first quarter of 2015 EU GDP is expected to have expanded by 1.4
percent, while Euro Area registered growth of 1 percent, compared to a year before. The seasonally adjusted, quarter on quarter,
growth of 0.4 percent for both the EU and Euro area was the highest in two years, and exceeded growth rates in both the UK and
US. In particular, the performance of both Italy and France boosted Euro Area growth, despite somewhat disappointing growth
in Germany. Retail sales continued to grow at a reasonable pace of around 1.5 percent while industrial production expanded
close to 2 percent in the first quarter 2015. The Euro area PMI has been well above 50 points (reflecting continued expansion),
as economic sentiment indicators rose. The EU-CEE countries are benefiting most from revitalized EU growth, with the Czech
Republic, Hungary and Poland witnessing the highest Manufacturing PMI levels in the EU. Flash estimates of GDP in the first
quarter confirm strong rebound in both Romania and Poland, registering growth 4.3 and 3.5 percent year-on-year respectively,
some of the strongest in the EU, while growth in Bulgaria accelerated to 2 percent.

2 EU North comprises—Denmark, Estonia, Finland, Ireland, Latvia, Lithuania, Sweden, and the United Kingdom; EU South comprises—Bulgaria,
Croatia, Cyprus, Greece, Italy, Portugal, Malta, Romania, Slovenia, and Spain; and EU Continental comprises—Austria, Belgium, the Czech
Republic, France, Germany, Hungary, Luxembourg, the Netherlands, Poland, and the Slovak Republic.
3 Estonia, Latvia and Lithuania.
RECENT ECONOMIC DEVELOPMENTS
   page 10

 Figure 3. Strengthening consumer confidence has Figure 4. As economic sentiment and industrial
 boosted retail sales, percent change            production also improve, percent change
 Growth in retail sales, percent change and Consumer Growth in industrial production, percent change and
 Confidence Indicator, index                         Economic Sentiment Indicator, index

                            Retail sales (LHS)                              Consumer confidence (RHS)                                                        Industrial production (LHS)                                 Economic Sentiment Indicator (RHS)
   2,0                                                                                                                            0
                                                                                                                                              2,5                                                                                                         107
   1,5                                                                                                                                                                                                                                                    107
                                                                                                                                  -5
                                                                                                                                              2,0                                                                                                         106
   1,0                                                                                                                                                                                                                                                    106
                                                                                                                                  -10         1,5                                                                                                         105
   0,5                                                                                                                                                                                                                                                    105
                                                                                                                                  -15         1,0                                                                                                         104
   0,0
                                                                                                                                                                                                                                                          104
   -0,5                                                                                                                           -20         0,5                                                                                                         103
                                                                                                                                                                                                                                                          103
   -1,0                                                                                                                           -25         0,0                                                                                                         102
                                                        Nov-13

                                                                                                                Nov-14
                                               Sep-13

                                                                                                       Sep-14
                             May-13

                                                                                     May-14
                                      Jul-13

                                                                                              Jul-14
                   Mar-13

                                                                            Mar-14
          Jan-13

                                                                   Jan-14

                                                                                                                         Jan-15

                                                                                                                                                                                                                                                 Nov-14
                                                                                                                                                               Feb-14

                                                                                                                                                                                                                               Sep-14

                                                                                                                                                                                                                                                                            Feb-15
                                                                                                                                                                                           May-14

                                                                                                                                                                                                                                        Oct-14
                                                                                                                                                                                                                      Aug-14
                                                                                                                                                                                                    Jun-14

                                                                                                                                                                                                             Jul-14
                                                                                                                                                                                  Apr-14
                                                                                                                                                                         Mar-14

                                                                                                                                                                                                                                                          Dec-14
                                                                                                                                                    Jan-14

                                                                                                                                                                                                                                                                   Jan-15
 Source: Eurostat, World Bank staff calculations                                                                                            Source: Eurostat, World Bank staff calculations

EMPLOYMENT CONTINUED TO GROW ACROSS MOST OF THE
REGION, BUT SLOWLY
The modest economic recovery of the last two years has prompted a steady rise in employment. In 2014, employment
grew by 0.8 percent in the EU, with growth in all the regions and sectors, except in agriculture and construction. More than half
of those employed were full-time workers, representing an additional 1.3 million new jobs. Although EU employment remains
2 percent lower than the peak in 2008, it has recovered 2.7 million jobs since the trough (the low point of the cycle) in the first
quarter of 2013. As a result, the EU employment rate for 20-64 year-olds reached nearly 70 percent at the end of 2014, the highest
rate since the end of 2008, with rates above 75 percent in Sweden, Germany, the UK, the Netherlands and Denmark.

 Figure 5. Jobs are being created across the EU

 Employment growth, percent change, annualized

                                                                 2,5

                                                                 2,0

                                                                 1,5

                                                                 1,0

                                                                 0,5

                                                                 0,0

                                                                 -0,5

                                                                 -1,0                                                                       2013      2014

                                                                 -1,5

                                                                 -2,0

                                                                 -2,5
                                                                                     EU28                       EU South                EU Continental                  EU North

 Source: Eurostat, World Bank staff calculations.
page 11

However, significant differences in employment remain between sub-regions, with extremely high rates of youth
unemployment in EU South. Employment growth remained solid in EU Continental and picked up strongly in EU North. The
pick-up in EU North mostly reflects the growth of full-time jobs, particularly in the UK, but was also robust in other countries, with
the exception of Finland where job losses continued as the economy contracted. EU South employment finally began to grow,
having declined significantly over the last few years, with growth in all countries including those with very high unemployment
rates such as Greece and Spain. However, employment rates remain below 60 percent in Greece, Croatia, Spain and Italy, and
unemployment still affects around 50 percent of young active people (aged 15 to 24) in Greece and Spain, and more than 30
percent in Cyprus, Croatia, Italy and Portugal.

 Figure 6. Full-time jobs are now being created across the EU as the recovery becomes more solid

 Annual Employment Changes by Type, in 000s
 EU North                                                          EU South

 1000                                                               1000
                   Overall                                                            Overall
                   Temporary employees                                                Temporary employees
  800                                                                500              Self employment
                   Self employment
                                                                                      Permanent employees
                   Permanent employees

  600                                                                  0

  400                                                                -500

  200                                                               -1000

    0                                                               -1500

 -200                                                               -2000
        Q1 Q2 Q3 Q4 Q1 Q2 Q3 Q4 Q1 Q2 Q3 Q4 Q1 Q2 Q3 Q4                     Q1 Q2 Q3 Q4 Q1 Q2 Q3 Q4 Q1 Q2 Q3 Q4 Q1 Q2 Q3 Q4
            2011            2012         2013           2014                   2011              2012       2013        2014

 Source: Eurostat, World Bank staff estimates and calculations
RECENT ECONOMIC DEVELOPMENTS
   page 12

Employment has grown in EU-CEE. Employment has improved in Bulgaria, Croatia, Poland and Romania across the large
majority of sectors, growing on average by 1.6 percent in 2014, though more in non-tradable than tradable sectors. Employment
is growing in manufacturing, and wholesale and retail sectors, while labor shedding is concentrated in the agriculture and
financial industries. Bulgaria was an exception, where the increase in employment occurred in agriculture sector, while declines in
employment were recorded in the wholesale and retail sectors, as well as public administration. Unemployment rates have also
declined, except in Croatia, where the unemployment rate stood at 18.5 percent at the end of 2014, the third highest in the EU,
after Greece and Spain.

 Figure 7. Employment is growing in key sectors

 Employment changes in 2014, by sector, in Bulgaria, Croatia, Poland and Romania, annualized

                                   2,5

                                   2,0

                                   1,5

                                   1,0

                                   0,5

                                   0,0

                                  -0,5
                                                                 % change on previous
                                  -1,0                           year
                                                                 % change on previous
                                  -1,5
                                                                 quarter
                                  -2,0
                                          Tradable Agriculture Industry     Wholesale     Non-
                                                                                        tradable

 Source: Eurostat, NACE classification, World Bank staff calculations

CURRENT ACCOUNT BALANCES CONTINUED TO IMPROVE ACROSS
THE EU, THOUGH TRENDS HAVE DIVERGED
The EU current account surplus improved modestly to 1.6 percent of GDP in 2014. The improvement is more pronounced
in the Euro area, with the current account surplus increasing by 0.5 percentage points to 3 percent of GDP in 2014. Sizeable
current account surpluses in net creditor economies—particularly Germany, Italy and the Netherlands—contributed most of the
overall improvement in the euro area current account surplus. Current accounts in a majority of Euro area countries are now close
to balance or in surplus. Member States running current account deficits exceeding 1 percent of GDP in 2014 were Greece, France,
Cyprus Latvia, Poland, Finland and the UK. While exchange rate developments and oil price declines supported the rebalancing in
countries that needed to strengthen their external positions, existing surpluses also widened already. In some countries, cyclical
factors also played a role, for example Ireland, the Baltics and Malta exhibit bigger current account surpluses if adjusted for the
cyclical component, while the opposite holds for Greece, Spain, Cyprus and Slovakia.
page 13

 Figure 8. Countries have witnessed significant changes in their current account balances

 Change in 2014, compared to 2013

                      2,5

                      2,0

                      1,5

                      1,0

                      0,5

                      0,0

                      -0,5

                      -1,0

                      -1,5

                      -2,0
                                                                                                   Deficit Countries
                      -2,5
                                     SE

                                    BG

                                     SI

                                    SK

                                    BE

                                                                                                FI

                                                                                               FR
                                                                                               RO
                             EU28

                                                                                               UK
                                    NE
                               EA

                                     ES

                                    EE

                                                                                                EL
                                    AT

                                     IT

                                     IE
                                     LT

                                    LU

                                                                                               LV
                                    PT

                                                                                               PL
                                    MT
                                    DK

                                    DE

                                                                                               CY

                                                                                               CZ
                                    HU

                                    HR

 Source: Ameco and the World Bank staff calculations

 Note: The Figure above refers to the balance on current transactions with the rest of the world. Data may differ from the standard Balance of Payments
 statistics.

Exports between EU countries are growing more strongly, although global conditions remain challenging for
countries exporting to the rest of the world. EU exports grew by 1.2 percent in 2014 (including exports between EU members
and to the rest of the world), and have continued to accelerate in the first two months of 2015. While growth remains subdued, the
structure has altered considerably as intra-EU exports (i.e. exports between EU countries) have rebounded due, in part, to rising
domestic demand and, notably, investment within the EU. At the start of 2014, trade outside the EU’s borders turned negative,
although it started to recover in the last half of 2014, and is now contributing to the overall growth of exports.
The aggregate trade numbers mask divergent trends across sub-regions in both exports and imports. In the second
half of 2014 and the beginning of 2015, the growth in merchandise exports and imports accelerated in EU Continental countries.
Imports by EU South countries started to show signs of growth, after falling for almost two years, while exports have grown
at a rate of around 5 percent year-on-year. Practically all countries in EU North, except Ireland and Denmark, saw their exports
decline—in the UK this may be partially attributed to the appreciation of the currency, while the deteriorating economic situation
in Finland and Russia weighed on exports from the Baltic States. The rapid growth in EU North imports is driven by the recovery
in the UK, and to some extent Ireland and Denmark, while all other countries in the sub-region saw their imports decline (in the
Baltics this may be due to the decline in re-exports).
RECENT ECONOMIC DEVELOPMENTS
   page 14

Exports and imports have continued to pick up in most of the EU-CEE, reflecting the rebalancing of the recovery. In the
Czech Republic and Hungary exports grew at robust rates, but were outpaced by imports, as demand for investment goods like
machinery and transport equipment increased. The largest exports growth in the second half of 2014 and beginning of 2015 was
seen in Croatia, accompanied by a slowdown in imports that reflects the continued weakness of the domestic economy. Robust
export growth continued in Poland and Romania, but with slower growth than in the first half of 2014. In contrast, annualized
imports growth remained relatively stable in both countries, although notably, Polish imports started to decline in 2015 despite
the economy’s relatively strong growth. Bulgaria’s trade dynamics continued to be driven to a large degree by decreases in the
international prices of goods important for foreign trade turnover. By February 2015, exports started to pick up on an annual basis,
reflecting mainly stronger performance in exports to EU countries, but also lately growth in exports towards non-EU countries.

 Figure 9. Trade has picked up, but remains subdued by slowing global growth

 Foreign trade in EU28 by sub-regions, annualized growth rates, seasonally adjusted data
 Exports                                                                                                                                                                             Imports

     25                                                                                                                                                                                 15
                                                           EU South                                                                                                                                                                                                                    EU South
     20
                                                                                                                                                                                        10                                                                                             EU Continental
                                                           EU Continental
     15                                                                                                                                                                                                                                                                                EU North
                                                           EU North
     10                                                                                                                                                                                 5

      5                                                                                                                                                                                 0
      0
                                                                                                                                                                                        -5
     -5

    -10                                                                                                                                                                                -10
                   mar-12

                                                                         mar-13

                                                                                                                               mar-14
          sty-12

                                                                sty-13

                                                                                                                      sty-14

                                                                                                                                                                            sty-15

                                                                                                                                                                                                      mar-12

                                                                                                                                                                                                                                                            mar-13

                                                                                                                                                                                                                                                                                                                   mar-14
                                                                                                                                                                                             sty-12

                                                                                                                                                                                                                                                   sty-13

                                                                                                                                                                                                                                                                                                          sty-14

                                                                                                                                                                                                                                                                                                                                                                sty-15
                                     lip-12

                                                                                           lip-13

                                                                                                                                                 lip-14
                            maj-12

                                                                                  maj-13

                                                                                                                                        maj-14
                                                       lis-12

                                                                                                             lis-13

                                                                                                                                                                   lis-14

                                                                                                                                                                                                                        lip-12

                                                                                                                                                                                                                                                                              lip-13

                                                                                                                                                                                                                                                                                                                                     lip-14
                                              wrz-12

                                                                                                    wrz-13

                                                                                                                                                          wrz-14

                                                                                                                                                                                                               maj-12

                                                                                                                                                                                                                                                                     maj-13

                                                                                                                                                                                                                                                                                                                            maj-14
                                                                                                                                                                                                                                          lis-12

                                                                                                                                                                                                                                                                                                 lis-13

                                                                                                                                                                                                                                                                                                                                                       lis-14
                                                                                                                                                                                                                                 wrz-12

                                                                                                                                                                                                                                                                                        wrz-13

                                                                                                                                                                                                                                                                                                                                              wrz-14
 Source: Eurostat, World Bank staff calculations

INFLATION FELL IN 2014 BECAUSE OF LOWER ENERGY AND FOOD
PRICES AND SUSTAINED OUTPUT GAPS
Declining food and global fuel prices, combined with still significant output gaps, led to falling, and sometimes
negative, inflation in the EU members. In the EU on average, prices fell 0.1 percent from a year earlier in December 2014.
The sharp decline in food prices in Europe reflects a combination of regional developments, such as a good harvest in Romania
and the introduction of embargoes and countersanctions on European food exports to Russia, as well as global price declines.
The drop in energy prices is largely driven by global developments. In addition, the slow recovery in the EU, undermined by
increased geopolitical tensions, suppressed 12-month core inflation, which fell to 0.6 percent in March 2015, compared to around
1.5 percent in the US and other OECD countries. While in the first months of 2015 12-month headline inflation stayed negative,
the pace of price declines diminished, as a result of the ECB’s expanded QE program and associated depreciation of the Euro
against other major currencies (see Box 2).
page 15

Figure 10. EU inflation rates have fallen rapidly                                                                                                        Figure 11...driven by energy and food prices
Consumer inflation, 2013-15, percent change year-on-year                                                                                                 Contributions to headline inflation in EU, 2013-15, percentage
                                                                                                                                                         points

   2,5                                                                                                                                                    2,5
                                                                                                                                                                                                     Food                 Energy
                                                                                                                                                            2                                        Core                 Overall
   2,0

   1,5                                                                                                                                                    1,5

   1,0                                                                                                                                                      1

   0,5                                                                                                                                                    0,5

   0,0                                                                                                                                                      0

  -0,5                                                                                                                                                   -0,5

  -1,0
                                                                                                                                                           -1
                                     lip-13

                                                                                           lip-14
         sty-13

                                                                sty-14

                                                                                                                      sty-15
                            maj-13

                                                       lis-13

                                                                                  maj-14

                                                                                                             lis-14
                   mar-13

                                              wrz-13

                                                                         mar-14

                                                                                                    wrz-14

                                                                                                                               mar-15

                                                                                                                                                         -1,5

                                                                                                                                                                                            paź-13

                                                                                                                                                                                                                                   paź-14
                                                                                                                                                                sty-13

                                                                                                                                                                                                       sty-14

                                                                                                                                                                                                                                             sty-15
                                                                                                                                                                                  lip-13

                                                                                                                                                                                                                          lip-14
                                                                                                                                                                         kwi-13

                                                                                                                                                                                                                 kwi-14
                                     EU28                           OECD                            USA

Source: Eurostat, World Bank staff calculations                                                                                                          Source: Eurostat, World Bank staff calculations

Inflation rates turned negative first in EU South in 2014, with EU Continental following in 2015. Negative output gaps,
low core inflation in EU South, accompanied by falling food and oil prices pushed the consumer price index to negative territory
in mid-2014. Declining food and energy prices have been common for all three sub-regions of the EU, although decreasing price
pressures have started to ease as international oil prices may have stabilized. Despite strengthening growth performance, core
inflation in EU Continental has also continued to trend downwards, consistent with the large output gaps and high unemployment
still faced by many EU countries, leading to overall price declines in early 2015. In EU North core inflation has been highest,
reflecting stronger economic growth and employment, and headline inflation remains positive.

Figure 12. Core inflation remains low but positive in most regions of the EU
Contribution to headline inflation rate, 2013-15, percentage points

   4                                                                                                                     4                                                                 4                EU North
                  EU South                                                                                                              EU Continental
   3                                                                                                                     3                                                                 3

   2                                                                                                                     2                                                                 2

   1                                                                                                                     1                                                                 1

   0                                                                                                                     0                                                                 0

  -1                                                                                                                   -1                                                                  -1

  -2                                                                                                                   -2                                                                  -2
                                                                                                                               mar-13

                                                                                                                               paź-13

                                                                                                                               mar-14

                                                                                                                               paź-14

                                                                                                                               mar-15

                                                                                                                                                                                                 mar-13

                                                                                                                                                                                                 paź-13

                                                                                                                                                                                                 mar-14

                                                                                                                                                                                                 paź-14

                                                                                                                                                                                                 mar-15
                                                                                                                                sty-13

                                                                                                                                sty-14

                                                                                                                                sty-15

                                                                                                                                                                                                  sty-13

                                                                                                                                                                                                  sty-14

                                                                                                                                                                                                  sty-15
                                                                                                                                sie-13

                                                                                                                               gru-13

                                                                                                                                sie-14

                                                                                                                               gru-14

                                                                                                                                                                                                  sie-13

                                                                                                                                                                                                 gru-13

                                                                                                                                                                                                  sie-14

                                                                                                                                                                                                 gru-14
                                                                                                                                 lip-13

                                                                                                                                 lip-14

                                                                                                                                                                                                   lip-13

                                                                                                                                                                                                   lip-14
                                                                                                                               maj-13

                                                                                                                               maj-14

                                                                                                                                                                                                 maj-13

                                                                                                                                                                                                 maj-14
                                                                                                                                  lis-13

                                                                                                                                  lis-14

                                                                                                                                                                                                    lis-13

                                                                                                                                                                                                    lis-14
                                                                                                                               wrz-13

                                                                                                                               wrz-14

                                                                                                                                                                                                 wrz-13

                                                                                                                                                                                                 wrz-14
                                                                                                                                lut-13

                                                                                                                               cze-13

                                                                                                                                lut-14

                                                                                                                               cze-14

                                                                                                                                lut-15

                                                                                                                                                                                                  lut-13

                                                                                                                                                                                                 cze-13

                                                                                                                                                                                                  lut-14

                                                                                                                                                                                                 cze-14

                                                                                                                                                                                                  lut-15
                                                                                                                               kwi-13

                                                                                                                               kwi-14

                                                                                                                                                                                                 kwi-13

                                                                                                                                                                                                 kwi-14
         paź-13

         paź-14
         mar-13

         mar-14

         mar-15
          sty-13

          sty-14

          sty-15
          sie-13

         gru-13

          sie-14

         gru-14
           lip-13

           lip-14
         maj-13

         maj-14
            lis-13

            lis-14
         wrz-13

         wrz-14
          lut-13

         cze-13

          lut-14

         cze-14

          lut-15
         kwi-13

         kwi-14

Source: Eurostat, World Bank Staff calculations
RECENT ECONOMIC DEVELOPMENTS
   page 16

THE ECB EXPANDED ITS STIMULUS PROGRAM IN RESPONSE TO
LOW INFLATION AND LARGE OUTPUT GAPS
The euro exchange rate has depreciated strongly amid the expansion of the ECB’s quantitative easing (QE) and the
expectation that the US Fed will gradually adopt a less accommodative monetary policy stance. The ECB’s QE was
introduced to counter the very low levels of inflation and to bolster the recovery (see Box 1). Inflation expectations remain muted
and output gaps elevated in the EU and Japan, particularly in comparison to the US and UK, which has led to the ECB introducing
the ‘Asset Purchase Program’ (APP) in 2015. This comes after the US and UK ended their QE in late 2014, and are contemplating a
gradual rise in policy rates, though no earlier than late 2015. The divergence in monetary policies between the ECB (and Japan)
and the USA (and UK) – and a similar divergence in economic outlooks, modest as it may be – have become a key factor for
foreign exchange rates and capital movements in the second half of 2014 and early 2015. The euro has experienced substantial
fluctuations compared to some other major currencies since the beginning of this year. While the Euro has weakened substantially
against the US Dollar and the Pound Sterling, it has experienced more limited movements against most other EU currencies in
the context of accommodative monetary policy actions taken by several central banks in the EU. In contrast, the Euro appreciated
strongly against the Russian Ruble, which came under pressure amid geopolitical tensions related to the situation in Ukraine.

EU-CEE countries have experienced some of the highest rates of deflation across the EU, despite continuing to ease
monetary policy. Bulgaria had the largest negative inflation rate for consumer prices in the EU in 2014, at an average of 1.6
percent over the year (compared to Greece who recorded a decline of 1.4 percent), as falling international prices combined with
administrative cuts in electricity prices and in prices of some services (healthcare, telecommunications, and transport). Poland’s
inflation rate turned negative in the second half of the year as it experienced some of the strongest declines in food prices across
the EU, owing to a good harvest and the impact of the sanctions and embargos with Russia. With little core inflation, Poland’s
Monetary Policy Council decided to reduce the key interest rate by 100 basis points in two steps in October 2014 and March
2015, bringing it to the historically low level of 1.5 percent. Prices also continued to fall in Croatia in 2014, at 0.2 percent over the
year, as the economy continued in recession. Despite a downward trend, headline inflation in Romania was the highest in the EU
(1.6 percent in 2014), as food and services prices rose, mainly as a result of the currency depreciation. Below target inflation also
led the National Bank of Romania to lower the main policy rate from 5.25 percent in June 2013 to 2 percent by April 2015. Similar
trends were witnessed elsewhere across the sub-region with prices declining in Slovakia and at zero in Hungary in 2014, before
becoming negative in early 2015.
page 17

 Box 1. ECB’s QE aims to stimulate activity and bring inflation back to target

 In early March, the ECB Council announced additional measures to ease monetary policy through an expansion
 of its Quantitative Easing (QE) program. Starting in April 2015, the ECB commenced monthly purchases of public and
 private sector securities amounting to EUR 60bn, under the APP, which incorporated the more limited Targeted Long Term
 Refinancing Operation (TLTRO). AAP is intended to last until September 2016, adding around EUR 1.1 trillion to the markets. It
 aims to set EU inflation on a sustained adjustment path consistent with achieving the target of below, but close to, 2 percent
 over the medium term. There will be no primary market purchases under the QE (i.e. direct purchases from issuers such as
 governments), regardless of the type of security. However, there is flexibility for national central banks to purchase their shares
 within the universe of eligible instruments.

  Figure 13. The Euro has fallen significantly

  Percent change in real effective exchange rate, Jan. 2014-Mar. 2015
                               8
                               6
                               4
                               2
                               0
                               -2
                               -4
                               -6
                               -8
                              -10
                              -12
                              -14
                                    EA   DK    UK    SE    HU    PL   CZ    BG    RO    HR

  Source: BIS
 The QE program has begun to feed through to the economy via a number of channels. Firstly, it provides a signal that
 interest rates in the EU should remain low for a sustained period, informing the asset placement decisions of both investors
 and portfolio managers. It is also impacting sovereign bond yields directly—particularly as new issuance has fallen in line
 with lower government deficits in many countries—and yields on short-term government debt have turned negative in some
 countries (see below). As liquidity has increased, equity markets have also surged across Europe, mirroring the experience
 of QE in the US and UK. In addition, the Euro exchange rate has fallen against most major currencies, providing a boost for
 exporters as well as raising import prices, which should directly boost inflation. The real effective exchange rate of the Euro
 area (i.e. the exchange rate adjusted for trade and inflation) has depreciated by almost 10 percent since the start of the year.
 However, the impact has been much less pronounced outside the Euro area, in countries like Hungary, Poland, Romania and
 the Czech Republic, where real effective exchange rates have diverged. The UK and Switzerland have witnessed significant
 currency appreciation, partly as capital has flowed in to these well-performing economies.

THERE ARE WELCOME SIGNS THAT CREDIT IS PICKING UP AND
STARTING TO SUPPORT INVESTMENT
Financing conditions improved substantially as 2014 drew to a close, thanks to improving bank balance sheets and
market expectations that the ECB would expand its QE program. Yields on long-term government bonds declined, with
short-term yields in several countries turning negative (i.e. in Austria, Belgium, Germany, Finland, France and the Netherlands,
while Poland issued a bond in Swiss Francs with a negative yield), with some volatility linked to the uncertainty surrounding
Greece’s continued access to financial assistance. Corporate bond spreads–both financial and non-financial issuers–also declined
to levels close to those observed prior to the onset of the financial crisis. This was probably fuelled by expectations that the ECB’s
APP would result in portfolio-rebalancing effects and an increasingly difficult search for higher yields, and possibly reflects more
positive market sentiment with regard to the ongoing effort to raise the capitalization of financial institutions across the EU. In an
RECENT ECONOMIC DEVELOPMENTS
   page 18

environment where lending rates have also fallen to very low levels, both the supply of and demand for bank credit have started
to improve. The annual growth of credit to the private sector continued to recover as a result of the slower pace of the decline in
loans to companies, while the growth of loans to households has stabilized.
Lower bank lending rates have supported credit growth. Although the subdued economic climate and historically tight
lending conditions still weigh on loan provision, recent editions of the Euro area bank lending survey confirm credit supply
tensions are gradually easing and point to rising demand for loans. The April 2015 Euro area bank lending survey points to further
improvements in lending conditions as banks continued to ease credit standards for loans to the corporate sector in the first
quarter of 2015, while for loans to households the picture was mixed. The easing for the corporate sector was attributed to the
decline in the cost of bank funds and improved balance sheet conditions, as well as stronger competitive pressures among banks.
The survey also shows that additional liquidity from the APP is being used by banks for granting loans. The survey points to a pick-
up in demand for loans from non-financial corporations, for housing loans to households and for consumer credit. In this context,
the low general level of interest rates has been an important driver of demand for loans to both firms and households.
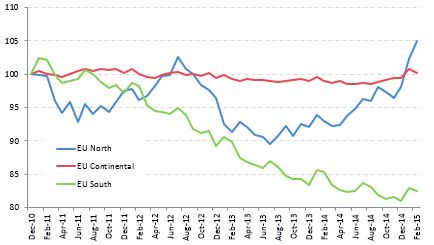
Compared with mid-2014, credit conditions are slowly improving, but remain challenging in several countries. The
strongest credit growth was recorded in EU North, driven solely by the strong performance of the UK. In other countries in the
sub-region, the picture was mixed; credit grew over the year in Estonia, Denmark and Finland, while it continued to contract in
the rest of the countries. The annual rate of change in loans to the private sector in EU Continental increased by an annual 1.2
percent in February 2015 as all countries recorded positive growth rates, including those countries where credit growth was still
contracting during 2014 (i.e. Hungary, the Czech Republic, the Netherlands, Austria and France). In contrast, in EU South, the
contraction in bank lending to the private sector moderated. Despite these positive trends, the consolidation of bank balance
sheets and further deleveraging needs in some economic sectors and banking jurisdictions continues to curtail credit growth in
most countries.

 Figure 14. Credit is slowly picking up                                                                     Figure 15. Real credit trends continue to diverge

 Private credit growth in real terms and contribution, Index of real credit growth, Dec 2010=100
 percentage points

   15                                                                                                       115
                                                                                                                                               BG                                   PL
   10                                                                                                       110                                RO                                   HR

    5                                                                                                       105

    0
                                                                                                            100

    -5
                                                                                                            95

   -10             Credit to households
                                                                                                            90
                   Credit to enterprises
   -15
                   Credit growth                                                                            85
   -20
                               lut-15

                                                                     lut-15

                                                                                                   lut-15
         gru-13

                     gru-14

                                           gru-13

                                                         gru-14

                                                                              gru-13

                                                                                          gru-14

                                                                                                            80
                                                                                                                                                               paź-11

                                                                                                                                                                                                                     paź-12

                                                                                                                                                                                                                                                                           paź-13

                                                                                                                                                                                                                                                                                                                                 paź-14
                                                                                                                  gru-10

                                                                                                                                                      sie-11

                                                                                                                                                                        gru-11

                                                                                                                                                                                                            sie-12

                                                                                                                                                                                                                              gru-12

                                                                                                                                                                                                                                                                  sie-13

                                                                                                                                                                                                                                                                                    gru-13

                                                                                                                                                                                                                                                                                                                        sie-14

                                                                                                                                                                                                                                                                                                                                          gru-14
                                                                                                                           lut-11

                                                                                                                                             cze-11

                                                                                                                                                                                 lut-12

                                                                                                                                                                                                   cze-12

                                                                                                                                                                                                                                       lut-13

                                                                                                                                                                                                                                                         cze-13

                                                                                                                                                                                                                                                                                             lut-14

                                                                                                                                                                                                                                                                                                               cze-14

                                                                                                                                                                                                                                                                                                                                                   lut-15
                                                                                                                                    kwi-11

                                                                                                                                                                                          kwi-12

                                                                                                                                                                                                                                                kwi-13

                                                                                                                                                                                                                                                                                                      kwi-14

                  EU North                          EU Continental                     EU South

 Source: ECB, World Bank staff estimates and calculations                                                   Source: ECB, World Bank staff estimates and calculations
                                                                                                            Note: The real credit developments are not adjusted for statistical one-
                                                                                                            time effects.

Credit growth dynamics differed greatly among countries in Central and Eastern Europe (EU-CEE). Although bank
lending has started a new recovery period driven by credit growth in a handful of countries, Croatia and Romania continue to
record declines in credit to businesses. In contrast, Poland witnessed the restoration of corporate sector lending at the beginning
of 2015, leading to sustained corporate credit growth as the economy has strengthened. Credit growth in Bulgaria contracted
in November 2014, with a double-digit decline in corporate lending. The decline in corporate lending reflects the exposure of
Corporate Commercial Bank (the fourth largest bank in Bulgaria), whose banking license was revoked in November on the basis
of international auditors’ assessments on the quality of assets and financial performance and consequently the bank has been
excluded from monetary statistics since November 2014. Reassuringly, in the last three months of 2014, the average value of newly
page 19

extended loans to the corporate sector continued to match that of early 2014. As of December 2014 claims on the household
sector recorded a 1.6 percent decline on an annual basis.

Some encouraging signs can be seen in the resolution of Non-Performing Loans (NPLs) among EU-CEE. The resolution
of NPLs continues to be one of the major priorities to bolster credit growth, and a concerted effort by regulators and banks is
needed to speed up write-offs and facilitate loan restructuring, as it is already happening in some countries. NPLs in Croatia
decreased to 17.1 percent at end-2014, from 17.2 percent in September 2014, but are still significantly higher than in 2013 (15.7
percent). Corporate sector NPLs reached 30.8 percent, while household NPLs amounted to 12 percent. In Romania and Bulgaria,
banks continued with their efforts to reduce NPLs, but they continue to remain at an elevated level above 15 percent. On the
other hand, NPLs in Poland remained below 5 percent.

 Figure 16. Credit demand is increasing in Emerging Figure 17. Funding Conditions are easing
 Europe
 IIF EM Bank Lending Conditions by Category, diffusion index, IIF EM Funding Conditions, diffusion index 50=neutral
 50=neutral

     70                                                                                90

     65                                         Credit Standards                                   Emerging Europe
                                                                                       80
                                                Nonperforming Loans                                Global Emerging Markets
     60
                                                                                       70
     55                                         Demand for Loans
                                                                                       60
     50
                                                                                       50
     45
                                                                                       40
     40

     35                                                                                30

     30                                                                                20
                                                                                            09Q4
                                                                                            10Q1
                                                                                            10Q2
                                                                                            10Q3
                                                                                            10Q4
                                                                                            11Q1
                                                                                            11Q2
                                                                                            11Q3
                                                                                            11Q4
                                                                                            12Q1
                                                                                            12Q2
                                                                                            12Q3
                                                                                            12Q4
                                                                                            13Q1
                                                                                            13Q2
                                                                                            13Q3
                                                                                            13Q4
                                                                                            14Q1
                                                                                            14Q2
                                                                                            14Q3
                                                                                            14Q4
                                                                                            15Q1
          09Q4

                 10Q2

                        10Q4

                               11Q2

                                      11Q4

                                             12Q2

                                                    12Q4

                                                           13Q2

                                                                  13Q4

                                                                         14Q2

                                                                                14Q4

 Source: IIF, World Bank staff calculations.
RECENT ECONOMIC DEVELOPMENTS
   page 20

FISCAL CONSOLIDATION CONTINUED, BUT THE PACE IS EASING
Fiscal consolidation has helped bring down deficit levels and rebuilt some fiscal space. The European Union has achieved
significant fiscal consolidation, which has helped reduce fiscal deficit levels to below 3 percent of GDP in many countries. These
deficit levels were last seen before the outbreak of the global financial crisis. Most of the fiscal effort in Europe was frontloaded
in 2011, while in the US, the biggest fiscal adjustment took place in 2013. The fiscal effort in 2014 was much lower, reflecting less
urgent need for further adjustment and the aim of supporting the nascent recovery, although many countries are still aiming to
reach lower medium-term deficit targets and reduce still high public debt levels.

 Figure 18. Fiscal consolidation has been significant
 Reduction in fiscal deficit by year, percentage points of GDP

                         7,0
                         6,0
                         5,0
                         4,0
                         3,0
                         2,0
                         1,0
                         0,0
                        -1,0
                        -2,0
                        -3,0
                        -4,0
                                                                             TUR

                                                                                                                                  EU North
                                                    ZAF

                                                                AUS

                                                                                                                           EU28
                                       CHL

                                                                       JPN
                                              MEX
                                 KOR

                                                                                   RUS

                                                                                                                                             USA
                                                                                                    CAN
                                                          IDN

                                                                                         EU South

                                                                                                          EU Continental

                                             2011    2012       2013     2014      2010-2014

 Source: Eurostat, OECD, World Bank staff calculations

Fiscal deficits declined across Europe in 2014, with the aggregate level below the Stability and Growth Pact threshold.
The EU-wide fiscal deficit declined from 3.2 percent of GDP in 2013 to 2.8 percent of GDP in 2014, driven largely by improvements
in revenue collection as stronger domestic demand boosted VAT and income tax receipts. The already low, and declining, fiscal
deficit in EU Continental, at 1.7 percent of GDP in 2014, is the main driver of the EU-wide outcome. In terms of deficit reduction in
2014, the majority of the fiscal adjustment came from EU South, where the fiscal deficit declined from 4.9 percent of GDP in 2013
to 4 percent of GDP in 2014, reflecting significant deficit reductions in Greece, Spain and Slovenia. In EU North the fiscal deficit
declined by 0.6 percent of GDP due to strong improvements in the fiscal positions of Denmark, Lithuania, Ireland, and the UK.
Reflecting the improved fiscal performance, in 2014 the European Council closed excessive deficit procedures (EDP) for Belgium,
the Czech Republic, Denmark, the Netherlands, Austria and Slovakia, leaving 11 countries subject to the EDP, down from 24 during
2010-114.

4 The EDP applies to countries having breached or being in risk of breaching the deficit threshold of 3 percent of GDP or having violated the
debt rule by having a government debt level above 60 percent of GDP, which is not diminishing at a satisfactory pace. The 11 countries still
under the EDP in 2015 include: Croatia, Malta, Cyprus, Portugal, Poland, the UK, Slovenia, France, Ireland, Greece and Spain. In May 2015 the
European Commission recommended to the European Council to close the EDP for Malta and Poland.
page 21

 Figure 19. The fiscal consolidation effort continues…                                                                      Figure 20. …across all regions of the EU
 Fiscal balances in 2013-14, percent of GDP                                                                                 Reduction in fiscal deficit by sub-region, percentage points of
                                                                                                                            GDP

                 EU28                   EU South            EU Continental                            EU North                2,0
   0,0

                                                                                                                              1,5
   -1,0

   -2,0                                                                                                                       1,0

   -3,0                                                                                                                       0,5

   -4,0
                                                                                                                              0,0

   -5,0
                                                                                                                             -0,5
   -6,0                                                                                                                                 2010                        2011                     2012                   2013                     2014

                             2014 planned in April         2014 final                    2013                                                     EU South                     EU Continental         EU North               EU28

 Source: Eurostat, World Bank staff calculations                                                                            Source: Eurostat, World Bank staff calculations

Public debt levels remain elevated and are among the highest in the OECD, reflecting large debt accumulation in
the post-crisis years. While the overall increase in indebtedness in 2010-2014 in Europe was very similar to the US, there is a
significant variation within the EU. In particular, public debt in EU South increased by more than 25 percent of GDP and its level
is now well above 100 percent of GDP. The pace of debt accumulation in Europe slowed markedly in 2014, reflecting better fiscal
positions of many countries and higher economic growth.

 Figure 21. Public debt levels have increased                                                                               Figure 22. The rate of debt increase has slowed
 Public debt to GDP ratio, percent                                                                                          Change in public debt to GDP ratio, percentage points of GDP

  250                                                                                                                          35,0
                                                                                                                               30,0
                                                                                                                               25,0
  200
                                                                                                                               20,0
                                                                                                                               15,0
  150                                                                                                                          10,0
                                                                                                                                5,0
  100                                                                                                                           0,0
                                                                                                                               -5,0
                                                                                                                              -10,0
   50                                                                                                                         -15,0
                                                                                                                                      TUR

                                                                                                                                                                                                                      EU North

                                                                                                                                                                                                                                 ZAF
                                                                                                                                                                                                             EU28

                                                                                                                                                                                                                                       AUS
                                                                                                                                                                                 CHL

                                                                                                                                                                                                                                                         JPN
                                                                                                                                                                                               MEX
                                                                                                                                                                         KOR

                                                                                                                                                                                       RUS

                                                                                                                                                                                                       USA
                                                                                                                                                  CAN
                                                                                                                                            IDN

                                                                                                                                                        EU Continental

                                                                                                                                                                                                                                              EU South
     0
                      TUR

                                                            EU North
                                         ZAF
                            AUS

                                                                                              EU28
          CHL

                                                                                                                      JPN
                                               MEX
                                  KOR
                RUS

                                                                                                     USA
                                                                                        CAN
                                                     IDN

                                                                       EU Continental

                                                                                                           EU South

                                                                                                                                                        2011               2012        2013          2014     2010-2014

 Source: Eurostat, OECD, World Bank staff calculations, 2014                                                                Source: Eurostat, OECD, World Bank staff calculations

Fiscal positions have improved across most countries in EU-CEE. While average debt levels in countries in EU-CEE are
generally below the EU average, at just over 50 percent of GDP, they have risen above 75 percent in Cyprus, Hungary, Croatia and
Slovenia. Of these, Hungary managed to keep its fiscal deficit below 3 percent of GDP, despite a stimulus in 2014 from increased
investment spending that resulted in the deficit rising to 2.6 percent of GDP, (this was below budget expectations as tax revenues
outperformed).

Fiscal consolidation continued in Poland. The fiscal deficit narrowed to 3.2 percent of GDP in 2014 from 4 percent in 2013,
due to stronger-than-expected revenue collection as domestic demand pushed up VAT receipts. In addition, changes to second
pillar pensions have reduced the government’s social contributions. Expenditures are also expected to have turned out lower
than in 2013 largely due to the continued freeze in public sector wage levels and lower interest payments. Given Poland’s fiscal
balance in 2014 and taking into account the cost of systemic pension reform of 0.4 percent of GDP, the European Commission
recommended that the European Council abrogates the EDP for Poland in 2015, i.e. one year ahead of schedule. The public debt
stock declined to 50.1 percent of GDP in 2014 from 55.7 percent in 2013, as the reform of the second pillar pension reduced the
debt stock by some 7.6 percent of GDP (as government bonds were returned to the government balance sheet).

In Romania, the fiscal deficit reached 1.5 percent of GDP, down from 2.2 percent of GDP in 2013. The outturn masks
the low absorption of EU funds and delays in implementing structural reforms, in particular the liberalization of gas prices for
households and the restructuring of the state-controlled energy generation sector.

The fiscal deficit on accrual basis rose to 2.8 percent of GDP in Bulgaria, up from 0.9 percent of GDP in 2013 mainly as
a result of expenditure slippages in healthcare sector and weaker than expected revenues. The Government provided
support to the banking sector at the level of 2.4 bln BGN, equivalent to nearly 3 percent of GDP. The Government issued additional
debt, pushing the debt stock up by 9.3 percentage points of GDP, compared to the end of 2013. Nevertheless, Bulgaria still has
one of the lowest government debt-to-GDP ratios in the EU, at around 28 percent.

The fiscal deficit reached 5.7 percent of GDP in Croatia, and was significantly higher than the indicative target
agreed under the EU Excessive Deficit Procedure (EDP). The target under the EDP was 4.6 percent of GDP. Revenues were
underpinned by improved social security contributions due to increase in health insurance contribution rate, while expenditures
rose, reflecting growing interest payments and transfers to the EU budget (while the absorption of EU funds for projects was
conversely very low). This contributed to a further rise in public debt to 85 percent of GDP.

 Figure 23. Fiscal deficits and debt in Poland, Romania, Bulgaria and Croatia

 Fiscal deficit and public debt to GDP ratio, percent

                                  0,0                                                                                     90,0
                                                                                                                          80,0
                                 -1,0
                                                                                                                          70,0
                                 -2,0
                                                                                                                          60,0
                                 -3,0                                                                                     50,0

                                 -4,0                                                                                     40,0
                                                                                                                          30,0
                                 -5,0
                                                                                                                          20,0
                                 -6,0
                                                                                                                          10,0
                                 -7,0                                                                                     0,0
                                         2013        2014    2013        2014      2013        2014    2013        2014
                                                PL                  RO                    BG                  HR

                                                            Fiscal deficit (LHS)          Public debt (RHS)

 Source: Eurostat, World Bank staff calculations
OUTLOOK
OUTLOOK
   page 24

EU’S RECOVERY IS STRENGTHENING IN A DIVERGING WORLD
All the economies of the EU are expected to grow in 2015 and 2016, the first time this has happened since 2007.
Domestic demand looks set to become the main engine of growth across the EU as confidence in the modest global recovery
grows, bolstered by the heavy reliance on robust growth in the US, as above trend growth and job creation carry over into 2015.
Meanwhile, activity in China and the other BRICS, except India, is expected to continue to moderate. While the decline in oil
prices should support medium-term growth, the prospects for oil importers and oil-exporters will diverge in the short-term as the
exporters face a tough adjustment process. The diverging global growth rates are also likely to be reflected in diverging monetary
policy, with the US and UK expected to start to gradually raise interest rates, though not earlier than late 2015, while the EC, Japan
and China amongst others continue an easing cycle.

 Figure 24. Growth is set to strengthen

 GDP growth 2014-16, percent

                             3,0
                                                                  2014      2015   2016
                             2,5
                                                           2,5           2,5
                                                                   2,4
                             2,0
                                                  2,0                                           1,9
                                            1,8
                             1,5                                                          1,7                          1,6
                                      1,3                                                                     1,4
                             1,0                                                   1,2

                             0,5
                                                                                                      0,5
                             0,0
                                            EU                   EU North          EU Continental           EU South

 Source: Eurostat, World Bank staff estimates and calculations

Private consumption is set to continue growing in 2015, as the purchasing power of households increases. This
reflects improved labor market conditions (i.e. increasing employment, low inflation and growing real wages), combined with
the substantial decline in oil prices which is boosting real disposable income throughout the EU, a large oil importer. However,
private consumption is not expected to return to pre-crisis levels for some time, given the tighter credit conditions and still high
public and corporate debt levels in many parts of the EU. After two years of decline, investment also looks to have finally reached a
turning point and is expected to start contributing positively to growth, due to growing business confidence, increased industrial
production, and EU-funded investment projects.
page 25

 Figure 25. Domestic consumption is expected to be the main driver of growth

 Percent change, 2006-2015

                                                    EU South       EU Continental      EU North
                              4,0

                              3,0

                              2,0

                              1,0

                              0,0

                             -1,0

                             -2,0

                             -3,0

                             -4,0
                                    2006   2007   2008   2009   2010   2011   2012   2013   2014 2015(f)

 Source: Eurostat, World Bank staff estimates and calculations

Inflation across the EU is likely to bottom out in 2015, before gradually picking up. EU inflation is forecast to fall from
0.4 percent in 2014 to 0.1 percent in 2015, before rising to around 1.5 percent in 2016, as stronger domestic demand and base
effects (from the fall in oil and food prices) gradually lift prices higher. This view is also supported by inflation expectations surveys
conducted by the ECB, which show that professional forecasters expect prices will rise over the next 12 months, even in the
countries that are experiencing outright deflation.

The drag from fiscal consolidation is also set to moderate. The adjustment in governments’ fiscal deficits is projected to
be more gradual than in previous years, as the fiscal situation across the EU has improved markedly and the need for urgent
fiscal consolidation lessened. In addition, the much lower interest costs provide the opportunity to meet headline targets while
easing the pressure to reduce other types of spending. The aggregate fiscal deficit is expected to drop from 2.9 percent of GDP
in 2014, to 2.5 percent of GDP in 2015. After a rapid period of restructuring, the EU Continental countries are enjoying the best
fiscal outcomes among the EU sub-regions, led by Germany whose deficit is expected to remain around 0.5 percent of GDP.
While a number of countries are not expected to be able to comply with the EU threshold deficit levels of 3 percent of GDP in
2015—these include Croatia, France, Portugal, Spain, Slovenia, and the UK—significant progress is expected to continue to be
made to achieve this in either 2016 or 2017. As the economic situation improves, the cyclical factors will increasingly support the
consolidation effort, meaning that although the consolidation will continue, the pace and its drag on overall economic growth, is
expected to moderate.
OUTLOOK
  page 26

Figure 26. As the fiscal drag moderates

Fiscal balance, percent of GDP, 2009-2015
                                               0
                                                    2009     2010    2011      2012      2013      2014      2015f
                                               -1

                                               -2

                                               -3

                                               -4

                                               -5

                                               -6

                                               -7

                                               -8

                                               -9

                                                           EU28     EU South      EU Continental      EU North

Source: Eurostat, World Bank staff estimates and calculations

Box 2. The impact of low oil prices for the EU

Global oil prices plunged by about 60 percent, from USD 115 per barrel in mid-June of 2014 to USD 48 at end-
January 2015, while other fuel prices have continued the slow downward trend of recent years. Oil prices have
begun to find some support in early 2015, but are expected to remain well below their 2013 levels during the next decade.
Second-round effects of low oil prices on other commodities, together with robust supplies and soft demand, are expected to
keep prices low for most other commodities in the medium-term.

The fall in oil price is expected to provide a positive boost to the global economy as a whole, but the effects will
vary across countries. A 30 percent oil price decline, driven by a supply shock, would be associated with an increase in world
GDP of about 0.5 percent in the medium-term (World Bank Global Economic Prospects, January, 2015). In the oil importing
EU, the lower oil price leaves consumers more disposable income, which they can spend on various goods and services, and
reduces production costs in energy-intensive sectors, which do not extract but use oil. The EU-CEE would benefit more than
most countries because their economies are relatively oil intensive. The figure below shows the long-term impact of a 60
percent drop in oil prices on private consumption, where coal and gas prices also fall, by around 50 and 30 percent respectively.

Long-term impact of oil price changes on private consumption (percent change)

                                          12
                                          10                                   60% lower oil prices
                                                                               30% lower oil prices
                                           8
                                           6
                                           4
                                           2
                                           0
                                                        Belgium
                                                         Greece
                                                         Estonia

                                                           Czech

                                                         Austria
                                                       Hungary

                                                        Sweden
                                                            Italy

                                                              UK

                                                      Denmark
                                                         Ireland
                                                      Lithuania

                                                      Germany
                                                           Spain
                                                       Romania
                                                         Finland
                                                       Bulgaria

                                                         Croatia

                                                       Slovenia

                                                              EU
                                                       Slovakia

                                                          france

                                                    Netherlands
                                                       Portugal
                                                         Poland
                                                           Latvia

Cheap oil and other fossil fuels also create a challenge for alternative low-carbon technologies, which suddenly
become less attractive. If fuel prices remain low, a further switch towards low- or zero-carbon technologies will depend
largely on energy and climate policies and regulations, rather than market-driven prices of fossil fuels. The EU has the most
ambitious climate policy targets for 2020 of any region of the world, and carbon emissions are controlled by the EU Emissions
Trading Scheme (ETS) and national non-ETS emission limits. The carbon price in the EU helps control emissions by raising the
relative price of carbon-intensive fuels—as a result, improvements in EU terms of trade due to falling world oil prices would
provide less of a boost to welfare.

Source: World Bank, Low Oil prices: Long-term Economic Effects for the EU and other Global regions, Kasek and Boratynski, MFM Discussion paper No.
3, March 2015
You can also read