A Global Audit of the Status and Trends of Arctic And Northern Hemisphere Goose Populations - CAFF
←
→
Page content transcription
If your browser does not render page correctly, please read the page content below

A Global Audit of the Status and Trends
of Arctic And Northern Hemisphere
Goose Populations

                                          ARCTIC COUNCIL
Acknowledgements
                                                                                                             For more information please contact:
CAFF Designated Agencies:                                                                                          CAFF International Secretariat
 • Norwegian Environment Agency, Trondheim, Norway                                                                             Borgir, Nordurslod
                                                                                                                            600 Akureyri, Iceland
 • Environment and Climate Change Canada, Ottawa, Canada
                                                                                                                           Phone: +354 462-3350
 • Faroese Museum of Natural History, Tórshavn, Faroe Islands (Kingdom of Denmark)
                                                                                                                              Fax: +354 462-3390
 • Finnish Ministry of the Environment, Helsinki, Finland
                                                                                                                                Email: caff@caff.is
 • Icelandic Institute of Natural History, Reykjavik, Iceland                                                                Website: www.caff.is
 • The Ministry of Nature and Environment, Greenland
 • Russian Federation Ministry of Natural Resources, Moscow, Russia
 • Swedish Environmental Protection Agency, Stockholm, Sweden
 • United States Department of the Interior, Fish and Wildlife Service, Anchorage, Alaska

CAFF Permanent Participant Organizations:
 • Aleut International Association (AIA)
 • Arctic Athabaskan Council (AAC)
 • Gwich’in Council International (GCI)
 • Inuit Circumpolar Council (ICC) – Greenland, Alaska, Canada and Russia
 • Russian Indigenous Peoples of the North (RAIPON)
 • Saami Council

This report and associated materials can be downloaded for free at: http://www.caff.is/goose

This publication should be cited as Fox, A.D. & Leafloor, J.O. (eds.) 2018. A global audit of the status and trends of Arctic and Northern
Hemisphere goose populations. Conservation of Arctic Flora and Fauna International Secretariat: Akureyri, Iceland. ISBN 978-9935-431-66-0.

or

CAFF. 2018. A Global audit of the status and trends of Arctic and Northern Hemisphere goose population. Conservation of Arctic Flora and
Fauna International Secretariat, Akureyri, Iceland. ISBN 978-9935-431-66-0

Editors: Anthony D. Fox & James O. Leafloor
Project Steering Committee: Anthony D. Fox, Tom Barry, Tom Christianssen & James O. Leafloor
Data: Jana Kotzerka & Hólmgrímur Helgason
Cover photo: Anthony D. Fox
Layout and Graphics: Kári Fannar Lárusson
Funding and Support: CAFF would like to acknowledge the support from the Nordic Council of Miniters Terrestrial Ecosystem Group (TEG)
and the Danish Environmental Protection Agency.

This work is licensed under the Creative Commons Attribution-NonCommercial-ShareAlike 4.0 International License. To view a copy of this
license, visit http://creativecommons.org/licenses/by-nc-sa/4.0/. All photographs are subject to a separate restricted copyright and may not
be reproduced without explicit consent, which should be sought directly from the copyright holder.

Note: The views expressed in this peer reviewed report are the responsibility of the authors of the report and do not necessarily reflect the
views of the Arctic Council, its members or its observers, contributing institutions or funding institutions..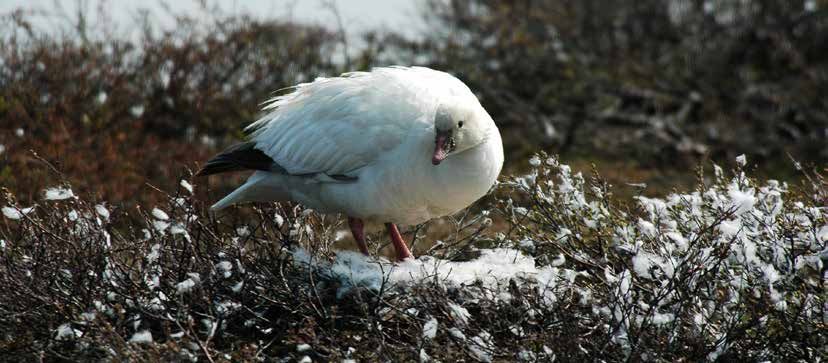
Table of Contents
Key Findings ...................................................................................................................................... 4
1. Overview ...................................................................................................................................... 5
2. Introduction.................................................................................................................................... 5
  2.1 So why this review about geese?.................................................................................................................................................................. 6
  2.2 Some working definitions................................................................................................................................................................................ 7
3. Methods                     ...................................................................................................................................... 8
  3.1 Geographical scope............................................................................................................................................................................................ 8
  3.2 Taxonomic treatment......................................................................................................................................................................................... 8
  3.3 Definition of populations................................................................................................................................................................................. 8
  3.4 Population estimates......................................................................................................................................................................................... 9
  3.5 Population trend estimates............................................................................................................................................................................. 9
  3.6 Assessment of changes in breeding success and survival.................................................................................................................10
4. Analysis                    ....................................................................................................................................11
  4.1 Why gather such information anyway? ....................................................................................................................................................11
  4.2 Tables of results..................................................................................................................................................................................................12
  4.3 Population size estimation............................................................................................................................................................................12
  4.4 Nature of the population estimates...........................................................................................................................................................18
  4.5 Data quality.........................................................................................................................................................................................................19
    4.5.1 Estimates of population size- methods..............................................................................................................................................19
   4.5.2 Reliability of the estimates of population size..................................................................................................................................20
  4.6 Timing of the counts used to estimate population size......................................................................................................................21
  4.7 Summary of short- and long term trends.................................................................................................................................................21
  4.8 Reliability of the estimates of short (10 year) and longer term (>10 years) trends in population size..............................22
  4.9 Availability of data on reproductive success and survival..................................................................................................................23
  4.10 Number and size of goose populations in the northern hemisphere.........................................................................................24
   4.10.1 Grey geese...................................................................................................................................................................................................24
   4.10.2 White geese................................................................................................................................................................................................24
   4.10.3 Black geese.................................................................................................................................................................................................24
5. Conclusions...................................................................................................................................25
6. Acknowledgements.....................................................................................................................27
7. Reference list.................................................................................................................................28
8. Complete list of authors and their affilations.............................................................................29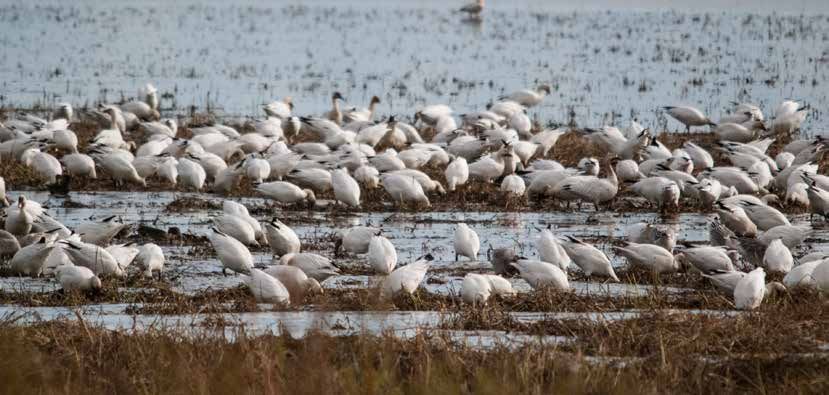
4

Key Findings
►► This audit suggests that there are between 39.0 and              ►► In Central and Eastern Asia, where the greatest declines
   39.2 million wild geese in the northern hemisphere                  are suspected, good population estimates and count
   belonging to 68 populations of 15 species.                          data series over sufficient long time horizons to offer
►► All but one of the populations number between 1000                  a robust basis for generating trends are generally
   and 10 million individuals. Only the Western Palearctic             lacking, with the notable exception of excellent count
   population of the Lesser White-fronted Goose lies on the            data from Korea and Japan. However, the situation is
   brink of extinction with just over 100 individuals, and             rapidly improving in China, where count networks and
   only the midcontinent population of lesser snow geese               coordination with flyway partners are being established.
   in North America exceeds 10 million adults.                      ►► Many populations with the poorest population
►► “White” geese (Chen) are most numerous (17.2 million                information are those which we suspect are showing the
   individuals of 3 species) and all 6 populations have                greatest declines.
   increased in the last 10 years.                                  ►► The most urgent priorities for the future are to (i)
►► “Black” geese (Branta) number c.13.7 million individuals            improve our knowledge of population distributions
   of 27 populations from 5 species, of which 19                       to better inform our definitions of discrete flyway
   populations show stable or increasing trends over the               populations; (ii) implement effective mechanisms to at
   last 10 years.                                                      least periodically measure abundance for all northern
►► “Grey” geese (Anser) comprise 35 populations of 8.1-8.4             hemisphere goose populations to assess trends over
   million individuals, of which 15 have declined in the last          time; (iii) initiate research to identify factors responsible
   10 years, especially in East Asia.                                  for declining trends in populations of concern, and (iv)
►► Most estimates derive from total counts of all                      evaluate potential negative effects of overabundant
   individuals, 8 populations combine some form of                     goose populations on habitat and sympatric species.
   capture-mark-recapture approach (almost exclusively              ►► To interpret changes in population size, there is an
   in North America) but 15 populations are based upon                 increasing need to understand whether these are due
   expert opinion, mostly in East and Central Asia. Less               to shifts in range, changes in reproductive success or
   than half of the estimates for all populations were                 changes in annual survival.
   thought to fall within 10% of the true totals.                   ►► For this reason we urge wider gathering of age ratio
►► Most populations showed increasing or stable trends                 data, and marking programmes to provide annual
   over the last 10 years, but our ability to truly judge these        assessments of reproductive success and survival,
   trends is highly variable among populations.                        particularly amongst populations showing declines.
►► In North America, population estimates are good; trends          ►► There is a very clear need to establish or expand annual
   are generally of the best quality and most populations              reporting on population size and demographic trends
   are increasing or stable.                                           to make such information accessible to decision makers
►► Most European populations are increasing or stable, yet             and stakeholders in a timely fashion.
   several populations lack effective count coordination
   networks to generate annual assessments of total
   population size and trends.

            Photo here - Landscape
                 orientation

                                                                  Photo Alan D.Canada
                                                                                Wilson, www.naturespicsonline.com
                                                                                      Geese. Photo Leslie Scopes Anderson
5

1. Overview
This report attempts to review the abundance, status                 The Arctic Biodiversity Assessment (ABA) (CAFF 2013) found
and distribution of natural wild goose populations in the            that many Arctic migratory species were threatened by
northern hemisphere. The report comprises three parts                overharvest and habitat alteration outside the Arctic (ABA
that 1) summarise key findings from the study and the                key finding 3), and noted that current knowledge of many
methodology and analysis applied; 2) contain the individual          Arctic species, ecosystems and their stressors is fragmentary,
accounts for each of the 68 populations included in this             making detection and assessment of trends and their
report; and 3) provide the datasets compiled for this study          implications difficult for many aspects of Arctic biodiversity
which will be made accessible on the Arctic Biodiversity Data        (ABA Key finding 8). This study is a direct response to the
Service.                                                             ABA implementation of recommendation 8 as reflected
                                                                     in Action 10.1 of “Actions for Arctic Biodiversity 2013-
                                                                     2021: Implementing the recommendations of the Arctic
                                                                     Biodiversity Assessment” (CAFF 2015).
2. Introduction
Recognising the global importance of Arctic biodiversity and         Arctic Biodiversity Data Service), capacity building, reporting,
that much of macro-environmental change happening on                 coordination and integration of Arctic monitoring, as well
this planet is occurring faster in the Arctic than elsewhere,        as communications, education and outreach. Experts are
there is a clear need for monitoring and assessment of               currently developing and implementing coordinated and
change in this region. Recommendation 13 in the Arctic               integrated Arctic Biodiversity Monitoring Plans to help guide
Biodiversity Assessment (CAFF 2013) states the need to:              circumpolar monitoring efforts. Results will be channelled
“Increase and focus inventory, long-term monitoring and              into effective conservation, mitigation and adaptation
research efforts to address key gaps in scientific knowledge         policies supporting the Arctic. These plans represent the
identified in this assessment to better facilitate the development   Arctic's major marine, freshwater, terrestrial and coastal
and implementation of conservation and management                    ecosystems. Although the Coastal Plan is currently under
strategies”. Areas of particular concern identified through          development, the other Plans have been established and are
the ABA include components that are critical to ecosystem            being implemented. These umbrella Plans work with existing
functions. The current limited capacity to monitor                   monitoring capacity to facilitate improved and cost-effective
and understand these changes was identified in the                   monitoring through enhanced integration and coordination.
Arctic Climate Impact Assessment (ACIA 2004) which
recommended an expansion and enhancement of Arctic                   The Terrestrial Expert Monitoring Group (TEMG) was
biodiversity monitoring. As a result, the Arctic Council             established under CBMP to develop an integrated terrestrial
directed the Conservation of Arctic Flora and Fauna (CAFF)           biodiversity monitoring plan to guide coordination between
to develop a programme to address these needs which has              existing biodiversity monitoring programmes and networks.
taken the form of the Circumpolar Biodiversity Monitoring            The aim of the plan was to more effectively synthesise results
Programme (CBMP).                                                    and more efficiently deliver monitoring results and their
                                                                     implications to decision makers, stakeholders and the general
To establish conservation, mitigation and adaptation                 public. The challenges posed to biodiversity monitoring
policies to promote the sustainability of living resources in        in the Arctic are enormous. Arctic ecosystems are already
the Arctic, it is essential that knowledge of the status and         showing dramatic responses to existing change, especially
trends in Arctic biodiversity is available at the circumpolar        as climate change progresses faster than predicted and more
level, together with an understanding of the natural and             southern species show rapid encroachment on northern
anthropogenic drivers that are shaping these trends. Armed           areas (see Key Finding 2 in CAFF 2013: “Climate change is by
with such knowledge, local communities and policy makers             far the most serious threat to Arctic biodiversity and exacerbates
can implement evidence based policy to sustain and                   all other threats”). The pace of human development,
protect biodiversity for themselves and future generations.          particularly oil, gas and mineral exploitation has increased,
These requirements underpin the structure, objectives and            as have agricultural, industrial and urbanisation pressures
activities of the CBMP.                                              and hydroelectric projects which bring problems associated
                                                                     with disturbance, pollution, habitat loss and fragmentation.
The CBMP is already collecting information from existing             The remoteness and enormity of the areas involved create
monitoring efforts in place across the Arctic to provide more        major logistic challenges to monitoring these processes and
robust and timely information on what is happening in the            the hitherto fragmented baseline monitoring all add to the
Arctic environment. Harmonizing and integrating efforts              difficulties of delivering a meaningful package of monitoring
to monitor the Arctic's living resources will allow decision         protocols that can deliver results quickly and effectively
makers to develop responses to challenges facing the Arctic          against all of the objectives set for the task.
environment in a more efficient and effective manner. The
CBMP coordinates marine, freshwater, terrestrial and coastal         CAFF’s CBMP recognises that the limited functional
monitoring activities while establishing international linkages      redundancy in relatively simple Arctic food webs poses
to global biodiversity initiatives including the UN Convention       particular risks in the region from loss of even individual
on Biological Diversity (CBD) and the Group on Earth                 species, which can potentially have cascading effects on
Observations Biodiversity Observation Network (GEOBON).              ecosystem state and function. It also recognises the need
The CBMP emphasizes data management (through the                     for the integration of single species monitoring (especially
6
functionally important species) with an ecosystem approach       their feeding on grass, grain and root crops reduces yields
to better understand ecosystem function, which includes          (Fox and Abraham 2017, Fox et al. 2017a). However, when
an assessment of the performances of functional species          large numbers concentrate in the vicinity of airports, geese
contributing significantly to those systems and their            can create a threat to air safety, since air strikes cost large
responses to change.                                             amounts of money and constitute a major risk to human life
                                                                 (e.g. York et al. 2000; Bradbeer et al. 2017). Furthermore, in
2.1       So why this review about geese?                        urban areas, resident geese can cause a nuisance by fouling
An added complication for the CBMP is that the population        amenity grasslands and territorial males can cause havoc by
status and trends of many long-distance migratory bird           attacking people (Lowney et al. 1997). Finally and perhaps
species breeding in the Arctic are affected by other pressures   most relevant in the present context, by the nature of their
and stressors throughout their annual cycle, many of which       recent abundance, geese have been proven to cause trophic
may be applied outside the geographic confines of the Arctic.    cascades in delicate Arctic ecosystems caused by the effects
Geese, for instance, are keystone herbivores that greatly        of their foraging (e.g. Ankney 1996, Jefferies and Rockwell
impact upon the nature of Arctic plant communities by virtue     2002). For this reason, geese have become ecosystem
of their disturbance, grazing and manuring, especially where     engineers in a fashion not always conducive to maintaining
they breed in dense colonies, as well as providing prey for      Arctic biodiversity given the destructive nature of their
predators, including many local human communities across         localised impacts which have knock-on effects for the flora
the Arctic.                                                      and fauna of sites affected (e.g. Milakovic and Jefferies 2003;
                                                                 Rockwell et al. 2003; Abraham et al. 2005, 2012; Johnston et
Actions relating to geese are already enshrined in the           al. 2015; Buij et al. 2017).
Arctic Migratory Bird Initiative (Johnston et al. 2015) which
recognises the need for coordination of Lesser White-fronted     We are also fortunate that because of their shared nature,
Goose Anser erythropus conservation and for research on          some Arctic nesting goose populations have been subject
the impacts of white goose habitat alteration on shorebird       to monitoring for some time. The pioneering Migratory
populations. Almost all goose species, however, winter           Bird Convention/Treaty of 1916 laid down the basis for
outside of the Arctic region, where they provide similar         regulation of hunting of game birds including geese in
ecosystem services in sub-arctic and temperate ecosystems        Canada and the United States, and Mexico, Japan and the
and where they are often important quarry species for            Russian Federation have since been engaged to secure
human communities during the non-breeding season (Buij et        coordinated management of goose populations throughout
al. 2017).                                                       their ranges. Regulation requires monitoring to demonstrate
                                                                 its effectiveness, and the philosophy of the recent North
Unlike so many avian species that have suffered over-            American Waterfowl Management Plan (US Fish and Wildlife
exploitation, habitat loss and degradation, many (but            Service 2015), which aims to combine hunting and other
certainly not all) goose populations have shown more             regulation with coordinated habitat restoration and human
favourable conservation status than many other taxa over         dimensions research, necessitates detailed knowledge of
the last 50 years (for Europe see Fox et al. 2010, for North     goose population status and trends to gauge effectiveness of
America see US Fish and Wildlife Service 2015, Canadian          management, regulatory and conservation actions. Similarly
Wildlife Service 2015). Indeed, some goose populations           in Europe, concerns about catastrophic declines in waterbird
have increased in abundance to a point where they are now        abundance (Berry 1939), led in the 1950s to the development
considered to constitute a “problem” for diverse human           of continent-wide assessments of the status and trends in
interests (Fox and Madsen 2017). Foremost amongst such           abundance of ducks, geese and swans there (Boyd 1963,
conflict is where geese feed upon agricultural land, where       Atkinson-Willes 1969, Fox et al. 2010, Fox and Madsen 2017).

            Photo here - Landscape
                 orientation-

                                                                                         Snow Geese. Photo Chantal Lepire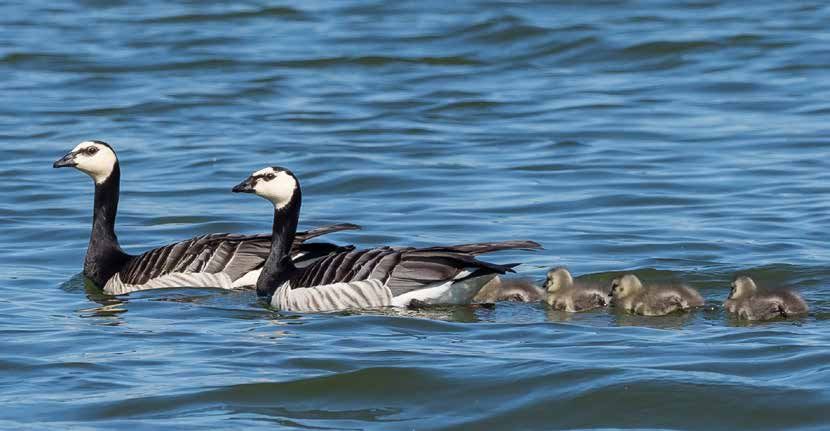
7
 One of the core aims of the CBMP is to ensure that Arctic          Inevitably, levels of demographic assessment are far less
ecosystem monitoring is coordinated and that the initiative is      widely available, because assessing annual breeding success
truly circumpolar, and while goose monitoring has continued         requires specialist knowledge and the ability to sample age
apace in recent years, it is evident that the effort has not been   ratios in populations where first year individuals can be
coordinated and that, seen in a circumpolar perspective, in         distinguished in the field in sufficient numbers to provide
some areas, the monitoring is deficient compared to other           such assessments. Likewise, gathering information on
biogeographical regions. For this reason, it was felt that a        adult and sub-adult annual survival over long time periods
major review of the status of the goose populations breeding        necessitates investment in expensive and ornate capture-
in the Arctic was long overdue and that a major effort              mark-recapture programmes which are not usually the norm,
should be invested in gathering available information on all        but can be highly instructive where such long term data exist.
circumpolar goose populations. The major objective of this          Reviewing the existence and utility of such approaches is also
initiative was to establish a current assessment of the size        extremely important in undertaking an audit of the existing
of each discrete “flyway” population (whether biologically          data, establishing the degree to which such data are available
defined or established for the expedience of effective              for all the populations and in helping to establish best
management). The secondary objective, wherever possible,            practice where such schemes are being implemented.
was to determine a rate of change in overall abundance in
recent years, preferably over a short (10 year) time span and       2.2        Some working definitions
an assessment of change in abundance over the longest span          There has been, and there will continue to be, considerable
of years available to set the time series in perspective.           debate about what constitutes discrete goose populations
                                                                    around the northern hemisphere. For some species and
These estimates in themselves are complex and achieved              specific populations, we confess that our knowledge is
in different ways. For some species and populations, it is          very rudimentary (even in Europe and continental North
possible to determine the absolute numbers of individuals           America) and we are certain the suggestions for defining
in a population by coordinated counts at all known sites,           populations we have put forward here will change and
whilst for others, an estimate is only possible by counts at        will need to be better refined in the future. Our starting
many sites and extrapolation to an informed estimate. A             point has been the structure established by the Waterbird
few less well documented or poorly counted populations              Population Estimates online database, managed by Wetlands
have had to be estimated based on nothing more than the             International (2015), but in cases where we have found that
best assessment or estimate of an expert. For yet others,           the biogeographical definitions of some populations are
where sufficient capture-mark-recapture or band recovery            perhaps less than optimal, we have tried to come up with
data have been available, it has been possible to generate so       constructive alternatives. Obvious cases include the Central
called Lincoln estimates (Lincoln 1930) of total population         Flyway and Western Canada Geese (see sections N9 and N10)
size, where the absolute abundance is not possible to assess        that mainly breed in prairie/parkland ecoregions of western
using traditional count and survey techniques (Alisauskas et        Canada and the United States and were formerly managed
al. 2009). There is also variation in at what stage within the      as five separate wintering units. Nonetheless, we are the
annual cycle an assessment of total population abundance is         first to concede that this type of process is a work in progress
undertaken: some occur in spring after the rigours of winter        and the situation will continue to evolve as long as more
(and therefore after the majority of hunting and natural            information is forthcoming.
mortality has occurred) but others, driven by expedience,
may be undertaken in autumn or mid-winter. For a very few           For each of these defined flyway populations, we have
populations, we rely upon breeding estimates to generate            invited expert authors to contribute a block of standard
population abundance estimates. However, this exercise in           text, detailing breeding areas, wintering areas, an
itself is important in context because by default it provides       estimate of population size and trend, as well as trends in
a gap analysis of the entire range of northern hemisphere           reproductive success and survival. The extent of available
goose species and flyway populations to establish for               and accessible knowledge varies enormously, but whilst
which of these we have good data and for which we need              we urged contributing authors to keep their accounts as
to radically improve coverage (and in what way) to better           short as possible, in the case of some of the less well-known
contribute to circumpolar coverage.                                 populations, much novel and unpublished material was
                                                                    collated and synthesised for the first time, with the result that
A third objective was to attempt to assess the demographic          the style and length of the accounts varies enormously with
drivers behind population changes where these are known.            the nature and knowledge of each population. Nevertheless,
In populations where it is known that hunting mortality has a       we hope you the reader will forgive what appears to be very
major effect on survival, assessing annual survival in relation     uneven coverage of different populations.
to known levels of hunting exploitation provides potential
for manipulation of survival rates to incorporate into effective    We have also been highly uneven in our treatment of
management plans (e.g., through an adaptive management              established, released and feral populations. In North
framework, Madsen and Williams 2012). Likewise,                     America, temperate-nesting Canada Geese are of major
management actions to restore improved conservation status          interest and importance for hunting and so we have
to populations suffering declines because of reductions in          included these in our accounts. However, we have chosen
breeding success are more likely to be effective when these         not to feature the status and trends associated with feral
are implemented on nesting areas where limiting factors             populations of most Greylag, Canada and other geese
operate to restrict breeding success. Hence, knowledge of           escaped or introduced in parts of mainland Europe,
demographic factors affecting population changes can be             because of the lack of good monitoring data. We have
of immediate value for implementing conservation actions.           made an exception of the Greylag Geese in Britain, where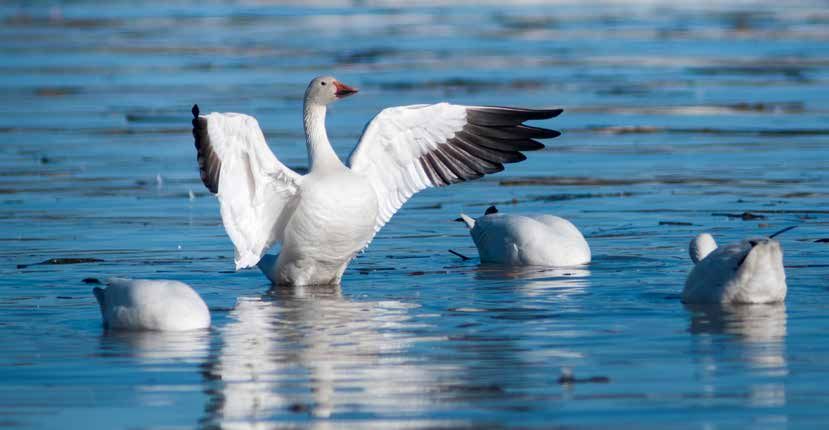
8
a management policy decision has recently been made                 possible to address this need in the immediate future.
to amalgamate native and introduced Greylag Geese                   Although this audit has been carried out under the Arctic
within the United Kingdom (see Mitchell et al. 2012). As            Council banner with CAFF and the CBMP, it was decided to
a result, in this case, monitoring programmes are in place          include all northern hemisphere goose species (with the
to effectively monitor these geese within the UK, whereas           exception of the near-tropical Nene or Hawaiian Goose
this is not the case for other species and other parts of           Branta sandwichensis about which there is a rich existing
Europe. This is not to imply that such information is               literature). We feel this was a logical decision given the
not vital with respect to tracking the growing problems             fact that in North America, some Canada Goose Branta
associated with such introduced native and especially alien         canadensis and Cackling Goose B. hutchinsii populations
species, including geese. However, given the problems               straddle both Arctic and sub-Arctic regions and the same
associated with gathering data on these poorly covered              is true of species like the Bean Goose Anser fabalis and the
and less well understood populations, it was decided that           Greylag Goose A. anser in Eurasia. Omitting the very few
it was too difficult to assess their status and trends in any       remaining non-Arctic species of the tribe Anserini, such
meaningful way at the present time. We likewise have not            as the Swan Goose A. cygnoides and Bar-headed Goose A.
included treatments of Aleutian Islands nesting Cackling            indicus, seemed not to make sense in such an exhaustive
Geese reintroduced from Japan and Lesser Snow Geese                 review (especially as they winter sympatrically with many
reintroduced to Arctic Russia. We recognise the importance          Arctic goose species) and are therefore included here for
of monitoring the progress of development of such goose             completeness.
populations in the future and urge all range states to initiate
and develop monitoring mechanisms so that it might be

3. Methods

3.1      Geographical scope                                         little current genetic or ecological justification as a separate
This report includes all Northern Hemisphere goose                  taxon (Heinicke 2010, Ruokonen and Aarvak 2011).
populations, with the exception of the non-migratory near-
tropical Hawaiian Goose that has an existing rich literature        3.3        Definition of populations
(e.g. Kear and Berger 1980, Black et al. 1997, Banko et al. 1999,   Our true knowledge and understanding of what functions
US Department of the Interior 2004). This has the primary           as genuine biological populations amongst goose species
aim of reporting on the status and trends of all species            remains extremely rudimentary. Our goal here has been to
populations that spend some time in the Arctic (as defined          define populations that constitute a discrete entity using
by CAFF) during their annual cycle, but has resulted in the         a “flyway” or corridor of breeding, moulting, staging and
inclusion of a very few species for whom the Arctic does not        wintering areas which define the range for a given set of
form part of their natural range. The latter category includes      individuals that use these sites and routes annually (after
species such as the Swan Goose and the Bar-headed Goose as          Atkinson-Willes et al. 1982). Since our aim has been to
well as some southern forms of Taiga Bean Goose and Greylag         provide an assessment of change in abundance over short
Geese which nest and winter south of Arctic Regions in              periods of the immediate past (specifically over the last ten
Eurasia and Canada Geese that do the same in North America.         years and for longer periods where available), to some extent
                                                                    this constrains us to what has previously been considered
3.2        Taxonomic treatment                                      discrete “populations” from a pragmatic viewpoint. These
A full list of the species and their component populations is       definitions in many cases are based upon knowledge from
given in Table 1 of the Analysis section of this report and in      extensive marking programmes that over many years
Tables 1, 2 and 3 below. The taxonomic basis for the species        have established relationships between discrete breeding,
classification used throughout follows the Handbook of              moulting, staging and wintering areas. For many of the
the Birds of the World (del Hoyo et al. 1992) except for the        populations described here, there are maps plotting band
North American forms where we adopt the latest version of           recoveries on a continental scale to justify such definitions.
the American Ornithologists’ Union Checklist which splits           For many populations, there exists a good working definition
the Canada Goose Branta canadensis into small-bodied                in the Waterbird Population Estimates online database,
forms previously treated as subspecies of B. canadensis and         managed by Wetlands International (2015). For some
recognized now as B. hutchinsii and the larger bodied forms         populations, our knowledge is very much still evolving as in
which remain as B. canadensis (Banks et al. 2004). This means       the case of the Western Taiga Bean Goose Anser fabalis fabalis,
that we have retained the large-bodied forms within the             which despite its relatively small numerical size has a complex
category Canada Goose B. canadensis, which here we include          set of relationships between extensive dispersed breeding
as the subspecies canadensis, interior, fulva, occidentalis,        areas and a reasonably limited wintering range. In this case,
parvipes, maxima, and moffitti, differentiated from those of        the radically contrasting population trends between different
the Cackling Goose Branta hutchinsii which we here take             elements of the breeding population have underlined the
to include subspecies B. h. hutchinsii, leucopareia, taverneri      need to establish a better understanding and a series of
and minima as formerly recognized by Delacour (1954)                telemetry studies is beginning to shed light on the flyway
within “Canada Geese”. We also retain the genus Chen for            population structure of this subspecies as we write. We are
the Emperor Goose and the white geese of North America.             the first to concede that our biogeographical definitions
Information on subspecies of other species largely follows          of some populations fall very far short of what we need to
del Hoyo et al. (1992), although we have chosen to drop the         know. However, we have tried to do our best to create a
existence of Anser fabalis johanseni for which there seems          constructive framework, usually by trying to aggregate the
9
limited knowledge we may have, as for example in the case          intervals on estimates. Such approaches invariably produce
of some of the Greylag Goose populations across Eurasia,           estimates in excess of estimates based on head counts. Some
where there is little information from banding data to relate      populations (both based on total counts or other methods)
breeding areas to winter quarters. In the particular case          have been reported as representative means derived from
of the Greylag, we have tried to aggregate geese counted           a defined period of several years, rather than a specific
on discrete areas of the wintering grounds that constitute         number in a given year. For some populations, we have very
expedient “management units” in the sense that these can           little idea of the true number of individuals and for a very
be monitored as discrete units, and in the fullness of time        few populations, the estimates are not recent. Despite the
managed, in a coordinated fashion even if time shows               different methods for deriving abundance estimates, each is
these groupings not to reflect the biological reality of major     presented with the data trail for its derivation, so the nature
population structure. As stressed in the Introduction, we          of the estimate and the method by which it was obtained
consider this an evolving process. Hence while knowledge           are clear and in the tables in the Analysis section we have
of some of the well-studied flyways will not change, many          also attempted to provide an explanation of the type of the
others will become far better understood and our ability           estimate presented and an associated quality score so it is
to monitor these more effectively will improve with time.          possible to assess the nature and reliability of each estimate.
We hope that by establishing such a framework, this report
offers a foundation for the continuing improvement of our          3.5       Population trend estimates
understanding as more information flows in.                        Wherever possible, we have sought to provide some
                                                                   assessment of the direction of rate of change and its
3.4      Population estimates                                      magnitude. For a few species, this is difficult, but for many
The estimates presented here are provisional and time              populations we have good data to construct trends in
stamped based on the accumulated wisdom of the authors             abundance over more than 20 years. Nevertheless, robust
concerned and the hard data which they present in each of          trends require systematic collection of good quality data, and
the population accounts. Most coincide with the current            inevitably some populations lack long term or systematic
Wetlands International (2015) Waterbird Population Estimates       gathering of data to enable such analysis. As was the case for
online database, some represent our improved knowledge             judging absolute contemporary population size, the quality
as a result of the analyses presented in this report. As will be   of data varies considerably between populations, some have
evident from tables in the Analysis sections, these estimates      long time series upon which to base the assessment of their
are not necessarily directly comparable across species. Most       rate of change, others have only been monitored in sufficient
are derived from mid-winter counts, but coordinated count          detail in part of their total range or only a short time span.
inventories of some populations by necessity are done at           For others, our knowledge is so poor that we can only
other times. Since survival during migration and through           suggest that numbers are far greater or less than at the time
the hunting season may have substantial effects on total           other observers were clearly able to show they were relatively
population size, these factors should be born in mind when         more or less common. Hence, for capture-mark-recapture
comparing between populations. Most of the estimates of            and Lincoln estimates we can provide detailed modelled
population size are derived from total counts, which may or        assessments of population change and we can fit regression
may not be a good means of estimating overall abundance.           or general linear models to total count or incomplete count
Others use capture-mark-recapture and Lincoln estimate             data to generate rates of change where possible. These
approaches combining marking, resightings and hunting              approaches are also described in the individual population
effort and recovery data to estimate total population              accounts and are itemised in the summary tabulations.
size which has the advantage of generating confidence

                                                                                   Snow Goose goslings. Photo Katelyn Luff
10
3.6     Assessment of changes in breeding success and            generated from detailed monitoring of nesting success and/
        survival                                                 or ratios of young caught in banding drives as indices of
As a tentative first step towards understanding the changes      annual productivity. For some populations, regular banding
in relative abundance of what we define to be a closed           and hunting recovery data and capture-mark-recapture
population, it is helpful to be able to compile some long        studies of marked geese in non-hunted populations generate
term assessment of relative change in breeding success as        long term series of annual survival data. Such information
a measure of birth rate and mortality as a measure of death      is invaluable in providing supporting information about the
rate removing individuals from a given population. For           demographic processes contributing to overall changes in
some populations we have very good measures of these             population size. Unfortunately, such data exist for relatively
parameters, especially in species where the first winter         few of the populations, but where these runs of data
offspring of the year are readily distinguishable in the field   are available the authors have presented these here as a
from older adult birds. For others, there exist age ratios       contribution to understanding population processes.

                                                                                Nesting Emperor pair. Photo Casey Setash
11
4. Analysis
4.1 Why gather such information anyway? is increasing or declining. In the case of the Greenland
Beyond human curiosity, there are very good reasons for White-fronted Goose Anser albifrons flavirostris, it is the case
assessing the size of goose populations, but also for wishing that stable survival over 30 years has failed to balance a
to understand more about their relative rates of change over more recent reduction in overall annual production in this
time and the processes that drive these changes. As we have particular population in the last 15-20 years. As a result, after
seen, many goose populations are becoming super-abundant a period of expansion in numbers when net reproductive
as a result of the provision of a surfeit of food, particularly on success exceeded annual survival, the population has shown
the wintering grounds, provided by a landscape created by us a consistent decline in very recent years when this situation
as a result of modern forms of agriculture. In contrast, yet other was reversed. Such insight not only enables the identification
forms (such as those goose populations that still overwinter of the potential causes of the declines, but may also provide
on wetlands, which are suffering habitat loss and degradation, a basis for direct management interventions, as in the case
as in China, Yu et al. 2017) are suffering from declines in of restricting hunting in a population where it is evident that
number that require conservation actions to maintain and mortality exceeds annual reproductive success. Equally such
enhance their abundance. For these reasons, there are good knowledge and understanding can provide insight to increase
grounds for attempting to at least generate actual estimates the harvest on a population where reproductive success and
of the abundance of total flyway populations of geese. survival conspire to provide undesirable levels of year on year
Where this is not possible, we may need to rely upon expert increase in population size.
opinion, or perhaps best of all possibilities, by generating
Lincoln-Peterson estimates of population size: these are based With the increasing awareness of the need for adaptive
on capture-mark-recapture designs that produce robust management of goose populations to restore populations
population estimates with confidence intervals that enable of unfavourable conservation status to former levels of
specific determinations of population trajectories and hence abundance and potentially to maintain rapidly increasing
determine definitively whether populations are significantly populations at levels compatible with their long term survival,
increasing, decreasing or remaining stable. Counting at the the need for such information is becoming ever more urgent.
same sites on a regular basis can also contribute to time series This is nowhere better expressed than in Madsen et al. (2014)
of abundance that can yield growth rates over time with error where the case is made very strongly for the need to derive all
bands around such estimates. the parameters discussed above (specifically robust estimates
of population size and error estimates, annual age specific and
Having established a direction and crude rate of change, year specific survival rates and annual reproductive success, as
management actions require a more basic understanding of well as age at first breeding and annual breeding propensity
the processes driving this change. Throughout this report, as further desirable parameters for modelling population
we have attempted to describe population change for units change).
of geese that we consider in some way discrete, as flyway
populations. We tend to think of these as being largely closed, For this reason, in this section, we review the extent,
in the sense that the changes in their annual abundance are quality and existence of these sources of data across all the
almost exclusively the result of the balance between changes populations reported here to assess the extent of knowledge
in reproductive success (birth rate) and mortality (death rate) and to identify the gaps in our current monitoring efforts.
in a given year. For this reason, knowledge of long term
changes in annual survival and reproductive success can be
fundamental to understanding the reason why a population
Blue Snow Goose. Photo Reg Aupperle12
4.2 Tables of results Unfortunately, such assessments very rarely exist and in Europe
In order to provide a set of overviews for comparison, in Tables at least, the tradition has tended to be that attempts are made
1, 2 and 3, we summarise the available census data for all the to count as many geese within each defined population as
goose populations subject to detailed treatment. In a few possible in mid-January (represented as“Count”in the following
cases we provide data for sections of the wintering areas for tabulations), when most aggregated and therefore easiest to
which we have finer grained detail than at the flyway level. count (see Fox et al. 2010). On the positive side, because such
This is especially the case for goose populations that winter in inventories have been carried out in some cases back to the
Japan and Korea where time series of count data are available 1950s, there can be unusually long runs of historical data upon
for which there are no detailed annual counts from the rest which to make contemporary comparisons of population size
of the wintering range. Otherwise these populations are and distribution. However, even such inventory approaches
treated as the rest of the populations addressed in the text. are fraught with problems, because such counts are inevitably
For each population we have tried to provide a uniform set of often subject to distributional changes related to winter
assessments relating to population size estimation. severity, changes in agricultural cropping and rely heavily
on careful international cooperation and coordination where
4.3 Population size estimation populations are distributed across neighbouring range state
In an ideal world, we would wish to generate population borders. Some populations have traditionally been counted
estimates for each defined goose population from a series at times other than mid-January because for various reasons,
of independent sources to confirm the veracity of each they are easier to count simultaneously at other points in the
assessment. The most optimal means for generating annual cycle and are identified by the month or season in
population estimates would be a carefully designed, random which these take place.
stratified sampling approach that generated error- and bias-
free annual estimates with assessments of their associated For some of these populations, we provide a lower and
uncertainty. These provide the potential not only to generate an upper estimated population size where these best
robust estimates but also provide a statistical basis for equate to the level of our current knowledge, but in fact
making comparisons over time to show significant increases, most populations are given as a single value rather than an
decreases or lack of change over appropriate time periods. estimated band. We provide a year for the assessment or a
For several populations in North America, such estimates are span of years where the authors have considered it better to
derived from data generated from aerial surveys of the nesting provide an average assessment over a period of years. We
areas and are identified in the following tables as derived from have reasonable estimates of all Northern Hemisphere goose
“Survey”. For the Greater Snow Goose, the primary source of population sizes from the last 5-10 years, with the notable
annual abundance data is a complete photographic survey exception of the central Asian wintering population of Taiga
conducted each spring in southern Quebec during staging. Bean Geese and the Caspian Sea/Iraq wintering population
All flocks are photographed, and a subsample is counted and of White-fronted Geese Anser albifrons for which there has
extrapolated to estimate population size. This contributes been no more recent population assessment than in the mid-
what are probably the most reliable estimates of population 1990s. Although we are very open to concede that the quality
size for any goose population in North America, greatly aided of counts supporting the estimates of many populations are
by its narrow geographic distribution at that time of year. poor (see below), we can at least be confident that many of the
assessments presented here are based on the latest available
Other estimates for North American populations are carried data.
out on the basis of capture-mark-recapture techniques (e.g.
elgasi Greater White-fronted Geese) and Lincoln estimates For each population estimate and trend assessment, we have
generated from harvest estimates and band recovery data to provided a six-point quality code based on the following
estimate total population size which are also identified clearly categories from Fox et al. (2010):
in the tables.
Extent of data Data underlying estimate
0. Expert guess None or very little
1. Poor data quality Few actual counts, no representative counts and/or count
covering insignificant sections of the population
2. Partly based on good survey data Well described counts and surveys, allowing extrapolation
with some confidence, at least for >5% of the population
3. Some regions well covered, covering >50% of the total Counts cover 5-50% of estimated total population
estimate
4. Good coverage of >50% of total estimate At least half of the population covered by counts or surveys
5. Full coverage, estimate likely to be within 10% of true total Almost all of the estimated population accounted for from
regular coordinated counts or surveysTable 4.1. Full summary tabulation of the estimated population sizes of all global grey goose Anser populations as reviewed in this report. Columns provide the year of the estimate, the
nature of the data used to generate the estimate and their quality (see the list of codes on page 12 for a full explanation of the quality codes). Also shown are the month from which data
were used to generate population estimates (1 = January, 2 = February or season as appropriate). The current (last 10 years) and longer term (>10 years but time series depending on
population) trends are then provided, with the method used to identify these trends, the direction and scale of annual percentage change (where known) for identified periods of years
with a quality code
Flyway Population Population estimate Population trend
Size Year Nature Quality Month/ Current trend Long term Method Rate Period Quality
season (10 year) trend (% per annum)
(>10 year)
Anser fabalis (Bean Goose)
A1 fabalis, North-east Europe/North-west 52,000 2015 Count 4 1 DEC DEC Total -6.0 2006-2015 4
Europe
A1 fabalis, W Siberia/central Asia 1,000-5,000 2008 Expert 2 Winter DEC DEC Expert 1
A2 rossicus, Siberia/NE & SW Europe 600,000 2013 Count 5 1 INC INC Total +2.6 1990-2013 4
A3 middendorffi, Okhotsk/Kamchatka-Japan 6,000 2007-2011 Count 4 1 DEC DEC Expert 4
A3 middendorffi, Yakutia/E Asia 6,000 2007-2011 Best 0 1 DEC DEC Expert 0
guess
A3 middendorffi, Sayan/E China 6,000 2007-2011 Expert 2 Winter DEC DEC Expert 0
A4 serrirostris, Russia/Japan 2,000 2007-2011 Count 4 1 ?STA ?STA Expert 4
A4 serrirostris, Russia/Korea 60,000 2007-2011 Count 4 1 ?STA ?STA Expert 4
A4 serrirostris, Russia/China 52,000 – 156,000 2007-2011 Expert 2 Winter ?STA ?STA Expert 1
Anser brachyrhynchus (Pink-footed
Goose)
B1 East Greenland & Iceland/UK 540,000 2015 Count 5 11 INC INC Total +3.9 1960-2013 5
Total +2.8 2004-2013 5
B2 Svalbard/North-west Europe 76,000 2014 Count 5 Spring INC INC Total +3.6 1965-2013 5
Total +5.4 2004-2013 5
Anser albifrons (Greater White-fronted
Goose)
C1 albifrons, Russia/North-west Europe 1,000,000 2012 Count 4 1 STA INC Total +7.7 1958-2008 4
Sample +2.5 1988-2012 4
Sample +0.8 2003-2012 4
C1 albifrons, Western Siberia/Central Europe 163,000 2013 Count 4 1 INC INC Sample +7.5 1988-2012 4
Sample +6.5 2003-2012 4
C1 albifrons, Western Siberia/Black Sea & 245,000 2013 Expert 1 1 INC INC Sample +1.4 1988-2012 3
Turkey Sample +9.2 2003-2012 3
C1 albifrons, Northern Siberia/Caspian & Iraq 15,000 1995 Best 0 1 DEC DEC Sample -8.9 1988-2012 3
guess Sample -36.9 2003-2012 3
13Flyway Population Population estimate Population trend
14
Size Year Nature Quality Month/ Current trend Long term Method Rate Period Quality
season (10 year) trend (% per annum)
(>10 year)
C2 flavirostris, Greenland/Ireland & UK 18,800 2016 Count 5 3 DEC STA Total -2.8 1999-2014 5
Total 0 1983-2014 5
C3 elgasi, Alaska/CaliforniaFlyway Population Population estimate Population trend
Size Year Nature Quality Month/ Current trend Long term Method Rate Period Quality
season (10 year) trend (% per annum)
(>10 year)
E8 rubrirostris, Far East Asia 15,000 2014 Expert 0 Winter DEC DEC Expert 0
Anser cygnoides (Swan Goose)
F1 C & E Asia 75,000 2012 Expert 3 Winter DEC DEC Expert 1
Anser indicus (Bar-headed Goose)
G1 C, S & SE Asia 97,000 - 118,000 2016 Expert 1 Winter STA STA Expert 1
Table 4.2. Full summary tabulation of the estimated population sizes of all global white goose Chen populations as reviewed in this report. Columns provide the year of the estimate, the
nature of the data used to generate the estimate and their quality (see the list of codes page 12 for a full explanation of the quality codes). Also shown are the month from which data were
used to generate population estimates (1 = January, 2 = February or season as appropriate). The current (last 10 years) and longer term (>10 years but time series depending on population)
trends are then provided, with the method used to identify these trends, the direction and scale of annual percentage change (where known) for identified periods of years with a quality
code.
Flyway Population Population estimate Population trend
Size Year Nature Quality Month/ Current trend Long term trend Method Rate Period Quality
season (10 year) (>10 year) (% per annum)
Chen canagica (Emperor
Goose)
H1 North America 98,000 2015 Count 5 Spring INC STA Count +0.4 1985-2015 5
Count +1.7 2006-2015
Chen caerulescens (Snow
Goose)
I1 caerulescens, 12,600,000 2006-2015 Lincoln 5 August INC INC Lincoln +6.3 1970-2014 5
Midcontinent adults Lincoln +1.1 2005-2014
I2 caerulescens, Western 1,000,000* 2006-2015 Lincoln 5 August INC INC Lincoln +5.8 1971-2014 5
Arctic adults Lincoln +7.2 2005-2014
I3 caerulescens, Wrangel Is 300,000 2016 Count 5 Spring INC INC Count +2.1 1975-2015 5
Count +6.4 2006-2015
I4 atlanticus 876,000 2016 Count 5 Spring STA INC Count +6.4 1965-2015 5
Count -0.2 2006-2015
Chen rossii (Ross’s
Goose)
J1 North America 2,350,000 2006-2015 Lincoln 5 August INC INC Lincoln +11.7 1975-2014 5
total Lincoln +8.5 2005-2014
*Lincoln estimates from the combined Western Arctic/Wrangel Island population produce estimates of 1,160,000 individuals in 2014, rounded here to 1,000,000 for the Western population, the population trend provided here is also
therefore for both units combined, whereas the Wrangel Island trend is based only on spring census data for their population trend
15You can also read