MAYOR & COUNCIL MEMORANDUM - City of Tucson
←
→
Page content transcription
If your browser does not render page correctly, please read the page content below
MAYOR & COUNCIL MEMORANDUM
May 4, 2021
Subject: City Manager Recommendations relating to the Proposed Page: 1 of 7
Reid Park Zoo Expansion; Report on Community
Conversation following Pause on the Expansion Project
(Ward 6 and City Wide)
Issue – This is the report back to Mayor and Council following the 45-Day pause of the Reid Park
Zoo expansion project, as directed by Mayor and Council at the March 9, 2021 Study Session.
City Manager's Office Recommendation – The City Manager recommends the Mayor and Council
provide direction to:
Cease work on the Reid Park Zoo expansion as currently designed,
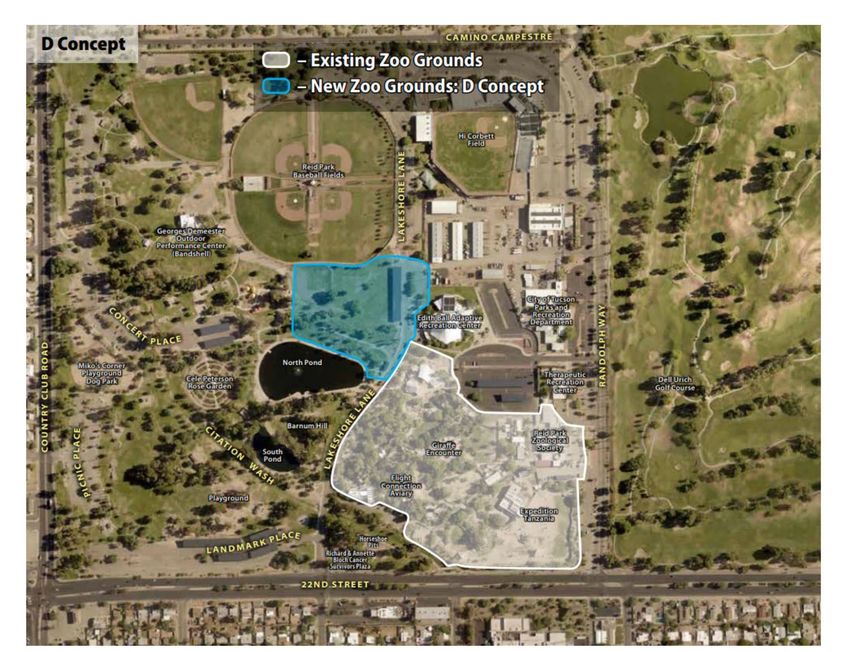
Initiate the redesign of the Reid Park Zoo expansion into the area referred to as
“Concept D” from the Community Conversation, and
Begin work on a new, comprehensive Reid Park Master Plan that includes any
necessary updates to the 2018 Reid Park Zoo Master Plan as a subset to the overall
Reid Park Master Plan.
Background – In November 2017, City of Tucson voters approved Propositions 202 and 203. Both
measures were brought forward to the ballot by initiative petitions. Proposition 202, entitled the
“Reid Park Zoo Quality of Life Authorization Act,” amended the City Charter to authorize a one-
tenth-cent (0.1%) sales tax for a period of 10 years, with the revenues dedicated to providing
additional funding to the Gene C. Reid Park Zoo. Proposition 203, the “Reid Park Zoo Quality of
Life Implementation Act,” revised the City code to implement this dedicated tax and codify the
authorized uses of the tax revenues. Both the Charter amendment and the Code revisions, as
proposed by citizens’ initiative and approved by the voters, specified that the tax revenues could
only be expended to fund capital improvements, operations, and maintenance at the Zoo.
Following the voters’ approval of Propositions 202 and 203, work moved forward to carry out the
voters’ will and implement the purposes of those Acts. The 2014 Reid Park Zoo Master Plan was
updated by the Reid Park Zoological Society (RPZS) in 2018; an agreement was executed
between the City and RPZS for management and operation of the zoo in a manner consistent with
the provisions of Propositions 202 and 203; annual budgets for capital and operations expenditures
were submitted and approved through the City’s publicly noticed budget process; and design and
construction contracts were awarded and executed to carry out the vision of the Master Plan
through phased improvements to the Zoo. The RZPS moved forward to carry out the approved
design of the Zoo expansion, including the Pathway to Asia exhibits that were identified in the
2018 Zoo Master Plan as being located in the areas of Reid Park that include Barnum Hill and the
smaller of two artificial duck ponds (South Duck Pond). As provided in the approved management
agreement with RPZS, the City awarded and executed the related design and construction
agreements.
In late 2020, concerns were raised by members of the public about the Pathway to Asia expansion,
specifically the location of this expansion into the area of Reid Park that contains Barnum Hill and
the South Duck Pond. On January 29, 2021, the City Attorney and City Manager submitted a
MAYOR AND COUNCIL MEMORANDUM Page: 2 of 7
City Manager Recommendations relating to the Proposed Reid Park Zoo
Expansion; Report on Community Conversation following Pause on the Expansion
Project (Ward 6 and City Wide)
Memorandum to Mayor and Council outlining the city’s legal and contractual obligations
regarding the expansion, with a recommendation to continue as originally planned, while
developing a new “natural resources area” within Reid Park in response to the concerns expressed
by members of the community. Due to continued concerns from the public, Mayor and Council
scheduled a Study Session for the March 9, 2021 meeting. Following a discussion of the matter at
that meeting, the Mayor and Council approved a motion that directed the City Manager to suspend
and pause the expansion project for 45 days, as necessary to protect the best interests of the City;
and to organize a mediated, intentional dialogue with stakeholders to discuss potential options.
Present Consideration(s) – The Gene C. Reid Park and Reid Park Community Conversation was
conducted during the 45-Day pause, ending on April 23, 2021. The Community Conversation was
organized by the Center for Community Dialogue & Training, Kaneen Communications, and city
staff and consisted of several elements:
A Community Survey was conducted with over 14,000 responses. Highlights of the survey
are discussed in this section and the full survey report is provided as Attachment A.
A Core Stakeholder Group (CSG) was formed and participated in about 30 hours of
mediated dialogue. Key outcomes of the CSG are discussed in this section and the full
CSG report is provided as Attachment B.
Community Dialogue Circles were held on April 10, 2021 with about 135 participants. The
Dialogue Circles Report is provided as Attachment C.
A comment portal was open throughout the Community Conversation for members of the
public to share their thoughts.
Outreach efforts included:
o Initial Press Release
o English and Spanish websites with the Community Survey available in both
languages, along with an open comment portal and phone line
o Frequent multi-channel social media posts, including through our partners
with Arizona Bilingual and Latinas Arizona
o Frequent email communications with interested parties
o Facebook ads directed at Spanish speakers within 10 miles of Reid Park
o Ads purchased in the Arizona Daily Star and La Estrella, with online
clickable access to the Community Survey
o A postcard mailer to all addresses within 1 mile of Reid Park
o Three rounds of signs installed at the site, including large banners and signs
with maps and information on impacts at each potential expansion location
o Park user intercept surveys conducted in both English and Spanish
o Appearances on Azteca TV
Community Survey
The Gene C. Reid and Reid Park Zoo Expansion survey (Community Survey) was open for 13
days and received more survey responses than any City survey to date. Eight concepts were
presented, which the survey respondents rated on a five-point scale of: Strongly Favor, Somewhat
Favor, Undecided, Somewhat Oppose, or Strongly Oppose. The survey was offered in English and
Spanish and advertised to the community in multiple ways, including: City website, news releases,
NewsNet, survey platform registered users, social media, intercept surveys, postcard, and flyers. A
full report is provided as Attachment A.
MAYOR AND COUNCIL MEMORANDUM Page: 3 of 7
City Manager Recommendations relating to the Proposed Reid Park Zoo
Expansion; Report on Community Conversation following Pause on the Expansion
Project (Ward 6 and City Wide)
The survey generated the following responses:
18765 total engagements (visits to the site)
14014 total responses
Equivalent of 700 hours of public comment (at 3 minutes/response)
75% completion rate
99% Confidence Level
2% Margin of Error
Review of the responses, the demographics, and the community reflect that this was a robust and
statistically valid survey, with few outliers. Respondent demographics were compared to the
demographics of the City of Tucson from summary data provided in the 2018 American
Community Survey (ACS) for Tucson, Arizona conducted by the US Census Bureau.
In her March 3, 2021 message to the community, Mayor Regina Romero focused on engaging the
community to find a solution that is “win-win.” The Mayor’s letter is attached to this
Memorandum as Attachment D.
Figure 1 presents the aggregated Community Survey results for Favorability for each of the eight
concepts (A-H), where Favorability was calculated by subtracting the “Opposed” responses from
the “Favor” responses for each. A Zero result means that the concept was neutral across all survey
responses and larger negative numbers indicate stronger opposition to that concept. Based on the
survey results, Concept D (as further described below) is the top overall response, followed by
Concept C, and then Concept B. Further:
Concept D is the top response in all but three of the analyzed demographics, and
shows up as a top three concept in 12 of the 13 analyzed demographics.
Concept C follows as a top three concept in nine of 13 analyzed demographics.
Concept B follows as a top three concept in seven of 13 analyzed demographics.
For context related to the following Core Stakeholder Group section, note that
Concept G scored significantly lower than Concepts D, C, and B in the survey.
Figure 1 - Community Survey Aggregated Data
MAYOR AND COUNCIL MEMORANDUM Page: 4 of 7
City Manager Recommendations relating to the Proposed Reid Park Zoo
Expansion; Report on Community Conversation following Pause on the Expansion
Project (Ward 6 and City Wide)
Core Stakeholder Group
The Core Stakeholder Group (CSG) was formed from the approved Motion from the March 9,
2021 Mayor and Council Study Session that created the Community Conversation. The CSG
consisted of 18 members representing the following interests:
Ward 6 (1)
Ward 5 (1)
Parks and Recreation Department (1)
Reid Park Zoo Operations (1)
Reid Park Zoological Society (1)
Save the Heart of Reid Park (2)
Adjacent Neighborhoods:
o Alvernon Heights / Roberts (1)
o Arroyo Chico (1)
o Barrio Centro (1)
o Broadmoor-Broadway Village (1)
o Colonia Solana (1)
o El Encanto Estates (1)
o El Montevideo (1)
o Julia Keen (1)
o Peter Howell (1)
o San Clemente (1)
o San Gabriel (1)
The CSG met for over 30 hours between March 27 and April 21, 2021 in a mediated process led
by Christina Medvescek of the Center for Community Dialogue & Training. One key outcome of
the CSG was their consensus agreement on the following question that was used to guide their
deliberations:
“What solutions for Reid Park protect Tucson’s need for free, accessible open
space and enhance a quality zoo for the region, in consideration of:
a) ensuring equitable and inclusive access for park users and city residents
b) mitigating climate change through reducing hardscape, protecting and
nurturing old growth trees and canopy, creating and maintaining
waterscapes, etc.
c) balancing fiscal responsibility/taxpayer impact with community value
d) supporting zoo conservation, education, and entertainment
e) providing for open and transparent input from all stakeholders in future
planning for the park and entities within
f) preserving public trust in leadership and bonding
g) protecting surrounding neighborhoods from negative impacts from the
operation of the zoo?”
After initial data gathering and dialogue, the CSG focused their discussions on Concept D and
Concept G. While they could not reach consensus on a single concept, their deliberations are
shared with Mayor and Council as Attachment B.
MAYOR AND COUNCIL MEMORANDUM                                                   Page: 5 of 7
City Manager Recommendations relating to the Proposed Reid Park Zoo
Expansion; Report on Community Conversation following Pause on the Expansion
Project (Ward 6 and City Wide)

Community Dialogue Circles
On April 10, 2021, a series of dialogue circles were led by Community Dialogue Facilitators from
the Center for Community Dialogue & Training. Using a talking piece, participants spoke one by
one in a safe, civil, and respectful format that encouraged thoughtful exploration of experiences
and values on Gene C. Reid Park and the Reid Park Zoo. Circle participants engaged in
connection and conversation following the Objective, Reflective, Interpretive, Decision (ORID)
method of questions. The process involved a moderate consensus task that was asked of all
participants to come up with a consensus recommendation and a decision that would represent the
best feasible course of action for their group.

About 135 people, including stakeholders and facilitators, conducted a total of 13 dialogue circles.
The primary outcome was a series of “Top Positive Features” that the participants recommended
be considered by Mayor and Council in the final decision. While not all dialogue circles reached a
consensus (7 yes and 6 no), there was significant commonality in the desired features identified by
the various circles. Further, the consensus question developed by the CSG (see above) had much
in common with the dialogue circle outcomes. A report on the dialogue circles is provided as
Attachment C.

Staff Analysis
The CSG was unable to come to a consensus, yet poured significant effort into discussing Concept
D and Concept G. The results of the Community Survey, with over 14,000 responses, found
Concept D to be the top choice, followed by Concepts C and B. Additional factors considered by
staff were the conceptual costs, feasibility, and risks of each concept.

While Concepts B and C carry to lowest cost, they directly impact Barnum Hill and the South
Duck Pond. This presents a significant risk to project success and these concepts did not garner
significant support in the CSG deliberations. While Concept G received a lot of discussion by the
CSG, it scored poorly on the Community Survey, is a higher risk for ultimate feasibility, and costs
an order of magnitude higher than Concepts B, C, and D.

Concept D was deeply considered by the CSG, was the top result of the Community Survey,
carries a moderate cost impact, and has a very high likelihood of success. Not only does Concept
D preserve the Barnum Hill and South Duck Pond area outside of the zoo footprint, it provides
flexibility in how much open green space versus existing hardscape would be occupied by the
final design, creating opportunities to optimize meeting the list of considerations presented in the
CSG consensus question. Figure 2 presents a preliminary outline of where the zoo expansion
would occur under Concept D; the final geography would be determined during the design phase
with continued public input.

MAYOR AND COUNCIL MEMORANDUM                                                     Page: 6 of 7
City Manager Recommendations relating to the Proposed Reid Park Zoo
Expansion; Report on Community Conversation following Pause on the Expansion
Project (Ward 6 and City Wide)

                                  Figure 2 - Zoo Expansion Concept D

Plan Tucson Consideration(s) – This item relates to Chapter Three, Social Environment, PR2 -
Prioritize repairing, maintaining, and upgrading existing recreational facilities; PR5 – Provide
lifelong recreational opportunities for people of all ages and abilities; G1 – Provide the public with
regular communication and sufficient information regarding policy, program, and project planning
and decision-making via multiple methods; G3 – Emphasize interactive participation methods that
solicit input from the public and provide feedback to the public on input received and how it was
used; and G4 – Increase participation of the traditionally underrepresented populations in policy,
program, and project planning and decision-making

Financial Considerations – If the Mayor and Council provide direction to proceed as
recommended – i.e., to proceed with Concept D – the expansion project will need a new design.
The added cost for redesign plus additional construction costs due to materials inflation and site
conditions in the new location is estimated at $3.6M. It is recommended to fund this added cost
with proceeds generated from the Prop 203 Reid Park Zoo Tax. While the new design is
completed, staff would continue to direct the construction contract (i.e., the contract with Lloyd) to
remain suspended pending the new design, followed by negotiation of a new guaranteed
maximum price (GMP) under the construction contract.
MAYOR AND COUNCIL MEMORANDUM                                                     Page: 7 of 7
City Manager Recommendations relating to the Proposed Reid Park Zoo
Expansion; Report on Community Conversation following Pause on the Expansion
Project (Ward 6 and City Wide)

Operating Cost and Maintenance Input – Until a new design is completed and approved, staff
cannot provide comment on whether the redesigned project will impact future operating and
maintenance costs.

Legal Considerations – When the Mayor and Council gave direction on March 9, 2021 to suspend
or pause the expansion project, the City Attorney advised staff to give the appropriate notice under
the relevant contracts to the vendors under contract with the City. Once the Mayor and Council
give direction as to the next steps with this project, the City Attorney will provide direction and
support to the City Manager, the Parks and Recreation Department, and the Business Services
Department to carry out the will of the governing body.

Additionally, if the direction of the Mayor and Council is to proceed with Concept D based on the
results of the Community Conversation as described in this Memorandum, then it is important to
note that this direction would effectively be an amendment to the 2018 Zoo Master Plan as
previously approved by the Mayor and Council as Exhibit B to the Management Agreement with
RPZS under Resolution No. 22949 (approved on October 9, 2018). Pursuant to the Management
Agreement (Sec. 16.c), a new or amended Zoo master plan will not be implemented absent Mayor
and Council approval following a reasonable public outreach and input process. The Community
Conversation as described herein is intended to be that public outreach and input process, as
described in the Sec. 16.c of the Management Agreement. So if the Mayor and Council proceed as
recommended, and give direction to proceed with Concept D, the City Attorney will prepare a new
Resolution for Mayor and Council consideration at the next available Regular Meeting that will
approve an amended Zoo Master Plan that incorporates the approved Concept D. The Resolution
will include legislative findings that the amended plan is the product of the Community
Conversations as described above. Upon approval of that Resolution by the Mayor and Council,
the City Attorney and City Manager will direct the Business Services Department to proceed with
contractual commitments to carry out the direction of the Mayor and Council.

                                                       Respectfully submitted,

                                                       Timothy M. Thomure, P.E.
                                                       Interim Assistant City Manager

TT

Parks & Recreation

Attachment A – Community Survey Report
Attachment B – Core Stakeholder Group Report
Attachment C – Dialogue Circles Report
Attachment D – Message from Mayor Romero dated March 3, 2021
ATTACHMENT A
Gene C. Reid Park & Reid Park Zoo
Community Conversation
Community Survey Favorability Report
Executive Summary
This report summarizes the full survey results across multiple demographic segments based on net
favorability, seeking the most neutral outcome, and compares those demographic segments to the
aggregated data. Neutrality was selected as the focal point to align with Mayor Regina Romero's and
the Tucson City Council's vision of finding a win-win solution.
Net favorability and neutrality explained. In the context of net favorability, discussed here, this report
reflects the top three concepts that are the closest to neutral after subtracting the oppose responses
from the favor responses. This may seem counterintuitive, because we frequently look for the "most
favorable" outcome or the "least opposed" outcome. Here we are looking for both by focusing on the
concepts with relatively equal favor and opposition, and therefore neutral to the community. In Chart A
below, dogs got the most "favor" responses, but it also got the most "oppose" responses. Cats got the
next highest number of "favor" responses, but it also got the least "oppose" responses. Birds got the
least "favor" responses" and a high number of "oppose" responses. If we were looking for the most
favorable responses, the outcome would be Dogs, Cats, Birds. If we were looking for the most
opposed responses, the outcome would be Dogs, Birds, Cats. To find the most neutral concept, the
outcome would be Cats, Dogs, Birds.
Chart A:
Favor Oppose Undecided Net Neutral Score
Dogs 9 11 0 -2
Cats 8 8 4 0
Birds 7 10 3 -3
Based on this focus, the below charts reflect Concept D as the most net-neutral concept, followed by
Concept C, and Concept B.
Concept D is the most net neutral option in all but three of the analyzed demographics, and shows
up as a top three neutral concept in all but one of the 13 analyzed demographics.
Concept C follows as the next most neutral option, showing up as a top three neutral concept in
nine out of 13 analyzed demographics.
Concept B rounds out the most neutral options, showing up as a top three neutral concept in seven
out of 13 analyzed demographics.
During the survey, the community was provided information on different concepts based on input from
the Core Stakeholder Group, the current Zoo Master Plan for expansion, and City of Tucson staff.
Those concepts are summarized below for easy reference. Full descriptions can be found here.
April 23, 2021 1*Note: This report is a summary of the data, the full survey results are available here.
Concept Plans
Concept A No Zoo Expansion (Favorability across all demographics is presented stacked for each analyzed demographic. This
presentation makes comparison across the demographics simple. For example, the dark blue section
represents the 13-24-year-old demographic across each concept. The graph reflects consistency in
outcomes across all demographics with slight variation in the degree of favorability that does not change
the aggregated outcomes. On the top of each chart, you will see the top three net neutral concepts of that
demographic segment.
Favorability for all 100
concepts across all
demographics 0
Concept D, Concept C, -100
Concept B
-200
Data Updated last week
-300
-400
-500
-600
-700
-800
B D F H
-771.9
Demographic in H
Aggregated Favorability Aggregated Favorability
Concept D, Concept C, Concept B
The aggregated favorability reflects all responses
across all demographics. Based off of the number
A
B
of responses compared to the population size,
C these outcomes have a 99% confidence level with
D
E
a 2% error rate. Meaning, if this survey was
F repeated, it is 99% certain that the results would
G
H be the same +/- 2%.
-70 -60 -50 -40 -30 -20 -10 0
The 2% possible variation would minimally affect
-69.2 the individual Concept results, but not the overall
Concept in H
outcome of the survey.
This data reflects the most net neutral concept is
Concept D, followed by Concept C, and the
Concept B.
*Note the 26 point difference between Concept B
and the next net neutral concept, Concept A.
Demographic Segment Favorability
Presenting favorability by demographic segment provides the opportunity to recognize divergence from
the aggregated data and find commonality among the demographic segments. On the top of each chart,
the top three net-neutral concepts for that demographic are identified.
April 23, 2021 3Demographics of Special Interest
Inside City Outside City Radius Around Park
Favorability Favorability Favorability
Concept D, Concept C, Concept B Concept D, Concept C, Concept B Concept A, Concept D, Concept G
A A A
B B B
C C C
D D D
E E E
F F F
-50 -40 -30 -20 -10 0 -60 -40 -20 0 20 40 -50 -40 -30 -20 -10 0
-30.7 -45.7 -20
Concept in F Concept in F Concept in F
Showing top 6 of 8 metrics Showing top 6 of 8 metrics Showing top 6 of 8 metrics
As the initial ballot measure was As this is a regional zoo, survey As the residents directly
voted on by City residents, responses from this adjacent to the Park and Zoo are
survey responses of the same demographic are of special highly affected, survey
demographic are of special interest. responses from this
interest. demographic are of special
Favorability diverged from the interest.
While the favorability of the aggregated data significantly
individual Concepts varies with this demographic. Concepts Favorability diverged from the
slightly, the overall results are B, C, and D resulted in net- aggregated data significantly
very consistent with the positive favorability. However, with this demographic. Concept
aggregated data. Concept D is the most net-neutral concepts A being the most net-neutral
the most net-neutral concept, remain consistent with concept, followed by Concept D,
followed by Concept C, and then aggregated and citywide data, and then Concept G.
Concept B. that being Concept D, followed
by Concept C, and then Concept *Note: this demographic is
B. disproportionate to the
population. This area accounts
*Note: this demographic for 23% of the inside-the-city
represents 12% of the population, but 27% of the
responses, of which less than responses.
2% are out of the state or
country.
April 23, 2021 4Ward Boundaries
Favorability varied significantly across ward boundaries; each
image below reflects the top three net-neutral concepts. Note
that these subsections were determined by ZIP code, and
therefore, there is some overlap between Wards.
Ward 1 Ward 2 Ward 3
Concept D, Concept A, Concept F Concept C, Concept D, Concept B Concept D, Concept C, Concept A
A A A
B B B
C C C
←Previous →Ne
D D D
E E E
F F F
G G G
H H H
-60 -50 -40 -30 -20 -10 0 -80 -60 -40 -20 0 20 -70 -60 -50 -40 -30 -20 -10 0
-58.6 -75.1 -67.1
Concept in H Concept in H Concept in H
Validation Demographics
April 23, 2021 5Hispanic or Latino Favorability 15-24 Year Old Favorability
Concept D, Concept C, Concept B Concept F, Concept G, Concept A
A A
B B
C C
D D
E E
F F
G G
H H
-60 -50 -40 -30 -20 -10 0 -40 -30 -20 -10 0 10
-58.5 -38.5
Concept in H Concept in H
As this demographic was disproportionate to the As this demographic was disproportionate to the
community (underrepresented in the survey community (underrepresented in the survey
responses), the responses were analyzed responses), the responses were analyzed
separately from the aggregated responses to separately from the aggregated responses to
determine if the demographics responses were determine if the demographics responses were
aligned with the aggregate responses or aligned with the aggregate responses or
misrepresented by being aggregated. misrepresented by being aggregated.
While the favorability of the individual Concepts Favorability diverged from the aggregated data
varies, the overall results are consistent with the significantly with this demographic. Concept F is
aggregated data. Concept D is the most net- the most net-neutral concept, followed by Concept
neutral concept, followed by Concept C, and then G, and then Concept A.
Concept B.
Powered by OpenGov
April 23, 2021 6Gene C. Reid Park & Reid
Park Zoo Community
Conversation
Community Survey Demographics Report
Executive Summary
This survey was conducted by random sampling. In random sampling, the number of
responses per demographic is not predetermined, rather each demographic has an
equal opportunity to respond to the survey. Random samples are intended to be an
unbiased representation of the population, but can result in sampling bias if the
number of responses for any one demographic is significantly disproportionate to
the community. For example, if women make up 50% of your population and 80% of
your responses, you have a sampling bias favoring women's responses. The
importance of that bias is dependent on the topic. If responses are likely to vary
significantly based on gender identity, the bias is important. The bias is less
important, and in some cases irrelevant, if the responses aren't likely to vary based
on gender identity. The larger the sample size (number of responses), the more likely
the outcomes are reflective of the entire population (see: Confidence Level and
Margins of Error), despite any sampling bias. For the purposes of this survey,
sampling biases are noted along their potential impact. The data has not been
modified or adjusted in any way to account for any sampling biases.
Survey demographics were compared to the community across multiple segments:
Gender
Age
Race/Ethnicity
Demographics were also collected on education levels, household income,
employment status, and home ownership. These demographics were not compared
to the community, as the 2018 community data is not current enough to add value to
the analysis in these areas.
April 23, 2021 4Saturation is achieved when outcomes don't change despite receiving more
responses. Consistent review of the survey responses reflected saturation was
achieved around day 10 of the survey. At that point, survey demographics were
generally proportionate to the community. Over the final days of the survey, the
responses for the demographic "Radius around Park" became disproportionate to
the community, and the individual results began to change measurably. More
information is included for each demographic below.
Percent of Responses by Demographic Analyzed
This chart reflects the percent of the responses for each demographic.
Aggregated - all of the responses
Inside City - as a percentage of Aggregated
Radius Around Park - as a percentage of Inside City
Outside City - as a percentage of Aggregated
Wards 1-6 - as a percentage of Inside City (note: there is overlap in ZIP codes, so
these won't add up to 100%)
Hispanic or Latino & 15-24-year-olds - as a percentage of Aggregated
Data Updated last week A. Aggregated
B. Inside City
C. Radius Aroun...
D. Outside City
E. Ward 1
F. Ward 2
G. Ward 3
H. Ward 4
I. Ward 5
J. Ward 6
K. Hispanic or ...
L. 15-24 Years Old
0% 10% 20% 30% 40% 50% 60% 70% 80% 90% 100%
6.26%
Demographic in L. 15-24 Years Old
Aggregated
When compared to the community, the aggregated data reflects the demographics
for the respondents were generally proportionate to the community demographics.
Significant variation was identified in certain segments of gender, age, and
race/ethnicity.
Gender - the demographic for gender identity is significantly disproportionate to
the community. In review of responses for female responses compared to male
responses, there is no significant differences in their favorability. This sampling
bias has no impact on the outcomes.
April 23, 2021 5Age - the demographic for age is significantly disproportionate to the community
in the segments of 15-24 years old, 35-44 years old, and 65-74 years old.
Responses from 15-24 years old varied significantly from the aggregated data and
may result in marginalization of the demographic. The outcomes for this
demographic are provided independently of the aggregated data to ensure
representation in the outcomes. Responses from 35-44 and 65-74 did not vary
significantly from the aggregated data. This sampling bias has no impact on the
outcomes.
Race/Ethnicity - the demographic for Race/Ethnicity is disproportionate to the
community in the segments of Hispanic/Latino and Black/African American. The
responses from Hispanic/Latino do not vary significantly from the aggregated
data, implying that this sampling bias has not impact on the outcome. However,
because of the magnitude of the difference in proportion to the community, this
demographics responses are provided independently of the aggregated data to
ensure representation in the outcomes. Responses from the demographic
Black/African American did not vary significantly from the aggregated data. This
sampling bias has no impact on the outcomes.
Aggregated - Gender Identity Aggregated - Age Aggregated - Race/Ethnicity
A. Commu... A. Commu... A. Commu...
B. Aggre... B. Aggre... B. Aggre...
0% 20% 40% 60% 80% 100% 0% 20% 40% 60% 80% 100% 0% 50% 100% 150%
99.89% 99.89% 106.81%
Category in B. Aggregated Category in B. Aggregated Category in B. Aggregated
Inside City
As the initial ballot measure was voted on by City residents, survey responses of the
same demographic are of special interest.This segment was determined by the
response to "ZIP code." This segment shows no divergence from the aggregated
data in relation to demographic make-up.
April 23, 2021 6Inside City - Gender Identity Inside City - Age Inside City - Race/Ethnicity
A. Commu... A. Commu... A. Commu...
C. Insid... C. Insid... C. Insid...
0% 20% 40% 60% 80% 100% 120% 0% 20% 40% 60% 80% 100% 0% 50% 100% 150%
100.01% 99.99% 107.60%
Category in C. Inside City Category in C. Inside City Category in C. Inside City
Radius Around Park
As the residents directly adjacent to the Park and Zoo are highly affected, survey
responses from this demographic are of special interest. This segment was
determined by zip code, only responses from 85711, 85713, or 85716 were included.
This segment shows no divergence from the aggregated data in relation to
demographic make-up.
Radius Around Park - Gender Identity Radius Around Park - Age Radius Around Park - Race/Ethnicity
A. Commu... A. Commu... A. Commu...
D. Radiu... D. Radiu... D. Radiu...
0% 20% 40% 60% 80% 100% 0% 20% 40% 60% 80% 100% 0% 50% 100% 150%
100.00% 99.99% 107.48%
Category in D. Radius Aroun... Category in D. Radius Aroun... Category in D. Radius Aroun...
Outside City
As this is a regional zoo, survey responses from this demographic are of special
interest. This segment was determined by ZIP code. This segment increases the
magnitude of the disproportion for the demographics 35-44 years old and
Hispanic/Latino. Responses from Outside City varied significantly from the
aggregated data. Outside the City is a relatively small proportion of responses (12%)
and, as such, the impact is minimal. However, the outcomes for this demographic are
provided independently of the aggregated data to ensure possible impact is clearly
noted.
April 23, 2021 7Outside City - Gender Identity Outside City - Age Outside City - Race/Ethnicity
A. Commu... A. Commu... A. Commu...
E. Outsi... E. Outsi... E. Outsi...
0% 20% 40% 60% 80% 100% 0% 20% 40% 60% 80% 100% 120% 0% 50% 100% 150%
100.00% 100.01% 105.25%
Category in E. Outside City Category in E. Outside City Category in E. Outside City
Ward 1-6 Boundaries
As the initial ballot measure was voted on by City
residents, breakdown by Ward boundaries is of
special interest. This segment was determined by
the response to "ZIP code." The Ward
demographics are relatively consistent in the
demographics of gender identity and age. They
diverge most significantly around the demographic
of Hispanic/Latino. The outcomes for each Ward are
provided independently of the aggregated data.
Ward 1 - Gender Identity Ward 1 - Age Ward 1 - Race/Ethnicity
A. Community A. Community A. Community
← F. Ward 1 F. Ward 1 F. Ward 1
→
0% 20% 40% 60% 80% 100% 0% 20% 40% 60% 80% 100% 0% 20% 40% 60% 80% 100% 120% 140%
99.99% 100.00% 108.35%
Category in F. Ward 1 Category in F. Ward 1 Category in F. Ward 1
Disproportionate Demographics
April 23, 2021 8Hispanic/Latino & 15-24 Years Old
The demographics of these segments are consistent
to the aggregated data, with the exception of
Hispanic/Latino being overrepresented in 15-24
years old, instead of underrepresented and White
being underrepresented, as both compare to the
community. The outcomes for each segment are
provided independently of the aggregated data.
Hispanic/Latino - Gender Identity Hispanic/Latino - Age 15-24 yo - Gender Identity
A. Community A. Community A. Community
← L. Hispanic ... L. Hispanic ... M. 15-24 Yea...
→
0% 20% 40% 60% 80% 100% 120% 0% 20% 40% 60% 80% 100% 120% 0% 20% 40% 60% 80% 100%
100.32% 100.34% 100.00%
Category in L. Hispanic or ... Category in L. Hispanic or ... Category in M. 15-24 Years Old
Powered by OpenGov
April 23, 2021 9Gene C. Reid Park & Reid
Park Zoo Community
Conversation
Community Engagement Report
Community Survey Results
Executive Summary
The Gene C. Reid and Reid Park Zoo Expansion survey was open for 13 days and
received more survey responses than any City survey to date. The survey was
offered in English and Spanish and advertised to the community in multiple ways,
including: City website, news releases, NewsNet, survey platform registered users,
social media, intercept surveys, postcard, and flyers.
By the numbers:
18765 total engagements
14014 total responses
700 hours of public comment (at 3 minutes/response)
75% completion rate
Review of the responses, the demographics, and the community reflect that this was
a robust and statistically valid survey, with few outliers. Respondent demographics
were compared to the demographics of the City of Tucson from summary data
provided in the 2018 American Community Survey (ACS) for Tucson, Arizona
conducted by the US Census Bureau.
By the numbers:
99% Confidence Level
2% Margin of Error
Confidence Level & Margin of Error Explained. Based on the number of responses as
compared to the population, a confidence level indicates the certainty that the
April 23, 2021 1survey outcome would be the same if the survey were repeated. The error rate
indicates the margin within which the outcome might vary. For example if a survey
outcome was "80% of people prefer dogs over cats," a 99% confidence & 2% margin
of error says that, if repeated, the outcome is 99% certain to be between 78%-82%
(+/-2% of 80%) of people who prefer dogs over cats.
In addition to statistical validity, the demographics of the survey were compared to
the community to determine if the respondents are reflective the Tucson community.
Net Favorability across demographics. In her letter to the community, Mayor
Regina Romero focused on engaging the community to find a solution that is win-
win. With that focus, Concept D is the most neutral option across the majority of
demographics.
Language Access. This survey was offered in English and in Spanish. There were
52 responses to the Spanish survey (152 total engagements; 34% completion rate).
On the English survey, 22 respondents identified their primary language as one
other than English (16 Spanish, 6 other), but opted to complete the survey in English.
All responses have been aggregated for this report.
Note: The United States Census Bureau estimated that, in 2019, 21.1% of the Tucson
population spoke Spanish, of which 68.6% spoke English very well and 31.4% spoke
English less than very well. The data also reflects that, in 2019, 91.3% of households
in Tucson had a computer in their home and 83.5% had a broadband connection.
For the Hispanic/Latino demographic specifically, broadband internet access
increases to 88.4%. Pew Research indicates that, in 2021, 100% of the
Hispanic/Latino demographic in the United States owns a cell phone, and 85% owns
a smart phone. This data suggests that survey accessibility was not a barrier to the
Hispanic/Latino demographic.
Survey Demographics Report
To ensure equity in the process and The survey asked for respondents to
representation of the Tucson indicate their position on eight concepts
community, respondent demographics on a five-point scale of favorability from
were collected across multiple areas. "1 - Strongly Oppose" to "5- Strongly
Demographics were compared to the Favor," with a neutral option of "3 -
City of Tucson population demographics Undecided."
by age, race/ethnicity, and gender
identity. If any demographic was found Results are presented in the form of
to be disproportionate to the community, "net favorability." The net score is
for example females make up 50% of calculated by subtracting the total
the community but 70% of the number of favor responses ("somewhat
responses, that demographic was favor" and "strongly favor") from the
April 23, 2021 t t l b f th 2analyzed for impact and results are total number of the oppose responses
reported based on the analysis.
("somewhat oppose" and "strongly
oppose"). The closer to "zero" a
Age. Demographics were collected
Concept's net score is, the more neutral
across 10 age categories. Age
that Concept is in the community.
demographics were generally
representative of the community, with
Favorability is presented across three
four categories being disproportionate
categories. All responses, subgroups of
to the community, two categories
special interest, and validation groups
overrepresented and two
based on demographics
underrepresented.
disproportionate to the community.
Race/Ethnicity. Demographics were
All responses
collected across eight categories.
Aggregated. All of the responses for
Race/Ethnicity demographics were
the survey.
generally representative of the
community, with three categories being
Special interest
disproportionate to the community, one
Inside City. By ZIP code, only
category overrepresented, and two
responses that are from inside the
underrepresented.
city limits.
Radius Around Park. By ZIP code,
Gender Identity. Demographics were
only responses from 85711, 85713,
collected across eight categories. To
or 85716 were selected.
compare to the community this data
Outside City. By ZIP code, only
was aggregated to three categories.
responses from outside the city limits.
These results were disproportionate to
Ward boundaries. By ZIP code, only
the community, one overrepresented
responses from within the boundaries
and one underrepresented.
of the Ward offices. Because ZIP
codes overlap in Wards, these won't
Click on the link above to dig into the
add up to 100% of the responses.
survey demographics and how they
compare to the City's demographics.
Validation based on disproportionate
demographics
Hispanic or Latino. By demographic
selection, only responses where
"Hispanic or Latino" was selected.
15-24 years old. By demographic
selection, only responses where "15-
19" or "20-24" were selected.
Click on the link above to dig into the
survey results.
Powered by OpenGov
April 23, 2021 3ATTACHMENT B
Core Stakeholder Group (CSG)
Agenda
1. Recap community engagement process and
outcomes
2. Review the CSG’s deliberation process and
consensus outcomes
3. Next steps, and future hopes
ourfamilyservices.org/center | (520) 323‐1708 1Gene C. Reid Park and Reid Park Zoo Expansion Community Conversation
Core Stakeholder Group Meetings
The Core Stakeholder Group (CSG) was formed following direction from the March 9, 2021 Mayor & Council motion. The
categories of the Core Stakeholder Group adhere to the specific language of this motion. There is one member representative
for each stakeholder category, except Save the Heart which has two members. Other ogranizations represented are Ward 5 &
6, the City of Tucson Parks & Recreation Department, Reid Park Zoo Operations and Reid Park Zoological Society and
neighborhoods directly adjacent to the park. The Center for Community Dialogue & Training was selected to provide neutral
facilitation using a consensus-based dialogue process.
Meeting Number Meeting Date Time Attendees Total Hours
CSG Meeting #1 27-Mar-21 1pm-3pm Entire CSG attended 2 hours
CSG Meeting #2 7-Apr-21 6:30pm - 9pm 1 absent 2.5 hours
Dialogue Circles 10-Apr-21 1pm - 4:30pm Entire CSG attended 3.5 hours
CSG Meeting #3 13-Apr-21 6pm - 9pm 1 absent 3.0 hours
Survey Report Meeting 16-Apr-21 9:30am - 11:30am 2 absent 2 hours
CSG Meeting #4 16-Apr-21 4pm - 7pm 1 absent 3 hours
CSG Meeting #5 17-Apr-21 9am - 5pm Entire CSG attended 7 hours
CSG Meeting #6 19-Apr-21 5:30pm - 9:30pm Entire CSG attended 4 hours
Final CSG Meeting 21-Apr-21 5:30pm - 7:30pm 2.0 hours
29 hours
Work in Progress - 4.20.21LEVELS OF CONSENSUS
1. I give an unqualified ‘yes’ to this proposal.
2. I find this proposal perfectly acceptable. It is the best
of the real options we have available to us.
3. I can live with this proposal.
4. I do not like this proposal but I will stand aside and not
block it.
5. I do not agree with this proposal and block it from
moving forward.
ourfamilyservices.org/center | (520) 323‐1708 3Consensus Question
What solutions for Reid Park protect Tucson’s need for free, accessible
open space and enhance a quality zoo for the region, in consideration of:
(a) ensuring equitable and inclusive access for park users and city
residents
(b) mitigating climate change through reducing hardscape, protecting and
nurturing old growth trees and canopy, creating and maintaining
waterscapes, etc.
(c) balancing fiscal responsibility/taxpayer impact with community value
(d) supporting zoo conservation, education, and entertainment
(e) providing for open and transparent input from all stakeholders in
future planning for the park and entities within
(f) preserving public trust in leadership and bonding
(g) protecting surrounding neighborhoods for negative impacts from the
operation of the zoo?
ourfamilyservices.org/center | (520) 323‐1708 4Core Stakeholder Group
Consensus Statement
We worked hard and in good faith. We reached consensus on this question
and used it to guide our deliberations: [Insert Consensus Question here]
We are forwarding a poll taken by CSG on April 17 in which members
indicated their level of support for each concept.
Based on the poll results, we looked at three concepts that had the least
amount of opposition (A, D, G) and focused discussion on D and G
We discussed the pros and cons of D & G, and the level to which they met
the criteria in the consensus question. We forward those deliberations in
hopes they may be of use to Mayor and Council.
We could not reach consensus on a concept that we all agreed met all the
criteria in the consensus question.
ourfamilyservices.org/center | (520) 323‐1708 5Concept C: West Zoo expansion
Concept B: West Zoo (current design) plus a natural
expansion into Reid Park at resources area to the northwest, Concept G: North Zoo expansion
Barnum Hill and the South to be planned with community Concept D: Northwest Zoo Concept E: Southwest Zoo Concept F: East Zoo expansion into the current Zoo parking lot Concept H: Relocate the Zoo out
Concept A: No Zoo expansion Pond (current design) input expansion into Reid Park expansion into Reid Park into Dell Urich Golf Course and Therapeutic Rec Center of Reid Park
3 = I can live with this proposal 5 = I block this proposal from moving forw 5 = I block this proposal from moving forward 1 = I give an unqualified ‘yes’ to this proposal 3 = I can live with this proposal 5= I block this proposal from moving forward 4= I don’t like the proposal but I won’t block it 3 = I can live with this proposal
2 = I find this proposal perfectly acceptable 5 = I block this proposal from moving forw 5 = I block this proposal from moving forward 4 = I don’t like the proposal but I won’t block it 5 = I block this proposal from moving forward 5= I block this proposal from moving forward 1= I give an unqualified ‘yes’ to this proposal 3 = I can live with this proposal
1 = I give an unqualified ‘yes’ to this proposal 5 = I block this proposal from moving forw 5 = I block this proposal from moving forward 5 = I block this proposal from moving forward 5 = I block this proposal from moving forward 4= I don’t like the proposal but I won’t block it 1= I give an unqualified ‘yes’ to this proposal 4 = I don’t like the proposal but I won’t block it
5 = I block this proposal from moving forward 3 = I can live with this proposal 2= I find this proposal perfectly acceptable 3 = I can live with this proposal 5 = I block this proposal from moving forward 5= I block this proposal from moving forward 4= I don’t like the proposal but I won’t block it 5 = I block this proposal from moving forward
1 = I give an unqualified ‘yes’ to this proposal 5 = I block this proposal from moving forw 5 = I block this proposal from moving forward 5 = I block this proposal from moving forward 5 = I block this proposal from moving forward 5= I block this proposal from moving forward 1= I give an unqualified ‘yes’ to this proposal 1 = I give an unqualified ‘yes’ to this proposal
3 = I can live with this proposal 5 = I block this proposal from moving forw 4 = I don’t like the proposal but I won’t block it 4 = I don’t like the proposal but I won’t block it 4 = I don’t like the proposal but I won’t block it 3= I can live with this proposal 3= I can live with this proposal 3 = I can live with this proposal
4 = I don’t like the proposal but I won’t block it 5 = I block this proposal from moving forw 4 = I don’t like the proposal but I won’t block it 2 = I find this proposal perfectly acceptable 5 = I block this proposal from moving forward 5= I block this proposal from moving forward 2= I find this proposal perfectly acceptable 4 = I don’t like the proposal but I won’t block it
3 = I can live with this proposal 4 = I don’t like the proposal but I won’t blo4 = I don’t like the proposal but I won’t block it 2 = I find this proposal perfectly acceptable 4 = I don’t like the proposal but I won’t block it 4= I don’t like the proposal but I won’t block it 2= I find this proposal perfectly acceptable 4 = I don’t like the proposal but I won’t block it
5 = I block this proposal from moving forward 2 = I find this proposal perfectly acceptabl 1 = I give an unqualified ‘yes’ to this proposal 4 = I don’t like the proposal but I won’t block it 4 = I don’t like the proposal but I won’t block it 5= I block this proposal from moving forward 5= I block this proposal from moving forward 5 = I block this proposal from moving forward
4 = I don’t like the proposal but I won’t block it 5 = I block this proposal from moving forw 4 = I don’t like the proposal but I won’t block it 3 = I can live with this proposal 5 = I block this proposal from moving forward 5= I block this proposal from moving forward 3= I can live with this proposal 5 = I block this proposal from moving forward
3 = I can live with this proposal 5 = I block this proposal from moving forw 5 = I block this proposal from moving forward 4 = I don’t like the proposal but I won’t block it 4 = I don’t like the proposal but I won’t block it 5= I block this proposal from moving forward 1= I give an unqualified ‘yes’ to this proposal 4 = I don’t like the proposal but I won’t block it
2 = I find this proposal perfectly acceptable 5 = I block this proposal from moving forw 5 = I block this proposal from moving forward 4 = I don’t like the proposal but I won’t block it 4 = I don’t like the proposal but I won’t block it 4= I don’t like the proposal but I won’t block it 1= I give an unqualified ‘yes’ to this proposal 4 = I don’t like the proposal but I won’t block it
5 = I block this proposal from moving forward 1 = I give an unqualified ‘yes’ to this propo1 = I give an unqualified ‘yes’ to this proposal 4 = I don’t like the proposal but I won’t block it 5 = I block this proposal from moving forward 5= I block this proposal from moving forward 5= I block this proposal from moving forward 5 = I block this proposal from moving forward
5 = I block this proposal from moving forward 1 = I give an unqualified ‘yes’ to this propo1 = I give an unqualified ‘yes’ to this proposal 4 = I don’t like the proposal but I won’t block it 5 = I block this proposal from moving forward 5= I block this proposal from moving forward 5= I block this proposal from moving forward 5 = I block this proposal from moving forward
1 = I give an unqualified ‘yes’ to this proposal 5 = I block this proposal from moving forw 5 = I block this proposal from moving forward 5 = I block this proposal from moving forward 5 = I block this proposal from moving forward 5= I block this proposal from moving forward 4= I don’t like the proposal but I won’t block it 3 = I can live with this proposal
1 = I give an unqualified ‘yes’ to this proposal 5 = I block this proposal from moving forw 5 = I block this proposal from moving forward 5 = I block this proposal from moving forward 4 = I don’t like the proposal but I won’t block it 4= I don’t like the proposal but I won’t block it 3= I can live with this proposal 2 = I find this proposal perfectly acceptable
3 = I can live with this proposal 5 = I block this proposal from moving forw 5 = I block this proposal from moving forward 1 = I give an unqualified ‘yes’ to this proposal 3 = I can live with this proposal 2= I find this proposal perfectly acceptable 4= I don’t like the proposal but I won’t block it 5 = I block this proposal from moving forward
Totals Totals Totals Totals Totals Totals Totals Totals
1=4 1=2 1=3 1=2 1=0 1=0 1=5 1=1
2=2 2=1 2=1 2=2 2=0 2=1 2=2 2=1
3=5 3=1 3=0 3=2 3=2 3=1 3=3 3=4
4=2 4=1 4=4 4=7 4=6 4=4 4=4 4=5
5=4 5 = 12 5=9 5=4 5=9 5 = 11 5=3 5=6D & G Pro/Con Statements
Word DocumentPros and Cons of Concepts D and G
After discussions in their small group and with the entire group, CSG members opposed to
Concept D made the following report:
Opposition to Concept D because:
1. It meets only one of the values of the Consensus Question
2. It takes existing green open space
3. Removes mature trees that should remain
4. Major change in the park without sufficient time for a Reid Park master plan that has
input from neighboring areas
5. Interferes with free access to retention pond and playground
Support of Concept G because:
1. It meets all of the values of the Consensus Question:
2. It’s on hardscape not green open space
3. Keeps existing park intact
4. Preserves old growth trees
5. Allows Zoo to expand
6. Can be less expensive by leasing TRC through TUSD and elimination of the parking
garage
7. Meets the values expressed in community conversation (dialogue circles-4.10.21)
8. Least impacts the flow through Reid Park (parking, people, environment)
After discussions in their small group and with the entire group, CSG members opposed to
Concept G made the following report:
Group would not accept Concept G alone as the proposal to Mayor and Council. This group is
opposed to Concept A.
What could make Concept G something we could support?
1. Find secure, timely funding that is fiscally responsible
2. Expedite the process for funding, zoo redesign, and begin construction all within 2 years
3. Expand surface parking into existing hardscape (e.g. move maintenance yard to a
secure location)
4. Funding for a new dedicated parks maintenance yard that properly accommodates
functional needs
5. Solution for how to handle bus drop-offs to the zoo and revise front entry of zoo using
taxpayer dollars effectively
6. Capital costs must be reduced. Could be through considerations such as:
a. Lease of space that would not reduce or limit Therapeutic Rec activity and future
expansion potential.
b. Examine whether or not the communications towers are actually required
7. Reid Park Master Plan completed within 12 months with robust public participation.
8. No net loss of open free accessible green space.
We have strong reservations about Concept G as listed below:
Impediments:1. Opposed in the public survey by 2:1
2. Complexity of making it all work
3. Not cost effective
a. Parking garage cost
4. Time consuming
5. Funding may not come through
6. Communications towers
7. How do you work the entry? 1.5 million put into new entrance perhaps for naught
This group favored Concept D for the following reasons:
1. Allows ways to minimize the green space taken and maximize the hardscape taken. No
net loss of open free accessible green space.
2. It is the least expensive of the alternate locations that is not B or C,
3. It leaves Barnum Hill and the duck pond intact,
4. It honors the results of the survey and is the quickest path to design and construction
This group supports all of the benefits listed on Option D in the survey. We think it would be an
interesting idea to include the existing maintenance yard for green space, but there is a cost
associated with that and that should be considered.ATTACHMENT C
7TH ANNUAL COMMUNITY ROUNDTABLE FORUM
CELEBRATING DIVERSITYTABLE OF CONTENTS
Page 3 Dialogue Circles Information
Page
46 4 Eight Concepts
Page 5-34 Dialogue Circle Documentation
25 20
Page 35 Was Consensus Reached?
Dialogue Circles - 4.10.21
2
Center for Community Dialogue & Training
Our Family Services
www.ourfamilyservices.org/centerCIRCLES INFORMATION
Dialogue Circles Process
Led by the Center for Community Dialogue & Training and Community Dialogue Facilitators, dialogue
circles were held via Zoom online platform from 1:55pm-3:55pm on Saturday, April 10, 2021. Using a
talking piece, participants spoke one by one in a safe, civil and respectful format that encouraged
thoughtful exploration of experiences and values on Gene C. Reid Park & Reid Park Zoo. Circle
participants engaged in connection and conversation following the Objective, Reflective, Interpretive,
Decision (ORID) method of questions. The process involving a moderate consensus task that was
asked of all participants to come up with a consensus recommendation and a decision that would
46
represent the best feasible course of action for their group.
**Note not all groups came to consensus during this event.
Dialogue Circles
Opening & closing rounds
Nine rounds of questions. You will see scribed rounds in this document
Thirteen circles held. Twelve with two facilitators. One with solo facilitator.
Questions for rounds (scribed rounds in red font following the question)
Round 1: Opening round. Please tell us your name, the group you’re representing, and a
25
memory you have of Reid Park and Reid Park Zoo
Round 2: As you think about the future of Reid Park and the Reid Park Zoo, what hopes and
fears come up for you? (Hopes & Fears listed) (SCRIBED)
Round 3: What positive features do you like about one or more Concepts? (SCRIBED)
Round 4: Follow up to previous round. Clarification. (SCRIBED)
Round 5: Free dialogue round.
Round 6: Based on all you’ve heard, what one to three positive features do you think are
most important to be considered in any future changes to Reid Park and the Reid Park Zoo?
Up to three positive features you want considered when the Mayor and Council decide on
future changes to the Park and Zoo. You may list up to 3. (SCRIBED)
Round 7: First you will each choose your top 4 positive features from this list and we will
record your choices. Then we will look at your choices in order of preference, and seek
agreement on the three or four our Circle wants to recommend. Tally results. (SCRIBED)
Dialogue Circles - 4.10.21
Round 8: Craft recommendation. Group discussion to ran the top three to four
recommendations. Consensus, yes or no. Each participant is asked if they agree with final
recommendations. (SCRIBED)
Round 9: Closing Circle.
Each group was asked to identify the following:
Consensus "YES" or "NO" will be listed for each break out room
Center for Community Dialogue & Training
Our Family Services
www.ourfamilyservices.org/training
facebook.com/centerforcommunitydialogue
3You can also read