Community Infrastructure Levy Economic Viability Study The City of Cardiff Council
←
→
Page content transcription
If your browser does not render page correctly, please read the page content below
Community Infrastructure Levy
                                                   Economic Viability Study

                                                                The City of Cardiff Council
                                                                                                   Final Report

                                                                          On behalf of City   of Cardiff Council

Project Ref: 27818 | Rev: 03 | Date: August 2014

Office Address: 10 Queen Square, Bristol, BS1 4NT
T: +44 (0)117 928 1560 F: +44 (0)117 928 1570 E: bristol@peterbrett.com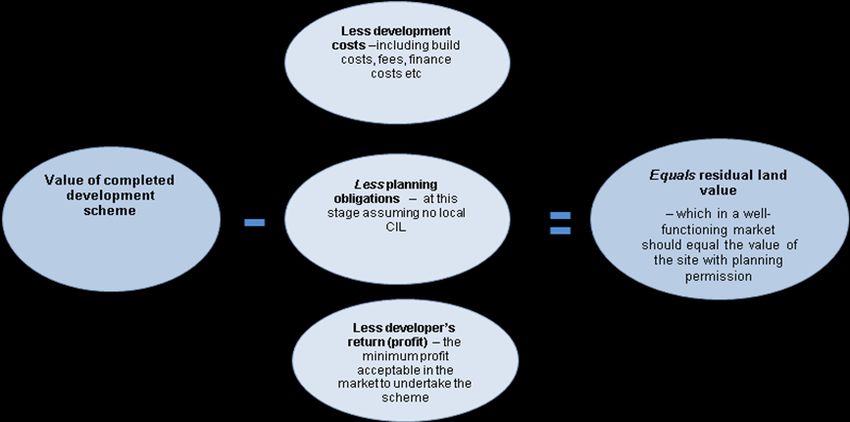
Economic Viability Study
City of Cardiff Council

Document Control Sheet
Project Name: Cardiff Council Viability and Preliminary Draft Charging Schedule
Project Ref:    27818
Report Title:   Community Infrastructure Levy Economic Viability Study
Doc Ref:        Final Report
Date:           August 2014

                                Name                Position           Signature             Date

                                 Tom
                                               Graduate Planner/
                            Marshall/Mark
    Prepared by:                               Associate/Senior             TM           August 2014
                            Felgate/Russell
                                                  Associate
                                Porter

    Reviewed by:             John Baker              Partner                JB           August 2014

    Approved by:             John Baker              Partner                JB           August 2014

                                For and on behalf of Peter Brett Associates LLP

  Revision        Date                    Description              Prepared      Reviewed   Approved

                                                                     TM/
     01         July 2013                 Draft Report                             JB           JB
                                                                    MF/RP
                                                                     TM/
     01         July 2014              Draft Final Report                          JB           JB
                                                                    MF/RP
                                                                     TM/
     01         Aug 2014                  Final Report                             JB           JB
                                                                    MF/RP

Peter Brett Associates LLP disclaims any responsibility to the Client and others in respect of any
matters outside the scope of this report. This report has been prepared with reasonable skill, care and
diligence within the terms of the Contract with the Client and generally in accordance with the
appropriate ACE Agreement and taking account of the manpower, resources, investigations and
testing devoted to it by agreement with the Client. This report is confidential to the Client and Peter
Brett Associates LLP accepts no responsibility of whatsoever nature to third parties to whom this
report or any part thereof is made known. Any such party relies upon the report at their own risk.

© Peter Brett Associates LLP 2014

                                                                                                       ii
Economic Viability Study
City of Cardiff Council
Contents
1 Introduction ................................................................................................................................. 1
1.1 The study scope ............................................................................................................ 1
1.2 Relationship with other evidence base .......................................................................... 1
1.3 Objectives ...................................................................................................................... 1
2 Study Context and Viability ........................................................................................................ 3
2.1 Introduction .................................................................................................................... 3
2.2 Defining viability: the Harman Report ............................................................................ 3
2.3 National policy on CIL ................................................................................................... 3
2.4 What the CIL examiner will be looking for ..................................................................... 7
2.5 Summary ....................................................................................................................... 8
3 Local Development Context ..................................................................................................... 10
3.1 Introduction .................................................................................................................. 10
3.2 Past development patterns .......................................................................................... 10
3.3 Affordable housing....................................................................................................... 12
3.4 Future development..................................................................................................... 13
4 Viability Assessment Method .................................................................................................. 14
4.1 Approach to the development viability appraisals ....................................................... 14
4.2 Benchmark land values ............................................................................................... 15
4.3 Consultation ................................................................................................................. 15
5 Residential Market and Viability Analysis .............................................................................. 17
5.1 Market overview .......................................................................................................... 17
5.2 Typologies ................................................................................................................... 20
5.3 Residential viability assumptions ................................................................................. 23
5.4 Residential viability analysis ........................................................................................ 29
5.5 Residential recommendations ..................................................................................... 31
6 Non-residential Market Assessment and Viability ................................................................. 32
6.1 Approach ..................................................................................................................... 32
6.2 Future development type ............................................................................................. 32
6.3 Typologies ................................................................................................................... 33
6.4 Establishing gross development value (GDV) ............................................................. 36
6.5 Development Costs ..................................................................................................... 40
6.6 Land for non-residential uses ...................................................................................... 43
7 Non Residential Viability Analysis .......................................................................................... 45
7.1 Introduction .................................................................................................................. 45
7.2 Retail uses ................................................................................................................... 45
7.3 B-class uses ................................................................................................................ 48
7.4 Care homes ................................................................................................................. 48
7.5 Student accommodation .............................................................................................. 49
iiiEconomic Viability Study
City of Cardiff Council
7.6 Leisure development ................................................................................................... 49
7.7 Other non-residential development ............................................................................. 50
7.8 Non-residential recommendations ............................................................................... 50
8 CIL Recommendations ............................................................................................................. 51
8.1 Viability findings ........................................................................................................... 51
Figures
Figure 4.1: Method diagram: value of completed development scheme .............................................. 14
Figure 5.1 Average house prices in key settlements in South Wales ................................................... 17
Figure 5.2 Five Year forecast values, 2014-2018 ................................................................................. 17
Figure 5.3 Potential headroom for CIL by development type and area ................................................ 29
Figure 7.1 Potential headroom for CIL by different retail uses .............................................................. 48
Tables
Table 3.1 Residential completions 2006-2014 ...................................................................................... 10
Table 3.2 Gross permission by size of site 2006-2013 (data provided by the council) ......................... 11
Table 3.3 Development types (completions) (data provided by the council) ........................................ 11
Table 3.4 Dwelling completion by type (completions) (data provided by the council)........................... 12
Table 3.5 Private and Affordable completions (data provided by the council) ...................................... 12
Table 3.6 Strategic residential sites ...................................................................................................... 13
Table 5.1 Average Sales values in South Wales .................................................................................. 18
Table 5.2 New house on market (April 2013) ........................................................................................ 19
Table 5.3 Average house and flat prices paid (new and second-hand market) .................................... 20
Table 5.4 Residential typologies and dwelling mix ................................................................................ 22
Table 5.5 Dwelling sizes, sqm per unit .................................................................................................. 23
Table 5.6 Assumed open market sales values, per sqm at 2Q 2014 .................................................. 25
Table 5.7 Residential viability results .................................................................................................... 30
Table 6.1 City centre retail rents at 2013 .............................................................................................. 37
Table 6.2 Retail warehouses rents at 2013 ........................................................................................... 38
Table 6.3 Central location office rents at 2013 ...................................................................................... 38
Table 6.4 Out of town office rents at 2013 ............................................................................................ 39
Table 6.5 Non-residential uses – rent and yields .................................................................................. 39
Table 6.6 Non-residential uses by size and site coverage ratios .......................................................... 41
Table 6.7 Non Residential Uses – Build Costs...................................................................................... 41
Table 6.8 COSTAR land transactional values ....................................................................................... 43
Table 6.9 Existing land values for non-residential uses ........................................................................ 44
Table 7.1 Central area convenience/comparison viability ..................................................................... 46
Table 7.2 Edge of centre convenience/comparison viability ................................................................. 46
Table 7.3 Supermarkets viability ........................................................................................................... 47
Table 7.4 Retail warehouse viability ...................................................................................................... 47
Table 7.5 Local convenience viability .................................................................................................... 47
Table 7.6 B-class development viability ................................................................................................ 48
Table 7.7 Care homes viability .............................................................................................................. 49
Table 7.8 Student accommodation viability ........................................................................................... 49
Table 7.9 Hotel viability levy .................................................................................................................. 49
Table 7.10 Mixed leisure viability .......................................................................................................... 50
Table 8.1 The City of Cardiff recommended CIL charging rates ........................................................... 51
ivEconomic Viability Study
City of Cardiff Council
Appendices
Appendix A Example of a residential appraisal
Appendix B Example of a non-residential appraisal
Appendix C Development industry workshop notes
vEconomic Viability Study
City of Cardiff Council
1 Introduction
1.1 The study scope
1.1.1 Peter Brett Associates LLP was commissioned by the City of Cardiff Council (hereafter
“Cardiff Council” or “the Council”) to undertake an Economic Viability Assessment to provide
evidence and advice to support the introduction of a Community Infrastructure Levy in Cardiff.
1.1.2 Our objective in this study is to help inform the decisions by locally elected members about the
risk and balance between the policy aspirations of achieving sustainable development and the
realities of economic viability. In making their decision on the balance, members are seeking
guidance on the maximum level of development contributions, including potential for a
Community Infrastructure Levy (CIL).
1.1.3 The report and the accompanying appraisals have been prepared in line with RICS valuation
guidance. However, it is first and foremost a supporting document to inform the drafting of the
developer contributions/CIL evidence base and planning policy, in particular policy concerned
with the planning, funding and delivery of infrastructure needed to support delivery of the plan.
1
1.1.4 As per Professional Standards 1 of the RICS Valuation Standards – Global and UK Edition ,
the advice expressly given in the preparation for, or during the course of negotiations or
possible litigation does not form part of a formal “Red Book” valuation and should not be relied
upon as such. No responsibility whatsoever is accepted to any third party who may seek to
rely on the content of the report for such purposes.
1.2 Relationship with other evidence base
1.2.1 In addition to this report PBA prepared an earlier report on the overall delivery of Cardiff’s
Local Development Plan. This report is based on the information contained within the earlier
report and updated where appropriate.
1.3 Objectives
1.3.1 The objectives of this report are to use the available evidence to assess what level of CIL is
appropriate within Cardiff and that is broadly viable in terms of delivering the plans and
policies set out in its strategy. The stages of the study are to:
Review the policy and legislative context
Review the types of development likely to come forward during the plan period
Consider the evidence relating to the costs and values of different residential and non-
residential development in Cardiff and establish assumptions to inform both residential and
non-residential viability appraisals
Provide evidence for the council in developing their Community Infrastructure Levy (CIL)
Charging Schedule
1
RICS (January 2014) Valuation – Professional Standards, PS1 Compliance with standards
and practice statements where a written valuation is provided.
1Economic Viability Study
City of Cardiff Council
In providing this evidence undertake a series of viability tests on the hypothetical
development typologies and the Council’s proposed strategic sites and consider whether
there is sufficient value to support policies including those on affordable housing and CIL.
2Economic Viability Study
City of Cardiff Council
2 Study Context and Viability
2.1 Introduction
2.1.1 The basis of viability testing in this Report is through a series of generic site appraisals, using
the residual value (RV) approach. This needs to take account of a wide variety of inter-related
factors which are explored below, which include various items of planning obligations and
community gain expected to be delivered through the operation of the planning system.
2.1.2 The key question is whether a suggested level of Community Infrastructure Levy (CIL),
combined with other planning obligations, including affordable housing and other policy
requirements will inhibit development generally, and conversely, what level of CIL, and
continuing contributions through S.106 Agreements, can be delivered whilst maintaining
economic viability?
2.1.3 It is important that policy relating to planning obligations is realistic and credible, taking into
account the local housing and commercial market, the economics of development, including
price, supply, demand, need and profit issues. Whilst this report is set within the known
planning and economic context at the time of production, it will be important to update its
assumptions and findings when there are significant changes to the market and economy or
changes to the type of growth sought in the county.
2.1.4 It is also of note that the importance of maintaining plan viability is a central theme of national
planning policy and guidance in recent years across England and Wales. We explore this
context in the following section.
2.2 Defining viability: the Harman Report
2.2.1 The cross industry and CLG supported ‘Viability Testing Local Plans’ (June 2012) provides
detailed guidance regarding viability testing and in particular provides practical advice for
planning practitioners on developing viable Local Plans which limits delivery risk. This
guidance forms the basis to our approach in this report.
2.2.2 The Harman Report usefully defines viability. 'Viability Testing Local Plans' (Local housing
Delivery Group, June 2012), states that:
“An individual development can be said to be viable if, after taking account of all costs,
including central and local government policy and regulatory costs, and the cost and
availability of development finance, the scheme provides a competitive return to the developer
to ensure that development takes place, and generates a land value sufficient to persuade the
land owner to sell the land for the development proposed.”
2.2.3 Although prepared with the support of CLG there is no reason as to why the principles set out
in Harman should not be applicable in Wales.
2.3 National policy on CIL
2.3.1 CIL is a planning charge based on legislation that came into force on 6 April 2010. The levy
allows local authorities in England and Wales to raise contributions from development to help
pay for infrastructure that is needed to support planned development. Local authorities who
wish to charge the levy must produce a draft charging schedule setting out CIL rates for their
areas – which are to be expressed as pounds (£) per square metre, as CIL will be levied on
the gross internal floorspace of the net additional liable development. Before it is approved by
the Council, the draft schedule has to be tested by an independent examiner.
3Economic Viability Study
City of Cardiff Council
2.3.2 CIL is not devolved to Wales and that the guidance and regulations are prepared by the CLG
and Welsh Government as set out in:
The Planning Act 2008 as amended by the Localism Act 2011.
2 3 4 5 6
The CIL Regulations 2010 , as amended in 2011 , 2012 , 2013 and 2014 .
The CIL Guidance which was updated and published in February 2014 and since replaced
7 8
by National Planning Practice Guidance on CIL (NPPG CIL).
2.3.3 The 2014 Regulations have altered key aspects of setting the charge for authorities who
publish a Draft Charging Schedule for consultation. The key points from these various
documents are summarised below.
Striking the appropriate balance
2.3.4 The revised Regulation 14 requires that a charging authority ‘strike an appropriate balance’
between:
a. The desirability of funding from CIL (in whole or in part) the… cost of infrastructure
required to support the development of its area… and
b. The potential effects (taken as a whole) of the imposition of CIL on the economic viability
of development across its area.
2.3.5 By itself, this statement is not easy to interpret. The guidance explains its meaning. A key
feature of the 2014 Regulations is to give legal effect to the requirement in this guidance for an
authority to ‘show and explain…’ their approach at examination. This explanation is important
and worth quoting at length:
‘The levy is expected to have a positive economic effect on development across a local plan
area. When deciding the levy rates, an appropriate balance must be struck between additional
investment to support development and the potential effect on the viability of developments.
This balance is at the centre of the charge-setting process. In meeting the regulatory
requirements (see Regulation 14(1)), charging authorities should be able to show and explain
how their proposed levy rate (or rates) will contribute towards the implementation of their
relevant plan and support development across their area.
As set out in the National Planning Policy Framework in England (paragraphs 173 – 177), the
sites and the scale of development identified in the plan should not be subject to such a scale
of obligations and policy burdens that their ability to be developed viably is threatened. The
9
same principle applies in Wales.’
2.3.6 In other words, the ‘appropriate balance’ is the level of CIL which maximises the delivery of
development in the area. If the CIL charging rate is above this appropriate level, there will be
2
http://www.legislation.gov.uk/ukdsi/2010/9780111492390/pdfs/ukdsi_9780111492390_en.pdf
3
http://www.legislation.gov.uk/ukdsi/2011/9780111506301/pdfs/ukdsi_9780111506301_en.pdf
4
http://www.legislation.gov.uk/uksi/2012/2975/pdfs/uksi_20122975_en.pdf
5
http://www.legislation.gov.uk/uksi/2013/982/pdfs/uksi_20130982_en.pdf
6
http://www.legislation.gov.uk/uksi/2014/385/pdfs/uksi_20140385_en.pdf
7
DCLG (February 2014) Community Infrastructure Levy Guidance and DCLG (June 2014) National Planning Practice
Guidance: Community Infrastructure Levy (NPPG CIL)
8
Since the Welsh Government advises that the Welsh authorities adhere to the CIL Guidance, it is therefore expected that the
replacement of the CIL Guidance by the NPPG CIL also applies in Wales.
9
DCLG (June 2014) NPPG CIL (para 009).
4Economic Viability Study
City of Cardiff Council
less development than planned, because CIL will make too many potential developments
unviable. Conversely, if the charging rates are below the appropriate level, development will
also be compromised, because it will be constrained by insufficient infrastructure.
2.3.7 Achieving an appropriate balance is a matter of judgement. It is not surprising, therefore, that
charging authorities are allowed some discretion in this matter. This has been reduced by the
2014 Regulations, but remains. For example, Regulation 14 requires that in setting levy rates,
the Charging Authority (our underlining highlights the discretion):
‘must strike an appropriate balance…’ i.e. it is recognised there is no one perfect balance;
‘Charging authorities need to demonstrate that their proposed levy rate or rates are informed
by ‘appropriate available’ evidence and consistent with that evidence across their area as a
whole.’
‘A charging authority’s proposed rate or rates should be reasonable, given the available
evidence, but there is no requirement for a proposed rate to exactly mirror the evidence ……
10
There is room for some pragmatism.’
2.3.8 Thus the guidance sets the delivery of development firmly in within the context of
implementing the Local Plan. This is linked to the plan viability requirements of the NPPF,
particularly paragraphs 173 and 174. This point is given emphasis throughout the guidance.
For example, in guiding examiners, the guidance makes it clear that the independent
examiner should establish that:
‘…..evidence has been provided that shows the proposed rate (or rates) would not threaten
11
delivery of the relevant Plan as a whole…..’
2.3.9 This also makes the point that viability is not simply a site specific issue but one for the plan as
a whole.
2.3.10 The focus is on seeking to ensure that the CIL rate does not threaten the ability to develop
viably the sites and scale of development identified in the Local Plan. Accordingly, when
considering evidence the guidance requires that charging authorities should:
‘use an area based approach, involving a broad test of viability across their area’,
supplemented by sampling ‘…an appropriate range of types of sites across its area…’ with the
focus ‘...on strategic sites on which the relevant Plan relies and those sites where the impact
12
of the levy on economic viability is likely to be most significant (such as brownfield sites).
2.3.11 This reinforces the message that charging rates do not need to be so low that CIL does not
make any individual development schemes unviable (some schemes will be unviable with or
without CIL). The levy may put some schemes at risk, however, in aiming to strike an
appropriate balance overall, the charging authority should avoid threatening the ability to
develop viably the sites and scale of development identified in the Local Plan.
Keeping clear of the ceiling
2.3.12 The guidance advises that CIL rates should not be set at the very margin of viability, partly in
order that they may remain robust over time as circumstances change:
10
DCLG (June 2014) NPPG CIL (para 019)
11
Ibid (para 038)
12
Ibid (para 019)
5Economic Viability Study
City of Cardiff Council
‘…..if the evidence pointed to setting a charge right at the margins of viability………it would be
appropriate to ensure that a ‘buffer’ or margin is included, so that the levy rate is able to
13
support development when economic circumstances adjust.’
2.3.13 We would add two further reasons for a cautious approach to rate-setting, which stops short of
the margin of viability:
Values and costs vary widely between individual sites and over time, in ways that cannot
be fully captured by the viability calculations in the CIL evidence base.
A charge that aims to extract the absolute maximum would be strenuously opposed by
landowners and developers, which would make CIL difficult to implement and put the
overall development of the area at serious risk.
Varying the CIL charge
2.3.14 CIL Regulations (Regulation 13) allows the charging authority to introduce charge variations
by geographical zone in its area, by use of buildings, by scale of development (GIA of
buildings or number of units) or a combination of these three factors. (It is worth noting that
14
the phrase ‘use of buildings’ indicates something distinct from ‘land use’). As part of this,
some rates may be set at zero. But variations must reflect differences in viability; they cannot
be based on policy boundaries. Nor should differential rates be set by reference to the costs of
infrastructure.
2.3.15 The guidance also points out that charging authorities should avoid ‘undue complexity’ when
setting differential rates, and ‘….it is likely to be harder to ensure that more complex patterns
15
of differential rates are state aid compliant.’
2.3.16 Moreover, generally speaking, ‘Charging schedules with differential rates should not have a
disproportionate impact on particular sectors or specialist forms of development’; otherwise
16
the CIL may fall foul of state aid rules.
2.3.17 It is worth noting, however, that the guidance gives an example which makes it clear that a
strategic site can be regarded as a separate charging zone: ‘If the evidence shows that the
area includes a zone, which could be a strategic site, which has low, very low or zero viability,
17
the charging authority should consider setting a low or zero levy rate in that area.’
Supporting evidence
2.3.18 The legislation requires a charging authority to use ‘appropriate available evidence' to inform
18
their charging schedule . The guidance expands on this, explaining that the available data ‘is
19
unlikely to be fully comprehensive’.
2.3.19 These statements are important, because they indicate that the evidence supporting CIL
charging rates should be proportionate, avoiding excessive detail. One implication of this is
that we should not waste time and cost analysing types of development that will not have
13
Ibid (para 019)
14
The Regulations allow differentiation by “uses of development”. “Development” is specially defined for CIL to include only
‘buildings’, it does not have the wider ‘land use’ meaning from TCPA 1990, except where the reference is to development of the
area.
15
DCLG (June 2014) NPPG CIL (para 021)
16
Ibid (para 021)
17
Ibid (para 021)
18
Planning Act 2008 section 211 (7A)
19
DCLG (June 2014) NPPG CIL (para 019)
6Economic Viability Study
City of Cardiff Council
significant impacts, either on total CIL receipts or on the overall development of the area as
set out in the Local Plan.
Chargeable floorspace
2.3.20 CIL will be payable on most buildings that people normally use and will be levied on the net
additional new build floorspace created by any given development scheme. The following will
not pay CIL:
New build that replaces demolished existing floorspace that has been in use for six months
in the last three years on the same site, even if the new floorspace belongs to a higher-
value use than the old;
Retained parts of buildings on the site that will not change their use, or have otherwise
been in use for six months in the last three years;
Development of buildings with floorspace less than 100 sqm (if not a new dwelling), by
charities for charitable use, homes by self-builders’ and social housing as defined in the
regulations.
CIL, S106, S278 and the regulation 123 infrastructure list
2.3.21 The purpose of CIL is to enable the charging authority to carry out a wide range of
infrastructure projects. CIL is not expected to pay for all infrastructure requirements but could
make a significant contribution. However, development specific planning obligations
(commonly known as S106) to make development acceptable will continue with the
introduction of CIL. In order to ensure that planning obligations and CIL operate in a
complementary way, CIL Regulations 122 and 123 place limits on the use of planning
obligations.
2.3.22 Some developers have expressed concerns about ‘double dipping’ (i.e. being charged twice
for the same infrastructure by requiring the paying of CIL and S106). To overcome this
concern, it is imperative that charging authorities are clear about the authorities’ infrastructure
needs and what developers will be expected to pay for and through which route. The
guidance expands this further in explaining how the regulation 123 list should be scripted to
account for generic projects and specific named projects).
2.3.23 The guidance states that ‘it is good practice for charging authorities to also publish their draft
(regulation 123) infrastructure lists and proposed policy for the scaling back of S106
agreements.’ This list now forms part of the ‘appropriate available evidence’ for consideration
at the CIL examination.
2.3.24 The guidance identifies the need to assess past evidence on developer contributions, stating
‘as background evidence, the charging authority should also provide information about the
amount of funding collected in recent years through section 106 agreements, and information
on the extent to which affordable housing and other targets have been met’.
2.3.25 Similarly, there are restrictions on using section 278 highway agreements to fund
infrastructure that is also included in the CIL infrastructure list. This is done by placing a limit
on the use of planning conditions and obligations to enter into section 278 agreements to
provide items that appear on the charging authority’s Regulation 123 infrastructure list. Note
these restrictions do not apply to highway agreements drawn up the Highway Agency.
2.4 What the CIL examiner will be looking for
2.4.1 According to the guidance, the independent examiner should check that:
7Economic Viability Study
City of Cardiff Council
The charging authority has complied with the requirements set out in legislation.
The draft charging schedule is supported by background documents containing appropriate
available evidence.
The proposed rate or rates are informed by and consistent with the evidence on economic
viability across the charging authority's area.
Evidence has been provided that shows the proposed rate or rates would not threaten
delivery of the relevant Plan as a whole.
2.4.2 The examiner must recommend that the draft charging schedule should be approved, rejected
or approved with specific modifications.
Policy and other requirements
2.4.3 CIL is not devolved to Wales and that the guidance and regulations are prepared by the CLG
and Welsh Government. More broadly, the CIL guidance states that ‘Charging authorities
20
should consider relevant national planning policy when drafting their charging schedules’ .
Where consideration of development viability is concerned, the CIL guidance draws specific
attention to paragraphs 173 to 177 of the NPPF and to paragraphs 162 and 177 of the NPPF
in relation to infrastructure planning.
2.4.4 The only policy requirements which refer directly to CIL in the NPPF are set out at paragraph
175 of the NPPF, covering, firstly, working up CIL alongside the plan making where practical;
and secondly placing control over a meaningful proportion of funds raised within
21
neighbourhoods where development takes place. Since April 2013 this policy requirement
has been complemented with a legal duty on charging authorities to pass a specified
proportion of CIL receipts to local communities, or to spend it on behalf of the neighbourhood
if there is no local community for the area where development takes place. Whilst important
considerations, these two points are outside the immediate remit of this study.
2.5 Summary
2.5.1 To meet legal requirements and satisfy the independent examiner, a CIL charging schedule
published as a Draft for consultation after 24 February 2014, (when the 2014 CIL Regulations
Amendments became law) should aim to strike a balance between additional investment to
support development and the potential effect on the viability of developments.
2.5.2 This means that the net effect of the levy on total development across the area should be
positive. CIL may reduce development by making certain schemes which are not plan
priorities unviable. Conversely, it may increase development by funding infrastructure that
would not otherwise be provided, which in turn supports development that otherwise would not
happen. The law requires that the net outcome of these two impacts should be judged to be
positive. This judgement is at the core of the charge-setting and examination process.
2.5.3 Legislation and guidance also set out that:
Authorities should avoid setting charges up to the margin of viability.
CIL charging rates may vary across geographical zones, building uses, and by scale of
development. But differential charging must be justified by differences in development
viability, not by policy or by varying infrastructure costs; it should not introduce undue
complexity; and it should have regard to State Aid rules.
20
Ibid (para 011)
21
http://www.legislation.gov.uk/uksi/2013/982/pdfs/uksi_20130982_en.pdf
8Economic Viability Study
City of Cardiff Council
Charging rates should be informed by ‘appropriate available evidence’, which need not be
‘fully comprehensive’.
Charging authorities should be clear and transparent about the use of different approaches
to developers funding infrastructure and avoid ‘double dipping’.
2.5.4 While charging rates should be consistent with the evidence, they are not required to ‘mirror’
the evidence. In this, and other ways, charging authorities have discretion in setting charging
rates.
9Economic Viability Study
City of Cardiff Council
3 Local Development Context
3.1 Introduction
3.1.1 This chapter briefly outlines the local development context in Cardiff by reviewing past
development that has taken place, and outlining the planned growth in the emerging Plan.
This development context has informed the viability appraisal assumptions.
3.2 Past development patterns
3.2.1 Patterns of past development can normally provide a guide to the likely patterns of future
development. Table 3.1 below analyses the amount of net residential completions over the
period 2006 to 2014. The completions rate shows the impact of the recent recession as the
average completion rate falls considerably in the years after 2008, with completions in the last
two years almost half of the 2009/10 rate and a third of the 2008/09 figure.
3.2.2 Compared to what is required, the (Deposit) Cardiff Local Development Plan (LDP) identifies
in policy KP1 the need for a provision of 41,100 new dwellings between the plan period of
2006 – 2026; approximately 2,055 per year. Table 3.1 also identifies the cumulative
completion rate of the last 8 years of the plan period, noting that 9,267 homes have been
completed so far with a further c.10,000 in the development pipeline with planning consent.
3.2.3 To meet the targets of 41,100, the Deposit Plan does require a higher level of housing growth
and the council should be mindful of this in setting its CIL policy.
Table 3.1 Residential completions 2006-2014
Year (ending March) Completions Cumulative Completions
2006/07 2,368 2,368
2007/08 2,028 4,396
2008/09 1,517 5,913
2009/10 867 6,780
2010/11 959 7,739
2011/12 560 8,299
2012/13 474 8,773
*2013/14 494 9,267
Source: Cardiff County Council Background Technical Paper No.1 Population and Housing (Appendix 2)
* Latest figure supplied by Wales.gov, New house building in Wales, January to March 2014
Scale and type of past delivery
3.2.4 Table 3.2 shows the scale of applications permitted between 2006 and 2013. This shows that
that the vast majority of the supply has come from larger sites of over 10 dwellings. The figure
of housing permitted in smaller sites, of less than ten dwellings, as remained fairly constant
throughout the period, whilst the permissions granted on sites of over 10 dwellings has
fluctuated more so.
10Economic Viability Study
City of Cardiff Council
Table 3.2 Gross permission by size of site 2006-2013 (data provided by the council)
Year (ending Windfalls (10 or Small Sites Changes of Use to
March) more) (Economic Viability Study
City of Cardiff Council
Table 3.4 Dwelling completion by type (completions) (data provided by the council)
Year (ending March) Houses Flats
2006/07 727 1,641
2007/08 718 1,310
2008/09 450 1,070
2009/10 279 588
2010/11 230 729
2011/12 234 326
2012/13 212 262
32% 68%
Source: Cardiff County Council: (Cardiff Housing Monitoring Schedule, March 2013)
3.2.7 However, this is a reflection of the past situation. Moving forward, the LDP identifies a range
of large Greenfield strategic sites which will significantly change the balance of housing supply
in the future, as explored later in this section.
3.3 Affordable housing
3.3.1 The number of affordable housing units completed has also been considered. The Cardiff
Local Development Plan 2006–2026, deposit plan, highlights “significant need” for affordable
housing, citing 9170 people currently on combined housing waiting list as at September 2013.
The deposit plan outlines the affordable housing target as 6,953 over the remainder of the
plan period, equating to 535 per annum.
3.3.2 The headline figure for affordable housing completions as a proportion of total supply between
the period 2006 to 2013 is 16%, which equates to an average of 201 affordable dwellings
provided per annum. Therefore, it can be seen that recent trends in delivery lag some way
behind the plan targets.
Table 3.5 Private and Affordable completions (data provided by the council)
2006/07 2007/08 2008/09 2009/10 2010/11 2011/12 2012/13
Private 2,022 1,834 1,305 564 812 442 381
Affordable 346 194 212 303 147 118 93
Total 2,368 2,028 1,517 867 959 560 474
Yearly average of AH
15% 10% 14% 35% 15% 21% 20%
as a proportion of total
Source: Cardiff Council (Cardiff Housing Monitoring Schedule, March 2013)
3.3.3 The Council have set out their affordable housing requirements in Policy H3 of the Cardiff
local development plan 2006 – 2026 deposit plan. This outlines that new developments will
seek 20% affordable housing on brownfield sites and 30% affordable housing on Greenfield
sites on all developments either containing 10 or more dwellings or exceeding 0.3 hectares in
gross site area.
12Economic Viability Study
City of Cardiff Council
3.3.4 For the purpose of the study we have used the following Affordable Housing tenure split:
Social rented – 40%
Intermediate – 40%
Low Cost Home Ownership (LCHO) – 20%
3.4 Future development
3.4.1 As discussed previously the housing need in Cardiff for the plan period 2006-2026 is 41,100
new dwellings, or 2,055 dwellings per year.
3.4.2 The local development plan identifies a number of strategic sites in order to meet this need in
Table 3.6 below. In total, the strategic sites detail provision for 13,950 dwellings across the
plan period.
Table 3.6 Strategic residential sites
Site No. of Dwellings
Former Gas Works, Ferry Road 500
North-West Cardiff 5,000
North of Junction 33 on M4 2,000
South of Creigiau 650
North-East Cardiff 4,500
East of Pontprennau Link Road 1,300
Source: Cardiff Council: Cardiff Local Development Plan 2006 – 2026 Deposit Plan
3.4.3 Aside from residential requirement, the LDP policy suggests that a range of employment and
retail development is promoted in suitable locations across the Plan period. Other uses are
likely to be required or promoted over the plan period, however in terms of floorspace and
impact on infrastructure these are not considered to be as significant as the residential,
employment and retail development identified above.
13Economic Viability Study
City of Cardiff Council
4 Viability Assessment Method
4.1 Approach to the development viability appraisals
4.1.1 Viability assessment is at the core of the charge-setting process. The purpose of the
assessment is to identify charging rates at which the bulk of the development proposed in the
development plan is financially viable, in order to ensure that the CIL does not put at risk the
overall development planned for the area.
4.1.2 Our viability assessments are based on development appraisals of hypothetical schemes,
using the residual valuation method. This approach is in line with accepted practice and as
22 23
recommended by RICS guidance and the Harman report. Residual valuation is applied to
different land uses and where relevant to different parts of the city, aiming to show typical
values for each. It is based on the formula presented in Figure 4.1.
Figure 4.1: Method diagram: value of completed development scheme
4.1.3 For each of the hypothetical schemes tested, we use this formula to estimate typical residual
land values, which is what the site should be worth once it has full planning permission. The
residual value calculation requires a wide range of inputs, or assumptions, including the costs
of development and the required developer’s return.
4.1.4 The arithmetic of residual appraisal is straightforward (we use a bespoke spreadsheet models
for the appraisals). However, the inputs to the calculation are hard to determine for a specific
site (as demonstrated by the complexity of many S106 negotiations). The difficulties grow
when making calculations that represent a typical or average site – which is what we need to
do for estimating appropriate CIL Charges. Therefore our viability assessments are
necessarily broad approximations, subject to a margin of uncertainty
4.1.5 An example of a residential viability appraisal is shown in Appendix A. Detailed individual
appraisals for non-residential schemes are provided in Appendix B.
22
RICS (2012), Financial Viability in Planning, RICS First Edition Guidance Note
23
Local Housing Delivery Group Chaired by Sir John Harman (2012) Viability Testing Local Plans
14Economic Viability Study
City of Cardiff Council
4.1.6 Having estimated the residual value, we compare this residual value with the ‘benchmark land
value’ or ‘land cost’, which is the minimum land value the landowner will accept to release
their land for the development specified.
4.1.7 Benchmark values will vary to reflect the landowner’s judgements, which might include the
contextual nature of development, the site density achievable, the approach to the delivery of
affordable housing (in the context of residential development) and so on. There are a wide
range of permutations here, but to make progress a central value has to be assumed, even
though in practice there could be a margin of error. These values are discussed further in
Section 5.
4.1.8 In the appraisals, if the achieved residual land value is:
below the benchmark value, then the development is not financially viable even without
CIL. That means it will not happen unless the circumstances change.
equal to the benchmark value, the development is just viable but there is no surplus value
available for CIL.
above the benchmark value, the development is viable. The excess of residual over
benchmark value measures the maximum amount that may be potentially captured by
CIL. This then converts the amount available for CIL into a per square metre charge.
4.1.9 It is important to bear in mind that these calculations are no more than approximations,
surrounded by margins of uncertainty but are based on best available evidence and
judgement at the time of the appraisal. This uncertainty is taken account of in drawing the
implications for CIL by using professional judgment to interpret the figures. This is explained
below.
4.2 Benchmark land values
4.2.1 Establishing the existing use value (EUV) of land, and in setting a benchmark at which a
landowner is prepared to sell to enable a consideration of viability, can be a complex process.
There are a wide range of site specific variables which effect land sales (e.g. position of the
landowner - are they requiring a quick sale or is it a long term land investment). However, for
a strategic study, where the land values on future individual sites are unknown, a pragmatic
approach is required.
4.2.2 Therefore as a starting point, we have looked at VOA data for serviced land in areas in Cardiff
as well as any available transaction or sale price data. We also reviewed land currently being
marketed on the UK Land Directory website, and have also been informed by discussion at
the development industry workshop in May 2013. The purpose of this event was to outline the
aims and likely impacts of CIL for development and to obtain feedback from planning agents
and developers as well as the Council on the emerging viability study. Minutes from the
workshop are at Appendix C.
4.2.3 It is important to appreciate that assumptions on benchmark land values can only be broad
approximations, subject to a wide margin of uncertainty. This is taken into account when
drawing conclusions and in the recommendations from the analysis and results. The
benchmark land values for the tested developments informing the CIL Charge are explained
and detailed in the following chapters on viability.
4.3 Consultation
4.3.1 In our experience, local agents and developers are always happy to explain where the market
is at, what is going on, and why. The consultation with the development industry has helped
15Economic Viability Study
City of Cardiff Council
to make our assumptions more robust, and these discussions also help us see where potential
concerns may arise, so that the council can be better prepared to address concerns.
4.3.2 The key data discussed includes:
Typologies;
The density and mix of development;
Estimated market values of completed development;
Existing use and open market land values;
Basic build cost;
External works (% of build cost);
Professional fees (% of build cost);
Marketing & sales costs (% of development value);
Finance costs (typical prevailing rates);
Developer's margin (% of revenue).
4.3.3 We worked with the council to set up a Stakeholder meeting for the development industry
active in the city and surrounding areas. This took place in May 2013 and was attended by
developers and agents in addition to the consultants and Council officers. A copy of the
meeting note can be found in Appendix C.
16Economic Viability Study
City of Cardiff Council
5 Residential Market and Viability Analysis
5.1 Market overview
5.1.1 The housing market in Cardiff continues to outperform many of its neighbours in South and
South West Wales. Recent years, in particular, has seen a slight widening gap between
Cardiff properties and neighbouring settlements. Table 5.1 shows that although average
prices are lower in Cardiff than in locations around the Vale of Glamorgan, but this is likely to
reflect the typical larger properties in these areas as opposed to the greater number of flatted
developments in Cardiff in recent years.
Figure 5.1 Average house prices in key settlements in South Wales
Source: Land registry
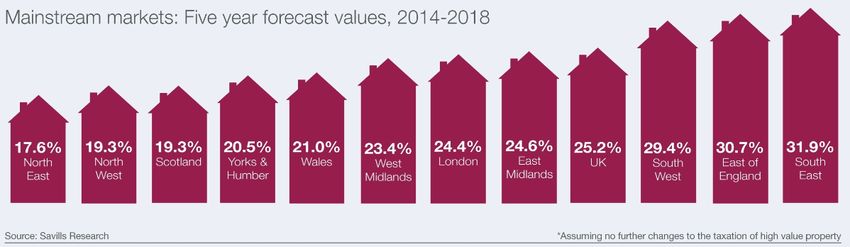
5.1.2 Looking forward, the latest projections of house prices prepared by Savills in their Residential
Property Focus (Q2 2014), shows a 21% increase in values in Wales over the next five years,
which is slightly below their expectations for the UK at 25%. Based on the characteristics of
the local market, Cardiff is likely to over-perform the Wales national average.
Figure 5.2 Five Year forecast values, 2014-2018
Source: Savills, May 2014
5.1.3 In comparison with other areas in Wales, house prices in Cardiff are above the average prices
achieved. The table below illustrates these differences.
17Economic Viability Study
City of Cardiff Council
Table 5.1 Average Sales values in South Wales
Detached (4 Semi detached Terraced Flat
Area
bed) (3 bed) (2-3 bed) (2 bed)
Wales £217,664 £139,443 £112,236 £122,122
Cardiff £293,161 £194,048 £164,114 £125,172
Newport £232,683 £135,389 £97,937 £83,985
5.1.4 In Table 5.1 is a selection of schemes currently, or soon to be, on the market (as of April
2013). These were sourced from the surveys, from discussions with developers, from local
newspapers, developer’s websites, and generic websites such as RightMove.
5.1.5 As a guide, open market sales prices per sqm for new homes currently on the market,
allowing for a reduction between asking price and achieved selling prices, vary from the lowest
at around £1,700 in St Mellons to £3,900 in Cyncoed and Llanishen.
5.1.6 Values are also affected by the size of the site, reflecting return on capital employed across a
period of time, the cost of financing a purchase compared with the time taken to receive all
site sales value.
5.1.7 Sales rates also have a major effect on the overall financing, and most volume housebuilder
projects seek to achieve around 40-50 open market sales per year (down some 20% from
2007) in order to justify the land economics upon which the land purchase is based. On larger
sites (of say 4+ developers), and allowing for affordable housing, this would result in some
200+ dwellings per annum being completed.
18Economic Viability Study
City of Cardiff Council
Table 5.2 New house on market (April 2013)
Cardiff CIL - New Build Property Details (Zoopla & Rightmove April 2013)
Gross Price
Internal
Ref No Property
MarketedName
by Address Post code Type No. of Beds Floorspa
Sqm Asking Price Price per sqm
Terrace/end of
2 MGY Coed y Wenallt, Rhiwbina, Cardiff CF14 6TN 3 71.0 £ 275,000 £ 3,874
terrace?)
Terrace/end of
3 MGY Coed y Wenallt, Rhiwbina, Cardiff CF14 6TN 3 71.0 £ 279,950 £ 3,943
terrace?)
4 MGY Coed y Wenallt, Rhiwbina, Cardiff CF14 6TN Apartment/Coach House 2 47.7 £ 179,950 £ 3,772
7 Savills Cardiff Bay, Cardiff CF10 5QZ Apartment (Penthouse) 3 160.7 £ 524,995 £ 3,267
"Lincoln" at Colchester Avenue,
11 Barratt Homes CF23 9XR Detached 4 95.0 £ 329,995 £ 3,472
Penylan, Cardiff
"Kingsbridge" at Colchester Avenue,
12 Barratt Homes CF23 9XR Detached 4 83.3 £ 306,995 £ 3,686
Penylan, Cardiff
16 Bellway Ty Gwyn Gardens, Ty Gwyn Road, Cardiff CF23 5JG Detached 4 174 £ 775,995 £ 4,459
The Lodge Vila 1, Apartment 1, Drysgol
17 Edwards & Co. CF15 8BS Apartment 2 117 £ 299,950 £ 2,563
Road, Radyr, Cardiff.
The Lodge Vila 1, Apartment 5, Drysgol
18 Edwards & Co. CF15 8BS Apartment 2 95 £ 299,950 £ 3,153
Road, Radyr, Cardiff.
19 Taylor Wimpey Brython Drive, St. Mellons, Cardiff CF3 0LR Detached 3 66.9 £ 204,995 £ 3,064
20 MGY Usk Grove, Usk Road, Cardiff CF14 0NN Apartment 2 59.6 £ 210,000 £ 3,521
21 Darlows Brython Drive, St. Mellons, Cardiff CF3 0LR Detached 3 67.2 £ 199,995 £ 2,977
Roma Victoria Wharf, Cardiff Bay,
22 Edwards & Co. CF11 0SH Apartment 1 34.0 £ 108,500 £ 3,187
Cardiff.
Terrace/end of
23 MGY Coed Y Wenallt, Rhiwbina, Cardiff CF14 6TN 3 71.0 £ 279,950 £ 3,943
terrace?)
Russell Court, Russell Street, Roath,
24 allen & harris CF24 3EG Apartment 3 55.8 £ 125,000 £ 2,240
Cardiff CF24
Russell Court, Russell Street, Roath,
25 allen & harris CF24 3EG Apartment 2 43.1 £ 125,000 £ 2,901
Cardiff CF24
Russell Court, Russell Street, Roath,
26 allen & harris CF24 3EG Apartment 1 39.1 £ 119,000 £ 3,046
Cardiff CF24
27 Palmer & Gunn Rhydes Court, Llanishen, Cardiff CF14 5NA Apartment 2 51.6 £ 225,000 £ 4,359
The Alvingham Special, Parc Llaneurwg,
28 Darlows CF3 0LR Detached 3 67.184 £ 199,995 £ 2,977
Off Brython Drive, St Mellons, Cardiff,
Castle Mews, Merthyr Road,
29 Palmer & Gunn CF15 7LF Terraced 3 86.812 £ 185,000 £ 2,131
Tongwynlais
Castle Mews, Merthyr Road,
30 Palmer & Gunn CF15 7LF Terraced 2 60.994 £ 175,000 £ 2,869
Tongwynlais
The Chepstow at Castle Heights , Caer
31 Leadbitter Homes CF3 3PW Semi-detached 3 61.228 £ 149,995 £ 2,450
Castell Place, Rumney, Cardiff
The Usk at Castle Heights , Caer Castell
32 Leadbitter Homes CF3 3PW Semi-detached 2 50.567 £ 128,000 £ 2,531
Place, Rumney, Cardiff
The Raglan at Castle Heights , Caer
33 Leadbitter Homes CF3 3PW Semi-detached? 2 41.074 £ 115,000 £ 2,800
Castell Place, Rumney, Cardiff
34 CS Properties Spencer David Way, St. Mellons CF3 0QB Apartment 2 55.426 £ 105,000 £ 1,894
5.1.8 In addition to analysing property on the market we have also looked at past sales values, Average Values
per sq.m
using Land Registry data. When looking at the markets within Cardiff there are distinctions £in 3,163
average prices across different postcodes. Table 5.3 below shows average house and flat
prices between 2009 and 2014 for the main postcode areas in Cardiff.
5.1.9 Importantly, the table also shows the type of developments that have been built in those
areas. For instance, average prices are lower in city centre locations, such as CF10, and this
is partly due to the high proportion of flatted developments (91%) built in the city centre.
19You can also read