A Systematic Literature Review of Green and Sustainable Logistics: Bibliometric Analysis, Research Trend and Knowledge Taxonomy - MDPI
←
→
Page content transcription
If your browser does not render page correctly, please read the page content below
International Journal of
           Environmental Research
           and Public Health

Review
A Systematic Literature Review of Green and
Sustainable Logistics: Bibliometric Analysis,
Research Trend and Knowledge Taxonomy
Rui Ren 1 , Wanjie Hu 2, * , Jianjun Dong 2, *, Bo Sun 2 , Yicun Chen 3 and Zhilong Chen 1
 1    College of Defense Engineering, Army Engineering University of PLA, Nanjing 210042, China;
      renrui0801@163.com (R.R.); Chen-zl@vip.163.com (Z.C.)
 2    College of Civil Engineering, Nanjing Tech University, Nanjing 211816, China; sunbo8079@163.com
 3    Research Institute for National Defense Engineering of Academy of Military Science PLA China,
      Beijing 100850, China; cyc-lgdx@foxmail.com
 *    Correspondence: steve_hu@vip.163.com (W.H.); dongjj@njtech.edu.cn (J.D.)

 Received: 25 November 2019; Accepted: 25 December 2019; Published: 30 December 2019

 Abstract: Ever-growing globalization and industrialization put forward impending requirements
 for green and sustainable logistics (G&SL). Over the past decades, G&SL initiatives triggered
 worldwide deliberations, aiming at easing negative transport externalities and improving supply
 chain performance. This review-based paper attempts to offer a joint quantitative and qualitative
 understanding for the overall evolutionary trend, knowledge structure, and literature gaps of
 the G&SL research field. Employing the science mapping approach, a total of 306 major paper
 published from 1999 to 2019 were retrieved, elaborated on, and synthesized. Visualized statistics
 regarding publication years, journal allocation/co-citation, inter-country/institution collaboration,
 influential articles, co-occurred keywords, and time view clusters of research themes were analyzed
 bibliographically. On this basis, a total of 50 sub-branches of G&SL knowledge were classified and
 thematically discussed based on five alignments, namely (i) social-environmental-economic research,
 (ii) planning, policy and management, (iii) application and practice, (iv) technology, and (v) operations
 research. Finally, the current knowledge obstacles and the future research opportunities were
 suggested. The findings contribute to portray a systematic intellectual prospect for the state quo,
 hotspots, and academic frontiers of G&SL research. Moreover, it provides researchers and practitioners
 with heuristic thoughts to govern transportation ecology and logistics service quality.

 Keywords: sustainable logistics; freight transportation; green initiative; transport and environment;
 supply chain management; literature review; bibliometric; taxonomy

1. Introduction
     Sustainable development has inspired many green and sustainable logistics (G&SL) activities
to reduce the negative effects of freight transportation [1] and improve positive environmental and
social feedbacks. From long-haul heavy-duty logistics to intra-city distribution, road-based freight
transportation systems generate tremendous negative externalities in daily operations [2], including
pollutant emissions, congestion, traffic accidents, noise, visual interference, infrastructure failure and
resource waste [3]. Moreover, these negative externalities, together with the disadvantages of logistics
system itself (e.g., limited intelligentization, personnel dependence and vulnerability [4]), further
lead to the downgrade of supply chain performance at both enterprise level and regional level. With
the rapid growth of logistics demand, the damage grows exponentially, which will eventually bring
irreversible impacts to the economy and the whole ecosystem [5].

Int. J. Environ. Res. Public Health 2020, 17, 261; doi:10.3390/ijerph17010261    www.mdpi.com/journal/ijerph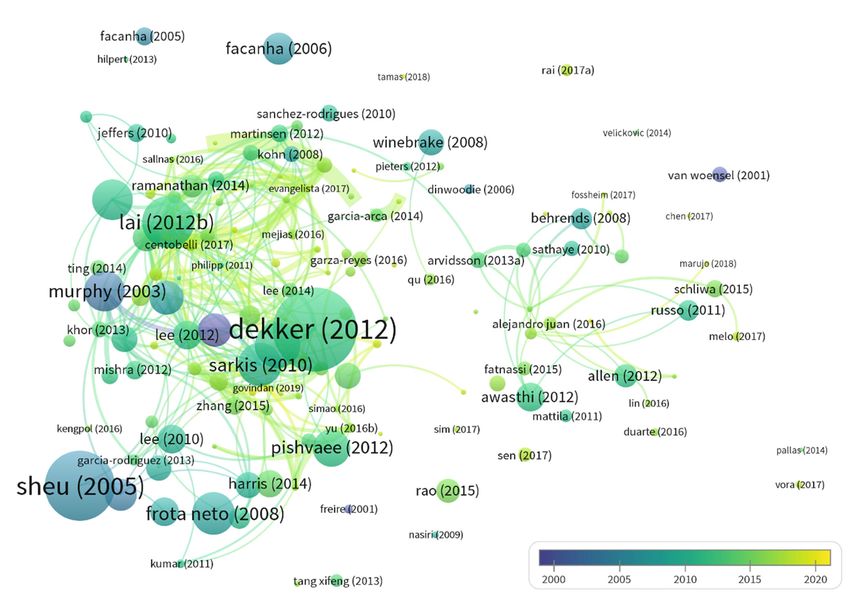
Int. J. Environ. Res. Public Health 2020, 17, 261                                                    2 of 25

      The operation management of physical distribution is one of the most significant and challenging
sub-issues of the macro supply chain management (SCM) [6], because it involves real-time scheduling
and coordination of hundreds of thousands of packages and containerized goods under a dynamic
logistics scenario [7]. G&SL is defined as the planning, control, management, and implementation of
logistics system through the advanced logistics technologies and environmental management, aiming
to reduce pollutant emissions and improve logistics efficiency [8]. G&SL is not only concerned with
providing customers with green products or services [9], but also with the green and sustainability
of the entire lifecycle of the logistics process [10]. Various green logistics modes, activities, and
behaviors were proposed and gradually realized from government rules to technological innovations.
For example, the construction of green logistics network [11–13], reverse logistics [14], emission
control [15], electric freight vehicle [16], modal shift and multimodal transportation [17], energy
efficiency [18], collaboration [19,20], outsourcing [21,22], etc. A wide range of topics related to G&SL
yielded substantial academic results and considerable practical performance. However, G&SL is still
in its infancy and is far from meeting the challenges posed by the complexity of internal cooperation
and uncertainties of external markets [1].
      Previous studies reviewed G&SL from different perspectives. By reviewing 115 papers,
Zhang et al. [10] analyzed the combinatorial optimization problems and swarm intelligence technique
applied in improving G&SL performance. Qaiser et al. [23] conducted some brief statistics on the
bibliometric information of 40 papers on G&SL. Bask and Rajahonka [8] mainly reviewed the role of
environmental sustainability in multimodal freight transport decision-making. Based on 56 papers,
Mangiaracina et al. [24] summarized the impact of business-to-customer transportation process on the
environment. Arvidsson et al. [25] reviewed the sustainable measures for improving urban distribution
efficiency. Pourhejazy and Kwon [26] conducted a survey on 380 articles published from 2005–2016
and revealed the application status of operations research technique in the supply chain optimization.
The literature of green SCM was classified and reviewed by Srivastava [4] from a reverse logistics
angle. This work was further enriched by Fahimnia et al. [27], who investigated the bibliographical
information and trend of a majority of green SCM research through article co-citation network and
keywords co-occurrence network.
      However, based on the time of publication and the number of papers contained, the existing
studies are outdated and incomplete, unable to provide a comprehensive analysis of the booming
G&SL research in the past two years. Also, it is more difficult to integrate the multitudinous research
directions to build a complete knowledge structure for G&SL. Therefore, it is of great theoretical and
practical significance to objectively and quantitatively investigate the overall progress of G&SL.
      This study aims to conduct a comprehensive review of the global G&SL literature, so as to explore
the state-of-the-art, hotspots and research trend, as well as to build the G&SL knowledge classification
system. Specifically, first, tracking and analyzing the evolution of the G&SL research field from
(i) publication year and journals; (ii) countries, regions, and organizations; (iii) influential documents;
(iv) keywords clustering and research themes. Second, establishing the knowledge taxonomy based on
the scientometric results. Third, identifying the research gaps and the future research opportunities.
      The novelty of this study lies in two aspects. One is to integrate the science mapping approach
into the systematic literature review process to visualize the relationships among the G&SL literature.
Science mapping approach is composed of data mining and bibliographic analysis, which can minimize
subjective arbitrariness and grasp useful information to facilitate in-depth thematic analysis. Another
is that this study further extends the bibliography to illuminate the emerging knowledge branches,
gaps, and agendas in G&SL research, which will contribute to the improvement of G&SL practice
and research innovation. The findings are expected to provide researchers and practitioners with a
panoramic description and in-depth understanding of G&SL research. Additionally, the proposed
knowledge structure can also be used as a handbook-like tool to further collect, analyze, and expand
knowledge in the G&SL field and to provide references for other innovative logistics initiatives.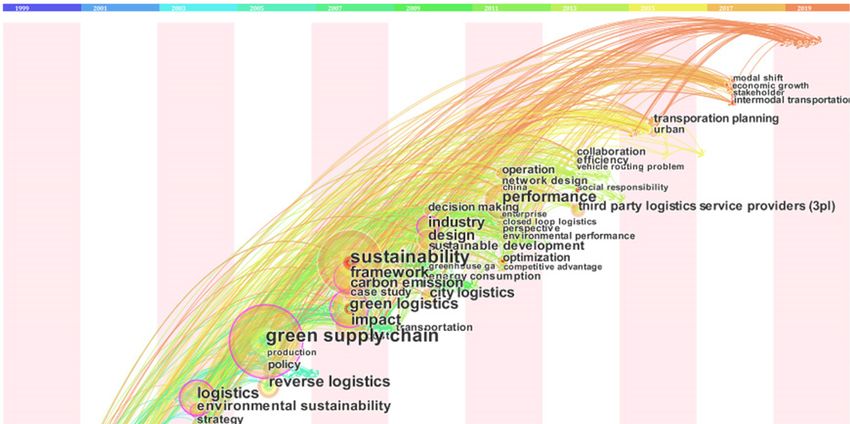
Int. J. Environ. Res. Public Health 2020, 17, 261 3 of 25
Int. J. Environ. Res. Public Health 2020, 17, x FOR PEER REVIEW 3 of 25
The rest
The rest isis organized
organized as as follows.
follows. In Section 2, the outline of research method is introduced.
introduced.
Section33presents
Section presents thethe results
results of data
of the the data collection
collection and
and the the results
results of five
of five parts of parts of scientometric
scientometric analysis.
analysis. Section 4 proposes the taxonomy of G&SL research based on the keywords
Section 4 proposes the taxonomy of G&SL research based on the keywords clustering and discusses clustering and
discusses
the the knowledge
knowledge branches inbranches
detail. Thein detail.
currentThe currentgaps
research research gaps and
and agenda areagenda are also identified.
also identified. Section 5
Section 5 summarizes
summarizes the majorand
the major findings findings and limitations.
limitations.
2.
2. Research
Research Method
Method
2.1.
2.1. Overview
Overview of
of Review
Review Protocol
Protocol
This
Thisreview-based
review-basedstudystudyconducted
conductedaasystematic
systematicinvestigation
investigationon onthe
theacademic
academicdevelopment
developmentof of
global
global G&SL research with the aids of science mapping. Science mapping is a quantitativeanalysis
G&SL research with the aids of science mapping. Science mapping is a quantitative analysis
approach
approachthat thatuses mathematical
uses statistics
mathematical and visualization
statistics techniques
and visualization to study to
techniques bibliographic networks
study bibliographic
(e.g., academics, institutions, themes, keywords, and journals) in a specific field [28].
networks (e.g., academics, institutions, themes, keywords, and journals) in a specific field [28]. ThisThis approach
has been widely
approach has beenapplied in many
widely academic
applied in many fields, such as
academic sustainable
fields, such astransportation [29], environment
sustainable transportation [29],
science [30], city logistics [31] and waste management [32] and can directly synthesize
environment science [30], city logistics [31] and waste management [32] and can directly synthesize salient findings
from thefindings
salient existingfrom
knowledge system.
the existing knowledge system.
Figure
Figure11illustrates
illustratesthe
thedetailed
detailedresearch
researchprocess,
process,consisting
consistingofofthree
threesteps.
steps.
Publication Influential research Literature retrieval and Comprehensive retrieval
chronicle highlight selection from WoS and Scopus
Articles across
journals Duplicates filtering and
form inspection
Descriptive analysis
Visualization of
collaboration among
Document refine following
countries and regions
inclusion/exclusion criteria
Visualization of VosViewer coding and
collaboration among scientometric analysis
global orgainzaitions Knowledge taxonomy
of G&SL literature
Timeview and
Visualization of co- Visualization of co-
clustering of co-
cited journals cited documents Thematic discussion on
occurred keywords
the clustered themes
Research trend of G&SL Findings and conclusions Current research gaps and agenda of G&SL
Figure1.
Figure 1. The
The flowchart
flowchart of
of reviewing
reviewingG&SL
G&SLliterature.
literature.
In
Instep
step1, 1,
thethe
statistics was was
statistics obtained after aafter
obtained comprehensive retrievalretrieval
a comprehensive from twofrom
electronic
two databases,
electronic
Web of Science
databases, Web(WoS) core and
of Science Scopus.
(WoS) core Two
and rounds
Scopus.ofTwoselection
rounds were then performed
of selection were thento refine, classify,
performed to
and encode the documents. The year publication trend, journal allocation and the
refine, classify, and encode the documents. The year publication trend, journal allocation and the most cited articles
were
mostdescribed.
cited articles were described.
Four
Four scientometric
scientometric tests
tests were
were carried
carried out
out in
in step
step 2,2,namely
namely(i) (i)Journal
Journalco-citation
co-citationanalysis:
analysis: to
to
identify
identify the most
most cited
citedjournals
journalsand
andthe
the research
research domains
domains they
they belong
belong to. analysis
to. This This analysis
helps helps to
to reveal
the distribution of published journals and cited journals of the reviewed documents, so as to identify
popular journals in G&SL research domain. (ii) Countries/organizations collaboration analysis: to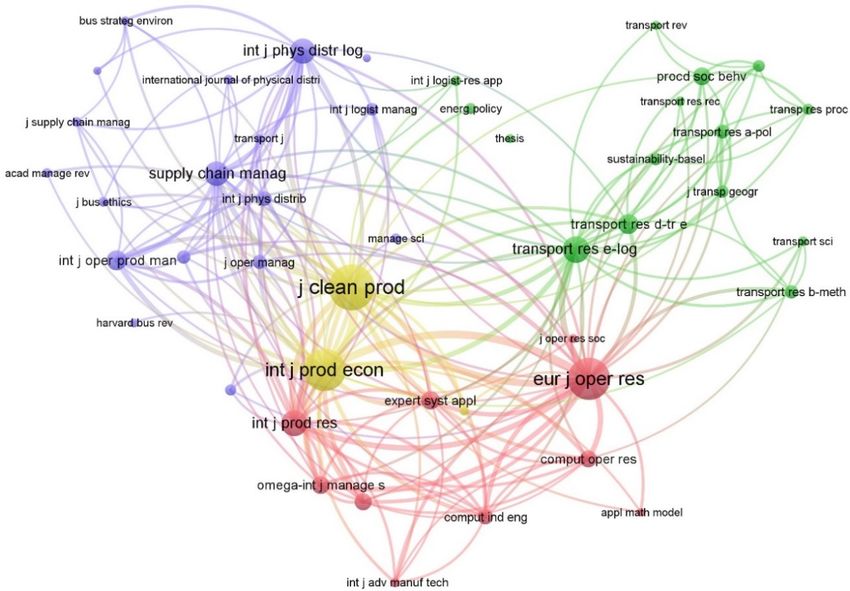
Int. J. Environ. Res. Public Health 2020, 17, 261                                                                 4 of 25

reveal the distribution of published journals and cited journals of the reviewed documents, so as to
identify popular journals in G&SL research domain. (ii) Countries/organizations collaboration analysis: to
visualize the collaborative research network of G&SL among countries and organizations, so that the
readers can quickly understand the partnerships between major research communities and institutions
around the world. (iii) Document co-citation analysis: to highlight the influential G&SL articles and the
corresponding reference relationships. By analysis of the papers with high citation, the emerging trend
of scholars’ research interest to G&SL is easier to grasp. (iv) Keywords co-occurrence analysis: to map
out the co-occurred time zone of the hotspots G&SL keywords and cluster them into several research
themes. Network analysis of co-occurred keywords is used to clarify the knowledge structure of G&SL
as well as to present the research hotspots and potential research opportunities in the future.
     In step 3, the hierarchical knowledge structure of G&SL was proposed for thematic discussion.
     The text mining software VOSviewer was adopted for science mapping, combining with another
software CiteSpace to portray the time view of the clustered keywords based on the same data.
VOSviewer, developed by van Eck and Waltman [33], is a comprehensive bibliometric analysis tool
based on Visualization of Similarities (VOS) technology, which has unique advantages in clustering
fragmented knowledge from different domains according to their similarity and relatedness. In the
visualized networks, a node signifies a particular bibliographic item, such as organization, country,
keyword or reference, etc. The node size represents the counting of the evaluated item namely citation
or occurrence. Link denotes the co-citation, co-occurrence or collaboration relationship. The metric,
total link strength (TLS), is outputted automatically by the software to reflect the correlation degree
between any two nodes in the generated networks. A higher value of TLS, the higher importance and
centrality of the item has [31]. Nodes with a high similarity were clustered together and distinguished
by colors with other clusters, while the nodes with low similarity should be separated as far as possible.
The similarity matrix can be calculated by Formula (1), where cij is the co-occurred or co-cited times of
item i and item j, Wi and Wj denote the node sizes of item i and item j respectively [33]. The stopping
criterion of VOSviewer mapping is the minimal sum of weighted Euclidean distances of all items in
each cluster [34], which can be expressed by Formula (2), where xi and xj are the positions of the nodes.
     For a detailed operation manual of bibliographical experiments using science mapping approach,
readers are advised to refer Jin et al. [28] and Hu et al. [31].
                                                   h            i h              i
                                                S = similarityij = cij · Wi /W j                                     (1)
                                          X                                   X
                            E(X, S) =           similarityij kxi − x j k2 ,          kxi − x j k = 1, for ∀i, j      (2)
                                          i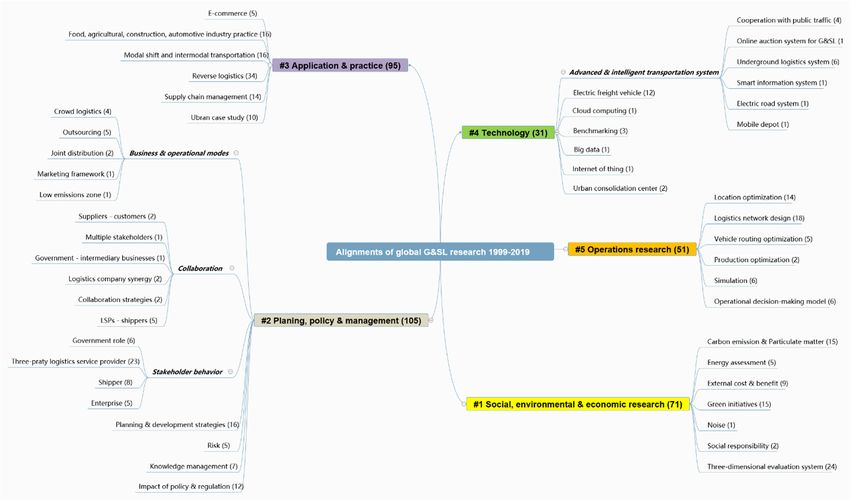
Int. J. Environ. Res. Public Health 2020, 17, x FOR PEER REVIEW 5 of 25
Int. J. Environ. Res. Public Health 2020, 17, 261 5 of 25
business competition and (iii) offshoring and lean production. Finally, 91 records were removed,
leavingon
design 306
thefull-length articles
specialized in our
logistics review portfolio.
technology e.g., biomass and biofuel; (ii) business competition and
(iii) offshoring and lean production. Finally, 91 records were removed, leaving 306 full-length articles
in our review portfolio. Table 1. Results of literature retrieval and selection.
Initial Records:
Table 1. Results of literature retrieval and selection.
418
Databases Web of Science Core Scopus
InitialInitial Records:
Records: 418
Databases Web of Science Core Scopus
742
Initial Records: 742
TI = TI
((“sustainable” OR “green” OR “sustainability” OR
= ((“sustainable” OR “green” OR “sustainability” OR
“environmental” OR
“environmental” OR “ecofriendly”
“ecofriendly” OR “ecological”)AND
OR “ecological”) AND
(“logistics” OROR
(“logistics” (“reverse”
(“reverse”ANDAND“logistics”)
“logistics”) OROR((“freight”
((“freight” OR Valid records
Logical OR “goods”
“goods” OR “cargo”)
OR “cargo”) ANDAND (“transport”
(“transport” OR OR “transportation”Valid OR records (first-round
(first-round
Logical statement “transportation” OR “delivery” OR “distribution” OR filter):
statement “delivery” OR “distribution” OR “movement” OR “shipment” filter):
“movement” OR “shipment” OR “supply”))) OR (“electric” 397
OR “supply”)))
AND (“truck”OR OR(“electric” AND“vehicle”))))
(“freight” AND (“truck” OR AND (“freight” AND 397
“vehicle”))))
Language:AND Language:
(English) AND Type:(English) AND
(Article) AND Type:
Time (Article)
span:
AND (1999–2019)
Time span: (1999–2019)
(i) green logistics
(i) green initiatives
logistics initiativesand
and practices; (ii)strategy,
practices; (ii) strategy, policy,
policy,
Inclusion
Inclusion criteria environmental
environmental evaluation,review
evaluation, reviewandand technology;
technology; (iii) (iii) planning Final records
criteria planning and operational research, etc. Final records
(second-round filter):
and operational research, etc. 306
(i) non-peer-reviewed journals;(ii)
(ii)lack
lack of
of references, (second-round
(i) non-peer-reviewed journals; references,
authorships or full text; (iii) less than 5 pages; (iv) Articles do filter):
Exclusion authorships or full text; (iii) less than 5 pages; (iv) Articles do not
Exclusion criteria not relate to G&SL (e.g., generalized supply chain 306
criteria relate to G&SL (e.g.,
management, leangeneralized supplyand
production, market chain management,
purchasing, and lean
production, market and purchasing, and public transport)
public transport)
3. Scientometric
3. Scientometric Experiments
Experiments and
and Analysis
Analysis
3.1. Chronological
3.1. Chronological Publication
Publication Trend
Trend
Figure 22 displays
Figure displays the
the number
number of of papers
papers published
published annually
annually fromfrom 1999–2019
1999–2019 in in the
the portfolio.
portfolio.
Obviously, research
Obviously, research on
on G&SL
G&SL was
was virtually
virtually stagnant
stagnant until
until 2009,
2009, and
and since
since 2010,
2010, itit has
has increased
increased
significantlyyear
significantly year
by by
year.year. By a2018,
By 2018, a staggering
staggering 62 articles62were
articles were The
searchable. searchable.
vigorousThe vigorous
development
development
of of academic
academic research indicatesresearch indicates
the expansion thescope
of the expansion of the
and branch scope and
of G&SL. branch of
Furthermore, G&SL.
from the
Furthermore,
publication from the
number andpublication number and
the recent discussed the recent
topics discussed
of G&SL, topicsthat
it is evident of G&SL, it is evident
the public that
awareness,
the public
market awareness,
acceptance, market
social demandacceptance, social demand
and real-world practiceand real-world logistics
of sustainable practice of sustainable
measures are
logistics measures
undergoing are undergoing
remarkable ascent. remarkable ascent.
Figure 2. Year profile of indexed documents.
Figure 2. Year profile of indexed documents.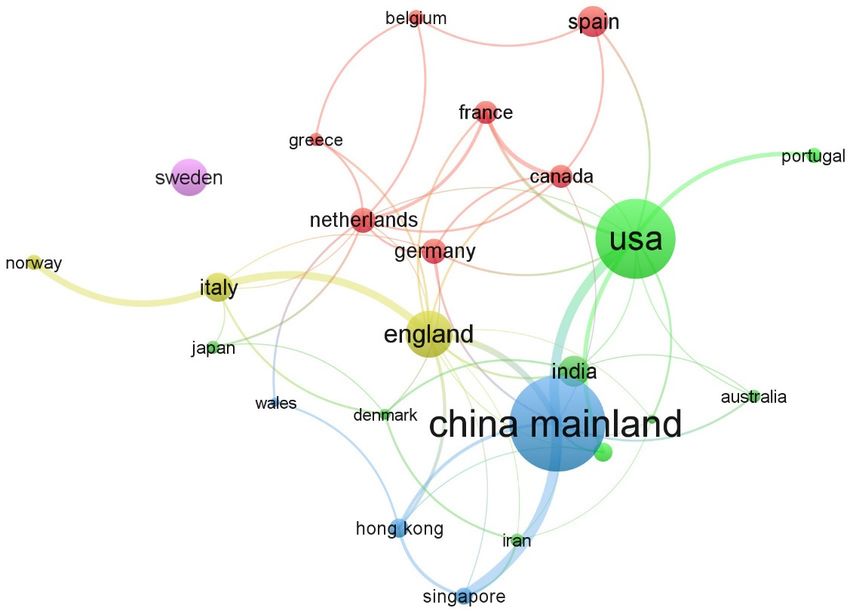
Int. J. Environ. Res. Public Health 2020, 17, 261 6 of 25
Int. J. Environ. Res. Public Health 2020, 17, x FOR PEER REVIEW 6 of 25
3.2. Journal
3.2. Journal Allocation
Allocation and
and Co-Citation
Co-Citation Analysis
Analysis
All 306
All 306 documents
documentswere werefoundfoundinin81
81different
differentjournals.
journals.As As shown
shown in in Figure
Figure3, 3, the
the top
top 15
15 journals
journals
contributed 155
contributed 155 papers,
papers, accounting
accounting for for 51%
51% of of the
the total.
total. The
The impact
impact factors
factors ofof journals
journals were
were also
also
attached based on the Journal Citation Reports (2018). Sustainability ranks first
attached based on the Journal Citation Reports (2018). Sustainability ranks first (35, 11.4%), followed(35, 11.4%), followed
by Journal
by Journal ofof Cleaner
Cleaner Production
Production (24,
(24, 7.8%),
7.8%), Transportation
Transportation Research
Research Part
Part D:D: Transport
Transport and andEnvironment
Environment
(17,5.6%)
(17, 5.6%) and
and International
InternationalJournal
JournalofofProduction
ProductionEconomics
Economics(13, (13,4.2%).
4.2%). Among
Amongthe the top
top 1515 journals,
journals, eight
eight
are from UK, four from The Netherlands, two from Switzerland, and one
are from UK, four from The Netherlands, two from Switzerland, and one from Germany. The papers from Germany. The papers
aremainly
are mainlydistributed
distributedin in the
the three
three academic
academic fields
fields ofof environment,
environment, traffic
traffic engineering
engineering and and operations
operations
management, but
management, but they
they obviously
obviously account
account for
for aa larger
larger proportion
proportion in in the
the environmental
environmental science science and
and
sustainablefield,
sustainable field,which
whichisisin inline
linewith
withthe
theconnotation
connotationof ofG&SL.
G&SL.
Figure 3. Rank
Figure 3. Rank of
of journals
journals in
in G&SL
G&SL publication
publication number.
number.
As
As shown
shown in in Figure
Figure 4,4, among
among the the 12,408
12,408references
references(corresponding
(correspondingtoto2349 2349different
differentjournals),
journals),a
anetwork
networkofof 46 items and 1025 links was formed by identifying the journals that had been cited cited
46 items and 1025 links was formed by identifying the journals that had been more
more than 50 times. In general, the journals that influenced G&SL research
than 50 times. In general, the journals that influenced G&SL research are concentrated in three are concentrated in three
interrelated
interrelatedclusters.
clusters.First is the
First operations
is the operations research (OR),(OR),
research such as European
such Journal of
as European Operational
Journal Research
of Operational
(TLS = 13,076, citation = 494), International Journal of Production Research (TLS =
Research (TLS = 13,076, citation = 494), International Journal of Production Research (TLS = 252, citation 252, citation = 8260),=
Expert
8260), Systems with Applications
Expert Systems (TLS =(TLS
with Applications 4748,=citation = 153),=Omega
4748, citation (TLS =(TLS
153), Omega 5139, citation
= 5139, = 150)= and
citation 150)
Computers & Operations Research (TLS = 4234, citation = 137), which can offer quantitative
and Computers & Operations Research (TLS = 4234, citation = 137), which can offer quantitative methods methods for
the decision-making and optimization issues related to G&SL. The second
for the decision-making and optimization issues related to G&SL. The second cluster is transportationcluster is transportation
research
research (TR),
(TR),such
suchas asTransportation
TransportationResearch
ResearchPartPartAA(TLS(TLS==2057, citation== 103),
2057,citation 103), Part
Part D (TLS== 3883,
D (TLS 3883,
citation = 176), Part E (TLS = 7576, citation = 260), and Journal of Transport Geography (TLS == 2089,
citation = 176), Part E (TLS = 7576, citation = 260), and Journal of Transport Geography (TLS 2089,
citation== 91),
citation which accumulates
91), which accumulates enormous
enormous knowledge
knowledge towards
towards transportation
transportation planning,
planning, technology
technology
and
and operations that can enlighten G&SL research from real-life transport demandand
operations that can enlighten G&SL research from real-life transport demand andpractice.
practice. The
The
third
third cluster, including Supply
cluster, including Supply Chain
Chain Management
Management (TLS (TLS ==6546, citation==232),
6546,citation InternationalJournal
232),International Journal of
of Physical Distribution & Logistics Management (TLS = 6357, citation = 235) and
Physical Distribution & Logistics Management (TLS = 6357, citation = 235) and Journal of Business Logistics Journal of Business
Logistics
(TLS = 2837, = 2837, citation
(TLS citation = 96),
= 96), etc., etc., reveals
reveals that aamount
that a large large amount
of G&SL of research
G&SL research was conducted
was conducted based
based on the research foundation of logistics and supply chain
on the research foundation of logistics and supply chain management (SCM). Among management (SCM). Among all all the
the
publications, of Cleaner Production (TLS = 13,799, citation =
publications, Journal of Cleaner Production (TLS = 13,799, citation = 555) and International Journal of
Journal 555) and International Journal of
Production Economics (TLS = 13,903, citation = 495) are the two most co-cited journals. They often act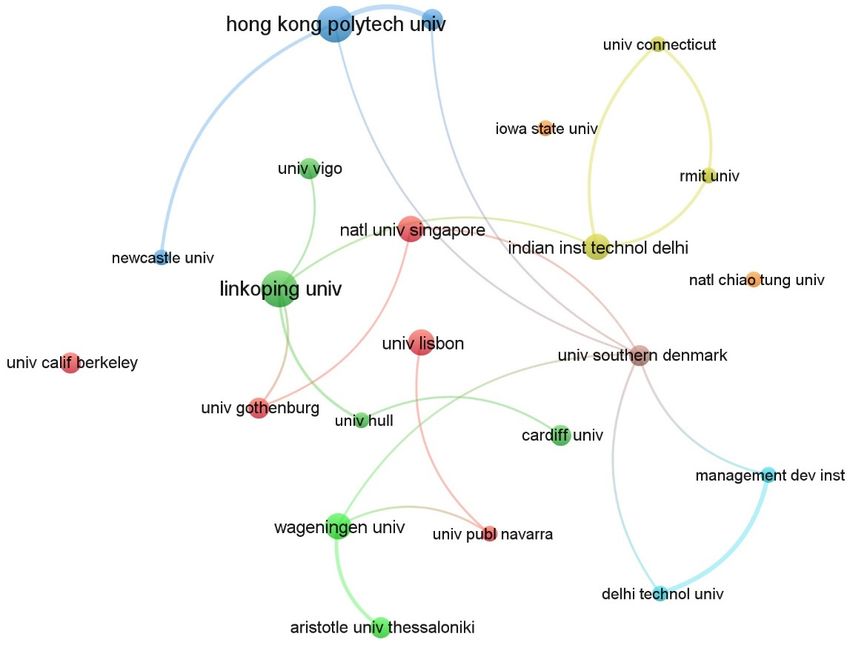
Int. J. Environ. Res. Public Health 2020, 17, 261                                                               7 of 25

Int. J. Environ. Res. Public Health 2020, 17, x FOR PEER REVIEW                                                 7 of 25
Production Economics (TLS = 13,903, citation = 495) are the two most co-cited journals. They often act as
hubs,
as    integrating
   hubs,          thethe
         integrating  results of of
                         results OR,  TRTR
                                    OR,   and SCM
                                            and  SCM with social,
                                                       with       environment
                                                            social, environmentor or
                                                                                  economic implications
                                                                                     economic           to
                                                                                              implications
provide
to       cross-domain
   provide  cross-domainknowledge
                           knowledge crucial to the
                                        crucial     diverse
                                                to the      development
                                                       diverse development of G&SL.
                                                                              of G&SL.

                                         Figure
                                         Figure 4.
                                                4. Mapping
                                                   Mappingof
                                                           ofthe
                                                              thejourn als co-c
                                                                  journals      ited.
                                                                           co-cited.

3.3. Countries/Organizations
3.3. Countries/Organizations Collaboration
                             Collaboration Analysis
                                           Analysis
      Table 2 2lists
      Table          the the
                  lists   countries  or regions
                               countries        that are that
                                           or regions    actively
                                                                arestudying
                                                                     activelyG&SL,     showing
                                                                                studying         six measurements,
                                                                                             G&SL,    showing six
including  number       of publications  (NP), TLS,  average  citation  year, total citations,
measurements, including number of publications (NP), TLS, average citation year, total         average  citation   per
                                                                                                           citations,
country/region,      and   average  normalized    citation.  The  average   normalized     citation
average citation per country/region, and average normalized citation. The average normalized        was  calculated
by dividing
citation was the    total number
                calculated          of citations
                             by dividing         by the
                                           the total     average
                                                     number        number by
                                                               of citations of citations
                                                                                the averagepublished
                                                                                               numberperof year   [34].
                                                                                                            citations
Figure  5 displays     the collaboration   network   among   countries   and  regions.  The   minimum
published per year [34]. Figure 5 displays the collaboration network among countries and regions.        number     of
documents     and    citations for a country   was  set at 5 and  30 respectively.   Finally,
The minimum number of documents and citations for a country was set at 5 and 30 respectively. a map   with  25  items
and 58 links
Finally, a map  was
                  withgenerated.
                         25 items and 58 links was generated.

                           Table 2. Summaries of countries/regions active in G&LS research.

                                                                   Ave.        Total       Ave.        Ave. Norm.
   Country/Region            Territory          NP       TLS
                                                                   Year      Citations    Citation      Citation
   China Mainland            Asia                   49   36        2017         234         4.78          0.57
    United States        North America              41   30        2012        1388        33.85          1.28
       England              Europa                  24   28        2014         488        20.33          1.16
       Sweden               Europa                  19    0        2014         300        15.79          0.88
         India               Asia                   16   6         2018          90         5.63          1.07
        Spain               Europa                  16    6        2014         355        22.19          0.86
         Italy              Europa                  15   18        2017         284        18.93          1.68
   The Netherlands          Europa                  13   18        2011         524        40.31          1.33
      Germany               Europa                  13   10        2014         116         8.92          0.71
       Canada            North America              12   14        2014         285        23.75          0.98
        France              Europa                  12   12        2014         203        16.92          0.86
     Hong Kong               Asia                   10   12        2018         394         39.4          1.53
       Taiwan                Asia                   10   8         2017         456         45.6          1.47
      Singapore              Asia                    9   16        2017         214        23.78          1.64
       Belgium              Europa                   8    6        2014         152          19           1.18
       Portugal             Europa                  8    4         2013         112          14           1.09
Int. J. Environ. Res. Public Health 2020, 17, 261 8 of 25
Table 2. Summaries of countries/regions active in G&LS research.
Ave.
Total Ave.
Int. J.Country/Region
Environ. Res. Public Health 2020, 17, x FOR PEER
Territory NP REVIEW
TLS Ave. Year Norm.8 of 25
Citations Citation
Citation
Greece
China Mainland Europa
Asia 8 49 636 2015
2017 326
234 46.57
4.78 0.92
0.57
United States North America 41 30 2012 1388 33.85 1.28
England to Table 2,
According Europa
G&SL research 24 is widely
28 2014
distributed, 488
especially 20.33 Asia, and
in Europe, 1.16 North
Sweden Europa 19 0 2014 300 15.79
America, which is a field of worldwide concern. Mainland China has the most publications, but the 0.88
India Asia 16 6 2018 90 5.63 1.07
United States
Spain has the highest
Europatotal citation.
16 Other
6 countries/regions
2014 355such as Italy,
22.19 Singapore,
0.86 Hong
Kong, and Taiwan present
Italy a lower number
Europa 15 of publications;
18 2017 however, 284they keep18.93
significant 1.68
figures of
The Netherlands
average Europa
normalized citation which can13strongly
18 express2011their high524influence.40.31 1.33 of the
Besides, most
Germany Europa 13 10 2014 116 8.92 0.71
documents contributed by these countries/regions were published in the last three years, which
Canada North America 12 14 2014 285 23.75 0.98
means they
Franceare playing an increasingly12active 12
Europa role in promoting
2014 G&SL.
203 16.92 0.86
Two
Hongevidence
Kong can beAsia
observed from10 Figure
12 5. First,
2018based on394 a partnership,
39.4 the global
1.53 G&SL
researchTaiwan
is divided into Asia 10
four communities. 8
Therein, 2017 456
two communities are 45.6 1.47
leaded by European
Singapore Asia 9 16 2017 214 23.78 1.64
counties, such as UK, Spain,
Belgium Europa
The Netherlands,
8 6
and 2014
Italy, while 152
the other two 19
communities
1.18
are
“Mainland China-Hong
Portugal Kong-Singapore”
Europa 8 and4 “United
2013 States-India-Australia-Portugal-Taiwan”,
112 14 1.09
dominated by China andEuropa
Greece USA, respectively.
8 6 2015 326 46.57 0.92
Figure
Figure 5. Mapping of
5. Mapping of countries/regions
countries/regions contribute
contribute to
to G&SL
G&SL research.
research.
According to Table 2, G&SL research is widely distributed, especially in Europe, Asia, and North
Second, the international collaboration is not significant. Taking mainland China for instance,
America, which is a field of worldwide concern. Mainland China has the most publications, but the
about 70 percent of 49 publications are completed entirely by domestic institutions. The Swedish
United States has the highest total citation. Other countries/regions such as Italy, Singapore, Hong Kong,
publications do not have any co-authors from other countries or regions. This phenomenon may be
and Taiwan present a lower number of publications; however, they keep significant figures of average
due to the large differences in the background and model of G&SL development in different countries
normalized citation which can strongly express their high influence. Besides, most of the documents
[35]. Moreover, the knowledge gap caused by the wide extension of G&SL and the scattered
contributed by these countries/regions were published in the last three years, which means they are
knowledge structure make the research still focus on the respective fields of researchers, such as
playing an increasingly active role in promoting G&SL.
sustainable development [36], environment governance [37] and transportation planning [38].
Two evidence
Therefore, canthe
at present, be cooperation
observed from Figureacademic
between 5. First, based on a partnership,
institutions the global G&SL
of different backgrounds has
research
not beeniswidely
divided into four
carried out.communities. Therein, two communities are leaded by European counties,
Among the 402 organizations that contributed to G&SL research, those with more than five
documents and over 30 citations were built into a network of 22 items and 22 links, as shown in Figure
6. None of the organizations published more than 10 papers (3% of 306) and the studies were
relatively independent. Therefore, it can be argued that no organization has yet been able to lead
G&SL research so far. However, some of the institutions located in Asia Pacific and Europe have aInt. J. Environ. Res. Public Health 2020, 17, 261 9 of 25
such as UK, Spain, The Netherlands, and Italy, while the other two communities are “Mainland
China-Hong Kong-Singapore” and “United States-India-Australia-Portugal-Taiwan”, dominated by
China and USA, respectively.
Second, the international collaboration is not significant. Taking mainland China for instance,
about 70 percent of 49 publications are completed entirely by domestic institutions. The Swedish
publications do not have any co-authors from other countries or regions. This phenomenon may be due
to the large differences in the background and model of G&SL development in different countries [35].
Moreover, the knowledge gap caused by the wide extension of G&SL and the scattered knowledge
structure make the research still focus on the respective fields of researchers, such as sustainable
development [36], environment governance [37] and transportation planning [38]. Therefore, at
present, the cooperation between academic institutions of different backgrounds has not been widely
carried out.
Among the 402 organizations that contributed to G&SL research, those with more than five
documents and over 30 citations were built into a network of 22 items and 22 links, as shown in
Figure 6. None of the organizations published more than 10 papers (3% of 306) and the studies
were relatively independent. Therefore, it can be argued that no organization has yet been able to
Int. J. Environ. Res. Public Health 2020, 17, x FOR PEER REVIEW
lead G&SL research so far. However, some of the institutions located in Asia Pacific and Europe9 of 25
have a higher reputation in G&SL due to higher citations, including the Hong Kong Polytechnic
(Hong Kong, 388
university (Hong citations),
Kong, 388Wageningen UniversityUniversity
citations), Wageningen (The Netherlands, 370 citations),
(The Netherlands, Aristotle
370 citations),
University
Aristotle University of Thessaloniki (Greece, 324 citations), National Chiao Tung University (Taiwan, 330
of Thessaloniki (Greece, 324 citations), National Chiao Tung University (Taiwan,
citations), Iowa State
330 citations), IowaUniversity (USA,(USA,
State University 206 citations), University
206 citations), UniversityCalifornia
CaliforniaBerkeley
Berkeley (USA,
(USA, 160
citations) and Nanyang
160 citations) Technological
and Nanyang University
Technological (Singapore,
University 137137
(Singapore, citations).
citations).InInaddition,
addition,Figure
Figure 6 also
also shows insufficient collaborative research across
shows insufficient collaborative research across organizations. organizations.
Figure 6. Mapping of global collaboration network among organizations.
Figure 6. Mapping of global collaboration network among organizations.
3.4. Influential Research Highlight
Through the document co-citation test of the portfolio, the most influential G&SL publications
in the past two decades were analyzed and the co-citation network was constructed. In VOSviewer,
the minimum number of citations was set to 30 to build a co-cited visual network map of 83 itemsInt. J. Environ. Res. Public Health 2020, 17, 261 10 of 25
3.4. Influential Research Highlight
Through the document co-citation test of the portfolio, the most influential G&SL publications
in the past two decades were analyzed and the co-citation network was constructed. In VOSviewer,
the minimum number of citations was set to 30 to build a co-cited visual network map of 83 items
and 350, as shown in Figure 7. The nodes in the map denote the documents that were identified by
the first author name and the publication year. The colors of the nodes and the links represent the
time of publication and the time of two documents that are co-cited, respectively. The co-occurrence of
the literature shows an obvious type of “local concentration and overall dispersion”, indicating that
some G&SL studies were widely recognized and produced some common ideas and results. Most
Int. J. Environ.
papers withRes. Public
high Health appeared
citation 2020, 17, x FOR PEER 2010,
around REVIEW 10 of
which was a landmark year for G&SL research. The25
co-citation time series indicate that G&SL knowledge spreads faster and faster.
Figure 7. Mapping of the influential documents and their co-citation relationship.
Figure 7. Mapping of the influential documents and their co-citation relationship.
The top 15 most cited papers are presented in Table 3, showing their publication year, title, TLS,
Thecounts
citation top 15and
most citedThe
topics. papers
mostare presented
cited study was in Table 3, showing
by Dekker their
et al. [39], onepublication year, title, TLS,
of the first methodological
citation
studies to link the operations research knowledge (such as design, planning, and control)ofto the
counts and topics. The most cited study was by Dekker et al. [39], one first
the field
methodological
of green logistics. studies to linkisthe
The second Sheuoperations
et al. [40],research knowledge
whose main (such as
contribution design,
is to propose planning,
a modelingand
control) to the field of green logistics. The second is Sheu et al. [40], whose
technique for sustainable logistics operations and management decisions to maximize supply chain main contribution is to
propose a modeling technique for sustainable logistics operations and
profits. These were followed by papers by Lai and Wong [41] and Ubeda et al. [42], which focused management decisions to
maximize
on using the supply chain profits.
scenario-based These were
approaches, followed
such as theby papers by Lai
questionnaire andand Wong
case [41]toand
study, Ubedathe
evaluate et
al. [42], which focused on using the scenario-based approaches, such as the
environmental performance of green logistics practices. The main topics of other highlighted documentsquestionnaire and case
study,
involve:to(i)evaluate
managementthe environmental performance
insights from industrial of green
practices logistics
[43,44]; practices. The
(ii) multi-criteria main topics
evaluation systemof
other highlighted documents involve: (i) management insights from industrial practices
for green logistics (e.g., policy [45], environment [46], and transportation planning [47]); (iii) network [43,44]; (ii)
multi-criteria
facilities designevaluation system[48,49];
and optimization for green logistics
(iv) reverse (e.g.,[50,51];
logistics policyand [45],
(v) environment [46], and
enterprise responsibility
transportation
and third-partyplanning [47]); (iii) network facilities design and optimization [48,49]; (iv) reverse
logistics [52].
logistics [50,51]; and (v) enterprise responsibility and third-party logistics [52].
Table 3. List of publications with the highest impact in G&SL.
Topic Related
Document Year Title TLS Citation
to G&SL
Operations research for green logistics -
Dekker et al. Operations
2012 An overview of aspects, issues, 100 330
[39] researchInt. J. Environ. Res. Public Health 2020, 17, 261 11 of 25
Table 3. List of publications with the highest impact in G&SL.
Topic Related
Document Year Title TLS Citation
to G&SL
Operations research for green logistics -
Dekker et al. Operations
2012 An overview of aspects, issues, 100 330
[39] research
contributions, and challenges
Sheu et al. An integrated logistics operational model Operations
2005 20 260
[40] for green supply chain management research
Green logistics management and
Lai and Wong Management
2012 performance: Some empirical evidence 82 167
[41] practices
from Chinese manufacturing exporters
Ubeda et al. Management
2011 Green logistics at Eroski: A case study 52 146
[42] practices
Sarkis et al. Reverse
2010 Reverse logistics and social sustainability 104 128
[50] logistics
Frota Neto et Designing and evaluating sustainable Operations
2008 22 128
al. [11] logistics networks research
Murphy and Green perspectives and practices: a Management
2003 78 118
Poist [34] “comparative logistics” study practices
Lin and Ho Determinants of green practice adoption Systematic
2011 48 115
[45] for logistics companies in China evaluation
Credibility-based fuzzy mathematical
Pishvaeee et Operations
2012 programming model for green logistics 24 114
al. [48] research
design under uncertainty
A strategic sustainability justification
Presley et al. Reverse
2007 methodology for organizational 46 91
[51] logistics
decisions: a reverse logistics illustration
Murphy and Green logistics strategies: An analysis of Management
2000 62 90
Poist [44] usage patterns practices
Lieb and Lieb Environmental sustainability in the Environmental
2010 0 87
[52] third-party logistics (3PL) industry impact
Environmental assessment of freight Environmental
Hovath [46] 2006 12 83
transportation in the US impact
A hybrid approach integrating Affinity
Awathi et al. Systematic
2012 Diagram, AHP and fuzzy TOPSIS for 18 74
[47] evaluation
sustainable city logistics planning
The design of sustainable logistics Operations
Lee et al. [53] 2010 24 73
network under uncertainty research
3.5. Keywords Co-Occurrence Analysis
The keywords co-occurrence analysis was conducted to describe the internal composition and
structure of G&SL and to reveal the frontiers [31]. The options “All Keywords” and “Full Counting” in
VOSviewer analysis were checked to obtain a holistic intellectual landscape of G&SL research. Before
the scientometric test, the keywords, such as “third-party logistics providers” versus “3PL”, “transport”
versus “transportation”, which are necessary due to differences in expression, were manually simplified
on the original data file. The minimum occurrences of each keyword was set to 4, forming a network
of 112 nodes representing keywords (1455 keywords in all documents) and 2067 links, as shown in
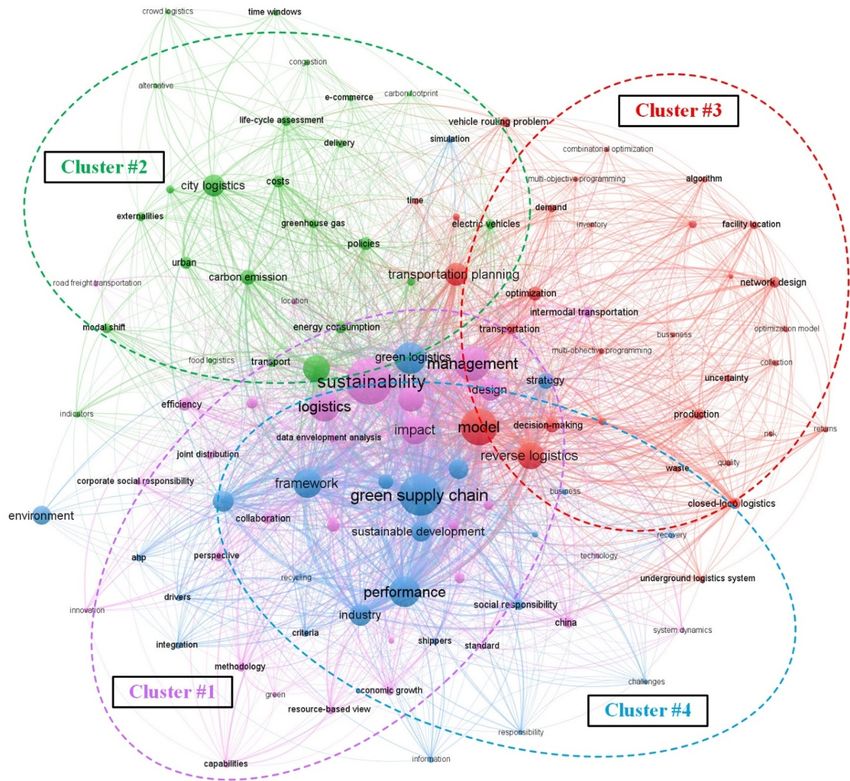
Figure 8.Int. J. Environ. Res. Public Health 2020, 17, 261 12 of 25
Int. J. Environ. Res. Public Health 2020, 17, x FOR PEER REVIEW 12 of 25
Figure 8. Mapping of co-occurred
Figure8. co-occurred keywords.
keywords.
Figure
Figure88displays
displays thethe mainstream
mainstream of of research
research keywords
keywords in in G&SL
G&SL and and their
their co-occurrence
co-occurrence
relationships.
relationships.Divide
Divide these
these keywords
keywords into into four
four clusters
clustersandanddistinguish
distinguishthem themwithwithdifferent
differentcolors.
colors.
Therein,
Therein, Cluster #1 contains
Cluster #1 contains18 items focusing
18 items on the practice
focusing on the and management
practice of logistics sustainability
and management of logistics
(e.g., collaboration,
sustainability case study and
(e.g., collaboration, caseintermodal transportation),
study and intermodal while Cluster
transportation), while#2Cluster
covers#225coversitems,
25 items, concentrating
concentrating on the environmental
on the environmental issues of issues
freightoftransport,
freight transport,
such assuchcarbonas carbon
emission,emission,
energy
energy consumption
consumption and assessment.
and lifecycle lifecycle assessment.
Cluster #3 Cluster #3 (34
(34 items) anditems) and#4Cluster
Cluster #4 (34
(34 items) items)
emphasize
onemphasize
the “model, on planning
the “model, andplanning and optimization”
optimization” as well as theas“supply
well as chain
the “supply chain performance,
performance, development
development
strategy strategy and competitiveness”,
and competitiveness”, respectively. respectively.
Table 4 shows the detailed information of
Table 4 shows the detailed information of the
the significant keywords.
keywords.The Thetoptop10 10most
mostfrequently
frequently
studiedand
studied andhighly
highly connected
connected terms
termsare aresustainability
sustainability (Feq.
(Feq. = TSL
= 80, = green
= 547),
80, TSL supplysupply
547), green chain (Feq.
chain
= 68, TSL = 629), management (Feq. = 58, TSL = 411), model (Feq. = 55, TSL
(Feq. = 68, TSL = 629), management (Feq. = 58, TSL = 411), model (Feq. = 55, TSL = 394), green = 394), green logistics (Feq.
= 48, TSL
logistics = 325),
(Feq. performance
= 48, TSL = 325),(Feq. = 47, TSL =(Feq.
performance 367),=logistics
47, TSL(Feq.
= 367),= 46, TSL = 299),
logistics (Feq.framework
= 46, TSL = (Feq.
299),
= 43, TSL = 356), impact (Feq. = 41, TSL = 312) and reverse logistics (Feq.
framework (Feq. = 43, TSL = 356), impact (Feq. = 41, TSL = 312) and reverse logistics (Feq. = 39, = 39, TSL = 323). These
keywords
TSL = 323). play
Thesea critical
keywords role play
in forming
a criticalG&SL
role research
in formingtopics andresearch
G&SL connecting major
topics andbranches
connecting of
knowledge. According to the metric of average citations, the following
major branches of knowledge. According to the metric of average citations, the following keywords, keywords, including
transportation,
including environmental
transportation, sustainability,
environmental production,production,
sustainability, reverse logistics,
reverseand efficiency,
logistics, andaroused a
efficiency,
lot of attention.
aroused a lot of attention.Int. J. Environ. Res. Public Health 2020, 17, 261 13 of 25
Table 4. Summaries of significant keywords and theme clusters of G&SL research.
Ave. Ave. Norm.
Cluster ID Keywords Occurrence TLS Time Span
Citation Citation
Sustainability 80 547 13.9 1.2 2007–2019
Management 58 411 16.6 0.9 2001–2019
Impact 41 312 18.4 1.1 2008–2019
Logistics 46 299 19.1 1.1 2003–2019
Cluster #1 Systems 37 260 19.3 1.2 2004–2019
(purple) Case study 14 108 29.6 1.1 2008–2019
Size = 335 Efficiency 14 108 32.7 1.3 2013–2019
China 12 88 27.9 0.8 2011–2019
Intermodal
12 88 5.2 0.6 2017–2019
transportation
Collaboration 11 73 12.7 0.8 2013–2019
Stakeholder 10 71 8.2 1.2 2017–2019
Freight transportation 38 223 15.3 1.1 1999–2019
Carbon emission 31 197 13.8 1.1 2007–2019
City logistics 29 118 12.7 1.1 2010–2019
Cluster #2 Policies 14 94 24.5 1.1 2005–2019
(green) Costs 13 92 11.7 0.7 2008–2019
Size = 169 Energy consumption 13 72 8.7 0.7 2009–2019
Electric vehicles 11 74 16 1.4 2015–2019
Lifecycle assessment 10 68 22.2 1.6 2017–2019
Modal shift 10 54 6.6 0.8 2017–2019
Model 55 394 24.2 1.2 2004–2019
Reverse logistics 39 323 35.7 1.4 2004–2019
Transportation planning 17 125 6.1 1.4 2015–2019
Decision-making 16 132 19.5 1.6 2009–2019
Cluster #3
Optimization 16 122 24.9 1.1 2012–2019
(red)
Closed-loop logistics 12 118 14 1.2 2011–2019
Size = 202
Network design 12 94 27.1 0.9 2011–2019
Production 12 75 37.5 0.7 2005–2019
Transportation 12 106 52.1 1.8 2008–2019
Vehicle routing problem 11 74 31.1 1.5 2023–2019
Green supply chain 68 629 23.4 1.1 2005–2019
Green logistics 48 325 21.9 0.9 2008–2019
Performance 47 367 17.7 0.9 2011–2019
Framework 43 356 18.9 1.1 2007–2019
Industry 29 260 20.4 1.1 2009–2019
Third-party logistics
27 206 11.5 1.5 2013–2019
Cluster #4 service providers (3pl)
(blue) Environmental
26 189 42 1.5 2003–2019
Size = 422 sustainability
Sustainable
26 191 15.6 1.1 2010–2019
development
Environment 24 21 15.7 0.7 2009–2019
Strategy 20 139 23.1 1.3 2004–2019
Operations 17 137 12.6 0.8 2011–2019
Urban 13 65 8.1 1.2 2015–2019
Environmental
12 93 27.5 1.3 2012–2019
performance
Competitive advantage 11 88 30.5 1.3 2011–2019
Social responsibility 11 106 26.3 1.6 2013–2019
Keyword co-occurrence network is a static expression of a particular area that does not take into
account changes over time in the manner that the terms are used [54]. Figure 9 shows a time zone view
of keywords that occur more than eight from 1999 to 2019. Each term is arranged in chronological orderInt. J. Environ. Res. Public Health 2020, 17, x FOR PEER REVIEW 14 of 25
Keyword
Int. J. Environ. Res. co-occurrence
Public Health 2020,network
17, 261 is a static expression of a particular area that does not take into
14 of 25
account changes over time in the manner that the terms are used [54]. Figure 9 shows a time zone
view of keywords that occur more than eight from 1999 to 2019. Each term is arranged in
to present the trend
chronological and
order to interaction
present of keywords.
the trend Studies
and interaction on management,
of keywords. Studiesmodel and green supply
on management, model
chains had been published extensively before 2005 and had been going for a long
and green supply chains had been published extensively before 2005 and had been going for a longtime, showing that
these
time, early topics
showing arethese
that still the hotspots
early topicsof current
are research.
still the In contrast,
hotspots of currentarticles related
research. to collaboration,
In contrast, articles
transportation planning, modal shift and stakeholder were published from 2015
related to collaboration, transportation planning, modal shift and stakeholder were published to 2017, whichfrom
are
emerging themes discussed frequently in recent years and may become the hotspots
2015 to 2017, which are emerging themes discussed frequently in recent years and may become the of future research.
Additionally, a large
hotspots of future proportion
research. of the keywords
Additionally, were proposed
a large proportion of thebetween
keywords 2007 and
were 2015, indicating
proposed between
that
2007 and 2015, indicating that G&SL research was greatly enriched during this time
G&SL research was greatly enriched during this period. Table 4 presents the span
period. of all4
Table
highlighted
presents thekeywords.
time span of all highlighted keywords.
Figure 9.
Figure 9. A
A time
time zone
zone view
view of
of clustered
clustered research
research themes:
themes: 1999-2019.
1999-2019.
4.
4. Discussion
4.1.
4.1. Knowledge
Knowledge Taxonomy
Taxonomy of
of Current
Current Research
Research
Through
Throughthe theaforementioned
aforementioned analysis, the research
analysis, progress,
the research evolutionary
progress, trend, and
evolutionary hot-discussed
trend, and hot-
topics of global G&SL are clarified. However, the generic scientometric results cannot
discussed topics of global G&SL are clarified. However, the generic scientometric results cannot accurately reflect
the explicit reflect
accurately divisiontheofexplicit
the multifarious
division ofknowledge of a domain
the multifarious [31]. Based
knowledge on the clustering
of a domain [31]. Based analysis
on the
of high-frequency keywords, a comprehensive taxonomy of G&SL knowledge
clustering analysis of high-frequency keywords, a comprehensive taxonomy of G&SL knowledge from 1999 to 2019 was
further proposed, and each separated branch was thematically discussed in-depth
from 1999 to 2019 was further proposed, and each separated branch was thematically discussed in- subsequently. Topics
with
depthsimilar attributes
subsequently. were with
Topics integrated
similarinto different
attributes categories
were of themes
integrated and manually
into different categoriesrenamed
of themesto
make the taxonomy more compact and easy to understand. Figure 10 demonstrates
and manually renamed to make the taxonomy more compact and easy to understand. Figure 10 the mind mapping
of G&SL research
demonstrates themes,
the mind whereofa G&SL
mapping total ofresearch
5 alignments
themes,and 50 sub-branches
where are assembled.
a total of 5 alignments The
and 50 sub-
number of representative articles of each theme was also attached.
branches are assembled. The number of representative articles of each theme was also attached.Int. J. Environ. Res. Public Health 2020, 17, 261 15 of 25
Int. J. Environ. Res. Public Health 2020, 17, x FOR PEER REVIEW 15 of 25
Figure10.
Figure 10.The
The knowledge
knowledge taxonomy
taxonomy of
of G&SL
G&SLthemes.
themes.
4.1.1.
4.1.1. Evaluationon
Evaluation onthe
theSocial,
Social,Environmental
Environmental and
and Economic
Economic Impacts
Impactsof
ofG&SL
G&SLInitiatives
Initiatives
Nearlya aquarter
Nearly quarterofofthe theliterature
literature(71(71 out
out of
of 306
306 papers)
papers) focused
focused on onevaluating
evaluatingand andquantifying
quantifying
how the potential green logistics initiatives improve the “triple bottom
how the potential green logistics initiatives improve the “triple bottom line” (i.e., social, environmental line” (i.e., social,
environmental and economic performance, SEE) of existing freight
and economic performance, SEE) of existing freight activities. The subjects of these studies activities. The subjects of these
were
studies originated
basically were basically from originated
four aspects: from four emission,
carbon aspects: carbonenergyemission,
consumption, energy consumption,
social sustainability, social
and
sustainability, and external cost-and-benefit. Mattila and Antikainen
external cost-and-benefit. Mattila and Antikainen [15] provided a backcasting method for the long-term [15] provided a backcasting
method for
prediction the long-termgas
of greenhouse prediction
emissions of greenhouse
and fossil fuel gasconsumption
emissions andinfossil fuel consumption
long-distance in long-
freight transport,
considering the sustainable goals and policies developed by the EU governments. Similarthe
distance freight transport, considering the sustainable goals and policies developed by EU
research
governments. Similar research was conducted for assessing the U.S. scenario [46]. A questionnaire
was conducted for assessing the U.S. scenario [46]. A questionnaire survey conducted by Makan and
survey conducted by Makan and Heyns [55] found that the pressures from consumer, brand
Heyns [55] found that the pressures from consumer, brand protection, top management, and cost-saving
protection, top management, and cost-saving and revenue are the major drivers for freight
and revenue are the major drivers for freight organizations to implement the sustainable initiatives.
organizations to implement the sustainable initiatives. Khan et al. [56] modeled the impact of G&SL
Khan et al. [56] modeled the impact of G&SL performance on the countries’ economic development
performance on the countries’ economic development and macro-level social and environmental
and macro-level social and environmental indicators. Papoutsis et al. [57] and Solomon et al. [58]
indicators. Papoutsis et al. [57] and Solomon et al. [58] both maintained that logistics sustainability is
both maintained
closely related tothat logisticsefficiency
operational sustainability is closely
and social related
acceptance to operational
from an economicefficiency and social
and environmental
acceptance
perspective. Through the expert scoring, Morana and Gonzalez-Feliu [59] identified theMorana
from an economic and environmental perspective. Through the expert scoring, most
and Gonzalez-Feliu [59] identified the most prominent factors affecting
prominent factors affecting the sustainability of urban logistics are monetary saving, services quality,the sustainability of urban
logistics are monetary saving, services quality, and customers’ satisfaction
and customers’ satisfaction rate (economic), pollution emissions and congestions (environmental), rate (economic), pollution
emissions and congestions
and the number of employment (environmental),
created/destroyed and (social).
the number Socialof andemployment
environmental created/destroyed
activities play
(social).
a moreSocial
importantand environmental
role in promoting activities play alogistics
sustainable more important role in promoting
than financial-economic sustainable
activities [60].
logistics
Rashidithanand financial-economic
Cullinane [61] found activities
that the [60]. Rashidi
national and industry
logistics Cullinane [61]high
with found SEEthat thehas
index national
the
logistics industry with high SEE index has the following features: (i) well-planned
following features: (i) well-planned logistics network infrastructure; (ii) high quality of service logistics network
infrastructure;
operators; (iii) (ii)shipments
high quality of service
tracing operators;
technology; (iii) efficient
and (iv) shipments tracingscheduling.
timetable technology; and (iv) efficient
timetableAnother part of emphasis was given to SEE performance of G&SL based on logistics operations
scheduling.
andAnother
business. Guo
part ofand Ma [62]was
emphasis evaluated
given to theSEE
energy consumption
performance and emission
of G&SL based on level underoperations
logistics different
andlogistics
business.business
Guo and modes, Ma concluding
[62] evaluated thatthethe energy
third-party logistics provider
consumption and emission and the joint
level distribution
under different
modes business
logistics have obvious modes, environmental
concluding advantages in developing
that the third-party green
logistics urban distribution.
provider and the jointWang et al.
distribution
[63] found that green logistics performance would impose positive effects
modes have obvious environmental advantages in developing green urban distribution. Wang et al. [63] to the exporting countries
in thethat
found international
green logistics trade.performance
Herold and would Lee [64]impose
investigated
positivetheeffects
carbontoreports disclosedcountries
the exporting by somein
thegiant international
international logistics
trade. Heroldenterprises,
and Lee [64]e.g., investigated
UPS, FedX and theDHL,
carbonandreports
compared their sustainability-
disclosed by some giantYou can also read