Review of Recharge Mechanisms for the Great Artesian Basin
←
→
Page content transcription
If your browser does not render page correctly, please read the page content below
Review of Recharge Mechanisms for the
Great Artesian Basin
Andrew L. Herczeg and Andrew J Love
November 2007

Report to the Great Artesian Basin Coordinating Committee
under the auspices of a Consultancy Agreement:
Commonwealth Dept of Environment and Water Resources,
Canberra

Commercial-in-confidence (delete if not required)
Enquiries should be addressed to:

Andrew L. Herczeg

CSIRO Land and Water

Private Bag 2,

Glen Osmond SA 5064

+61 88303 8722

Andrew.Herczeg@csiro.au

Copyright and Disclaimer

© 2007 CSIRO To the extent permitted by law, all rights are reserved and no part of this publication
covered by copyright may be reproduced or copied in any form or by any means except with the
written permission of CSIRO.

Important Disclaimer

CSIRO advises that the information contained in this publication comprises general statements based
on scientific research. The reader is advised and needs to be aware that such information may be
incomplete or unable to be used in any specific situation. No reliance or actions must therefore be
made on that information without seeking prior expert professional, scientific and technical advice. To
the extent permitted by law, CSIRO (including its employees and consultants) excludes all liability to
any person for any consequences, including but not limited to all losses, damages, costs, expenses and
any other compensation, arising directly or indirectly from using this publication (in part or in whole)
and any information or material contained in it.

Cover Photograph:

From CSIRO Land and Water Image Gallery: www.clw.csiro.au/ImageGallery/File:
ASA_STRZ002_011.jpg.
Description: Sunrise on wildflowers in the sand dunes of the Strzelecki Desert near Montecollina, SA.
2004.Photographer: Greg Rinder
© 2006 CSIRO

Water for a Healthy Country report series
ISSN: 1835-095X

                                                   2
CONTENTS

EXECUTIVE SUMMARY............................................................................................ 6

1.     INTRODUCTION................................................................................................ 8

       1.1       Scope ..................................................................................................... 8

       1.2       Objectives.............................................................................................. 8

       1.3       Recharge and sustainable yield .......................................................... 9

2.     SITE CHARACTERISTICS .............................................................................. 12

       2.1       Western margin................................................................................... 12

       2.2       Coonamble Embayment ..................................................................... 17

3.     LITERATURE REVIEW OF RECHARGE MECHANISMS .............................. 21

       3.1       Overview .............................................................................................. 21

       3.2       Comparison of Recharge Techniques .............................................. 22

       3.3       Surface Water Techniques ................................................................. 24

       3.4       Unsaturated zone................................................................................ 26

       3.5       Saturated Zone Techniques ............................................................... 30

       3.6       Groundwater Age of the Great Artesian Basin waters .................... 35

4.     REVIEW OF EXISTING RECHARGE STUDIES IN THE GAB........................ 37

       4.1. Western Margin (SA & NT)...................................................................... 37

       4.2. Coonamble Embayment (NSW).............................................................. 37

5. RECHARGE MECHANISMS IN THE WESTERN GAB AND COONAMBLE
EMBAYMENT .......................................................................................................... 40

       5.1 Conceptual models of recharge.............................................................. 40

                                                             3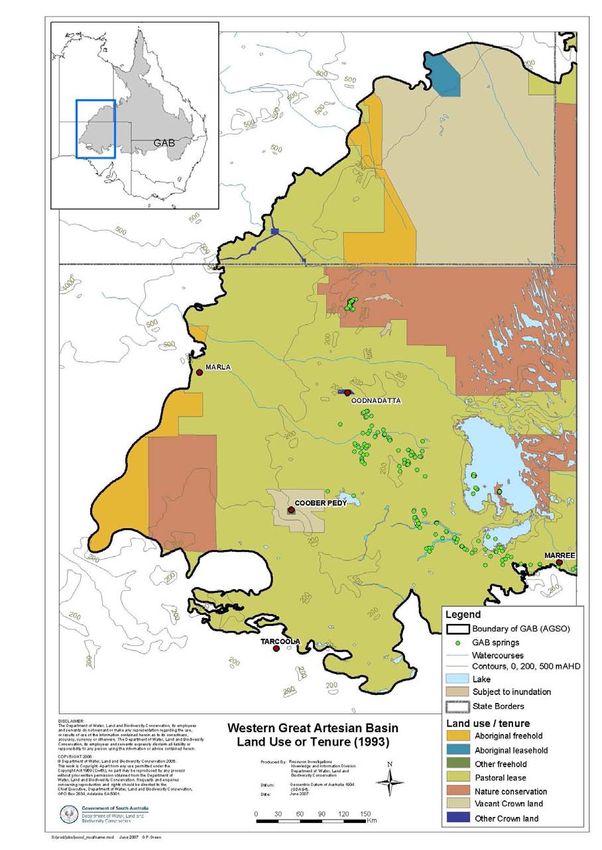
5.2       Diffuse recharge.................................................................................. 41

       5.3        Localized Recharge. .......................................................................... 41

       5.4        Mountain Block Recharge. ................................................................ 42

       5.5        Modern and Palaeo-Recharge in the GAB ....................................... 43

       5.6        Model Recharge rates in the Great Artesian Basin......................... 45

6. EVALUATION OF APPROPRIATE TECHNIQUES TO ESTIMATE RECHARGE
IN THE GAB............................................................................................................. 47

7.     PROPOSALS FOR ESTIMATING RECHARGE.............................................. 53

       7.1       Desktop study ..................................................................................... 53

       7.2       Well survey .......................................................................................... 54

       7.3       Transects in the unconfined part of the GAB................................... 54

       7.4  Unsaturated zone profiles of soil water properties and chloride
       mass balance.................................................................................................. 55

       7.5       Estimation of direct and localised recharge..................................... 56

8.     REFERENCES AND BIBLIOGRAPHY ........................................................... 57

                                                            4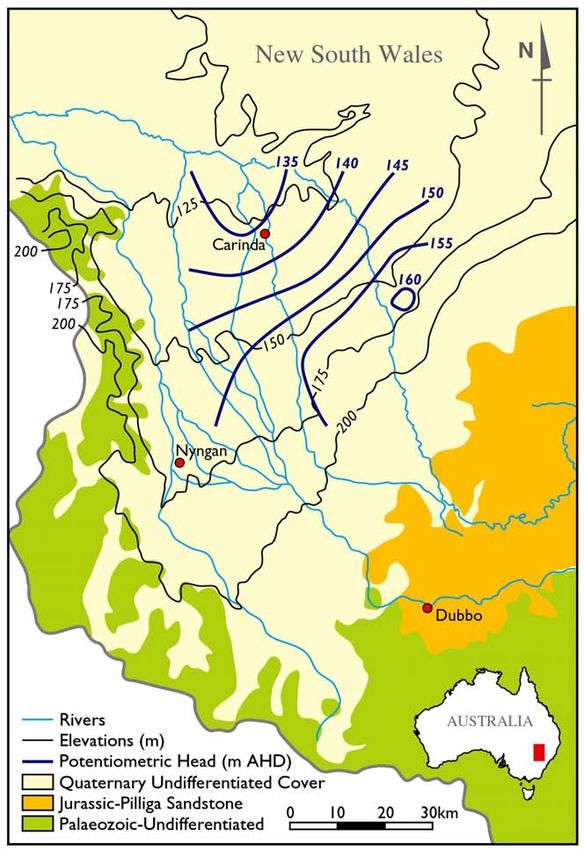
LIST OF FIGURES
Figure 1. Delineation of the project areas considered as part of this review. Also shown are the recharge areas of
the Great Artesian Basin not investigated in this review (see Kellett, et al., 2003). ................................................. 9

Figure 2. Topography, aquifer outcrop and extent of the artesian region and unconfined/confined boundary for the
western margin of the GAB. No data for NT portion for this map........................................................................... 13

Figure 3. Location map of the south west margin of the Great Artesian Basin, showing location of sampling wells
along the northern and southern transect as well as the potentiometric contours (denoted as AHD – Australian
Height Datum). The dashed line representing the unconfined/confined boundary indicate where the standing
water level in the aquifer is below the overlying Bulldog Shale (i.e, unconfined west of the boundary) or above the
Shale (east of the boundary). ................................................................................................................................ 14

Figure 5. Land use and tenure for the western margin of the GAB........................................................................ 16

Figure 6. Map showing the inferred recharge zone within the Coonamble Embayment (after DWR as cited in
Brownbill, 2000)..................................................................................................................................................... 18

Figure 7. Map showing the geological formations, topography and present day potentiometric head of the Pilliga
sandstone within the Coonamble Embayment (after Wolfgang, 2000) .................................................................. 19

Figure 8. Shaded areas show the extent of flowing bores in the NSW portion of the GAB in 1920 and 1995. ..... 20

Figure 9. Stable isotope data plot for an arid region of Australia (Ti-Tree basin, NT) showing the relationship
between amount of rainfall and isotopic composition. The extrapolated groundwater trend shows that recharge
occurs predominantly from high rainfall events, indicative of monsoonal systems. ............................................... 26

Figure 10. Schematic diagram, showing the hydrological balance for the conceptual, one-dimensional recharge
system for using the chloride mass balance technique. ........................................................................................ 28

Figure 11. Schematic diagram showing different soil water chloride profiles under conditions of a fresh water table
(a); saline water table (b) and diffusion to a very deep fresh water table (c) (after Phllips, 2000........................... 29

Figure 12. Cumulative soil water profiles for different land elements showing changes in recharge rates where
there is a break in slope (after Leaney et al., 1999)............................................................................................... 29

Figure 13. ............................................................................................................................................................. 32

A list of various groundwater dating methods and the approximate time intervals for which they are valid........... 32

Figure 14. Conceptual flow paths under two recharge scenarios (a) constant recharge over the entire landscape
and (b) preferential recharge over an unconfined aquifer becoming confined down-gradient. .............................. 33

Figure. 15. Flood map showing boundaries of a major flood in the Macquarie and Castlereagh catchments (after
DWR, 1991)........................................................................................................................................................... 38

Figure 16. Diagrammatic representation of recharge process in the Great Artesian Basin (reproduced from Radke
et al., 2000)............................................................................................................................................................ 40

Figure 17 Conceptual diagram showing mountain block recharge which is a likely mechanism within the GAB,
particularly the Coonamble zone. .......................................................................................................................... 43

Figure 18. Stable isotope data for the western flow systems (data from Love etal., 200; Zhang et al., 2007) and
Coonamble Embayment (data from Radke et al., 2000)........................................................................................ 45

LIST OF TABLES
Table 1. Summary of different techniques to estimate recharge. Data complied from review of existing literature as
well as author’s knowledge - Note much of the data in this table comes from detailed reviews found in Scanlon
and Cook (2004). Note Recharge rates in mm/yr, - Spatial scales in m2 and temporal scale in years unless
otherwise specified in the table.............................................................................................................................. 49

                                                                                     5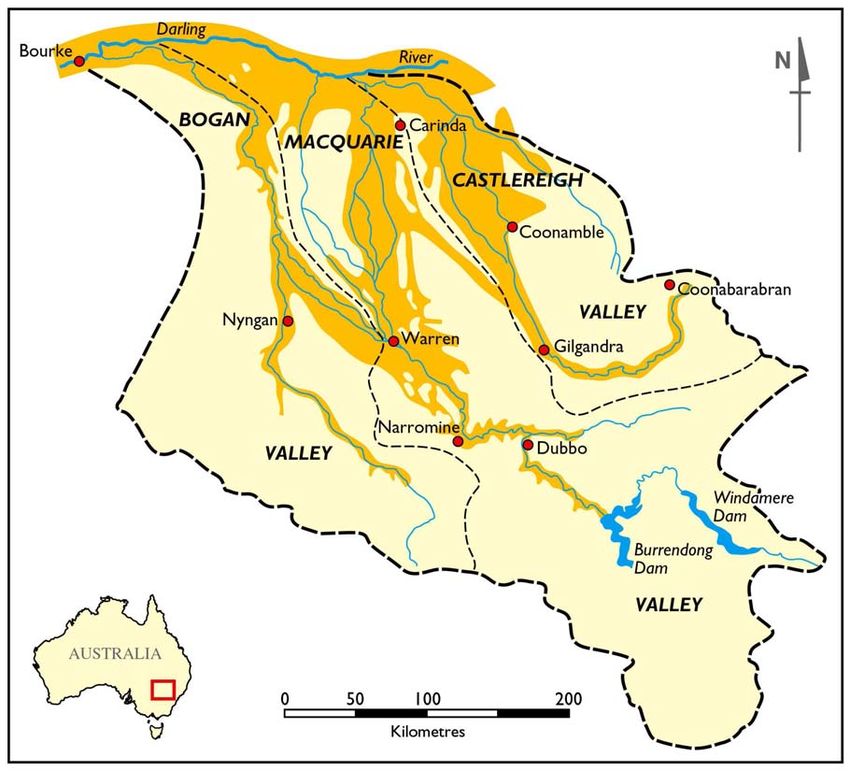
EXECUTIVE SUMMARY

Scope and objectives

The Great Artesian Basin (GAB) covers about one-fifth of the Australian continent and contains about
8.7 x 10⁶ GL of groundwater in the Jurassic sandstone aquifers. Although there is widespread use of
many thousands of artesian bores throughout the GAB, relatively little is known of the water balance,
particularly recharge.

The review is provided within the context of a very large aquifer system where recharge rates have
varied considerably over the time scale of development of the aquifer system. The large reservoir of
fresh groundwater has developed during much wetter climatic conditions in the past that those
prevailing over the last 10 000 years or more. There is no consensus that the water balance of the GAB
is currently ‘in balance’ – that is that recharge rates equal total of discharge via natural discharge and
pumping or exploitation of artesian wells.

The objectives of this review commissioned by the Commonwealth Dept. of Environment and Water
Resources on behalf of the Great Artesian Basin Coordinating Committee are:

1.    To provide a literature review of methods to estimate recharge

2.    To develop conceptual models for the recharge mechanisms of the GAB and advise on
      appropriate methodologies for the quantification of recharge in the GAB

3.    Develop costed recharge investigation projects in the Coonamble Embayment NSW and the
      western GAB in SA and NT.

Review of methods to estimate recharge

The various methods for recharge estimation that are relevant to semi-arid and arid regions are
described. These include water balance methods, piezometric methods, unsaturated zone and saturated
zone environmental tracers. The most commonly used methods to estimate diffuse recharge in semi-
arid regions is using chloride profiles in the unsaturated zone. The technique is most accurate when
surface runoff is low, and where estimates of long-term chloride deposition from atmospheric aerosols
are available. Methods to estimates of recharge from direct or localized recharge rates rely of both
unsaturated zone and saturated zone water balance and tracer methods and yield recharge rates that are
one to two orders of magnitude greater than the diffuse recharge estimates.

Previous studies in the GAB

A major recharge study was undertaken in the Queensland intake beds of the GAB (Kellett et al.,
2003) where 14 unsaturated zone profiles were collected. Recharge estimates from that study indicated

                                                    6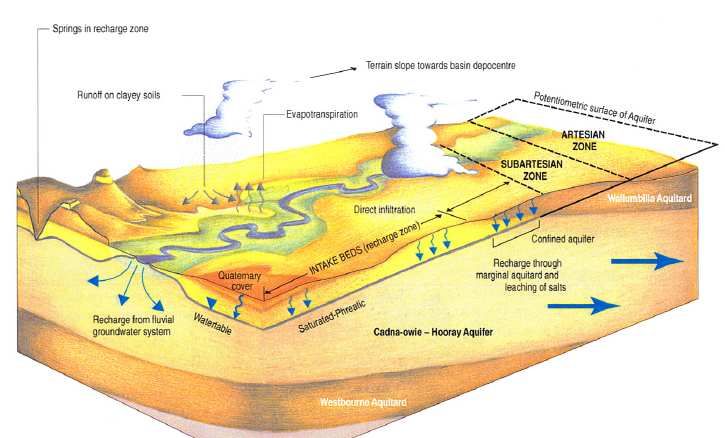
diffuse recharge rates of 0.03 – 2.4 mm yr-1 and preferred pathway recharge of 0.5 – 28.2 mm yr-1.

Western margin (incorporating SA and NT)

The western margin is in the driest portion of the GAB and has relatively low hydraulic gradients. This
region has little development and has predominantly pastoral leases. Saltbush and blue bush with
patchy acacia are the dominant land cover. There have been no specific recharge studies done in this
area. However, estimates based on chloride mass balance in the unconfined aquifers in the SA portion
of the western GAB suggest recharge rates of 0.16 ± 0.08 mm yr-1 (Love et al., 2000).

Coonamble Embayment, NSW

The Coonamble embayment is thought to be an isolated part of the GAB, with discharge and recharge
occurring within the Embayment and little if any connection to the remainder of the GAB outside of
NSW. There have been widely disparate estimates of the water balance of the Pilliga Sandstone
aquifer system, with estimates of recharge ranging over nearly two orders of magnitude. The most
recent compilation and assessment given by Wolfgang (2000) is based predominantly on chloride
mass balance estimates and an approximate area of the recharge zone and provides and estimate of
recharge of 970 ML yr-1 (median ~6mm yr-1).

Recharge mechanisms in the GAB

Recharge mechanisms are generally a combination of widespread diffuse (or local) recharge and direct
(or localised) recharge. Recharge is though to occur via direct infiltration to the soil into the
outcropping regions of the Jurassic (J-) aquifers, downward hydraulic movement through aquifers
above the J-aquifer where the hydraulic conditions permit, direct recharge through ephemeral creeks
and rivers, and recharge on mountain block alluvial fan systems, particularly within the Coonamble
Embayment. The relative importance of the different recharge mechanisms will vary from place to
place and given the very long residence time of groundwater within the GAB.

Costed Recharge proposals

A series of recharge investigation proposals are presented in a hierarchical manner. These are as
follows: a) desktop study evaluation and analysis of existing information ($65 000) b) sampling of
existing artesian bores and new nested bores located near to proposed localised recharge sites ($350
000 - $600 000) c) detailed unsaturated soil profiles and measurement of environmental tracers ($850
000). In additional to these site specific studies, there would need to be parallel studies that can scale
up the point estimates (using remote sensing and GIS methods) as well as hydrological modelling.

                                                     7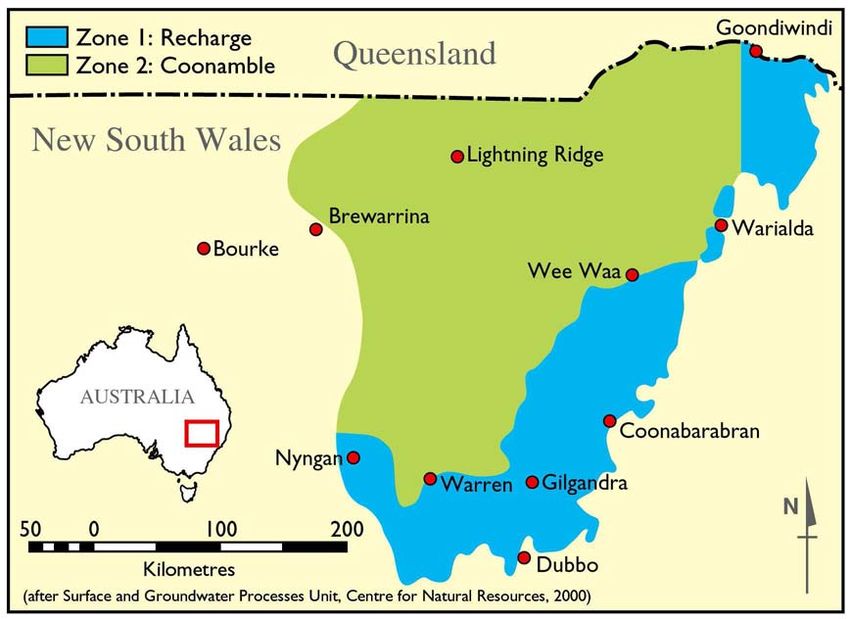
1.      INTRODUCTION

1.1     Scope

Increasing demands on the limited availability of global water supplies has resulted in a dramatic
increase in the amount of studies focused on estimating groundwater recharge (eg., Gee and Hillel,
1988; Allison et al, 1994; Scanlon et al, 2006), particularly in semi-arid and arid zones. This is largely
because surface water resources are scarce and unpredictable in dry areas and groundwater often
provides the only reliable source of water for consumptive use. In many semi-arid to arid zone aquifer
systems around the world the groundwater is very old and may have been recharged under a different
climate than that of the present. As a result these systems contain “fossil” water and groundwater
exploitation may not be indefinitely sustainable under the current recharge regime.

Whilst there have been some investigations to estimate recharge in the Great Artesian Basin (Radke et
al., 2000; Kellett et al., 2003), there is relatively little information about recharge to the western
margin (Love et al., 2000) nor the NSW portion of the Basin (Wolfgang, 2000; Brownbill, 2000).
Increased demands on the GAB resources through mining and irrigation, and the need to sustain the
enterprises that depend on the water as well as protect groundwater dependent ecosystems, means that
a better estimate of recharge is seen as an important component of sustainable water allocation and use
within the GAB as a whole. This is clearly the situation in the western margin of the GAB where
groundwater recharge is estimated to be at least three times greater in the Pleistocene compared to
today (Love at al., 2000). This is also implicitly true for groundwater in the majority of the Coonamble
Embayment in NSW.

The project area for this review, as shown in Figure 1, is the western margin of the Great Artesian
Basin, stretching from near Woomera in South Australia, north, then north-east across the south-east
of the Northern Territory and into south-western Queensland and the Coonamble Embayment within
the NSW portion of the GAB. The recharge zones are those areas where the GAB aquifer either
outcrops or where overlying aquifers have higher head than the main GAB aquifer.

The report is organised according to the activities that are outlined in the project brief. Namely:

1.    Literature review of recharge approaches and those studies carried out in the GAB to date;

2.    Presentation of appropriate methods for quantification of recharge;

3.    Costed proposal for priority recharge sites in NSW and the western GAB;

4.    Report on the above activities.

1.2     Objectives

The objectives of this review as defined in the project brief are:
1.    To provide conceptual models for the recharge mechanisms of the GAB;

                                                     8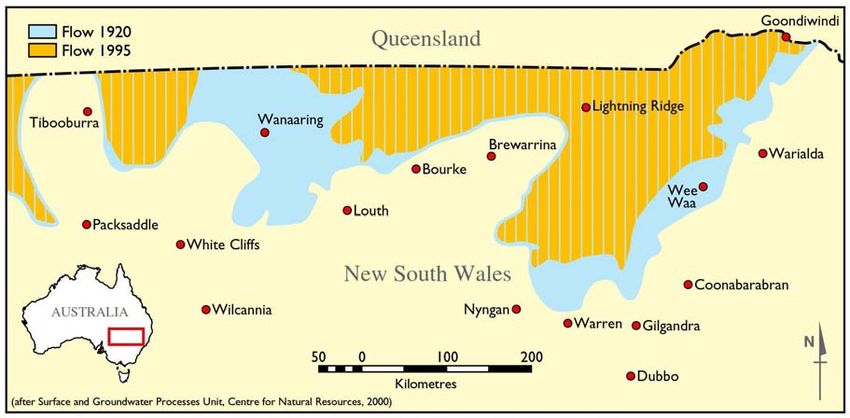
2. Advise on appropriate methodologies for the quantification of recharge;
3. Develop costed recharge investigation projects in NSW and the western GAB.
HUGHENDEN
Legend MACKAY
Great Artesian Basin
Recharge Areas
WINTON
Project Areas
BOULIA
LONGREACH
BARCALDINE ROCKHAMPTON
EMERALD
ALICE SPRINGS
GLADSTONE
BLACKALL
BILOELA
MONTO
WINDORAH
BIRDSVILLE AUGATHELLA TAROOM
CHARLEVILLE
QUILPIE MITCHELL
ROMA
MILES
DALBY
OODNADATTA
INNAMINCKA
THARGOMINDAH
CUNNAMULLA
ST GEORGE
GOONDIWINDI
COOBER PEDY
LIGHTNING RIDGE
MARREE
MOREE
BOURKE
WHITE CLIFFS
WOOMERA
TAMWORTH
WILCANNIA COBAR
NYNGAN
BROKEN HILL
CEDUNA
PORT AUGUSTA
DUBBO
IVANHOE Figure 1
Figure 1. Delineation of the project areas considered as part of this review. Also shown are the recharge areas of
the Great Artesian Basin not investigated in this review (see Kellett, et al., 2003).
1.3 Recharge and sustainable yield
Estimates of recharge rates are arguably the most difficult component of the water budget to quantify
(Scanlon 2004; Scanlon et al., 2006). This is even more so in semi-arid and arid environments where
one is often dealing with low water fluxes that vary considerable over both spatial and temporal scales.
Estimation of recharge rates and identification of the important recharge mechanisms are important for
a number of reasons. These include the following:
1. Recharge rates are often used as a benchmark for determining groundwater allocation volumes,
where the amount of water extracted is determined from a percentage of modern day recharge.
Whilst it is recognised that this policy is flawed, the concept of “safe-yield” determined from
recharge rate alone perpetuates in practice.
2. Following on from the above, there is a need to balance the demands of groundwater pumping
whilst maintaining groundwater dependent ecosystems (such as the GAB mound springs) and
therefore understanding all components of the water balance is required.
9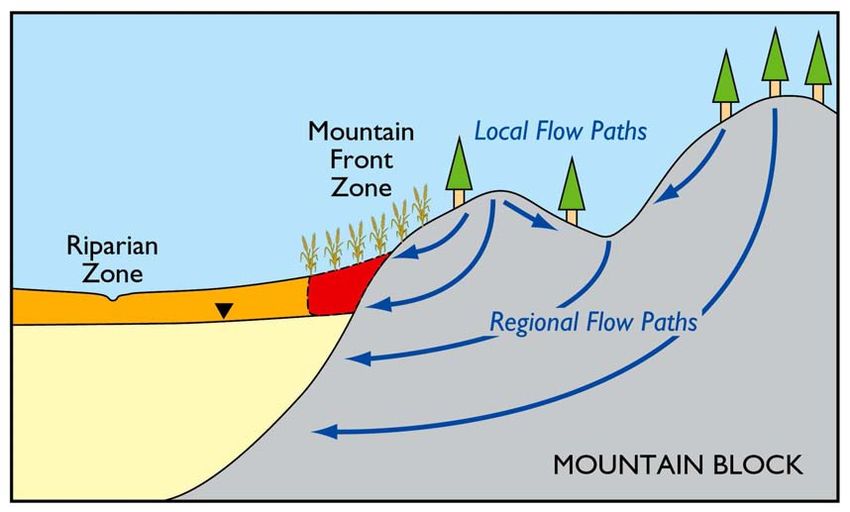
3.       Recharge rates are a critical input to numerical groundwater models that are used for developing
         groundwater management policies in both time and space.

Just as important as estimating recharge is the need to predict the impact that groundwater extraction
may have on declining pressures and consequent reduced discharge to GAB Mound Springs. This
requires:

     •   Knowledge of magnitude, location and timing of groundwater extraction;

     •   Measurements of the magnitude and location of natural recharge;

     •   Measurement of the magnitude and location of natural discharge from the aquifer;

     •   Determination of the degree to which each natural discharge will be reduced when the system
         reaches a new balance, and the timescale over which this will occur.

Very large groundwater resources have usually evolved over thousands to hundreds of thousands of
years. Current recharge rates may be much less than in the past, and the water storage within the
aquifer may be a legacy from higher recharge rates that were prevalent during much wetter periods
many tens to hundreds of thousands of years ago. Discharge, on the other hand, is driven by head
gradients, aquifer properties and their configuration that determine flow rates. The change in discharge
rate will rarely be in concert with recharge due to the lag time (especially in the GAB) because of very
large distance and complex flow systems that propagate changes in rainfall to recharge and then
through the aquifer.

Exploitation of such resources will invariably alter the balance between recharge and discharge, by
adding a discharge term and altering the head gradient. By definition, therefore, pumping or
intercepting water and discharging by artesian pressure has no relationship to current recharge rates in
terms of maintaining a desired water level or pressure in any given point. This can be explicitly
defined by the water balance expression:

Volume = recharge – discharge = 0 at steady-state

or

∆Volume = recharge – (discharge + pumping) > 0

It is self evident that there will be a consequent reduction in storage, but the rate of decline will
decrease over time. Further, if exploitation is greater than the recharge rate, then eventually the water
will be entirely depleted.

The real limitation, however, will be ingress of poorer quality water from aquitards or other adjacent
aquifers, or a drop in water pressure/level until the cost of pumping is prohibitive. In the case of the
GAB, the amount of water removed annually is a small fraction of total storage.

The total volume of water in the GAB is listed in the GABCC website (see references) as:

                                                    10
Total volume = 64 900 million ML (mega litres) or 6.5 x 10¹³ m3. Although the uncertainty is not
given, one would expect this number to have an error range of at least 1.5 x 10¹³ m3.
Estimated annual recharge in the Queensland intake beds of the GAB to the Hutton and Hooray
sandstone aquifers is estimated to be 3.8 x 10⁸ m3 yr-1, (Kellett et al., 2003). The amount of recharge to
the Cadna-owie formation is perhaps an additional 5-10% of this number [ibid]..
Total discharge is estimated as 9 ± 1.5 x 10⁸ m3 yr-1, divided equally between natural discharge, by
springs and vertical leakage (4.5 ± 1 x 10⁸ m3 yr-1) and bore discharge (4.5 ± 0.5 x 10⁸ m3 yr-1)(Kellett
et al., 2003). Of the natural discharge, vertical leakage probably accounts for 90% of losses through
upward leakage to phreatic aquifers. Under ‘natural’ conditions, the ratio of storage to total discharge
(6.5 x 10¹³ m3 divided by the natural annual discharge of 4.5 x 10⁸ m3 yr-1) yields a water residence
time of about 1.44 x 10⁵ years for the entire GAB. Similarly, if we assume that bore discharge is about
the same as natural discharge, the ratio of storage to total discharge (6.5 x 10¹³ m3 divided by the
annual discharge of 9 x 10⁸ m3 yr-1) yields a residence time of about 7.22 x 10⁴ years.
Even if the main pressurized J-K aquifers store 10% of the total water, and they are about 150 million
years old, then at least one thousand pore volumes of water have passed though the basin since
deposition of the basin. The fraction of bore discharge divided by the total storage volume = 7 x 10⁻⁶
which means that about 0.0007 percent of the total storage is exploited every year. While this is a very
small fraction of the total resources, the confined nature of the aquifer results in considerable pressure
head decline. Indeed, of 4900 bores that have been installed since the 1860s, about 25% have ceased to
flow (i.e., are now sub-artesian).
The most obvious surface manifestations of GAB artesian water are the more than 600 spring
complexes that are scattered through the Basin (GABCC, 1998). These support a unique flora and
fauna in an otherwise arid landscape. Some of the most notable and unique of these are the so-called
mound springs in the SA portion of the GAB which extend along a SE-NW transect from the edges of
Lake Frome, near Innaminka, to the remarkable Dalhousie Springs, which account for about 40% of
all SA spring flow near Oodnadatta. It is estimated that the springs have decreased in flow by about
30% since development of the basin and some have dried out completely. In the Coonamble
Embayment in NSW, there has been up to a 50 metre pressure head decline (Brownbill, 2000).
If the maintenance of current or natural spring flows is desired, then the bore discharge rates up-
gradient of these systems need to be reduced, or eliminated, to restore pressure heads. The lag times in
transfer of water pressure through such a large system will be important in managing the resource
from the point of view of these fragile dependent ecosystems.
About 90% of the natural GAB discharge is thought to occur by diffuse upward leakage through the
overlying water tables, and ultimately by evaporation though the soil (GABCC, 1998). The rates of
upward leakage estimated for a portion of the basin in the southern part of Lake Eyre are 3 ± 1 mm yr-1
(Woods, 1990). The interaction between the upward movement of GAB artesian water, and the
overlying aquitards, aquifers and surface water systems are not well known. There are numerous
ephemeral and perennial streams, rivers and water holes throughout the surface water catchment (e.g.
Lake Eyre Basin in SA). The extent to which the GAB leakage is connected to these is not well
known.
112. SITE CHARACTERISTICS
2.1 Western margin
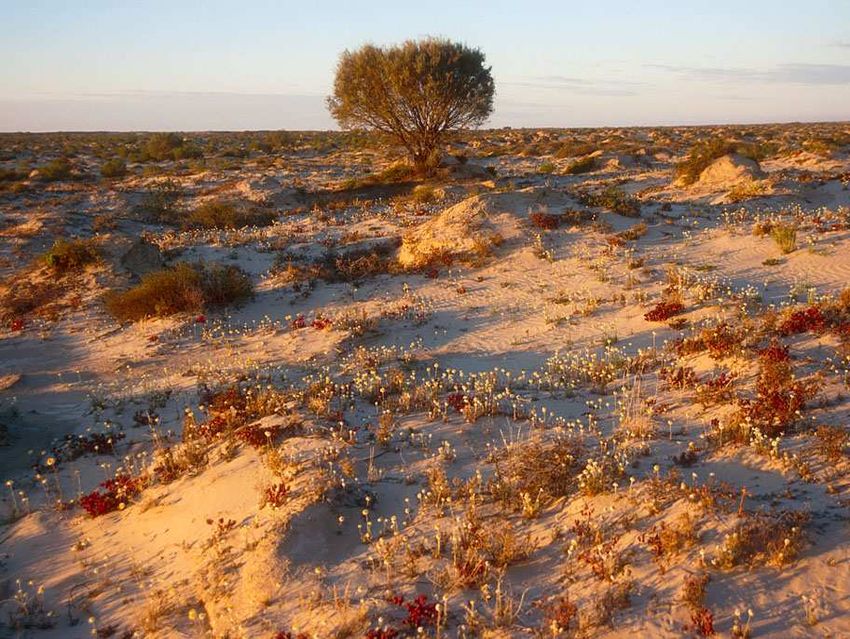
Mean annual rainfall in the western margin areas of the GAB is between 170 –220 mm/yr with mean
relative humidity around 40% in the SA portion. The region is relatively flat with gradual increase in
elevation towards the west (Fig. 2) with ephemeral surface drainage toward Lake Eyre to the east.
Also shown in Figure 2 are zones of aquifer outcrop as well as the extent of the artesian area and the
approximate unconfined/confined boundary.
Nomenclature of the main artesian aquifer along the western margin is yet to be resolved. The main
aquifers have been named as various units including the De Souza Sandstone, Algebuckina Formation,
Cadna-owie Formation and Hooray Sandstone. For the purpose of this review we name the main
artesian aquifer as the J-K as it contains units of both Jurassic and Cretaceous age.
The J-K aquifer comprises unconsolidated gravels, sands and silts and consolidated sandstones with
inter-bedded shales and mudstones (Habermehl, 1980; Habermehl & Lau, 1997). The aquifer ranges in
thickness from approximately 250m in SA up to 1,000m in the NT (Love at al., 2000, Matthews,
1997). Salinity of groundwater varies considerable from 550 mg/L in the Finke River region to >3,500
mg/L along the southwest margin (Radke et al 2000). The J-K aquifer outcrops in portions of the
northwest and southwest of the study area as well as adjacent to the Proterozoic inlier of the Peake and
Dennison Ranges in the central portion of the study area (Fig. 2).
12Figure 2. Topography, aquifer outcrop and extent of the artesian region and unconfined/confined boundary for the
western margin of the GAB. No data for NT portion for this map.
Overlying the J-K is the Bulldog Shale and its equivalent, the Rumbalara Shale, in the NT. These units
form a regional aquitard over much of the region and can reach a maximum thickness of 400 metres.
A cross section of the major units in the SA portion of the GAB is shown in a more detailed review of
the geology and hydrogeological units by Habermehl (1980) and references therein.
13The potentiometric surface (Fig. 3) indicates that the major direction of groundwater flow in the study
area is towards the south – east and east with hydraulic gradients ranging from 2 x 10⁻⁴ to 8 x 10⁻⁴. In
the western portion of the study area, the aquifer either outcrops, or is unconfined. Further east, the
aquifer is confined by the overlying Bulldog Shale and eventually becomes artesian. Minor discharge
from the system occurs via a series of springs to the south west of Lake Eyre. These springs are often
associated with faulting. The majority of discharge is by diffuse vertical leakage through the confining
bed at the down flow end of the system where the hydraulic gradient is favourable for upward leakage.
Figure 3. Location map of the south west margin of the Great Artesian Basin, showing location of sampling wells
along the northern and southern transect as well as the potentiometric contours (denoted as AHD – Australian
Height Datum). The dashed line representing the unconfined/confined boundary indicate where the standing
water level in the aquifer is below the overlying Bulldog Shale (i.e, unconfined west of the boundary) or above the
Shale (east of the boundary).
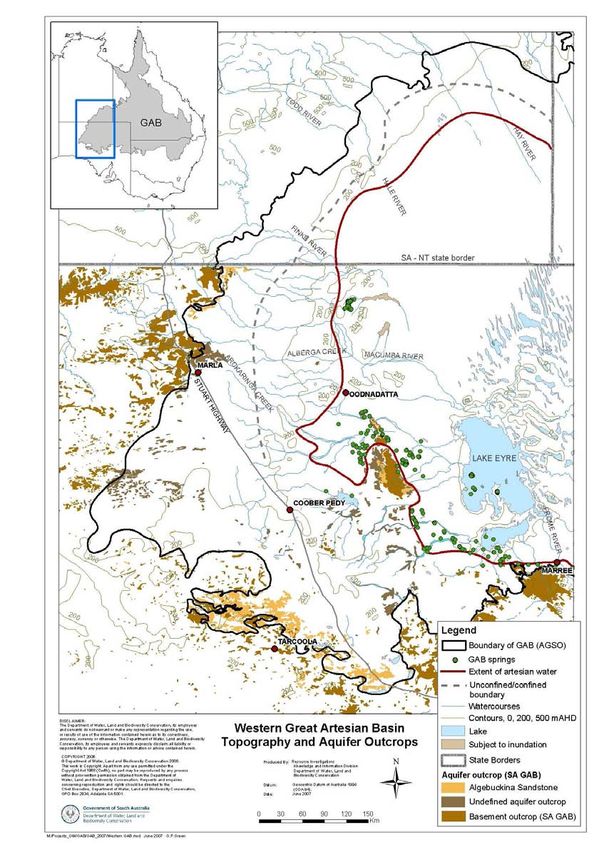
The predominant vegetation for the western area is saltbush, blue bush and Acacia (Fig. 4). The land-
use in the recharge zone of SA is a mixture of pastoral leases, Aboriginal freehold and nature
conservation park, whilst in the NT it is mainly pastoral leases and some Aboriginal freehold (Fig. 5).
14Figure 4. Natural vegetation map for the western margin of the GAB.
15Figure 5. Land use and tenure for the western margin of the GAB.
162.2 Coonamble Embayment The Coonamble Embayment lies in the NSW portion of the GAB and is located west of the Warrumbungle mountain range (Fig. 6). The area of the GAB that is within NSW is ~207 000 km2 (~11% of GAB).The general topography declines from 300m in the eastern portion at the foot of the Warrumbungles to ~125m at Carinda in the north-west part of the area (Fig. 7). The main aquifer, the Jurassic Pilliga sandstone, outcrops at higher elevations further to the east (250m to 600m). Most of the surficial cover in the area is classified as undifferentiated Quaternary cover. The climate is described by Wolfgang (2000) as sub-humid to semi-arid. Rainfall is ~900mm yr-1 in the SE part (uplands) to
medium texture with red – red-brown subsoil and CaCO3 concretions. They are highly weathered and
leached (Taylor, 1994). Natural vegetation in the upper catchment is eucalypt hardwood forests. In
lower elevations: Yellow box; red gum; she-oak and introduced willows (Downes and Sleeman,
1955). Further west is savannah swamp and some mallee and red gum on the floodplains. Land
clearing of native vegetation commenced in late 1880s in the low lying areas immediately west of the
Ranges. There has been a significant shift from dryland to irrigation farming that occurred in the
1960s – 70s. The predominant current land-use is dryland cropping (wheat), pastures and irrigated
cotton and also some oats and barley. The total agricultural area ~ 8,250,000 ha.

Figure 6. Map showing the inferred recharge zone within the Coonamble Embayment (after DWR as cited in
Brownbill, 2000).

The first artesian bores were drilled in the late 1880s and a number of weirs were constructed along
the Macquarie River in the 1890s. The early 1900s saw rapid increase in the rate of development.
Major land clearing in the eastern and southern portion may have caused rising water tables and
dryland salinity and stream bank erosion (Wolfgang, 2000).

One of the first major overview papers on the NSW portion of the GAB was published by Abbott
(1884). He showed that the flow systems in the Jurassic aquifers are recharged directly through
outcrops in the eastern highlands of Queensland and flow in a westerly to SW direction. It also showed
a distinct hydrochemical character, with bicarbonate dominated waters in the flow systems emanating
from the eastern part of the Basin. There has been an estimate pressure loss over 80% of the NSW
portion of the GAB and now
fallen from 150m to 130m while in the south-eastern the decline is from 230m to 160m. The greatest
rate of change was observed from 1900-1920. There are estimated to be ~6000 bores in the entire area
in both the phreatic and artesian systems (Fig. 8). Mean pressure from the Pilliga Sandstone aquifer
had dropped from 180m to 145m by 1935, followed by a relatively slow decline since then to the
present.

The chemical composition of the Pilliga sandstone aquifer is Na+-HCO3- type. This is similar to other
eastern margin flow-paths, and salinity ranges from 1000 – 1600 EC (Wolfgang, 2000). Total
dissolved solids (TDS) increase from 500 – 700 mg/L west of Warrumbungle Ranges to higher TDS in
the NW. The shallow aquifer salinity tends to be higher than that of the Pilliga sandstone (Radke et al.,
2000).

Figure 7. Map showing the geological formations, topography and present day potentiometric head of the Pilliga
sandstone within the Coonamble Embayment (after Wolfgang, 2000)

                                                     19
Figure 8. Shaded areas show the extent of flowing bores in the NSW portion of the GAB in 1920 and 1995.
203. LITERATURE REVIEW OF RECHARGE MECHANISMS
3.1 Overview
Over the past 20 years there has been a rapid increase in the number of papers on groundwater
recharge in the literature. The need to know recharge rates is driven by such things as the need for
improved water resource management, better defining the extent and transport of groundwater
contamination and the safe disposal of nuclear waste in underground repositories. As a result of these
activities there are now text books dedicated to recharge studies (Simmers 1988 & 1997, Sharma
1989, Lerner et al., 1990, Robbins 1998, Zhang 1998, Hogan et al., 2004) as well as a number of
review articles in the international literature (Scanlon et al., 2002, Scanlon et al., 2006 and references
therein). In the following review we examine the previous literature and its potential application to the
Great Artesian Basin.
Australia has the most variable and unpredictable rainfall pattern of any continent on earth (Pigram
2006). This large variation of rainfall in both time and space has resulted in groundwater recharge
varying temporally and spatially. This variability is particularly pronounced in the semi-arid and arid
regions of the continent. The development of a number of geochemical and isotopic techniques that
attempt to integrate different spatial and temporal scales (Hogan et al 2004) are often the only reliable
techniques in regions where low net water fluxes dominate.
In this review we firstly examine the background information required to develop a conceptual model
of recharge mechanisms in the study area. This is followed by a brief examination of the water budget
equation as it applies to many recharge studies. We then present a brief overview of environmental
tracers as they are widely applied in all areas of recharge investigations. The review is then organised
into surface water, soil water (the unsaturated zone) and groundwater (the saturated zone). We discuss
a variety of both physical and chemical techniques for estimating recharge. We deliberately place
greater emphasis on the chemical and isotopic approaches as they can integrate over larger scales and
are more relevant for the sub-humid to semi-arid regions of the GAB intake areas.
The first stage of any recharge investigation requires the collection of existing data. This is important
for two primary reasons:
1. To develop an initial conceptual model of recharge process, and
2. Provide a range of what the likely recharge rates might be.
These two factors have important implications for the selection of which recharge techniques should
be used in any study. As discussed by many previous authors, there is a need to have an idea of what
the answer may be before we can design a recharge study. This is critical for the selection of recharge
technique. For example, some techniques, such as artificial tracers, only work well in high rainfall
areas; lysimeters, that measure the actual water movement through a soil profile, are expensive,
difficult to construct and require regular field visits for monitoring and are not considered suitable for
remote areas of the GAB. In contrast, environmental tracers are a more useful technique in arid and
semi-arid regions.
21Background information is used to assess the potential controls on recharge rates and mechanisms.
Useful information to collate includes: topography, geology, geomorphology, soil type, rainfall,
evaporation, transpiration, vegetation, and land-use. The better the conceptual model of the hydrology
and hydrogeology in a region, then the better the accuracy and precision of recharge estimates. Whilst
the use of a good hydrogeological conceptualisation to guide and help the recharge assessment seems
obvious, it has been ignored in many previous studies. Basic hydrogeological data should include:
depth to the water table, or hydraulic head, groundwater chemistry and geological constraints, such as
folds and faults. Basic conceptualisations can then include:, water table and potentiometric surfaces,
aquifer type and aquifer geometry. When the existing data is complied a conceptual hydrogeological
model of groundwater recharge can be developed, as well as preliminary estimates of what the
recharge rate may be.
It is important to clarify a number of terms regarding recharge, used in this report:
Infiltration is the amount of water per unit area that enters the soil profile over a given time period.
Deep drainage is the amount of water per unit area that moves vertically downwards below the zone
of evapo-transpiration (or root zone) over a given period of time.
Recharge is the amount of water per unit area that reaches the aquifer over a given period of time.
Diffuse recharge is defined as recharge derived from precipitation that occurs fairly uniformly across
the landscape (Scanlon et al 2002). It is the recharge that enters the water table resulting from deep
drainage.
Localised Recharge is the recharge that results from run-off, streams and lakes where water moves
laterally to the point where it recharges. This includes recharge from ephemeral rivers.
Mountain Block Recharge describes the contribution of mountains regions to the recharge of
adjacent aquifers (Wilson and Guan 2004).
3.2 Comparison of Recharge Techniques
3.2.1 Water Balance Techniques
The water budget equation can be used in all recharge studies, whether for surface water, unsaturated
or saturated zones. In its simplest form the water budget equation is expressed as:
inflow = outflow ± change in storage.
Specifically, in terms of recharge:
22R = P − ET − RO (1)
Where: R = recharge, P = precipitation, ET = evapotranspiration and RO = runoff. The water balance
technique often estimates recharge by the residual difference of the estimates of P, ET and RO. The
difficulty of this approach is that it relies on accurate measurements of the other components in the
water budget equation. Some authors suggest that this difference technique is not particularly useful in
semi-arid and arid regions because the values of recharge would be smaller than the errors associated
with measurements of P, ET and RO (Gee and Hillel 1988, Hendrix and Walker 1997).
Another major limitation of the technique is the temporal scale over which the water balance is
applied. If one uses average annual values of P and ET it is easy to see from Equation 1 that no
recharge would occur in the arid zone as (ET >> P). As a result this approach using large time steps
dampens out extreme precipitation events that may cause recharge. In the arid zone, recharge is most
likely to occur from very large events, where P >> E. If measurements were taken daily, the water
budget technique may offer some promise, particularly in zones of ephemeral recharge from creeks.
3.2.2 Environmental Tracers
A very brief overview of environmental tracers is presented below. The objective here is to provide
the reader with background information before a discussion of the separate recharge techniques for the
various hydrological zones. Environmental tracers are “natural, or anthropogenic, compounds, or
isotopes, that are widely distributed in the near-surface environment of the Earth, such that variations
in their abundances can be used to determine pathways and timescales of environmental processes”
(Cook and Bohlke, 2000).
Fundamental to recharge studies is an appreciation of the age of groundwaters that can then constrain
the rate of recharge. There are a number of environmental tracers that can be used as tools to estimate
the age of water in the unsaturated and saturated zones. These include:
a) Radioactive tracers;
b) Accumulating tracers; and,
c) Event Markers.
Radioactive tracers are naturally-occurring radioactive tracers have been used extensively over the
past 30 years to provide information on residence time and groundwater flow rates. The groundwater
age is calculated by the expression:
C
t = −λ−1 ln
C0 (2)
where t = time since water entered the saturated zone, C and C0 are the measured and initial
concentration of the radioactive isotope and λ is the decay constant. The most commonly used tracers
23in regional scale groundwater systems are 14C with a half life of 5,730 years and 36Cl with a half life of
301,000 years.
Accumulating tracers increase in concentrations with increasing residence times. The most commonly
used accumulating tracer is 4He which has a very low initial concentration that increases with time due
to release of 4He by alpha decay of uranium and thorium decay-series isotopes within the aquifer
matrix. Often such a tracer provides only semi–quantitative information on the groundwater residence
time.
In rare cases, chemical species can be used as accumulating tracers if their accumulation rates in the
sub-surface can be quantified. Recently, Purtschert et al (2007) have applied the in-situ, sub-surface
production rate of 39Ar to estimate recharge rates in fractured rock aquifers in the Clare Valley of
South Australia.
Event markers are elevated levels of a particular tracers injected into the environment as a result of
anthropogenic activities in the past. Such activities include contaminant spills or atmospheric nuclear
weapons testing. Commonly used event makers include 36Cl, 3H, 14C and chlorofluorocarbons (CFCs).
The presence of an event marker in a parcel of water indicates that it was recharged at a particular
time. Event markers can be used both in unsaturated and saturated zones and have been used to
estimate recharge rates during the last 50 years.
Conservative tracers such as Cl- and Br- have wide application in the hydrological field. Many studies
have used Cl- to estimate recharge (see below). Bromide is often used as an applied tracer in recharge
studies.
3.3 Surface Water Techniques
The role that surface water plays in groundwater recharge depends upon the interconnection between
the two water bodies. Throughout most of the GAB, the potentiometric head is upwards and as a result
no recharge from the surface water bodies is possible. There is the potential, however, for
groundwater recharge from surface water bodies in the recharge zones of the GAB, where the aquifer
is outcropping, or unconfined. A number of ephemeral, braided streams cross the potential recharge
zones of both the Western Margin and Coonamble Embayment.
3.3.1 Estimation of ephemeral stream recharge
Historically, ephemeral recharge has been estimated from channel loss between gauging stations. This
approach, however, does not allow for the uptake of water by riparian vegetation. The recharge rate,
R, for a channel reach can be estimated using the water budget equation. This approach assumes that
recharge equals channel transmission losses less the abstraction of water from evaporation in the
channel and transpiration (Goodrich et al 2004):
R = Qi + Q1 + −QL + P − E − T + ∆S (3)
24where, Qi and Q1 are measured flow at gauging stations at the inflow and outflow of the reach; QL is
lateral, overland and tributary flow; P is direct precipitation; E is evaporation; T is transpiration and
∆S is chance in storage.
The importance of ephemeral stream recharge on the basin scale depends upon the size of the
landscape occupied by streams. For example, if we assume that diffuse recharge is 10 mm/y, and that
the stream recharge features cover 1% of land area, then to be comparable, recharge through stream
bed features must be 1,000 mm/yr. Alternatively, if the streams occupy 10% of the landscape then
recharge through the stream bed must be 100 mm/yr. As is evident from the above example, the two
important factors for basin scale recharge from streams are the amount of diffuse recharge and the
geographical size of the streams in comparison to the zones of diffuse recharge.
3.3.2 Hydraulic and Geophysical approach.
Another method to estimate groundwater recharge under localized zones such as ephemeral creeks is
to estimate recharge from the shape of any mounding of the water table. This is a useful approach in
areas where there is a lack of well coverage. A number of techniques have been applied in the desert
environments of the southwest USA, including: gravity, electromagnetic induction and ground
penetrating radar (Hogan et al 2004). Electrical topographic methods have the advantage of being able
to trace water movement in 2 and 3 dimensions and maybe very useful for evaluating focused recharge
beneath ephemeral streams. If a groundwater mound can be established, an estimate of recharge can be
achieved by using the groundwater mound equation of Hantush (1967).
3.3.3 Stable Isotopes
Natural variations in the stable isotopes of the water molecule (18O/16O and 2H/1H) can provide
valuable information on the source and history of water in the hydrologic cycle (Clark and Fritz,
1997). The primary advantage of stable isotopes is that as part of the water molecule they trace the
actual movement of water. In contrast, when one uses a solute to infer water transport one assumes
that the tracers either moves with the water, or corrections need to be made for dispersion, diffusion
and any chemical interactions.
Although rarely used to estimate recharge rates, the stable isotopes of water have been shown to be
particularly useful in distinguishing different recharge mechanisms in arid and semi-arid zones
(Coplen et al., 2000 and references therein). Both unsaturated and saturated water in arid zones often
display enrichment in stable isotopes of the water molecule due to evaporation in the upper few meters
of the soil zone. These will tend to plot to the right of a Meteoric Water Line (MWL) on a stable
isotope plot, indicating evaporation. In contrast, localised recharge from flood events through
ephemeral streams often has a more depleted signature indicative of more direct recharge as it by-
passes the zone of evaporation. These waters will not only be more depleted, but will plot closer to
the MWL. In ideal situations the relative proportion of localised recharge versus diffuse recharge can
be determined by simple mixing calculations.
An example of stable isotope data in an arid zone groundwater system in central Australia (Fig. 9)
25shows that the groundwaters tend to plot to the right of the local meteoric water line (in this case
represented by local rainfall). Evapo-transpiration in the upper part of the soil zone causes this trend
and is typical of groundwater in semi-arid and arid zones. The stable isotope compositions also tend to
be considerably more negative than that of mean annual rainfall and indicate recharge is primarily
from episodic high rainfall events as a result of summer dominated tropical storms. These data could
also represent rainfall from past cooler and wetter climates, such data, however, would tend to plot
closer to the meteoric water line. This will be discussed for the GAB system in sections 4.1 and 4.2.
Figure 9. Stable isotope data plot for an arid region of Australia (Ti-Tree basin, NT) showing the relationship
between amount of rainfall and isotopic composition. The extrapolated groundwater trend shows that recharge
occurs predominantly from high rainfall events, indicative of monsoonal systems (Harrington, 1997).
3.4 Unsaturated zone
3.4.1 Darcy’s law
Unsaturated zone techniques to estimate recharge rates are often used where the unsaturated zone is
relatively thick, such as in arid and semi-arid regions. Detailed reviews of unsaturated zone techniques
can be found in Gee and Hillel (1988), Zhang (1998), Scanlon et al (1997; 2006). In essence,
unsaturated zone techniques estimate the drainage rate below the root zone and provide a point
estimate of recharge. Unsaturated techniques can also provide information on temporal variability.
They generally do not provide detailed information on spatial variability.
It is important to note that unsaturated techniques actually measure deep drainage and not recharge. It
is often assumed that this deep drainage will reach the water table and become recharge. This assumes
vertical flow only beneath the root zone. This assumption is not always correct, however, due to
26heterogeneity in the unsaturated zone. For example, a sandy horizon overlying a low permeability clay
has the potential to perch water and result in lateral flow.
Physical methods for estimating water fluxes in semi–arid and arid zones are generally very difficult
to apply because water fluxes are very low. Chemical tracers have an advantage over physical methods
as they can provide information on both current and historical recharge rates. Both physical and
chemical techniques are used for determining soil water velocities, which can then be related to
drainage rates and, ultimately, recharge rates. A number of unsaturated zone techniques, such as
lysimeters and applied tracers, have limited application to the GAB and are not discussed here (see
Scanlon et al 1999 and Scanlon 2004 for detailed reviews).
Darcy’s Law can be used to calculate recharge, R, in the unsaturated zone using the following
(Scanlon 2004):
dh
R = − K (θ ) = − K (θ ) (h + z ) = − K (θ ) + 1
dH d
dz dz dz (4)
Where K(θ) is the unsaturated hydraulic conductivity at the ambient water content θ, H is the total
head, h is the matric pressure head and z is the elevation. In thick, unsaturated zones with a porous
medium the matric pressure gradient is often close to zero and drainage is driven by gravity (Scanlon,
2004). Under this scenario the total head gradient can be assumed to be unity, negating the need to
measure the matric pressure gradient. One of the main limitations to using Darcy’s Law in the
unsaturated zone, however, is that it requires accurate measurements of unsaturated hydraulic
conductivity. Scanlon (2004) concluded that considering problems with sample disturbance, drying
and spatial variability the method has a limited applicability to recharge rates of 20 mm/yr or higher.
The recharge rates for much of the GAB intake areas are estimated to bePCl pptn = ECl + RCl sw +QCl riv
(6)
Clpptn, Clsw and Clro refer to Cl concentration in precipitation, soil water and runoff respectively and Q
is runoff. Here we assume that Cl- is neither gained, nor lost, from weathering or anthropogenic
impacts. Note that this equation applies equally to the unsaturated and saturated zones. In the saturated
zone the chloride concentration in soil water is replaced by Cl- concentration in groundwater at the top
of the water table.
In many arid areas surface runoff, Q, is not significant and, assuming there are no other source or sinks
of Cl-, then recharge maybe estimated from Equation 7:
P[Cl ] pptn
R=
[Cl ]sw (7)
Natural water balance
rainfall
transpiration
evaporation
run off
recharge Modified from Val Snow
Figure 10. Schematic diagram, showing the hydrological balance for the conceptual, one-dimensional recharge
system for using the chloride mass balance technique.
This equation is applicable to both the unsaturated and saturated zones. In the unsaturated zone,
however, we measure deep drainage and not recharge. This technique has been used extensively in
semi-arid and arid zones because it can measure recharge at low water fluxes. Water fluxes as low as
0.05 mm/yr have been measured in the arid zone of Australia (Allison and Hughes 1983, Cook et al
1994).
If the interest is in establishing a chronological history of recharge, then in addition to measuring Cl-
concentrations, measurements of 36Cl and δ2H and δ18O should be obtained. CMB in the unsaturated
zone provides point estimates of recharge, but over large temporal scales. Examples of ideal chloride
28profiles, shown in Fig. 11, are for situations of varying groundwater chloride concentration and depth
to water table. One can also use the data to evaluate changes in recharge rate with time if cumulative
[Cl-] and water content are plotted (Fig. 12).
Figure 11. Schematic diagram showing different soil water chloride profiles under conditions of a
fresh water table (a); saline water table (b) and diffusion to a very deep fresh water table (c) (after
Phllips, 2000).
Figure 12. Cumulative soil water profiles for different land elements showing changes in recharge rates where
there is a break in slope (after Leaney et al., 1999).
293.4.3 Event Markers
The most commonly used event markers in the unsaturated zone are 3H and 36Cl. Chlorine-36 has a
half-life of 301,000 years and is primarily produced in the atmosphere via cosmic ray spallation of
argon-40. Tritium (3H) is the radioactive isotope of hydrogen, has a half-life of 12.43 years, and is also
produced in the atmosphere, by the bombardment of nitrogen by the flux of neutrons in cosmic
radiations. In the 1950s and 1960s thermonuclear testing caused a large increase in the concentration
of 3H and 36Cl in precipitation. This has resulted in these isotopes being excellent markers in the
hydrological cycle for recharge events in the last 50 years. The peak concentration of these event
markers in the unsaturated zone can be used to estimate groundwater from Equation 8:
∆z
R = vθ = θ
∆t (8)
where v is the tracer velocity, ∆z is the depth to the peak of the tracer concentration, ∆t is time
difference between the tracer the peak of the tracer fallout in the atmosphere and the time of sampling,
and θ is the average water content above the tracer peak.
A limitation to this technique in semi arid zones is potential low water fluxes, which can result in the
peak concentrations not being transported past the root zone. This technique, however, may have
applications in zones of localised recharge in arid zones due to potentially larger water fluxes.
3.5 Saturated Zone Techniques
3.5.1 Darcy’s Law
Many of the unsaturated zone techniques provide only point estimates of recharge. In contrast,
saturated techniques have the potential to integrate over much larger spatial scales. Furthermore,
saturated techniques have the advantage in that we are measuring water that has actually reached the
water table. Darcy’s Law can be used to estimate groundwater recharge by relating the groundwater
flow rate through a cross-sectional area of the aquifer to the surface area that contributes to recharge.
Darcy’s Law (Equation 4, above) states that, in saturated media, the groundwater flux (q) is equal to
the product of hydraulic conductivity (K) and hydraulic gradient (i):
q = Ki (9)
The groundwater flux, q, can then be converted to a recharge rate from the following:
qA
R=
SA (10)
where, R = recharge, q = groundwater flux A = cross sectional area of aquifer, and SA = surface area
that contributes to flow. The method assumes steady flow with minimal pumping. The cross-sectional
area should be aligned such that the groundwater flow direction is normal to the water table contours.
The method suffers significantly from reliable estimates of hydraulic conductivity, which can vary by
several orders of magnitude. Considering the natural variation in hydraulic conductivity and the
30You can also read