Current-Use Pesticides, Fragrance Ingredients, and Other Emerging Contaminants in San Francisco Bay Margin Sediment and Water
←
→
Page content transcription
If your browser does not render page correctly, please read the page content below
Current-Use Pesticides, Fragrance
Ingredients, and Other Emerging
Contaminants in San Francisco Bay
Margin Sediment and Water

Prepared by:

Matthew Heberger, Rebecca Sutton, Nina Buzby, Jennifer
Sun, Diana Lin, and Miguel Mendez
San Francisco Estuary Institute

Michelle Hladik, James Orlando, and Corey Sanders
U.S. Geological Survey, California Water Science Center

Edward T. Furlong
U.S. Geological Survey, National Water Quality Laboratory

                 CONTRIBUTION NO. 934 / February 2020
 San Francisco Estuary Institute • 4911 Central Ave., Richmond, CA • www.sfei.org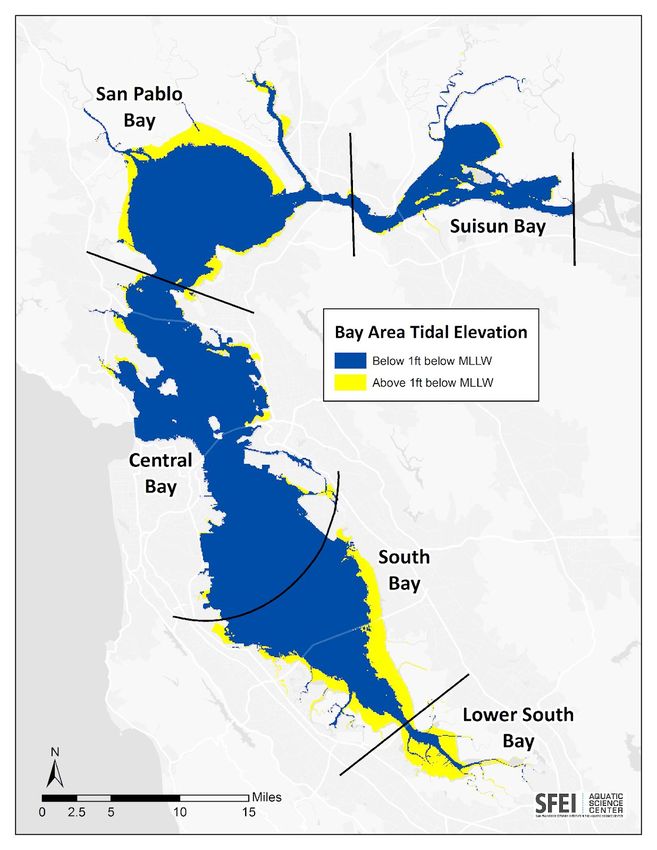
Current-Use Pesticides, Fragrance
    Ingredients, and Other Emerging
Contaminants in San Francisco Bay Margin
          Sediment and Water
                                        February 2020

                     Matthew Heberger, Rebecca Sutton, Nina Buzby,
                      Jennifer Sun, Diana Lin, and Miguel Mendez
                            San Francisco Estuary Institute

                  Michelle Hladik, James Orlando, and Corey Sanders
               U.S. Geological Survey, California Water Science Center

                                  Edward T. Furlong
              U.S. Geological Survey, National Water Quality Laboratory

                               San Francisco Estuary Institute
                                      Richmond, CA
                                 SFEI Contribution No. 934

Suggested Citation:
Heberger, Matthew, Rebecca Sutton, Nina Buzby, Jennifer Sun, Diana Lin, Miguel Mendez, Michelle
Hladik, James Orlando, Corey Sanders, and Edward T. Furlong. 2020. “Current-Use Pesticides,
Fragrance Ingredients, and Other Emerging Contaminants in San Francisco Bay Margin Sediment and
Water.” SFEI Contribution No. 934. San Francisco Estuary Institute, Richmond, CA.

                                                                                                  2
Acknowledgements: Funding for this study was provided by the Regional Monitoring Program for
Water Quality in San Francisco Bay, with additional support provided by the United States
Geological Survey. The authors thank R. Fairey and M. Sigala (Moss Landing Marine Laboratories)
for sample collection, M. Weaver (SFEI) for data management, and A.-C. Doherty, D. Muir, J.
Davis, J. Teerlink, K. Moran, M. Foley, T. Hall, T. Mumley, V., Singla, and W. Arnold for valuable
comments.
3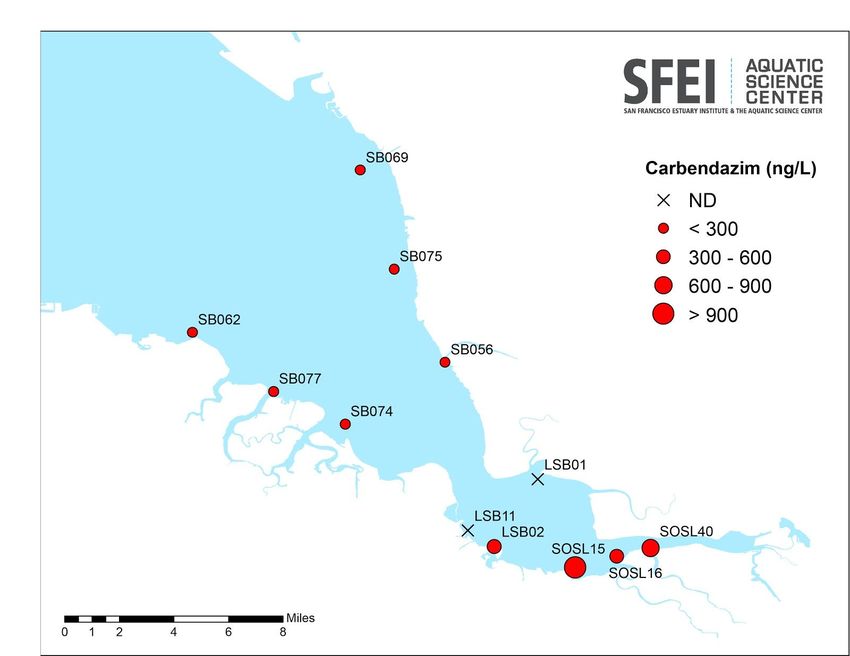
Table of Contents
Executive Summary 9
Introduction 10
Methods 12
Selection of Target Analytes and Analytical Laboratories
Geographic Setting and Site Selection
Sample Collection
Laboratory Analyses
Quality Assurance Methods
Aquatic Toxicity Thresholds
Results and Discussion 23
Water Quality Conditions
Pesticides in Sediment
Pesticides in Water
Fragrance Ingredients and Other Emerging Contaminants in Sediment
Fragrance Ingredients and Other Emerging Contaminants in Water
Risk Evaluation for San Francisco Bay 45
Conclusions 50
References 51
Appendix A Laboratory Analytical Method Detection Limits 56
Appendix B Quality Assurance Summary 64
Appendix C How to Obtain Study Data 67
Appendix D Summary Tables for Polycyclic Aromatic Hydrocarbons (PAHs) 68
4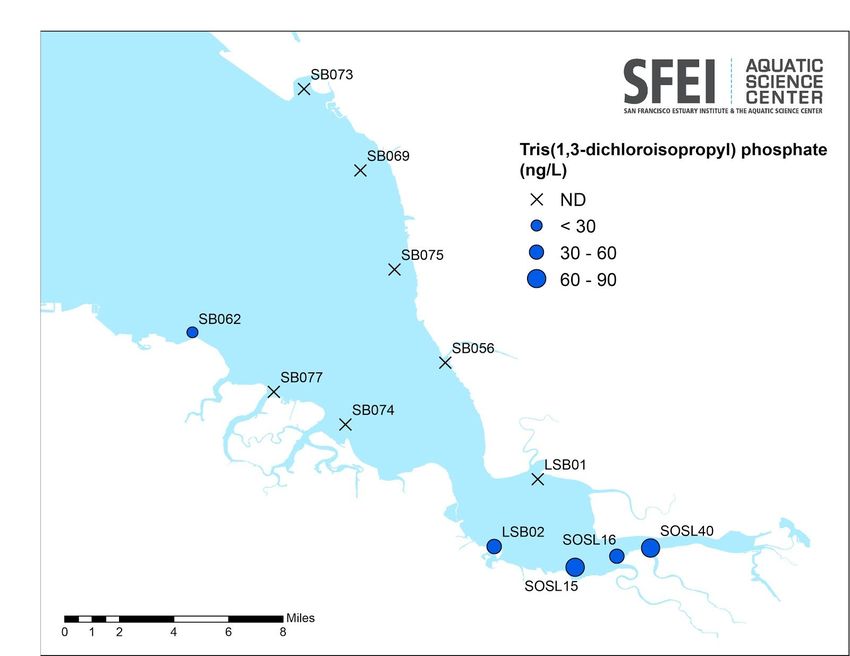
Tables
Table 1.   Planned and actual sampling locations.
Table 2.   Number of distinct compounds analyzed by each lab and for each matrix.
Table 3.   Summary of pesticides and degradates detected in bed sediment in South and Lower
           South San Francisco Bay margins, summer 2017.
Table 4.   Summary of pesticides and degradates detected in water in South and Lower South San
           Francisco Bay margins, summer 2017.
Table 5.   Summary of fragrance ingredients and other wastewater-related compounds detected in
           bed sediment in South and Lower South San Francisco Bay margins, summer 2017.
Table 6.   Summary of fragrance ingredients and other wastewater-related compounds detected in
           water in South and Lower South San Francisco Bay margins samples, summer 2017.
Table A1. List of analytes, methods, and method detection limits for pesticides analyzed by USGS
          Organic Chemistry Research Laboratory (OCRL; Sacramento).
Table A2. List of analytes, methods, and method detection limits for wastewater compounds, by
          USGS National Water Quality Laboratory (NWQL; Denver).
Table D1. Summary of polycyclic aromatic hydrocarbons (PAHs) detected in water in South San
          Francisco Bay Margins samples, summer 2017.
Table D2. Summary of polycyclic aromatic hydrocarbons (PAHs) detected in bed sediment in
          South San Francisco Bay Margins samples, summer 2017.

                                                                                                   5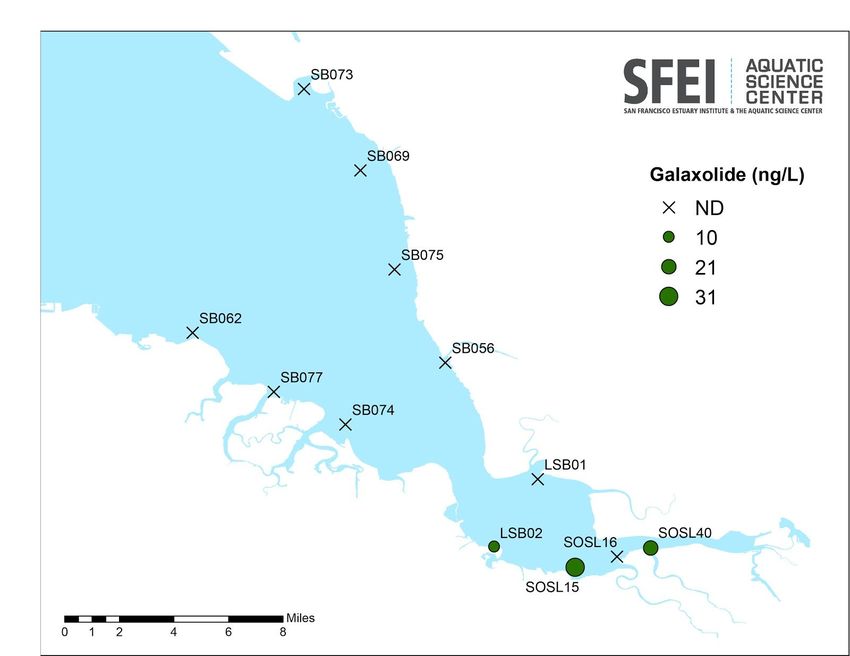
Figures
Figure 1. San Francisco Bay regions, with margins in yellow.
Figure 2. Bay margins sampling locations for pesticides and wastewater-related contaminants in
relation to wastewater treatment plants.
Figure 3. Tide elevation during sampling events in June and July 2017.
Figure 4. Hydrologic conditions during the sampling period.
Figure 5. Measured concentrations of the pesticide carbendazim in South Bay margins water
samples.
Figure 6. Measured concentrations of the pesticide fipronil and degradates in South Bay margins
water samples.
Figure 7. Measured concentrations of the pesticide imidacloprid in South Bay margins water
samples.
Figure 8. Measured concentrations of the fragrance ingredient indole in South Bay margins
sediment samples.
Figure 9. Measured concentrations of the wastewater-related compound 4-methylphenol in South
Bay margins sediment samples.
Figure 10. Measured concentrations of the polycyclic musk galaxolide in South Bay margins
sediment samples.
Figure 11. Measured concentrations of the wastewater-related compound
tris(1,3-dichloroisopropyl)phosphate in South Bay margins water samples.
6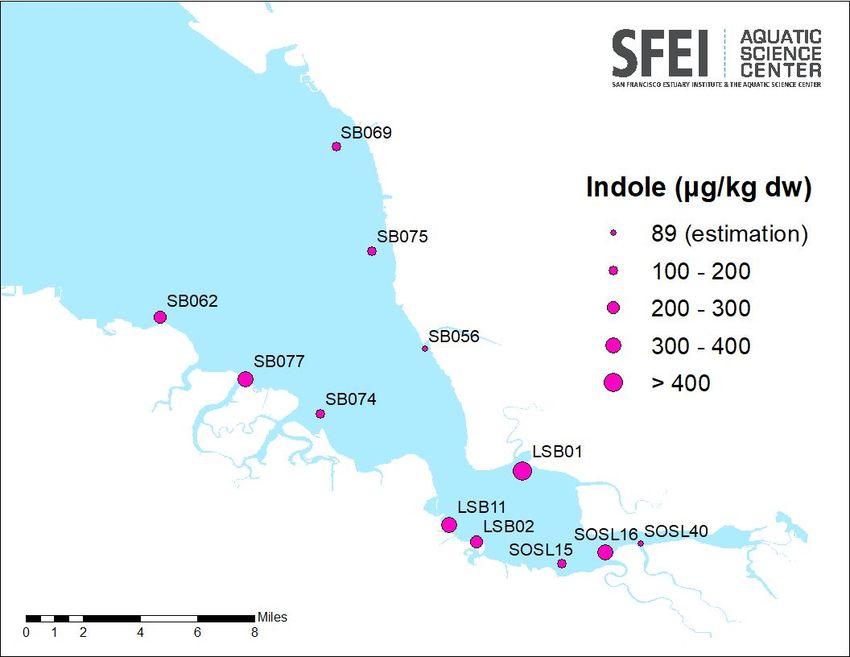
Acronyms and Abbreviations
CAS Chemical Abstracts Service
CASRN Chemical Abstracts Service Registry Number
CAWSC USGS California Water Science Center
CD3 Contaminant Data, Display and Download Tool
CEC Contaminant of emerging concern
CEDEN California Environmental Data Exchange Network
CGA Chlorogenic acid
CHN Carbon Hydrogen Nitrogen
CRM Certified reference material
CUP Current-use pesticide
DDE Dichlorodiphenyldichloroethylene, a chemical that results from the
breakdown of DDT
DDT Dichlorodiphenyltrichloroethane, a legacy pesticide
DEET N,N-Diethyl-meta-toluamide, or diethyltoluamide
DEHP Bis(2-ethylhexyl) phthalate
DEP Diethyl phthalate
DPR California Department of Pesticide Regulation
dw Dry weight
ECHA European Chemicals Agency
EC10 Effect concentration where 10% of a population exhibit a response
EC50 Median effective concentration, or effect concentration where 50% of
a population exhibit a response
fOC fraction of the sediment that is organic carbon, expressed as a
percentage or unitless ratio
GC-MS Gas chromatography-mass spectrometry
HHCB Galaxolide (HHCB is an abbreviation of the chemical name
1,3,4,6,7,8-hexahydro-4,6,6,7,8,8,-hexamethyl-cyclopenta[g]benzopyra
n)
HLB Hydrophobic Lipophilic Balance
IP A quality assurance flag, indicating an analyte was detected in a field
or lab blank
Kow Octanol-Water partition coefficient
LC50 Lethal concentration that kills 50% of a population of organisms
LC-MS/MS Liquid chromatography-tandem mass spectrometry
LEB Likely effect benchmark
LOEC Lowest-observed-effect concentration
MDL Method detection limit
MGD Million gallons per day
MTL Monitoring trigger level
ND Non-detect
NOA (2-Naphthalenyloxy)acetic acid
7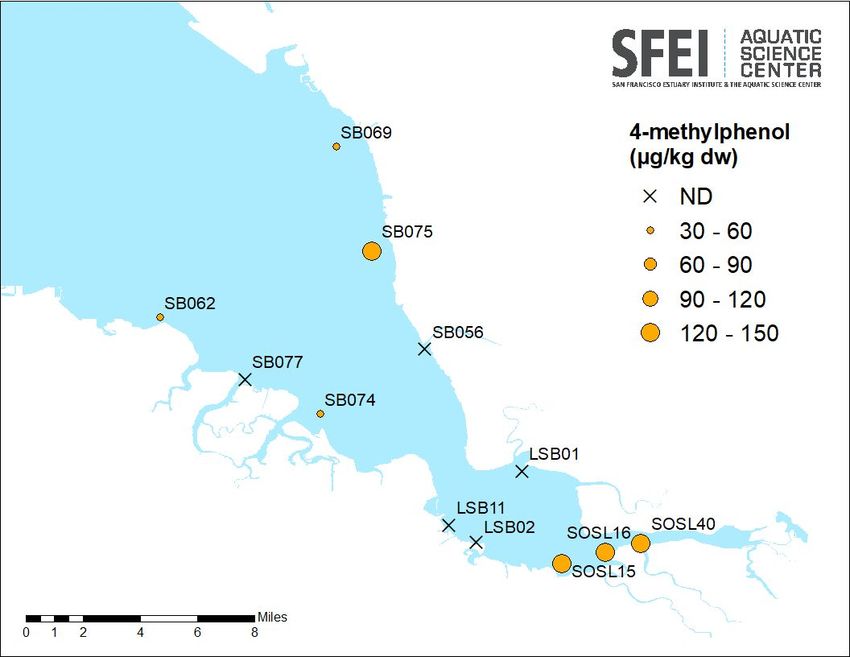
NOEC    No observed effect concentration
NWQA    National Water Quality Assessment
NWQL    National Water Quality Laboratory, a USGS lab in Denver
OC      Organic carbon
OCRL    Organic Chemistry Research Laboratory, a USGS lab in Sacramento
OPE     Organophosphate ester
ORP     Oxygen reduction potential
PAH     Polycyclic aromatic hydrocarbon
PBDE    Polybrominated diphenyl ethers
PCB     Polychlorinated biphenyl
PCS     Permit compliance system
PNEC    Predicted no-effect concentration
POTW    Publicly-owned treatment works
PUR     Pesticide Use Reporting database, maintained by the California
        Department of Pesticide Regulation
QA      Quality assurance
QAPP    Quality Assurance Project Plan
QC      Quality control
RMP     Regional Monitoring Program for Water Quality in San Francisco Bay
RSD     Relative standard deviation
SAP     Sampling and analysis plan
SFEI    San Francisco Estuary Institute
SOSL    Southern sloughs (southern portion of San Francisco Bay)
SRM     Standard reference material
SURF    Surface Water Database, maintained by the California Department of
        Pesticide Regulation
TEB     Threshold effect benchmark
TOC     Total organic carbon
TRC     Technical Review Committee
USGS    U.S. Geological Survey
USEPA   U.S. Environmental Protection Agency
WHO     World Health Organization
WWTP    Wastewater treatment plant

                                                                             8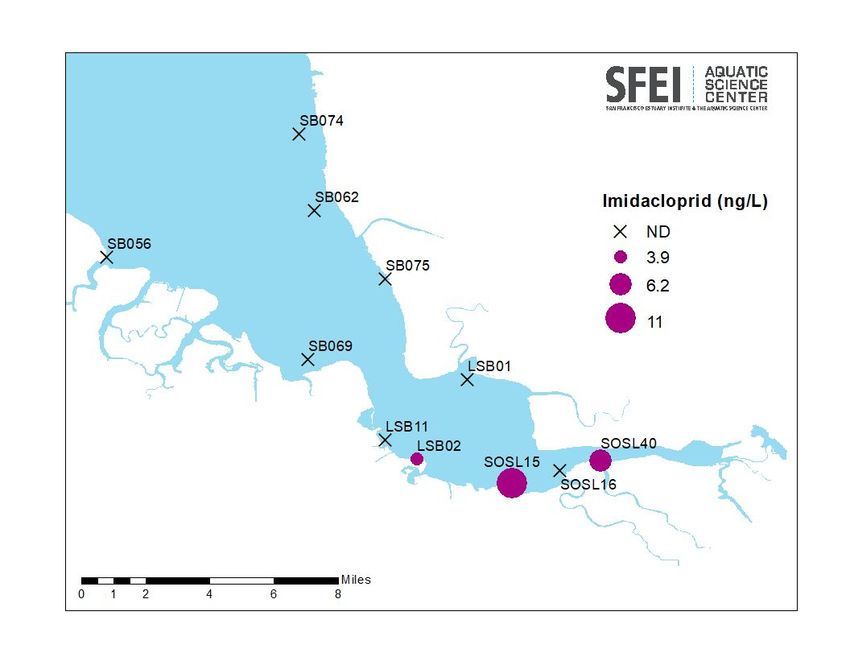
Executive Summary
The Regional Monitoring Program for Water Quality in San Francisco Bay (RMP) has recently
focused attention on better characterization of contaminants in nearshore “margin” areas of San
Francisco Bay. The margins of the Lower South Bay are mudflats and shallow regions that receive
direct discharges of stormwater and wastewater; as a result, they may have higher levels of urban
contaminants than the open Bay. In the summer of 2017, the RMP collected samples of margin
sediment in the South and Lower South Bay for analysis of legacy contaminants. The study
described here leveraged that sampling effort by adding monitoring of sediment and water for two
additional sets of emerging contaminants: 1) current-use pesticides; and 2) fragrance ingredients
including the polycyclic musk galaxolide, as well as a range of other commonly detected emerging
contaminants linked to toxicity concerns such as endocrine disruption.
A number of current-use pesticides were observed in margin samples. Bifenthrin, a current-use
pesticide commonly detected in freshwater sediments at concentrations associated with aquatic
invertebrate toxicity, was present in 3 of 12 sites at concentrations ranging from 1.3 to 1.7 µg/kg dry
weight (dw). Eighteen pesticides were detected in filtered water samples, and none were detected in
suspended sediment. Three of these pesticides—carbendazim, fipronil, and imidacloprid—were
detected in some samples at concentrations greater than U.S. Environmental Protection Agency
(USEPA) aquatic life benchmarks for freshwater settings.
Among fragrance ingredients and other emerging contaminants, a total of 16 compounds were
detected in bed sediment, with five compounds detected in at least half of the samples. Four
compounds were detected at concentrations comparable to or greater than available ecotoxicology
thresholds, including the fragrance ingredients indole and camphor, as well as 4-methylphenol and
4-n-nonylphenol. A total of 18 distinct compounds were detected in water samples, with one, an
organophosphate ester (OPE) known as tris(1,3-dichloroisopropyl) phosphate or TDCPP,
exceeding a protective ecotoxicity threshold.
Evaluation of the results for individual contaminants relative to available toxicity thresholds
generally supported existing classifications within the RMP’s Tiered Risk-based Framework for
emerging contaminants. Among pesticides, findings were consistent with fipronil and imidacloprid
as Moderate Concerns for the Bay, pyrethroids as Low Concern for the Bay (this class is considered
a High Concern in tributaries), and other current-use pesticides as Possible Concerns for the Bay.
Fragrance ingredients were generally found at levels indicative of minimal or Low Concern. One
exception, indole, a fragrance ingredient that is also produced naturally and used as a fecal indicator,
is considered a Possible Concern for the Bay. Another emerging contaminant with natural and
anthropogenic sources, 4-methylphenol, may also be considered a Possible Concern. Detections of
TDCPP and other OPEs, used as flame retardants and plastic additives, were consistent with
classification of this class as a Moderate Concern for the Bay. Likewise, detections of
4-n-nonylphenol were consistent with the current designation of alkylphenols and alkylphenol
ethoxylates as a Moderate Concern for the Bay.
9
Periodic monitoring of current-use pesticides and fragrance ingredients is recommended for the
future, because many of these contaminants are derived from consumer products that may be used
in increasing quantities as the Bay Area population continues to undergo rapid growth, and because
a number of them are toxic to aquatic life.
Introduction
The Regional Monitoring Program for Water Quality in San Francisco Bay (RMP) has recently
focused attention on characterizing contaminants in nearshore “margin” areas of San Francisco Bay.
The margins are intertidal, less-accessible (to boats) regions that have not been previously included
in the study design for Status and Trends monitoring (Figure 1). The margins—consisting of
mudflats and adjacent shallow areas—are important habitats for fish, waterfowl, and other wildlife
that may be exposed to contaminants.
The margins receive direct discharges of stormwater and, in some locations, wastewater, and may be
more contaminated by some types of urban pollution than the open Bay (Yee et al. 2018; 2019). The
margins are also more likely to be a depositional sediment environment relative to the open Bay, so
sediment-bound contaminants may build up in these areas. For example, a 2018 RMP study of
Central Bay margins found that the margins, which account for only 5% of the area of the Central
Bay, contained about 20% of the PCB mass (Yee et al. 2018).
The water in the southern portion of the Bay experiences longer residence times and less tidal
flushing by seawater relative to other embayments, and therefore contaminants in water and
sediment may pose a relatively greater risk to wildlife. In the summer of 2017, the RMP collected
samples of margin sediment in the South Bay for analysis of legacy contaminants. The study
described here leveraged that sampling effort by adding monitoring for two additional sets of
emerging contaminants in margin sediment and water.
The first class of emerging contaminants analyzed was current-use pesticides. Pesticide analyses can
inform Bay water quality managers as well as the California Department of Pesticides Regulation
(DPR). Fipronil, a phenylpyrazole insecticide used to control ants, fleas, and termites, is considered
an emerging contaminant of “Moderate Concern” for the Bay within the RMP’s Tiered Risk-based
Framework for emerging contaminants (Sutton et al. 2017). Fipronil degradates have been detected
in Bay sediments at levels comparable to toxicity thresholds. More recently, RMP monitoring of
imidacloprid in Bay water has provided support for classification of this widely used neonicotinoid
insecticide as a Moderate Concern for the Bay as well (Buzby, Lin, and Sutton in prep.).
In contrast, another class of common insecticides, pyrethroids, are considered “Low Concern” for
the Bay. Previous RMP monitoring of several pyrethroids in Bay sediment found concentrations
well below levels of concern (Sutton et al. 2017). Pyrethroids have been found in sediments in Bay
Area creeks (Ensminger et al. 2013) and in wastewater effluent, although removal by secondary
wastewater treatment may be as high as 90% (Weston, Ramil, and Lydy 2013).
10There are little to no monitoring data for many other current-use pesticides in the Bay. As a result,
this class of contaminants (all current-use pesticides other than fipronil and pyrethroids) has been
classified as a “Possible Concern” for the Bay in the RMP’s Tiered Risk-based Framework,
indicating uncertainty as to the presence and potential for impacts (Sutton et al. 2017).
The second class of emerging contaminants analyzed was fragrance ingredients, including galaxolide,
and other emerging contaminants linked to toxicity concerns such as endocrine disruption. A driver
for this study was the lack of Bay data on presence and levels of widely used fragrance ingredients.
Fragrances are complex chemical mixtures often added to personal care and cleaning products that
are typically disposed of down the drain. Fragrance ingredients may therefore make their way
through wastewater treatment plants and into receiving waters.
Figure 1. San Francisco Bay regions, with margins in yellow.
Of particular concern among fragrance ingredients is the polycyclic musk galaxolide.1 A study that
evaluated the impacts of subchronic exposure on larval development of the marine copepod Nitocra
1
Galaxolide
is also referred to as HHCB or
1,3,4,6,7,8-hexahydro-4,6,6,7,8,8,-hexamethyl-cyclopenta[g]benzopyran.
11spinipes established a no observed effect concentration (NOEC) of 7,000 nanograms per liter (ng/L)
(Breitholtz, Wollenberger, and Dinan 2003). Based on this study, a monitoring trigger level (MTL) of
70 ng/L was established for California estuarine waters (P. D. Anderson et al. 2012).
Monitoring of galaxolide and other common fragrance ingredients in the Bay informs Bay water
quality managers. This limited screening effort is not intended to provide a definitive
characterization, but rather a preliminary evaluation of occurrence and potential concerns associated
with both current-use pesticides and fragrance ingredients like galaxolide in the Bay.
Methods
Selection of Target Analytes and Analytical Laboratories
Current-Use Pesticides
Target analytes included several current-use pesticides that were identified primarily using DPR’s
Surface Water Monitoring Prioritization Model (Luo et al. 2014; 2013; Luo and Deng 2015), a
watershed-specific pesticide prioritization algorithm that uses pesticide application data from the
State of California’s Pesticide Use Reporting (PUR) database and pesticide toxicity benchmarks from
USEPA. Because the PUR database does not include information on use of pesticides marketed to
consumers, DPR has conducted marketplace surveys to assess relative availability of different active
ingredients to supplement the model-based prioritization.
A synthesis of these exercises specific to the study area (the South and Lower South Bay region
detailed below) suggested the need to monitor a number of current-use pesticides in margin
sediment, including:
● eight pyrethroid insecticides (bifenthrin, cyfluthrin, cypermethrin, deltamethrin,
esfenvalerate, lambda-cyhalothrin, permethrin, tetramethrin);
● etofenprox (pyrethroid ether insecticide);
● fipronil (and degradates; insecticide);
● oxyfluorfen (herbicide);
● pendimethalin (herbicide); and
● pyriproxyfen (hormone mimic).
Pesticides identified as priorities for water monitoring included:
● five organophosphate insecticides (dichlorvos [DDVP], malathion, diazinon, naled,
chlorpyrifos);
● eight pyrethroid insecticides (bifenthrin, cyfluthrin, cypermethrin, deltamethrin,
esfenvalerate, fenpropathrin, lambda-cyhalothrin, permethrin);
● atrazine (herbicide);
● diquat dibromide (herbicide);
● diuron (herbicide);
12● etofenprox (pyrethroid ether insecticide);
● fipronil (and degradates; insecticide);
● flumioxazin (herbicide);
● imidacloprid (insecticide);
● mancozeb (fungicide, target degradate ethylene thiourea);
● oxyfluorfen (herbicide);
● pendimethalin (herbicide);
● pyriproxyfen (hormone mimic); and
● sulfometuron-methyl (herbicide).
The USGS Organic Chemistry Research Laboratory (OCRL; Sacramento, California) has developed
methods to analyze 139 pesticides and related compounds in sediment samples and 172 compounds
in water samples (dissolved and particulate phases). The list of analytes (Table A1) includes the
active ingredients in current-use and legacy insecticides, fungicides, and herbicides, in addition to
pesticide degradates and other chemicals in pesticide formulations such as carriers and adjuvants.
The only compounds identified by the DPR monitoring prioritization model that were not included
in the OCRL analyses were pyriproxyfen in bed sediment and diquat dibromide, ethylene thiourea (a
degradate of mancozeb), flumioxazin, naled, and sulfometuron-methyl in water. Pyriproxyfen was
analyzed in water samples (dissolved and particulate phases). Further, the insecticide naled breaks
down quickly into DDVP (dichlorvos), which we analyzed in water.
Fragrance Ingredients and Other Emerging Contaminants
As described previously, the polycyclic musk galaxolide (or HHCB), a fragrance ingredient, has
significant ecotoxicity concerns (Breitholtz, Wollenberger, and Dinan 2003). The USGS National
Water Quality Laboratory (NWQL; Denver, Colorado) developed standardized methods to analyze
sediment and water (total) for galaxolide and additional fragrance compounds, including the related
polycyclic musk tonalide, as well as acetophenone, benzophenone, camphor, diethyl phthalate,
indole, isoborneol, d-limonene (also a registered pesticide), menthol, skatole (or 3-methylindole),
methyl salicylate, and triethyl citrate (IFRA 2016). These fragrance ingredients are among a suite of
emerging contaminants identified due to their potential to cause endocrine disruption or other
ecotoxicity concerns in aquatic ecosystems. Other contaminants included in the analyses were
several pharmaceuticals, some industrial chemicals, polycyclic aromatic hydrocarbons (PAHs), and
natural compounds such as cholesterol and the fecal indicator beta-3-coprostanol.
Analysis of Bay margin samples using this standard USGS method provided data to complement an
ongoing USGS National Water Quality Assessment (NWQA) program study of northern and central
California, part of a series of studies taking place in regions across the nation
(https://txpub.usgs.gov/RSQA/). Because the scope of this federal monitoring effort focuses on
freshwater streams and specifically excludes the Bay, the RMP helped fill this important data gap and
will gain insights from independent USGS monitoring being conducted on Bay Area streams.
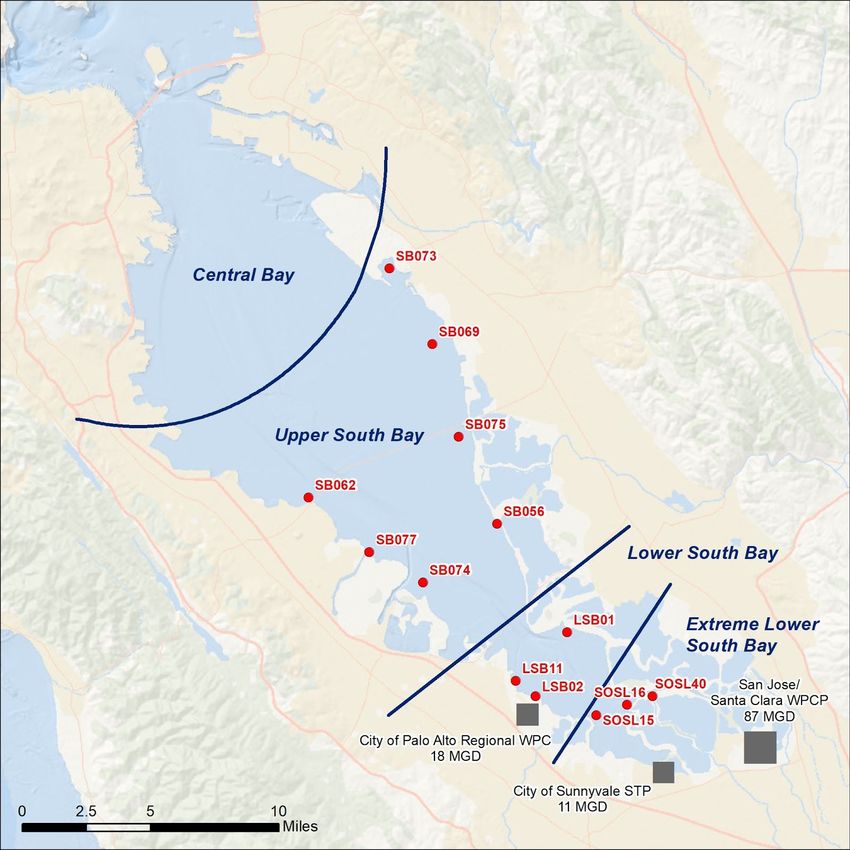
13Geographic Setting and Site Selection
This study is focused on the South Bay. For purposes of this report, the southern portion of San
Francisco Bay is collectively referred to as the “South Bay,” and is made up of three regions (see
Figure 2):
1) the Upper South Bay as described in (Yee et al. 2019), more commonly termed the South
Bay in RMP reports;
2) the Lower South Bay; and
3) the Extreme Lower South Bay as described in (Yee et al. 2019), consisting of locations
further south that have been previously referred to in RMP reports as the “Southern
Sloughs” (sampling locations include the prefix “SOSL”).
In this report, the southernmost portion of the Bay is described as the “Extreme Lower South Bay,”
to reflect the fact that samples from these sites are part of the Bay and not in narrow channels such
as sloughs or creeks.
The South Bay is generally south of Bay Farm Island in the east and Coyote Point in the west. The
drainage area to the South Bay is heavily urbanized. Shoreline cities include Hayward, Union City,
Fremont, Milpitas, San Jose, Santa Clara, Mountain View, Palo Alto, Redwood City, and San Mateo.
Contaminants enter the Upper South, Lower South, and Extreme Lower South Bays via stormwater
runoff from urban areas surrounding the Bay and via effluent discharged by municipal wastewater
treatment plants (Figure 2). San José-Santa Clara, Sunnyvale, and Palo Alto wastewater treatment
plants discharge treated effluent via shallow water outfalls in this part of the Bay. In general,
wastewater treatment plants are designed to remove organic matter, other solids, and bacteria. They
are not specifically designed to remove the wide array of organic compounds that are present in
today’s wastewater, such as pesticides or fragrance ingredients in personal care and cleaning
products.
14Figure 2. Bay margin sampling locations for pesticides, fragrance ingredients, and other emerging
contaminants (red dots). Grey squares depict wastewater treatment plants that discharge to the margins.
Annual average effluent flow is shown in million gallons per day (MGD).*
*Effluent flow data is from Bay Area Clean Water Agencies’ Nutrient Watershed Permit Annual Report (2018),
Table 4-1 on page 13.
15Sampling locations were chosen in the “margins” of Upper South, Lower South, and Extreme
Lower South Bays, defined by the RMP as areas one foot below mean lower low water (MLLW) up
to the vegetated marsh edge (or constructed hardscape in some areas), roughly the mean higher high
water (MHHW) line. Most of the margins are in the intertidal zone—areas exposed to the air at low
tide and submerged at high tide—or in the littoral zone—submerged areas where light penetrates to
the sediment surface.
This emerging contaminants study leveraged a larger study of legacy contaminants in Bay margin
sediments. The larger study covered more sites and analyzed sediment physical characteristics, as
well as legacy pollutants. Methods and rationale for the selection of margin sampling locations are
described in more detail by Yee et al. (2019). Briefly, sampling locations were randomly selected
using the Generalized Random-Tessellation Stratified (GRTS) method in the statistical software R
(NPS 2017).
While the GRTS design is unbiased, meaning that every location in the target area has an equal
probability of being sampled, the subset of sites for emerging contaminants analysis was specifically
selected to be near stormwater and wastewater discharges (Figure 2; Table 1). Twelve sites were
selected for analysis; however, the water sample containers for one site (LSB11) were damaged
during shipment to the USGS NWQL, so an additional water sample was collected at a thirteenth
site (SB073). Water samples from 11 of the 12 stations were analyzed for both current-use pesticides
and fragrance ingredients and other emerging contaminants. The water sample from LSB11 was
analyzed only for current-use pesticides (OCRL), and the water sample from SB073 was analyzed
only for fragrance ingredients and other emerging contaminants (NWQL). The sediment sample
from LSB11 survived shipping and was analyzed for the full suite of analytes.
Samples were collected during the dry summer months when wastewater is likely to have the largest
impact on local water quality conditions, as there are minimal inflows from other, natural sources,
such as local runoff or flow from rivers and creeks. Sampling in the dry summer months may result
in an underestimate of contaminants from stormwater runoff, particularly for water-soluble or
readily degradable contaminants.
16Table 1. Planned and actual sampling locations.
Deviation
from
Station Sample Target Target Actual Actual
Embayment Sample Date planned
Code Time Latitude Longitude Latitude Longitude
location
(meters)
LSB01 Lower South Bay 2017-06-06 11:50 37.49878 -122.082 37.498767 -122.082 1.4
LSB02 Lower South Bay 2017-06-05 11:45 37.46282 -122.105 37.4629 -122.105033 9.3
LSB11*
pesticides Lower South Bay 2017-06-05 10:45 37.47164 -122.119 37.4716 -122.11915 14
Extreme Lower South
SOSL15 Bay 2017-06-07 6:15 37.45178 -122.062 37.4518 -122.06195 5
Extreme Lower South
SOSL16 Bay 2017-06-07 8:00 37.45758 -122.04 37.4576 -122.03995 4.9
Extreme Lower South
SOSL40 Bay 2017-06-06 6:45 37.46212 -122.022 37.462083 -122.022217 20
SB056 Upper South Bay 2017-07-17 8:15 37.56052 -122.131 37.560516 -122.130917 7.3
SB062 Upper South Bay 2017-07-19 6:45 37.57639 -122.265 37.576433 -122.265 4.8
SB069 Upper South Bay 2017-07-18 10:10 37.66252 -122.176 37.6625 -122.175967 3.7
SB073*
galaxolide &
others,
water only Upper South Bay 2017-07-18 7:55 37.70561 -122.206 37.705683 -122.206017 8.2
SB074 Upper South Bay 2017-07-17 11:35 37.52771 -122.184 37.52775 -122.184 4.4
SB075 Upper South Bay 2017-07-19 12:35 37.60993 -122.158 37.60995 -122.15805 4.9
SB077 Upper South Bay 2017-07-19 14:15 37.54515 -122.222 37.545117 -122.222117 11
*Note: SB073 was not planned as a sampling site for this study. However, the sample bottle of water from LSB11
was broken in shipment to NWQL in Denver. Therefore, the project team collected an extra sample from SB073 to
make up for this and bring the number of samples up to 12 for both analytical laboratories.
17Sample Collection
Sediment and water samples were collected by boat at 13 sites in the Upper South, Lower South,
and Extreme Lower South Bays in June and July 2017. The sampling plan is described in the 2017
RMP Margins Sediment Cruise Plan (Trowbridge et al. 2017). Further documentation is provided in
a cruise report by Coastal Conservation & Research (2017) and the 2017 RMP Field Sampling
Report (Shimabuku, Sun, and Trowbridge 2017).
All sampling and handling was conducted using clean techniques to avoid sample contamination
during collection. All equipment used at different sampling stations was re-cleaned in the field
between uses.
Sediment was collected using a stainless steel, Kynar (polymer)-covered modified Van Veen grab
(0.1 m2 area) penetrating 8 to 10 cm into the sediment. Sediment (top 5 cm) from at least three
separate grabs per site was collected using an acetone-washed, stainless steel scoop (one per site) and
placed into a 2-liter glass jar. All jars filled on the boat were placed on wet ice. Jars were picked up
by SFEI staff each evening, chilled on wet ice overnight, and taken to SFEI the following day for
homogenization using acetone-washed, stainless steel spoons and subsampling into glass sample
containers. Sediment sample containers were frozen until overnight shipment to laboratories.
Water samples were collected in a 1-liter amber glass jar by submerging the closed jar under water
about 0.1 meters, uncapping the jar to fill to the neck, and then re-capping the jar under water
before pulling it out and onto the boat. Water samples were chilled to 4oC and shipped overnight as
soon as possible to laboratories.
Additional samples collected include field duplicates, field blanks, and samples to be used for matrix
spikes and matrix spike duplicates. For the sediment field blank for pesticides, an open jar was
placed on the boat console while sampling was conducted. For the sediment field blank for
fragrance ingredients and other emerging contaminants, baked Ottawa sand provided by the USGS
NWQL was used. Clean sand was handled with field equipment in the same way that typical samples
were handled. For both types of sediment field blanks, jars were reopened at SFEI during sample
homogenization. Field blanks for water were collected by pouring trace-clean water supplied by
USGS NWQL directly into amber glass jars. In some cases field blanks, field duplicates, and material
for matrix spikes and matrix spike duplicates were collected at alternate sites than specified in the
original plan.
At each sampling location, field measurements, including sediment pH, ORP (Oxygen Reduction
Potential or Eh measured in millivolts), color, composition (e.g., sand, mud), and anoxic transition
depth were made, along with field observations for each site (e.g., wind speed, wave height,
weather). In addition, latitude and longitude coordinates were recorded using a handheld GPS unit.
18Laboratory Analyses
A brief overview of the analytical methods is provided below. In sum, the two labs analyzed 234
distinct compounds. Eight pesticides were analyzed by both laboratories (atrazine, carbaryl,
chlorpyrifos, diazinon, dichlorvos, metalaxyl, metolachlor, and prometon), though method detection
and reporting limits varied. None of the eight compounds analyzed by both labs were detected in
study samples.
For the pesticide analyses at OCRL, water samples were filtered, and the dissolved and particulate
fractions were analyzed separately. NQWL used methods for analyzing whole water and did not
filter samples. Table 2 summarizes the number of compounds analyzed in each matrix by each
laboratory.
Table 2. Number of distinct compounds analyzed by each lab and for each matrix.
Suspended
Whole water Water (filtered, sediment Total distinct
Bed sediment
(unfiltered) dissolved fraction) (particulate fraction compounds
from filtered water)
OCRL Pesticides - 172 139 118 174
NWQL Emerging 68 - - 56 68
Contaminants
Total distinct 68 172 139 169 234
compounds
Current-Use Pesticides
The OCRL has developed multiple broad screening analyses for pesticides in sediment and water.
The first method uses gas chromatography mass spectrometry (GC-MS) to analyze bed sediment as
well as filtered water and suspended sediment (Hladik, Smalling, and Kuivila 2008; 2009; Hladik and
McWayne 2012). Briefly, filtered water samples were subjected to solid-phase extraction (SPE) using
an Oasis Hydrophobic Lipophilic Balance (HLB) cartridge with no additional cleanup steps.
Sediment and particulate samples were extracted using an accelerated solvent extraction system, and
the compounds of interest were separated from co-extracted matrix interferences (including sulfur)
by passing the extracts through high performance liquid chromatography (HPLC) with
gel-permeation chromatography (GPC), along with the use of either stacked graphitized carbon and
alumina SPE cartridges or packed Florisil®. The sample extracts were stored at -20°C until analysis
(up to 30 days). Chromatographic separation, detection, and quantification of the pesticides from the
extracts were then accomplished via an Agilent Technologies 7890A GC coupled to an Agilent
5975C MS operated in electron ionization (EI) mode (instrument details in Hladik and McWayne
2012).
19The second method uses liquid chromatography tandem mass spectrometry (LC-MS/MS) to analyze
filtered water samples, or the dissolved fraction (Hladik and Calhoun 2012). Solid phase extraction is
accomplished using an Oasis HLB cartridge. The sample extracts were stored at -20°C until analysis
(up to 30 days). Chromatographic separation, detection, and quantification of the pesticides from the
extracts were then performed via an Agilent 1260 LC coupled to a 6430 tandem MS operated in
positive mode electrospray ionization (ESI+; instrument details in Hladik and Calhoun 2012).
Table A1 lists the pesticide analytes, methods, and matrices for compounds analyzed by OCRL. In
total the OCRL lab analyzed:
● 172 compounds in (filtered) water samples;
● 139 analytes in suspended sediment (the particulate fraction filtered from water samples);
● 118 compounds in bed sediment.
In addition, OCRL analyzed the total organic carbon (TOC) in bed sediment, reported as the
percent of the sample mass. This ancillary parameter is important because sediment ecotoxicity
thresholds for contaminants are often reported in units of micrograms per gram of organic carbon
(µg/g OC). TOC was analyzed by USEPA Method 440 (Zimmerman, Keefe, and Bashe 1997), and
the method detection limit was 0.01%.
Galaxolide, Fragrances Ingredients, and Other Emerging Contaminants
The NWQL developed GC-MS methods for sediment and total water screenings of galaxolide and
other emerging contaminants. Table A2 lists the analytes, methods, and matrices for compounds
analyzed by NWQL.
An important caveat in broad screening methods like these is that, for some contaminants, the
method detection and reporting limits will be higher than for a method specifically optimized for the
individual contaminants. For example, the reporting limits for bisphenol A and triclosan in the
NWQL total water screening method are 20 and 160 ng/L, respectively; methods targeted to those
individual compounds can achieve reporting limits at least an order of magnitude lower.
Compounds like these may be observed at levels below the NWQL reporting limits if more
optimized methods are used.
The NWQL analyzed sediment samples for 56 compounds as described in USGS Techniques and
Methods 5-B2 (Burkhardt et al. 2006). Sediment samples were extracted using a pressurized solvent
extraction system. The compounds of interest were extracted from interfering matrix components
by high-pressure water/isopropyl alcohol extraction, then isolated using disposable SPE cartridges
containing chemically modified polystyrene-divinylbenzene resin. The cartridges were dried with
nitrogen gas, and then sorbed compounds were eluted with methylene chloride (80%)-diethyl ether
(20%) through a Florisil®/sodium sulfate SPE cartridge, and then analyzed. Compounds in sample
extracts were determined using gas chromatography coupled to electron-impact ionization full-scan
mass spectrometry (GC-MS) employing a single quadrupole mass analyzer. An Agilent Technologies
20Model 5975 bench top GC-MS system was used for all analyses (instrument details in Burkhardt et
al. 2006).
The NWQL analyzed water samples for 68 compounds as described in USGS Techniques and
Methods 5-B4 (Zaugg, Smith, and Schroeder 2006). Whole-water samples were extracted using
continuous liquid-liquid extractors and methylene chloride solvent, and then analyzed by GC-MS as
with sediment (instrument details in Zaugg, Smith, and Schroeder 2006).
All samples collected for analysis at NWQL were extracted and preserved by freezing following the
methods described above within 24 hours of arrival at OCRL prior to shipment on ice to NWQL.
Quality Assurance Methods
SFEI staff performed a quality assurance review of the dataset for completeness, accuracy, precision,
and lack of contamination following methods described in the RMP Quality Assurance Project Plan
(Yee et al. 2017). A summary of this review is provided in Appendix B. Data were flagged with a
qualifying code if accuracy and precision did not meet RMP criteria. We did this by independently
calculating reported precision (as relative percent difference, RPD, or relative standard deviation,
RSD) for lab replicates, and percent recovery for samples of a known concentration. In some cases,
records were already flagged by the reporting laboratory. Qualifiers added by SFEI or the laboratory
indicate that there has been a deviation from the project’s quality criteria and are meant to warn data
users that certain records may be inaccurate or imprecise. Summary statistics were calculated
excluding the results of field duplicates, as duplicates are quality assurance samples intended to
evaluate the accuracy of the field samples.
To verify that contamination of samples had not occurred in sampling or lab analysis, we compared
the results for blank samples (field and lab blanks) to method detection limits (MDL; OCRL) or
reporting (quantitation) limits (RL; NWQL) provided by the laboratories. In cases where an analyte
was detected in a blank, we compared the measured concentration in the blank sample to
concentrations measured in field samples; RMP criteria specify censoring field sample measurements
that are within three times the method blank level. However, for this project, all data were
reportable, as we did not find serious violations with respect to accuracy, precision, or sample
contamination that would lead to the rejection of data.
The dataset from the USGS analytical labs contains several results that are below the MDL (OCRL)
or RL (NWQL). For example, in the water sample collected at LSB02 on June 5, 2017, the lab
reported a concentration galaxolide of 10 ng/L while the RL is 20 ng/L. USGS scientists
occasionally report results below the MDL or RL when they believe they have likely detected the
compound in the sample. Nevertheless, the result is less certain, and a qualifier is attached to these
values in publicly available databases (CD3 and CEDEN) to indicate that the result is estimated. For
results below the MDL, the qualifying flag of “JDL” is used, and for results below the RL, the
qualifying flags of “JA” or “J” are used to indicate that they are estimates, with uncertainty in their
21quantification. This practice of listing values despite lack of certainty in their quantification is viewed
by many chemists and statisticians as the best way of dealing with results below or near the detection
or quantitation limit. If results below the MDL or RL are left unreported, it can result in bias if, for
example, these observations are left out or substituted with an arbitrary value such as half the MDL
or RL when calculating a mean. The project team chose to show results below the quantitation limit.
In instances where results have a “J” flag or its equivalent, data users should interpret this as follows:
“An estimated concentration for the compound was provided, but below the specified detection or
reporting quantification limit. Any such amount shown should be considered an estimate.”
Aquatic Toxicity Thresholds
To determine whether contaminants were present in concentrations that are ecologically relevant,
i.e., those which may cause harm to aquatic biota, we compared observed concentrations with
thresholds for aquatic toxicity gathered from several sources. The presence of a compound above a
threshold is not necessarily evidence that harm is taking place, but rather it is a first step in a process
for interpreting the data and evaluating relative ecological risk.
Sediment toxicity benchmarks for pesticides and degradates were obtained from recent work by
USGS scientists (Nowell et al. 2016). This work contains two sets of thresholds:
Likely Effect Benchmark (LEB) - pesticide concentration in whole sediment above which
there is a high probability of adverse effects on benthic invertebrates; and
Threshold Effect Benchmark (TEB) - concentration below which adverse effects to
benthic invertebrates are unlikely.
These thresholds were determined for two species of freshwater invertebrates, Hyalella azteca (an
amphipod) and Chironomus dilutus (midge larvae), and an “integrated benchmark” was calculated
based on the lower of the two. These benchmarks were developed for freshwater environments;
similar benchmarks for marine or estuarine environments are not available.
The benchmarks are reported in units of micrograms per gram of organic carbon (µg/g OC). The
lab measurements for this study reported contaminants on a dry weight basis. The analytical results
were converted to an organic carbon-normalized sediment concentration (Csed-TOC) according to this
equation:
where Csed-dw is the concentration of a compound in sediment on a dry weight basis (µg/g dw) and
fOC is the fraction of the sediment that is organic carbon, expressed as a percentage or unitless ratio.
22To determine whether pesticides or their degradates in water may pose a threat to aquatic life, we
compared observed concentrations to aquatic life benchmarks published by the USEPA’s Office of
Pesticide Programs (USEPA 2017). These comparisons should be interpreted with caution,
however. The benchmarks published by USEPA were developed for freshwater environments;
similar benchmarks for marine or estuarine environments are not available. Where aquatic life
benchmarks were not available, we compared observed levels of contaminants with aquatic toxicity
thresholds drawn from the scientific literature or developed by the European Chemicals Agency
(ECHA).
For fragrance ingredients and other emerging contaminants in sediment and water, levels were
compared to available marine predicted no effect concentrations (PNECs) from the literature and
the ECHA. When PNEC values were not found, the lowest available concentration was used, such
as a median effective concentration (EC50) or the no observed effect concentration (NOEC). For
example, for the disinfection byproduct bromoform, we compared observations against the EC50 for
fish from a report by the Battelle Corporation’s Marine Research Lab (Gibson et al. 1979). For the
nicotine metabolite cotinine, we obtained a more recent PNEC calculated by French scientists
(Gosset et al. 2017). These values are shown in Table 6.
For a limited number of compounds, water and sediment results could also be compared to
monitoring trigger levels (MTLs) recommended by California’s Ambient Ecosystems CECs
Advisory Panel (B. Anderson et al. 2012; Dodder, Mehinto, and Maruya 2015), which are protective
benchmarks based on potential ecological and human health risks. MTL exceedances can indicate a
need for additional monitoring but do not necessarily indicate a toxicity concern.
Results and Discussion
Complete analytical results and ancillary data are publicly available via the Contaminant Data,
Display and Download Tool (CD3, h ttps://cd3.sfei.org/) and the California Environmental Data
Exchange Network (CEDEN, h ttp://ceden.org/). Key information for water quality managers is
summarized below. See Appendix C for instructions on how to download the data from this study.
Water Quality Conditions
Samples were collected in June and July 2017, a time in which freshwater inflows to the Bay are at
their minimum. Figure 3 shows the tide elevation in South San Francisco Bay, measured at NOAA
tide station 9414523 in Redwood City. Red dots on Figure 3 show the tidal elevation at the time of
sampling. Samples were collected during a variety of tidal conditions on June 5, 6, and 7 and on July
17, 18, and 19. June samples were collected during slack tide at higher low water. July samples were
collected on the rising phase of the higher high tide when water is generally flowing toward the
shore.
23Figure 3. Tidal elevation during sampling events (red dots) in June and July 2017.
All sampling occurred during the summer dry period, with no measurable precipitation for two
months prior to sampling (Figure 4). In June, the San Jose Santa Clara Regional Wastewater Facility
discharges an average of 100 MGD to the Extreme Lower South Bay, with other nearby plants
discharging smaller inflows (Figure 2).
During the June sampling events, salinity averaged between 18 to 20 parts per thousand (ppt) and in
July between 22 to 24 ppt (Figure 4). This gives a rough indication of the source of water in the
region. Pacific Ocean water has a salinity of about 35 ppt, while river water is generally less than 1
ppt. We can roughly estimate that in June, about 50 to 60% of the water is from the ocean, while the
remaining water is from rivers and wastewater discharge. In July, South Bay water is closer to 60%
to 70% ocean water. Salinity also varied tidally, with higher conductivity measured on the incoming
tide as saltier seawater moved further into the South Bay, and lower conductivity during outgoing
tides when fresher water is pulled out of the South Bay.
24Figure 4. Hydrologic conditions during the sampling period: Precipitation (top) and salinity measured at the
Dumbarton Bridge (bottom).
Daily precipitation totals as measured at NOAA weather station at San Francisco Airport,
https://www.ncdc.noaa.gov/cdo-web/datasets/GHCND/stations/GHCND:USW00023234/detail
Salinity measured at SFEI sensor at the Dumbarton Bridge, https://www.enviz.org/nutviz/
Pesticides in Sediment
Bifenthrin was the only current-use pesticide detected in bed sediment samples (Table 3). This
insecticide was present in the bed sediment at 3 of 12 sites, in concentrations ranging from 1.3 to 1.7
µg/kg dw. Expressed as a ratio of organic carbon in the sediment sample, bifenthrin concentrations
ranged from 0.098 to 0.13 µg/g OC.
Bifenthrin is a pyrethroid insecticide that is widely used on crops and around homes to control a
variety of insect pests. It has a low water solubility and therefore is more likely to be found in
sediment. Bifenthrin is the most frequently detected pesticide in freshwater aquatic sediment in
California (Ensminger et al. 2013) and is toxic to aquatic invertebrates at very low concentrations.
The EC50 for bifenthrin for the invertebrate Hyalella azteca has been calculated at 3.3 ng/L (Weston
25and Jackson 2009). Further, a study of urban creeks draining to northern San Francisco Bay linked
bifenthrin in water samples with paralysis of the Hyalella azteca (Weston, Chen, and Lydy 2015).
Measurements of bifenthrin in South Bay margin bed sediment did not exceed ecotoxicology
thresholds for sediment. The highest measured concentration of bifenthrin in bed sediment was
0.13 µg/g OC, just below the threshold effect benchmark (TEB) of 0.17 µg/g OC (Nowell et al.
2016). However, bifenthrin concentrations measured in the Bay margin sediment, on a dry-weight
basis, ranged from 1.3 to 1.7 µg/kg dw, about 25 to 30 times greater than California’s monitoring
trigger level (MTL) of 0.052 µg/kg dw for bifenthrin in coastal embayment sediments (P. D.
Anderson et al. 2012). MTL exceedances can indicate a need for additional monitoring, but do not
necessarily indicate a toxicity concern.
Bifenthrin has been detected in sediment samples in other recent studies conducted in the Bay and
California. Previous monitoring of open Bay sediment detected bifenthrin in 23 of 77 samples, with
a maximum concentration of 1.0 µg/kg dw, slightly lower than the concentrations measured in this
study (summarized in Klosterhaus, Yee, et al. 2013). In addition, recent monitoring of the Russian
River found bifenthrin in bed sediment at a maximum concentration of 1.4 µg/kg dw (Maruya et al.
2018). This is similar to the maximum sediment concentration found in the South Bay margins of
1.7 µg/kg dw. In contrast, monitoring in southern California coastal sediments detected
concentrations up to 65 µg/kg dw, with the highest concentrations reported near urban stormwater
discharges (Lao et al. 2012; Maruya et al. 2016; Ensminger et al. 2013; Taylor et al. 2019).
26Table 3. Pesticides and degradates detected in bed sediment in South and Lower South San Francisco Bay margins, summer 2017.
Likely Effect Threshold Effect Number of
Number of Detection Median Maximum Maximum
Pesticide or Benchmark, Benchmark, Samples
CAS Number Use Detections Frequency Concentration Concentration Concentration
Degradate LEB* TEB* Exceeding
(n=12) (%) (µg/kg dw) (µg/kg dw) (µg/g OC)
(μg/g OC) (μg/g OC) TEB (n=12)
Bifenthrin 82657-04-03 Insecticide 3 25%Other pesticides and related compounds identified by the DPR monitoring prioritization model
were not detected in the South Bay margin samples. While fipronil and its degradates have been
observed in open Bay sediment (Sutton et al. 2017), they were not detected in the margin sediment
samples. This lack of detection may be due to the higher method detection limits for fipronil and
degradates in the present study. Broad screening methods for large numbers of analytes, such as the
pesticide methods employed in this study, are not always able to achieve the lowest method
detection limits for each individual analyte.
Unfortunately, we were not able to analyze for the presence of pyriproxyfen in bed sediment. This
compound was not detected in water, but its low water solubility suggests it may accumulate in
sediment. Pyriproxyfen mimics juvenile hormones in insects and is used to control a variety of pests.
Pyriproxyfen is toxic to benthic organisms at the relatively low concentration of 0.07 µg/kg dw
sediment (ECHA 2012). Therefore, future analyses of sediment in the Bay and Delta should strive to
include this compound.
Legacy (not current-use) organochlorine pesticides were not the focus of this study, but the
laboratory included results for DDT and its degradates as part of its schedule of pesticides analytes.
The legacy pesticide DDT was found in 10 of 12 bed sediment samples, or at a detection frequency
of 83%. Two DDT degradates, DDD(p,p') and DDE(p,p') were found in 83% and 100% of
sediment samples, respectively. This is not a surprising result, as these organochlorine pesticides
were once widely used and are highly persistent. While DDT has been banned for about 40 years, it
has been consistently found in Bay sediment since then. A 1998 review of Bay sediment quality
found that organochlorine pesticides “persist in soils that wash into the Bay, and are still commonly
detected at elevated concentrations in sediments and tissue from throughout the estuary” (Hunt et
al. 1998). More recent observations in bird eggs collected from San Francisco Bay nesting sites
between 2002 and 2012 indicate DDT remains present in the region, with declining concentrations
observed at some sites (Ross et al. 2016).
Pesticides in Water
Table 4 summarizes the results for those pesticides and pesticide degradates that were detected in
South Bay margin water samples. Of the 172 pesticide analytes, 18 were detected in filtered water
samples, and none were detected in suspended sediment. Ten analytes were detected in more than
half of the samples. Below, we briefly discuss the noteworthy results for several individual analytes.
Three analytes, carbendazim, fipronil, and imidacloprid, were detected at levels greater than USEPA
aquatic life benchmarks.
28Table 4. Pesticides and degradates detected in water in South and Lower South San Francisco Bay margins, summer 2017. Those in bold were detected at concentrations greater than benchmarks.
Number of
Lowest USEPA Frequency of
Method Number of Detection Median Maximum Most Sensitive Samples
Aquatic Life Samples
Pesticide or Degradate CAS Number Description Detection Detections Frequency Concentration Concentration Ecotoxicity Data Exceeding
Benchmark Exceeding
Limit (ng/L) (n=12) (%) (ng/L) (ng/L) Considered Benchmark
(ng/L) Benchmark (%)
(n=12)
Azoxystrobin 131860-33-8 Fungicide 3.1 5 42%The fungicide carbendazim was found at 10 of 12 sites. Measured concentrations were highest in the
Extreme Lower South Bay (Figure 5). A single sample, with a concentration of 1,000 ng/L,
exceeding the USEPA aquatic life benchmark of 990 ng/L for chronic toxicity to fish. All other
observations were below this threshold, with a median concentration of 170 ng/L.
Carbendazim is currently used as a biocide in paints and coatings. It is also a degradate of the
fungicide thiophanate-methyl (CAS #23564-05-8), which is used on a variety of fruit, nut, and root
crops, and in turf and landscaping products in California. Carbendazim, as an active ingredient, has
not been registered for use in California since 1989 (DPR 1999). Another of carbendazim’s parent
compounds, the fungicide benomyl, is also no longer in use since manufacturers voluntarily
withdrew its USEPA registration in 2001.
Carbendazim has not been previously monitored in the Bay but has been frequently detected by
monitoring studies elsewhere. It was detected in four of five Russian River monitoring locations at
levels up to 200 ng/L (Maruya et al. 2018). Concentrations of up to 750 ng/L were reported among
urban freshwater streams in California examined by the USGS; in contrast, one agricultural stream
had carbendazim concentrations of up to 4,900 ng/L (Sanders, Orlando, and Hladik 2018). In a
broader survey of surface waters in 11 midwestern states, USGS scientists found that carbendazim
was among the most commonly detected pesticides (Nowell et al. 2018).
30Figure 5. Measured concentrations of the pesticide carbendazim in South and Lower South Bay margin water
samples. Method detection limit = 4.2 ng/L.
The insecticide fipronil was found in 5 out of 12 water samples (Figure 6). Fipronil has become a
widely used replacement for urban uses of organophosphate insecticides, and is the active ingredient
in many products to control fleas, ants, and termites. In California, its main uses are in products for
pets and in and around structures. Outside of the state, fipronil is used on some crops, however,
these uses are not permitted in California (DPR 2017). Globally, concern over the effects of fipronil
on aquatic life and honeybees has led to product bans in China, France, and Italy (Parsons 2011).
Fipronil in water has been linked to toxicity in benthic invertebrates. A 2013 study linked fipronil
and its sulfone degradate to toxic effects (paralysis) in the freshwater midge larvae Chironomus dilutus
(Weston, Chen, and Lydy 2015). In our study, the highest concentration of fipronil in South Bay
water samples was 12 ng/L, exceeding the USEPA aquatic life benchmark of 11 ng/L for chronic
toxicity to freshwater invertebrates. The median concentration of fipronil was 5.1 ng/L. Three
fipronil degradates were also found in water, but they did not exceed USEPA aquatic life
benchmarks or more recently published ecotoxicity thresholds (Weston and Lydy 2014). Neither
fipronil nor its degradates were found in sediment.
31Previous open Bay monitoring did not detect fipronil in water (dissolved phase; reporting limit 2
ng/L) but did find these compounds in sediment, with concentrations up to 0.56 µg/kg dw for
fipronil sulfone (Klosterhaus, Yee, et al. 2013). Fipronil and its degradates have been detected in Bay
tributaries in concentrations that exceed the USEPA aquatic life benchmark for chronic toxicity to
freshwater invertebrates (Ensminger et al. 2013). Recently, fipronil was also detected in wastewater
effluent from eight plants discharging to the Bay (Sadaria et al. 2017).
Figure 6. Measured concentrations of the pesticide fipronil and degradates fipronil desulfinyl, fipronil
sulfone, and fipronil sulfide in South and Lower South Bay margin water samples.
In California, fipronil has been detected in surface water samples from around the state. DPR
reviewed monitoring results from 2008 to 2013 and found that 46% of the urban California streams
that were sampled had fipronil concentrations above USEPA aquatic life chronic benchmark values
(Budd et al. 2015). The recent USGS study of 12 freshwater California streams frequently found
fipronil and degradates during repeat water sampling at four of six urban sites, though rarely at
agricultural sites; fipronil was often detected at levels exceeding the USEPA aquatic life benchmark
(Sanders, Orlando, and Hladik 2018).
32You can also read