Development Proposal and Environmental Management Plan November 2020 - Mountain Stream Fishery Pty Ltd 38036 Tasman Highway, Targa
←
→
Page content transcription
If your browser does not render page correctly, please read the page content below
MSF DPEMP                                               November 2020

Development Proposal and Environmental Management Plan
                                  November 2020

                      Mountain Stream Fishery Pty Ltd
                       38036 Tasman Highway, Targa

Report to
Board of the Environment Protection Authority

Prepared by:
Nick Butler- Hatchery Manager
Rebecca Kelly- isNRM Pty Ltd
Dr Darcie Leong- Darcie Hunt Consulting
Dr Alex McLeod- Tarkarri Engineering Pty Ltd
Douglas Ford- Pit & Sherry (Operations) Pty Ltd

                                               1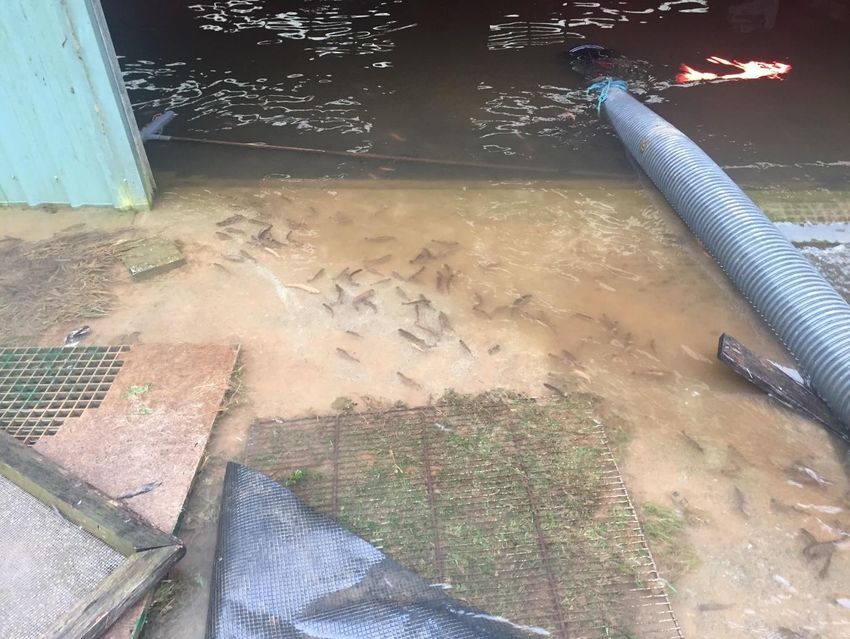
MSF DPEMP                                                                      November 2020

Executive Summary
Mountain Stream Fishery is a flow through aquaculture facility that currently operates under
a production limit of 50 tonnes per annum. This DPEMP is requesting for the limit to be
increased to 181.5 tonnes per annum with the existing infrastructure on site. This proposed
maximum annual production is approximately equal to its proposed maximum standing
biomass based on the farm size of 5650 m2. The facility has already been operating above the
permitted limit for annual production.
Following the establishment of the Finfish Farming Environmental Act 2017, the current
annual production limit was transferred from the Permit DA5.97.160 (see Appendix 1), issued
by Launceston City Council on 11th September 1997 (as amended on 14th October 2002) to an
environmental licence issued by the Director, EPA. MSF is now seeking to increase its
production limit from 50 tonnes per annum to 181.5 tonnes per annum and to install a drum
screen on the production tanks (tanks were installed and commissioned in 2017).
Two key issues have been highlighted by the EPA to address in this document:
   1. Potential water quality impacts on the St. Patrick River associated with proposed
      discharge of effluent to surface waters.
   2. The risk of translocating or releasing of pests and pathogens, and potential impacts on
      aquatic ecosystems.
A detailed analysis of monitoring data for the inlet, outlet and mixing site relative to the
proposed site- specific trigger values is provided. This analysis shows:
   •   The proposed site-specific trigger values are currently met at both the outlet and
       mixing zone site (250m downstream) for NOx, nitrate, TSS and conductivity. The site
       acts as a sink for TSS in times of high sediment concentrations in the river.
   •   TP, TN, TKN, nitrite and nitrate all exceed the proposed site specific trigger values but
       are of the same order of magnitude.
   •   Effluent DRP and ammonia are significantly elevated, with median concentrations an
       order of magnitude higher than the site-specific trigger value at both the outlet and
       the mixing zone site.
The similarity between the North Esk River (at Ballroom) and the inlet at MSF validates the
use of the 80th percentile of the MSF inlet samples as the reference condition. It is proposed
that 250 m downstream of the outlet of the farm is monitored and assessed against
performance trigger values. The recommended trigger values (as 80 th percentile of inlet
water) are provided in this report.
The decrease in pollutant concentration after the commissioning of the drum filter will be
assessed with data collection for 12 months. It is expected that the use of a drum filter and
installation of twenty additional aerators are likely to increase the dissolved oxygen
concentration and increase water quality.
The site is in a remote rural area and while the closest neighbour is 200 m from the boundary,
the likelihood of noise disturbance will be minimal. Downstream there is the Myrtle Park
Campgrounds which is of local recreational importance to the community. In an external air

                                              2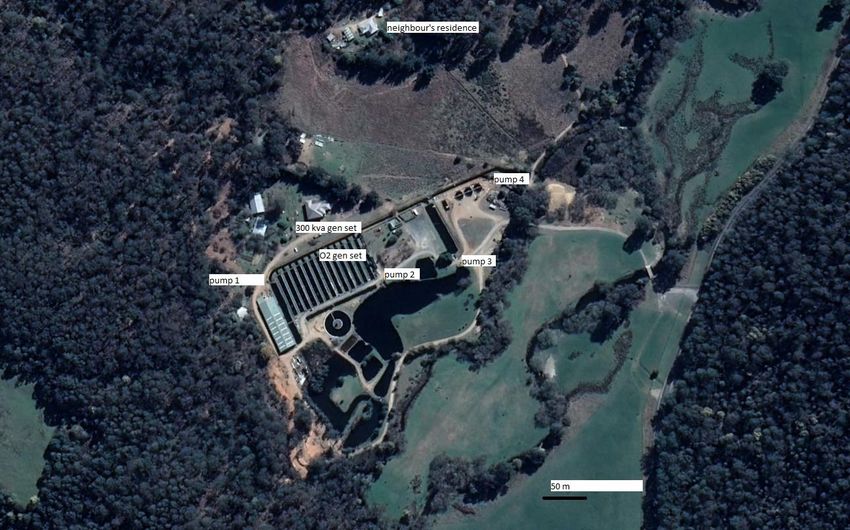
MSF DPEMP                                                                    November 2020

dispersion assessment, potential odour sources were identified and published emission rates
used to model emissions from the hatchery using CALPUFF. The model predicts that the odour
concentration exceeds the criterion of 2 OU along the southern boundary. Therefore, the site
would be non-compliant with the EPPair. The maximum predicted concentration at or beyond
the boundary was predicted to be lower than 6 OU.
There is limited risk of flooding. There are no conservation reserves, no High-Quality
Wilderness areas, no sites of geo-conservation significance, and no conservation covenants
nearby. Sections of the St Patricks River upstream and 700 meters downstream are classified
as high RS Conservation Management Priority. There are no plans for vegetation clearing or
burning that may impact on vulnerable or endangered species such as the giant freshwater
crayfish (Astacopsis gouldi) or the Hydrobiid snail (Beddomeia ronaldi). The use of chemicals
on the site must be monitored and used according to MSDS or permits.
The PEVs identified for this area include a) protection of Aquatic ecosystems, b) Recreational
Water Quality and Aesthetics, c) Raw Water for Drinking Water Supply, and d) Industrial
Water Supply.
A list of alternative wastewater treatment options has been provided and two of these are
already underway at the time of preparing this document. They include the conversion of
Pond 21 to a settlement pond as well as the installation of a drum filter and sludge tanks.
At the time of preparing this document, MSF are also in the process of increasing biosecurity
protocol with the installation of a bio-secure check-in station for visitors and workers and a
truck disinfection station.
A list of commitments that Mountain Stream Fishery will adhere to have been collated in the
preparation of this document.

                                              3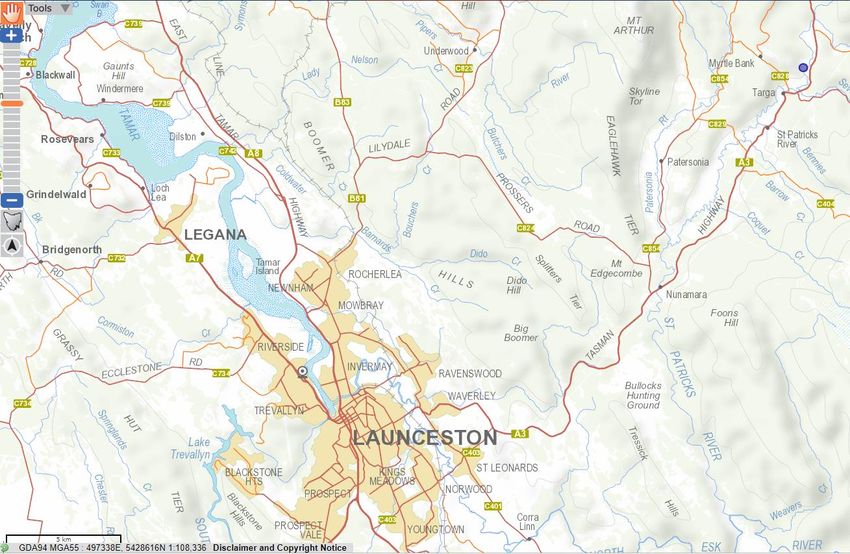
MSF DPEMP                                                                                                         November 2020

Table of Contents
Development Proposal and Environmental Management Plan ................................................ 1
  Executive Summary................................................................................................................ 2
  Table of Contents ................................................................................................................... 4
  List of Abbreviations .............................................................................................................. 6
  1. Introduction ....................................................................................................................... 7
     1.1 Proponent details......................................................................................................... 7
     1.2 Hatchery overview ....................................................................................................... 7
     1.3 Proposed activity ......................................................................................................... 7
     1.4 Key Issues ..................................................................................................................... 8
  2. Proposal Description .......................................................................................................... 8
     2.1 Existing Facility ............................................................................................................. 8
     2.2 Proposed changes to existing facility......................................................................... 17
     2.2 Construction ............................................................................................................... 19
     2.3 Commissioning ........................................................................................................... 19
     2.4 General Location Map ................................................................................................ 19
     2.6 Off-site Infrastructure ................................................................................................ 20
  3. Project Alternatives.......................................................................................................... 21
  4. Public Consultation .......................................................................................................... 22
  5. The Existing Environment ................................................................................................ 23
     5.1 Planning Aspects ........................................................................................................ 23
     5.2 Environmental Aspects .............................................................................................. 24
     5.3 Socio-economic Aspects ............................................................................................ 34
  6. Potential Impacts and their Management ....................................................................... 34
     6.1 Air Quality .................................................................................................................. 34
     6.2 Surface Water Quality ................................................................................................ 40
     6.3 Groundwater .............................................................................................................. 46
     6.4 Noise Emissions.......................................................................................................... 46
     6.6 Dangerous Goods and Environmentally Hazardous Materials .................................. 56
     6.7 Biodiversity and natural values .................................................................................. 58
     6.8 Marine and Coastal .................................................................................................... 66
     6.9 Greenhouse Gases and Ozone Depleting Substances ............................................... 66
     6.10 Socio-Economic Issues ............................................................................................. 67

                                                                   4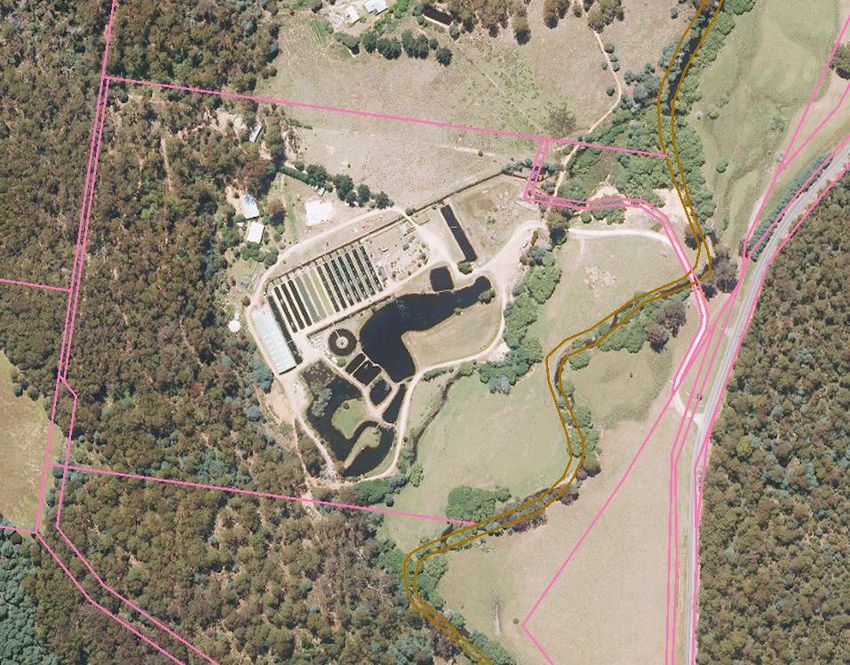
MSF DPEMP                                                                                                        November 2020

    6.11 Hazard Analysis and Risk Assessment...................................................................... 67
    6.12 Fire Risk .................................................................................................................... 67
    6.13 Infrastructure and Off-site Ancillary Facilities ......................................................... 68
    6.14 Environmental Management Systems ..................................................................... 68
    6.15 Cumulative and Interactive Impacts ........................................................................ 69
    6.16 Traffic Impacts ......................................................................................................... 69
 7. Monitoring and Review .................................................................................................... 69
    7.1 Site Specific Guideline Values (SSGV) Limits for Receiving Waters ........................... 69
    7.2 Biological Surveys....................................................................................................... 70
    7.3 Ongoing Water Quality Monitoring ........................................................................... 70
    7.4 Water Sampling Program ........................................................................................... 70
 8. Decommissioning and Rehabilitation .............................................................................. 73
 9. Commitments .................................................................................................................. 73
 10. Conclusion ...................................................................................................................... 73
 11. References ..................................................................................................................... 74
 12. Appendices ..................................................................................................................... 76

                                                                  5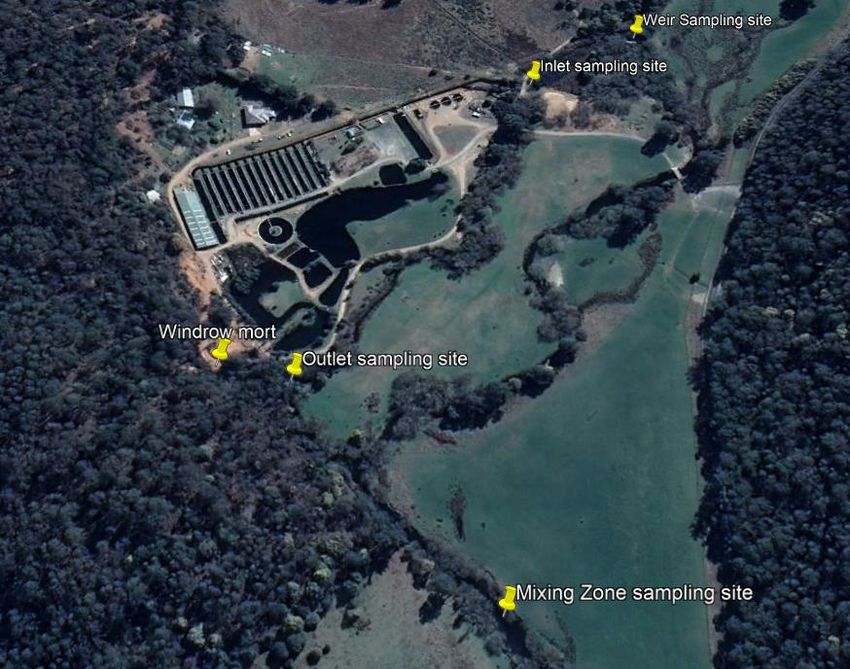
MSF DPEMP                                                                    November 2020

List of Abbreviations
  Abbreviation   Definition
     ASOP        Actuarial Standards of Practice
   AUSRIVAS      Australian Rivers Assessment System
     BOD         Biological Oxygen demand
      CAR        Comprehensive, adequate, and representative
      CAR        Comprehensive, adequate, and representative
     CFEV        Conservation Freshwater Ecosystem Values
     DGV         Default Guideline Value
      DO         Dissolved oxygen
     DoEE        Australian Government, Department of the Environment and Energy
    DPEMP        Development Proposal and Environmental Management Plan
    DPIPWE       Department of Primary Industries, Parks, Water and Environment
      DRP        Dissolved Reactive Phosphorus
     EMP         Environmental Management Plan
      EPA        Environment Protection Agency
     FFMP        Fish Farm Management Plan
      FT         Flow through
      FTE        Full time equivalent
      HA         Huon Aquaculture
      HA         Huon Aquaculture
      LCC        Launceston City Council
     MSDS        Material Safety and Data Sheet
     MSF         Mountain stream Fishery
      NOx        Nitrate + Nitrite
  NRM North      Natural Resource Management North
     NTU         Nephelometric Turbidity Units
     NWI         National Wilderness Inventory
     PEVs        Protected Environmental Values
      SOP        Standard Operation Procedure
     SSGV        Site Specific Guideline Values
      TKN        Total Kjeldahl Nitrogen
      TN         Total Nitrogen
      TP         Total Phosphorus
      TSS        Total suspended solids

                                                  6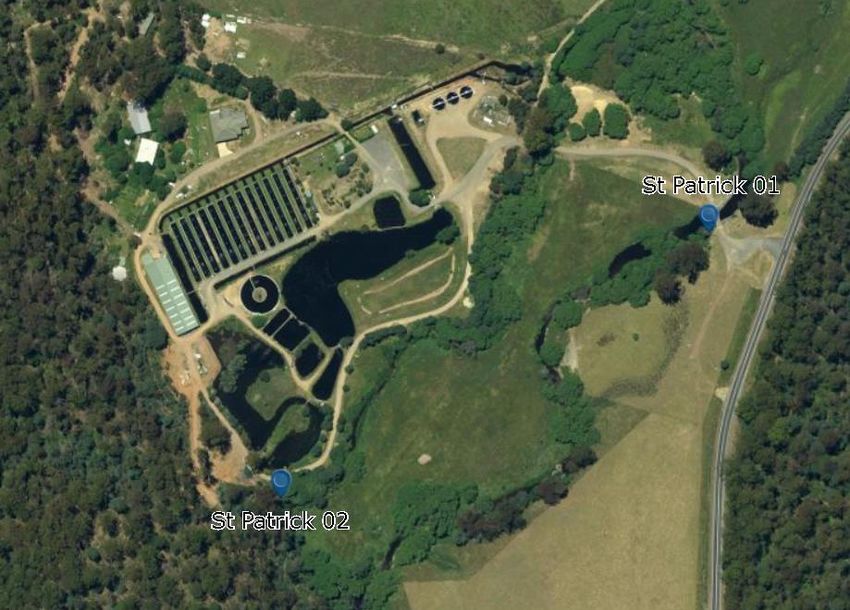
MSF DPEMP November 2020
1. Introduction
1.1 Proponent details
Title of Proposal Development Proposal and Environmental Management Plan
for Increase in Hatchery Production.
Proponent Details Mr Taras Malahoff
Mountain Stream Fishery Pty Ltd
145 Financial Pty Ltd, Level 1, 145 Hobart Road
Kings Meadows TAS 7249
ABN: 47 140 232 819
ACN: 140 232 819
Contact Person’s Details Nick Butler, Hatchery Manager
38036 Tasman Highway
Targa, 7259
0487 098 156
nickbutler@mountainstreamfishery.com.au
1.2 Hatchery overview
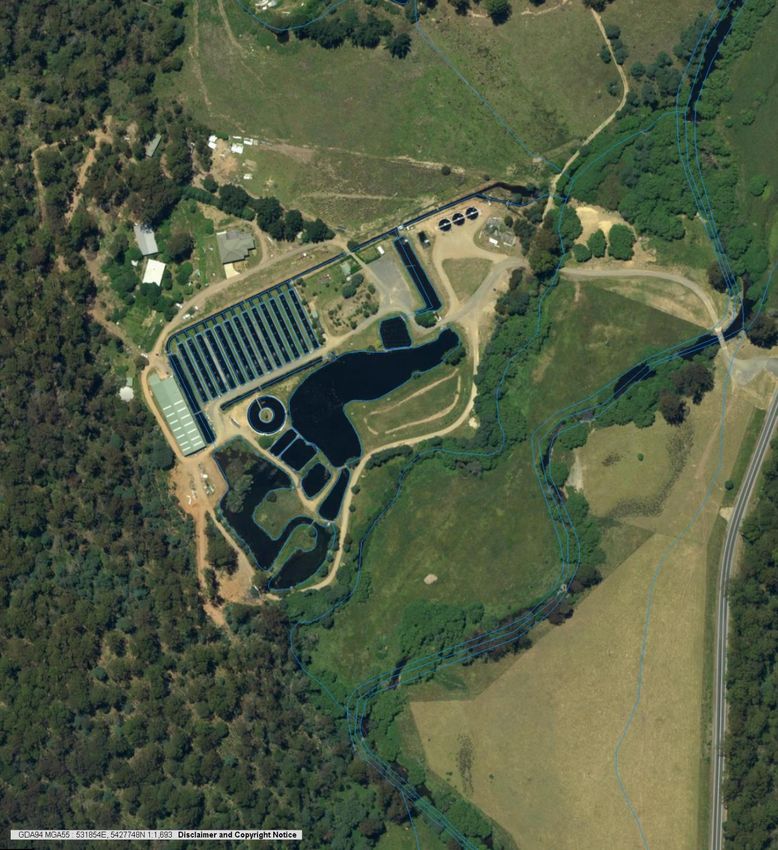
The Mountain Stream Fishery Hatchery (MSF) is located on the banks of the St Patricks River
just north of Myrtle Bank. The site is primarily a traditional flow-through aquaculture facility,
with water drawn directly from the St Patricks River. The site has 13 grow-out raceways, 7
recently destocked brood stock ponds, three concrete tanks and a hatchery building, which
includes office facilities. Until April 2018, a public fishing facility was operated, this is currently
closed and unlikely to be reopened due to biosecurity risks.
Brood stock for salmon and trout species are held at the facility and used for caviar production
and small runs of fish production. Eyed eggs are supplied annually from Huon Aquaculture Pty
Ltd (HA) owned hatcheries from around the state.
1.3 Proposed activity
It is intended that Mountain Stream Fishery will increase its production limit from 50 tonnes
per annum to 181.5 tonnes per annum and commission a drum screen to filter water from
the production tanks that were installed in 2017.
7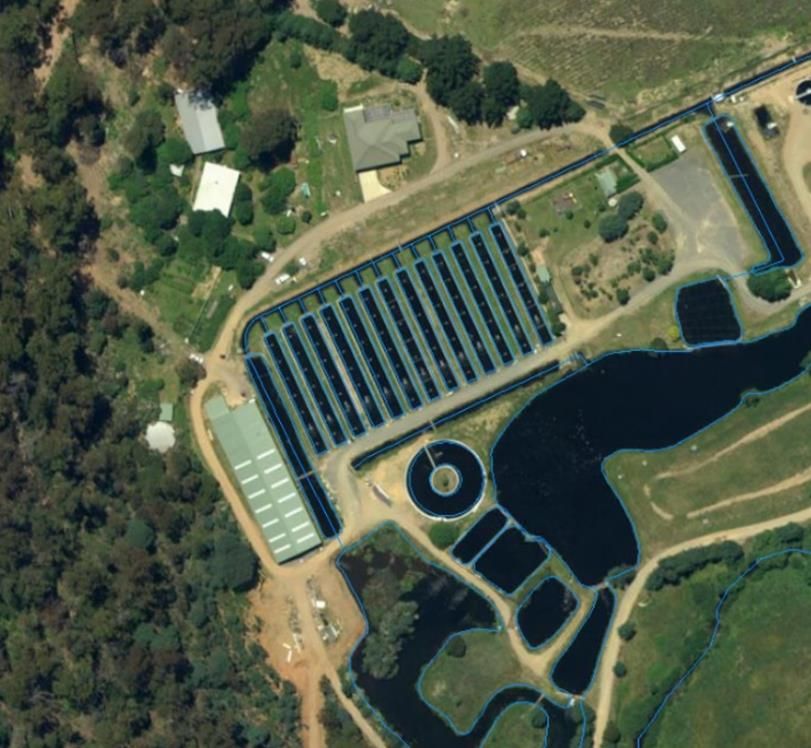
MSF DPEMP                                                                            November 2020

        1.4 Key Issues
There are two key issue that have been flagged for follow-up by the EPA, see Table 1.
Table 1: Key issues associated with MSF increase in production.

      Key Issues
 1.   Potential water quality impacts on the St. Patrick River associated with proposed
      discharge of effluent to surface waters.
 2.   The risk of translocating or releasing of pests and pathogens, and potential
      impacts on aquatic ecosystems.

2. Proposal Description

        2.1 Existing Facility
Production
MSF is atypical compared to other hatcheries in Tasmania. It is a particularly cold-water site
where the salmon grow slowly over 20-22 months from incubation to on-growing at sea. The
slow growing conditions enables the site to produce ‘S 1.5’ salmon (approximately 20-22
months old). The ‘S 1.5’ fish grow and increase in weight faster than the same size fish, when
put to sea, from recirculating hatcheries, at 12-14 months old. This compensatory growth in
the MSF salmon provides us with an advantage over recirculating hatchery grown fish. Fish
grown at MSF become the lead harvest fish for the following year, once sent to sea sites. Fish
are therefore not processed on site, but live transported to a ‘grow-out’ facility.
MSF’s role is to incubate eggs supplied by Huon Aquaculture from their Springfield hatchery.
These eggs are from selected stock from the Tasmanian selected breeding program. The eggs
that arrive anywhere from July to August are hatched and grown to 400g average size over a
20-22-month period. The eggs arrive at “eyed” stage of development and hatch after one
week of incubation. MSF has only two months (May and June) of the year with a single year
class on site and 2-year classes for the remainder of the year. MSF’s peak growing season is
from November to May which coincides with the low flow summer period, see Figure 2. The
water temperature range is from 3°- 22° Celsius. Peak biomass occurs in May before fish are
trucked offsite for on growing at sea. Total feed peaks in April, see Figure 3. Peak discharge
of nutrients in the discharge water coincides with peak biomass and feeding in late April.
The hatchery building contains the business office, staff amenities as well as the incubation
room, first feed tanks and first and second grow-out tanks and raceways, see Figure 1. There
is a small recirculation facility that includes temperature control, filtration and ultra-violet
water treatment for the incubation room. This facility hatches the eggs and grows the fry to
approximately 20 grams before transfer to outside grow out tanks and raceways. The
hatchery has a maximum capacity of 10 tonnes and peak capacity is at mid-May prior to
transfer to outside raceways.

                                                      8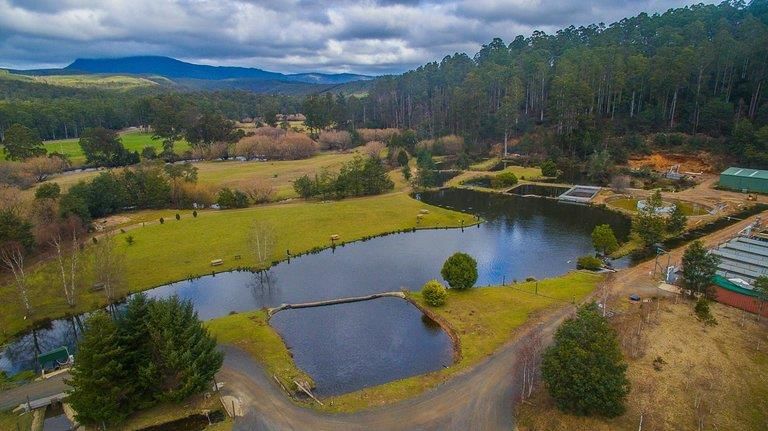
MSF DPEMP                                       November 2020

Figure 1: Hatchery building plan for MSF.

                                            9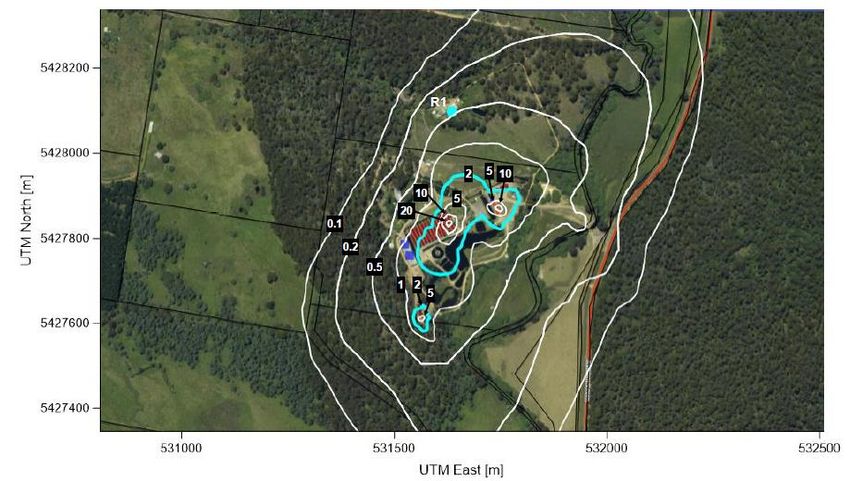
MSF DPEMP                                                                                   November 2020

MSF predominantly hand feeds the fish. The three concrete tanks have auto feeders. Monthly
weight checks are conducted to establish biomass figures. When conditions prevail, up to
(but no more than) 3% weight of biomass is fed daily. During summer there is low flow and
warm water carries less oxygen. During this time there are days where the fish are unable to
be fed. Each raceway and tank will receive differing amounts of feed depending in the
environmental conditions of the individual pond/tank. MSF does not feed when the water
temperature is above 18°C or if the dissolved oxygen is below 6mg/l. Hand feeding allows for
accurate control over feeding with minimal waste. Auto feeders are closely monitored to
ensure no wastage of feed. All feed contains faecal binder which allows for faeces to pass
through the raceways and tanks to settle in retention ponds before the water enters the
wetland.
The fish are vaccinated in September each year. Vaccines are two strains of Yersinia, Vibrio,
Aeromonas and pilchard Orthomyxovirus. These vaccines protect the fry, over summer, from
Yersinia ruckeri infection and then the other pathogens once the fish are at sea. MSF no longer
uses antibiotic-treated feed as yersinia infections are no longer seen over the growing season.
Chemically treated water is limited to foot bath and truck wash stations using Virkon. Virkon
is not returned to waterways. 1% Virkon treated foot bath water is changed every 2 days and
disposed of into the Enviro-cycle septic tank. The use of Formalin has almost been eliminated
as the eggs are transported to MSF at an advanced stage. Any formalin treated water is
collected in IBC pallecons and transported offsite to be disposed of appropriately.

Figure 2: Total monthly biomass (kg) for the last 12 months of fish kept in the raceways (pond 1- 13) and
concrete tanks (T1 – T3).

                                                      10
MSF DPEMP November 2020
Figure 3: Total monthly feed (kg) for the last 12 months fed into the raceways (pond 1- 13) and concrete tanks
(T1 – T3).
Water flow through farm
The water supply for MSF comes from the St Patrick River (see Figure 4 for a diagram of the
flow of water through the farm). MSF has a diversion weir on the St Patricks River which
diverts water down an existing flood channel to a second weir that directs the water into the
property at a rate of 43 megalitres per day. Flow is measured, twice per day, at the inlet flood
gate, see Figure 5. Under MSF’s Water Licence (licence 8089) flow is taken at the maximum
allowable daily limit in peak biomass situations. At times of high flow DPIPWE allows for
“opportunistic take’, MSF is allowed an additional 18 megalitres per day. The inlet flood gate
aperture is manually increased or decreased depending upon the depth of head above the
inlet pipe. Engineer, Mr Dale Luck, from Johnstone, McGee and Gandy Pty Ltd validated flow
chart, August 2020. Water is taken at the maximum daily amount once fish biomass surpasses
50 tonnes
Four new oxygenating “u-tubes” are being installed to increase the available oxygen for the
grow out raceways. This equipment will be used for 4 months from December to April each
season. Maximising oxygen in the raceways will help increase the dissolved oxygen in the
discharge water.
11MSF DPEMP November 2020
Figure 4: Site plan to show the direction of gravity-fed flow of water through the farm.
12MSF DPEMP November 2020
FLOW MLitres/day & m3/sec
10 & 0.12 20 & 0.23 30 & 0.35 44 & 0.51 60 & 0.69 80 & 0.93 100 & 1.16
1.00
ASSUMPTION: Flows unaffetced by upstream Culvert or Downstream Channel, 0.95
0.90
0.80 0.75
ML/d 30
Upstream Head (m)
0.70
0.60 10 20 30 44 60 80 100
0.50
0.40
0.30
0.20
0.10
0.00 0.15
0.00 0.10 0.20 0.30 0.40 0.50 0.60 0.70 0.80 0.90 1.00
Opening Height (m)
Figure 5: Chart of the flow of water given the upstream head (m) and opening height (m), provided by Johnston McGee and Gandy Engineers and Planners.
13MSF DPEMP November 2020
There is a drum filter at the inlet to remove leaves and other detritus that floats down the
river (predominantly feral willow leaf removal in Autumn), Figure 6. Detritus is collected at
discharge channel and removed annually. First intake water for fish production is a 15kW lift
pump for the three 200 m³ concrete fish production tanks, fish are stocked at no greater than
55 kg/m³ at peak production at the end of April each year.
From here the water flows to 13 production ponds. Production ponds vary in size from 270
m³ to 500 m³ and have outlet pipes that restrict flow at 30 L/s. Fish are stocked no greater
than 35kg/m³ at peak production. Inlet water then flows to hatchery building via the 75 L/s
hatchery header tank pump. The stocking densities are the RSPCA recommended limits for
the two differing types of grow out tanks/ponds. The tanks have a higher rate of water
exchange than the flow through raceways. This factor allows for higher biomass per kg/m³ of
fish in the tanks. These stocking densities are only achieved in the last month of the grow out
cycle prior to transport of the farm to sea.
Water passes through ponds 22, 21, the raceways and hatchery and flows into the retention
dam (formally public fishing dam). Water from the retention dam flows to ponds 15, 16, 17
(decommissioned), 18 and 19 respectively then through the wetland.
At the time of writing this report the non-production ponds were stocked as per Table 2:
Table 2: Stocking of non-production ponds as at October 2020, MSF.
Pond Number Individual size Species
Retention dam Unknown Unknown
Pond 15 1012 3kg Salmon
Pond 19 346 2kg rainbow trout brood stock
Pond 18 491 1.8kg Brook trout
Pond16 Empty
Pond 17 Empty
Pond 22 1986 1.5kg replacement brood-stock
salmon
Pond 21 158 2kg leucistic rainbow trout
These 7.907 tonnes of fish are important brood stock for the farm and are a source of genetics
for the Inland Fisheries Service. The wetland sweeps across the remainder of the farm and
water discharges into the flood channel which then connects to the St Patricks River. The trout
in pond 19 will be culled by the end of 2020 and salmon in pond 15 culled by the end of 2021.
Currently the site uses 43 ML of water per day. The water enters the site from the Inlet
channel (see Item 1, Table 3). The supply of water is gravity fed through the farm, except
during periods of low river flow. This usually occurs in the peak of summer and there are 2
pumps that are used to recirculate the fish-farm water (see Items 2 and 4, Table 3).
14MSF DPEMP November 2020
N
1
3 2
4
5
6 8
7 9
10
12 11
14 13
16 15
17 19
18 20
21
22
25 23
24
26
27
Figure 6: Site map of mountain stream fishery with 1) Weir sample location, 2) Wier, 3) Drum filter and lift
pump for tanks, 4) Cement tanks, 5) Quiescent pond, 6) Residence, 7) Diesel storage ,8) Drum filter, 9) Pond
22, 10) Oxygen generation shed, 11) Water recirculation pump 1, 12) Pond 21, 13) Water recirculation pump 2,
14) Raceways (ponds 1-13), 15) retention dam, 16) Header tank, 17) Pond 14, 18) Hatchery, 19) ‘U’ tubes 20)
Pond 15, 21) Pond 16, 22) Pond 17, 23) Pond 18, 24) Pond 19, 25) Wetlands, 26) Outfall from wetlands to flood
channel, 27) Effluent water sampling site.
Recirculation, if required, is 375 litres per second. Recirculation pumps are operated at any
time throughout the year on an as and when required basis. A visual determination of water
level and flow in the farm determines the operation of these pumps. Recirculation pump 1
has a maximum output of 300 litres per second and the pump 2 has an output of 75 litres per
second. Pump 1 has a variable speed drive and water is passed through a de-gassing unit to
remove carbon dioxide maximising oxygen uptake in the recirculated water. Pump 2 is a direct
15MSF DPEMP November 2020
drive unit and water is passed through an oxygen cone allowing for higher than ambient
oxygen levels in this recirculated water.
The recirculation is to re-use the water and is used minimally as nutrient concentration
occurs. Periods of low flow and low dissolved oxygen trigger the re-use of water. All water
exits the farm via the ‘wetland’.
The sites’ outfall pipe (see Item 6, Table 3) is the same, one metre diameter pipe as the inlet
pipe. This ensures that MSF replenishes the St Patricks River with the same amount as flows
into the Farm. Water sampling, for testing for increased effluent parameters, is taken from
just below the outfall pipe.
Table 3: GPS coordinates for water sources and pumps.
Item Easting Northing
1 Location where Inlet channel enters the property. 531829 5427940
2 Recirculating pump 1 531744 5427836
3 Carbon dioxide cascade column de-gasser 531711 5427915
4 Recirculating pump 2 531651 5427851
5 Oxygen Generator 531640 5427851
6 Outlet pipe 531618 5427622
Waste Management
Currently the site does not actively filter wastes from any of the tanks or raceways. Waste
from all areas accumulates in Ponds 15 through to 19, the retention dam and wetland
serpentine. Sludge is removed from these areas as and when required. Daily fish mortalities
are covered with native species wood chips in a wind-row system 22m above the river on the
southern boundary of the farm. MSF is preparing to run a trial on the processing of fish waste
into hydrolysate which can be used as fertiliser. This trial will require separate approval and
as such will not be detailed in this DPEMP.
If a mass mortality event occurs due to environmental factors (low dissolved oxygen or high
temperature water) MSF will undertake clean up and macerate the dead fish ready for
fermentation and, upon the success of the hydrolysate trials, conversion to hydrolysate will
occur. Mass mortality in excess of 500 kg will be transported offsite. General hard waste is
transported off site by J.J. Richards Pty Ltd monthly. For full details on the waste management,
see Section 6.5 Waste Management.
Energy Requirements
Current average energy requirements are 4020kWh per day. The largest daily use of power is
for the ‘Airsep’ oxygen generator. This runs constantly suppling oxygen to diffusers that
replenish dissolved oxygen to the farm. Power is also used to run pumps to supply the header
16MSF DPEMP November 2020
tank to the hatchery. The dwelling and sheds use average power. In the event of power failure
to MSF there is a 330kVA bunded Diesel generator linked to the grid to power MSF.
Operational movements
For 11 months of the year only one truck per week enters or leaves the site. This is to deliver
feed, freight, or collect waste from Launceston. For the remaining month 10 tankers per day
come from the channel district southern Tasmania to load fish at the end of the growing cycle.
This occurs for 6 days a week for up to 3 weeks around May annually.
Licensing
The existing activity operates under the Fish Farm licence 52 (see Appendix 2) which was
issued on the 1st of September 2018 and expires on the 31st of August 2021. The site also
operates under the Water Licence Number 8089 (see Appendix 3) which expires on the 30th
of November 2020. The following restrictions apply:
• Water use per day 43 ML
• Total water use per year 15695 ML
The site also operates under the Environmental Licence 9835/1 (see Appendix 4) which was
issued on the 24th April 2018.
2.2 Proposed changes to existing facility
MSF has grown in response to increases in biomass requirements, due to grow out contracts,
as and when required. Permit DA05.97.160 (issued by Launceston City Council on the 11 th of
September 1997 and amended on the 14th of October 2002) had a limit of 50 tonnes capacity
which had been surpassed before the current manager commenced his employment. The
capacity of the grow out ponds is limited to 30 – 35 kg per cubic metre of water in the flow
through system and 50 -52kg per cubic metre in the grow out concrete tanks. MSF has 5650
m³ and this gives MSF a maximum total production capacity of 181.5 tonnes. 2019 production
was the highest at 159.2 tonnes. MSF management do not plan to exceed 162 tonnes (current
contractual obligation) or 90% of capacity due to high risk of an adverse environmental impact
resulting in reportable mass fish mortality. The remaining tonnage of brood-stock and second
year class fish should not exceed 20 tonnes, MSF has reduced total biomass by culling surplus
fish in outlying ponds 16, 17, 18, 21 and the retention dam.
This DPEMP also proposes the installation and use of a drum filter, see Figure 7. Three
concrete tanks were commissioned in December 2017. The outfall from these tanks lead to a
quiescent pond where 90% of solids drop out of the water column before the wastewater
flows into pond 22. The installation of a 100µm drum filter will strip the waste from these
tanks (see section 6.5) and pump it to three 24000l storage tanks and solid waste will be
pumped off the farm by Veolia Pty Ltd.
17MSF DPEMP November 2020
MSF are also in the process of increasing biosecurity protocol by installing a bio-secure check-
in station for visitors, workers and a truck disinfection station and a hardwaste collection.
Construction on these structures were completed during the preparation of this DPEMP, in
2019.
At the time of preparing this report the drum filter for the three concrete tanks has been
installed but will not be commissioned until this DPEMP has been approved. This is the only
construction envisaged for MSF.
N
4
5
3
6 1
2
7
Figure 7: Site map of proposed changes with 1) Truck Disinfection wash down Station, 2) Hardwaste Collection
Point, 3) Visitor Check-in station, 4) Cement tanks (commissioned 2017), 5) drum filter, 6) sludge tanks, 7)
Visitor and workers bio-secure check in station.
18MSF DPEMP November 2020
2.2 Construction
The only construction to be undertaken is the three sludge tanks to capture the waste. A drum
filter was installed during the process of developing this report but will not be commissioned
until the DPEMP is approved.
2.3 Commissioning
Commissioning for the drum filter is straight forward and requires only the installing of a
pump and wiring to a 20-amp, 3-phase plug to start the operations of the drum filter.
Commissioning of the drum filter will occur after EPA approval.
2.4 General Location Map
The MSF hatchery and grow-out facility are located on the banks of the St Patricks River. The
land it occupies had previously been semi cleared for farming. The property is zoned as Rural
Resource within the Launceston City Council Interim Planning Scheme 2015.
Site address:
38036 Tasman Highway
Targa, Tasmania 7256
N
Figure 8: Location of the MFS hatchery site (blue dot) (sourced from DPIPWE (n.d); scale 1:3,385).
19MSF DPEMP November 2020
The farm is located on the western side of St Patricks River (as indicated by the brown
boundary lines in Figure 8. From the river, a flood channel delivers water to the farm, diverted
by a series of flood gates. Downstream of the farm, the water exiting flows into the flood plain
which then re-joins the river 100 m away.
The farm is surrounded by farmland, with large areas occupied by dense vegetation and the
closest residential structure is approximately 180 m from the edge of the farm due north.
Downstream 2000 m is the Myrtle Bank Picnic Grounds and campground. There are seven
residential structures adjacent to St Patricks River within 10km of the farm outfall. The land
adjacent to St Patricks on the western side is classified as public reserve.
The western side of the farm is bordered by a ten-metre cliff that would serve as shelter for
the farm (and any odours/noises that emanate from it).
2.6 Off-site Infrastructure
There will be no need for the construction of new off-site infrastructure or ancillary facilities
to allow the proposal to proceed.
20MSF DPEMP November 2020
3. Project Alternatives
The rationale for increasing the hatchery production at Mountain Stream Fishery is to make
full use of the available infrastructure and water to maintain commercial contracts with other
aquaculture companies. Currently there are no other potential site locations for the
additional production.
To minimise the impact of the farm’s activities on the St Patricks River, a list of alternative
wastewater treatment options has been explored to help to reduce nutrient levels in the
discharge waters (see Table 5). None of these options are seen as a complete reduction in
nutrient discharge but each should reduce the outfall nutrient discharge. Operationally,
empty ponds will need to be available on the farm as procedures such as stripping the fish
require emptying one pond of fish and moving to another. MSF intends to have 4 ponds empty
across the site at any one time through the grow out season. Feed will include faeces binder
which has been proven to increase nutrient retention after filtration (refer to presentation
‘Sustainable Hatchery Feed Technology’, Appendix 5.
Table 4: Improvement of filtration rates by faeces binder (sourced from Appendix 5).
Binder Improvement
Total suspended solids 40.4 %
Total phosphorus 39.3 %
Total Kjeldahl Nitrogen 16.8 %
N.B. Data are average for 30, 60, 100, and 200 µm.
Conversion to a full recirculating facility is not feasible. Discussions with Billund Aquaculture
CEO, Mr Patrick Tigges, have been ongoing. Initial estimates of four to six million dollars,
depending on the size of the facility (160 -240 tonnes per year) are a realistic opinion of Billund
Aquaculture . A recirculating facility would also grow fish at a faster rate, which paradoxically,
would lose MSF’s advantage of slow grown fish. A re-use of water system may be possible,
however MSF currently re-uses water via its “u-tubes” and recirculation pumps, so little is
required to achieve 20% re-use of current water supply per day.
Aeration of current empty deep ponds (15,16,17,19, and 22) by utilizing existing air blowers
and 20 new Clayton Force 7.2 Aerators will be conducted in the 2020-21 growing season.
Currently all grow-out raceways and tanks are heavily oxygenated with one hundred and fifty
six MBD600 0.4 mm Diffusers dispersing up to 600 litres per minute of oxygen to the fish as
they grow.
21MSF DPEMP November 2020
Table 5: Overview of alternative wastewater treatment options
Option Description Cost Advantages/ Disadvantages
Settlement Empty pond 21 of fish and Low A: Pond already exists.
pond utilise as a settlement pond. D: Ongoing maintenance will require a
This would need controlled truck to come on site to remove
flow and the settled sludge accumulated sludge. It is also possible that
emptying annually. this alone will not reduce the dissolved
nutrients.
N.B. This outcome has already been
achieved as of May 2019.
Drum filter Install a drum filter in the High A: Capturing solids is a very efficient way to
outlet raceway to collect reduce nutrients.
solids and filter the water. D: Very costly to install the technology and
would need to set up infrastructure to
capture solids and pay to truck it offsite. It
is also likely that the drum filter will not
remove dissolved solids.
N.B. this option is currently being
undertaken
Floating Utilise the space provided in Low A: A sustainable way to recycle nutrients.
wetlands the retention dam to install D: Would need to replace vegetation
floating vegetation to increase regularly. May not be effective at the
processing of nutrients. exiting flow rates on the farm.
Aquaponics The use of the fish ponds (and Medium A: A sustainable and economical way to
nutrients within) to grow recycle nutrients.
edible vegetation. D: Would require a lot of changes to the
infrastructure and take time to learn the
process. Not commercially viable.
Convert to Convert the farm into an High A: Full control of water usage and wastes
RAS system entirely closed Recirculated D: highly expensive and structurally
Aquaculture System. unfeasible.
4. Public Consultation
The DPEMP will be advertised in a local newspaper and made available for public viewing for
a period of 28 days. No other consultation is planned.
22MSF DPEMP November 2020
5. The Existing Environment
5.1 Planning Aspects
The site is located at 38036 Tasman Highway, Targa (see section 2.4 for full details). The land
is zoned as Rural Resource within the Launceston City Council Interim Planning Scheme 2015.
In the event of any structural additions or modifications of waterways, the Road and Railway
Assets Code (LCC Code E4) and Water Quality Code (LCC E9) may apply. As this proposal does
not require any construction or modification of existing waterways, these codes will not be
elaborated on.
The land on which the site is located is owned by the proponent, Mr Taras Malahoff. The
boundaries are shown by the pink lines in Figure 9. A ‘Right of Carriageway’ easement exists
on the eastern boundary which provides access to 38038 Tasman Highway, Targa. This
residence is 180 meters from the northern boundary of the site.
N
Figure 9: Location of the MFS hatchery site (sourced from DPIPWE (n.d); scale 1:3,385).
Existing buildings include a residential dwelling (residence of the owner/proponent); a
hatchery; a storage shed; a diesel storage shed; a gravity fed water tank next to the hatchery;
the 14 raceways; and three concrete tanks (recently commissioned). In early 2019, a concrete
truck disinfecting station was constructed and a small Visitor and Worker bio secure check-in
station (both for biosecurity reasons).
23MSF DPEMP November 2020
The site is surrounded by farmland and two residences (see section 2.4 for more detail).
There will be no modification to waterways/waterbodies at this stage in the proposal and as
such there will be no approvals will be required. There are no new dams proposed for this
DPEMP but dams will be maintained through desludging (see Section 6.5 Waste Management
for details).
The only filtering that is currently done on site using technology is conducted at the inlet (the
drum filter that removes solids prior to the concrete tanks). The filtrate from this filter is
discharged back into the flood channel that runs to the east of the farm. There are no other
forms of filtering on the farm. All water subsequently exits the farm from the outlet (through
the ‘wetlands’).
5.2 Environmental Aspects
Topography
Mountain Stream Fishery is located at Targa which is next to Myrtle Park. The site is in a valley
next to the St Patricks River that runs from Ben Ridge in the east (at an elevation of 925 m)
and runs 68 km downstream till it merges with the North Esk River (at 218 m). To the west is
the Mount Arthur Forest Reserve and to the east is the Mount Maurice Forest Reserve.
Climate
The local climate for Targa includes a long term average minimum temperatures of 5.9°C and
maximum temperatures of 14.8°C, see Figure 10. However, for 2019 the hottest temperature
so far for was 33.7°C (24th January 2019) and coldest was 1.6°C (31st March 2019). As with the
rest of Tasmania, Targa has four distinct seasons.
Mean Min. Temp. (°C) Mean Max. Temp. (°C) Mean Rainfall (mm)
25 140
120
20
Temperature (°C)
100
Rainfall (mm)
15 80
10 60
40
5
20
0 0
Figure 10: Monthly average minimum and maximum temperatures (°C) and monthly rainfall (mm) (summary
statistics from all years of data recorded by the Bureau of Meteorology (BOM, 2013).
24MSF DPEMP November 2020 Geology and geomorphology The area around the site is predominantly siltstone, with inter-bedded quartz-rich sandstone increasing towards the top. The area around includes parmeener and dolerite to the south and Devonian granite to the east (McClenaghan et al. 2011). Siltstone is defined as a sedimentary rock that is comprised of particles that can be between 0.002 mm and 0.06 mm. It is formed from the deposition of silt at the bottom of bodies of water (Open Learn, 2006). Soils The site has a rating of Nil to Low for the wind erosion hazard (DPIPWE, n.d.). This means there is a nil to low chance of the wind transporting soil particles to other areas of the site. The site is categorised as Nil for Soil Sodicity Hazard which means there is an appropriate amount of sodium held in the soil. There is a Very low risk of Hillslope erosion for most of the site as it is a flat area. On the western side of the site where there is a steep cliff, there is an extreme hillslope erosion hazard which means there is an increased risk of moving soil/debris. Approximately 1/3 of the site has a low risk for inland acid sulphate soils. Acid sulphate soils are harmless until exposed to air. When exposed to oxygen, a chemical reaction causes sulphuric acid to be released which can be detrimental to buildings, roads, and other structures (Queensland Government, 2017). Vegetation The vegetation on site is classified as non-forest as it is a residential property. To the west of the property is Tall Eucalypt forest and to the south are Low Eucalypt forest (DPIPWE, n.d.). Fauna There are no restricted, or threatened species currently recorded within a 4km radius of the site. Two species of conservation significance, water rat (Hydromys chrysogaster) and platypus (Ornithorhynchus anatinus) have been recorded on site. Groundwater See section 6.3. Groundwater. Natural Processes The site is classified as a Type 2 Bushfire Interface Area (DPIPWE, n.d.). This means that the area is a blend of vegetation and structures. The most recent bushfire occurred north of the site (
MSF DPEMP                                                                                 November 2020

There is a flood gate at the entrance to the facility which controls water intake in high flow
periods on the St Patricks River. In the unlikely event of increased water flow (or flooding)
from the St Patricks river, the flood gate is lowered to a point at which the water is diverted
over a spillway back into the St Patricks river.
In June 2016, the property experienced a one in one-hundred-year flood. The whole property
was inundated (see Figure 11), however, the production fish had already been sent to sea
sites minimizing the risk of escapees. The hatchery building lost in the order of 35 000 fish
that were < 40 g in size and an unknown quantity of brood stock escaped. Discussions with
the water management department of DPIPWE and Inland Fisheries Service concluded that
in that instance, no storm water protection would have stopped inundation of MSF. The only
remedial action that could be taken was to ensure all screens were clear of debris enabling
flood waters to subside through controlled outlets (see ASOP2807 Preventing Accidental
Release, Appendix 6).

Figure 11: The entrance to the hatchery shed inundated with water during the ‘100-year flood’ of June 2016.

                                                     26
MSF DPEMP November 2020
Conservation Reserves
There are no existing conservation reserves within 500 m of the site (DPIPWE, n.d.).
High Quality Wilderness Areas
High Quality Wilderness areas are defined in the Tasmanian Regional Forest Agreement as an
area having a National Wilderness Inventory (NWI) rating of 12 or larger. By this definition,
there are no High-Quality Wilderness Areas near the site (Parks and Wildlife Service, 2004).
Species, sites of areas of special conservation significance
The area is renowned for platypus and the farm is a site for the permitted capture of platypus
for Platypus House. Platypus House uses permits provided by Parks and Wildlife and Inland
Fisheries Service and believe MSF and the St Patricks River is a ‘wonderful environment’ for
platypus. An Australian Rivers Assessment System survey is conducted twice a year into
macroinvertebrates with an ‘A’ grade rating achieved both upstream and downstream of MSF
(see Appendix 7). A summary of this study is provided in ‘Pre-existing Monitoring Programs”
below.
Hydrological characteristics
The water flow for 2018 recorded in the St Patricks River is provided in Figure 12 as sourced
from the DPIPWE website. The 7Q10 was calculated for the years 2009 to 2018 was found to
be 0.0107 cumecs which occurred in January 2016 (data sourced from Water Information
Tasmania Web Portal (DPIPWE 2019).
27MSF DPEMP November 2020
Figure 12: Mean monthly flow (cumecs) with the minimums and maximums (whiskers) for 2018 at site 441-1 St
Patricks River @ Nunamara Offtake (data sourced from Water Information Tasmania Web Portal (DPIPWE
2019))
Pre-existing monitoring programs
A series of surveys was conducted by Todd Walsh of Kanunnah Pty Ltd during 2017 and 2018.
Two sites were chosen by Mr Wash for sampling that represented “upstream” of the site and
“downstream” of the site, see Figure 13. This report demonstrated that the sites (see Figure
13) both upstream and downstream had a rating of “A” and that a range of sensitive taxa
were recorded, including 7 families of Trichoptera (Caddis-fly) and 2 families of
Ephemeroptera (Mayflies). Overall, it was concluded that ‘There is no significant difference in
the health of the upstream or downstream sites according to AusRivAS results’ (Walsh, 2019).
The full report is available in Appendix 7 and a summary of the results is provided in Table 6.
Overall, the O/E score for both sites is A for all years with scores higher at the downstream
site than the upstream site for two out of the three collection periods. Thus, any changes in
species composition are having little to no impact on stream health. This is consistent with
achievement of both High Conservation Value and Slightly to Moderately Disturbed biological
DGVs for the North Esk river catchment.
28MSF DPEMP November 2020
N
Figure 13: Location of sites sampled in the AUSRIVAS survey conducted by Walsh (2019) (sourced from DPIPWE
(n.d); scale 1:3,385) .
Table 6: Summarised river health assessment data (AUSRIVAS) for St Patricks River riffle sites upstream of MSF
site (S01) and downstream of MSF site (S02) (Walsh, 2019).
Site Season O/E Taxa Band Rating
2017 Spring 1.03 A Similar to reference
2018 Autumn 1.00 A Similar to reference
St Patrick S01 2018 Spring 0.87 A Similar to reference
2019 Autumn 1.06 A Similar to reference
2019 Spring 1.13 A Similar to reference
2017 Spring 0.95 A Similar to reference
2018 Autumn 1.14 A Similar to reference
St Patrick S02 2018 Spring 0.95 A Similar to reference
2019 Autumn 0.87 A Similar to reference
2019 Spring 0.95 A Similar to reference
29MSF DPEMP November 2020
Water quality monitoring
Water quality monitoring commended in January 2017. Early data from January 2017 to June
2017 was collected fortnightly by staff from AST. Since then water quality samples have been
taken by MSF staff at varying time scales from quarterly in 2018, monthly from December
2018 to August 2019 to fortnightly during the production season (November to May) and
monthly through winter. Sampling has largely continued with the original sites AST data
collection with the exception of the mixing zone site. Originally this site was immediately
below the confluence of the flood channel with the St Patrick’s river. This site was
approximately 110m downstream of the outlet and did not allow for mixing to occur. Data
collection for the mixing zone did not occur in 2018/19, with samples taken at the inlet and
outlet only. Monitoring of the mixing zone recommenced in November 2019 with the
monitoring site moved further downstream to 250m below the outlet. The location of
monitoring sites used from November 2019 onwards is shown in Figure 14. This figure shows
an additional ‘weir sampling site’ that has recently been added (Aug 2020) to test the validity
of the ’inlet’ sampling site as upstream site unimpacted by the fishery.
Figure 14: Mountain stream fishery water quality monitoring sites from 2018 onwards
Grab samples are taken consecutively from the weir, inlet, outlet and 250m downstream site
starting at 8am with the last sample taken at around 9am from the 250m site. Water samples
are sent to AST labs for analysis. Samples are tested for Conductivity, Total Suspended Solids
(TSS), Ammonia, Nitrate, Nitrite, Nitrate+Nitrite, Total Nitrogen, Total Kjeldahl Nitrogen
(TKN), Biological Oxygen demand (BOD), Dissolved Reactive Phosphorus (DRP) and Total
Phosphorus (TP). Beginning in November 2020 Biological Oxygen Demand will be
30MSF DPEMP November 2020
discontinued and replaced with Organic Carbon analysis. Table 7 provides summary statistics
of this data for inlet, outlet and 250m locations. Figures showing all the data in detail are
provided in Appendix 9.
31MSF DPEMP November 2020
Table 7: Summary statistics for water quality samples from MSF site and mixing zone.
Inlet Outlet 250m downstream (mixing site)
Min Median 80th Max Min Median 80th Max Min Median 80th Max
percentile percentile percentile
Conductivity 30 53 57.8 74 45 55 61 73 47 56 61.2 69
TSS (mg/L) 1 2 4 31 1 3 4.8 7 1 2.5 4.2 5
Ammonia (mg/L) 0.0025 0.006 0.012 0.02 0.0025 0.17 0.386 0.59 0.008 0.125 0.236 0.37
Nitrate (mg/L) 0.063 0.16 0.24 0.4 0.11 0.21 0.298 0.37 0.13 0.22 0.26 0.31
Nitrate + Nitrite (mg/L) 0.065 0.17 0.24 0.4 0.12 0.23 0.32 0.38 0.14 0.225 0.268 0.35
Nitrite (mg/L) 0.001 0.001 0.003 0.006 0.001 0.007 0.012 0.047 0.001 0.005 0.013 0.038
TN (mg/L) 0.28 0.44 0.576 0.78 0.37 0.67 1 1.4 0.38 0.645 0.854 1.3
TKN (mg/L) 0.14 0.22 0.374 0.64 0.16 0.51 0.788 1.1 0.21 0.425 0.656 0.91
DRP (mg/L) 0.002 0.004 0.006 0.007 0.002 0.050 0.092 0.14 0.002 0.028 0.072 0.13
TP (mg/L) 0.005 0.01 0.020 0.04 0.01 0.09 0.134 0.191 0.02 0.046 0.104 0.177
BOD (mg2/L) 2.5 2.5 2.5 2.5 2.5 2.5 2.5 2.5 2.5 2.5 2.5 2.5
32MSF DPEMP November 2020
Protected Environmental Values (PEVs)
The Protected Environmental Values (PEVs) are the current uses and values of the waterway
and provide a strategic framework for management, (DPIPWE, 2005). St Patricks River is a
part of the North Esk Catchment and the following PEVs relate to surface waters flowing
through Private Land:
A: Protection of Aquatic Ecosystems
(ii) Protection of modified (not pristine) ecosystems
a. from which edible fish are harvested
B: Recreational Water Quality & Aesthetics
(i) Primary contact water quality (St Patricks River, North Esk at St Leonards, Dicksons
Land, Distillery Creek, Diddleum Plains, Corralinn Bridge, Scout Island at Corralinn,
Myrtle Park, Nunamara Bridge, Lady Nelson Creek, Dilston Falls, Waverly Dam, York
Town Rivulet)
(ii) Secondary contact water quality
(iii) Aesthetic water quality
C: Raw Water for Drinking Water Supply (Town water offtakes at Nunamara, Distillery Creek
and Watery Plains).
(ii) Subject to coarse screening plus disinfection D: Agricultural Water Uses
(i) Irrigation
(ii) Stock watering
E: Industrial Water Supply (Fish farming – North Esk)
That is, as a minimum, water quality management strategies should seek to provide water of
a physical and chemical nature to support a healthy, but modified aquatic ecosystem from
which edible fish may be harvested; that is acceptable for town drinking water at Nunamara,
Distillery Creek and Watery Plains (subject to coarse screening plus disinfection); that is
acceptable for irrigation and stock watering purposes; which will allow people to safely
engage in primary contact recreation activities such as swimming a St Patricks River, North
Esk at St Leonards, Dicksons Land, Distillery Creek, Diddleum Plains, Corralinn, Myrtle Park,
Nunamara Bridge, Lady Nelson Creek, Dilston Falls, Waverly Dam, York Town Rivulet and
secondary contact recreation activities such as paddling or fishing in aesthetically pleasing
waters and which is suitable for fish farming on the North Esk at Corralinn.
33MSF DPEMP November 2020
5.3 Socio-economic Aspects
There are 33 people who reside in Targa and the average age ranges from 40 to 59. Of the
residents in this suburb 82% own their own home versus 18% who rent. It has also been found
that 56% of residents are families and 44% are single (sourced from domain.com). There are
no special characteristics that may make the region more susceptible to the impacts from the
proposal.
Only one property is advertised at the time of preparing this report which is being sold for
$195,000 for ½ an acre. There are few local businesses in Targa, which includes a machinery
manufacturer and the Myrtle Park Camping ground down the road. The area is considered
rural and would not be a hub of activity for businesses that are able to employ locals.
6. Potential Impacts and their Management
6.1 Air Quality
Tarkarri Engineering was commissioned to conduct an air quality assessment as part of this
DPEMP. The report addressed the DPEMP guidelines that were issued by the EPA. A summary
of the key elements of the report can be found below and the report is attached as Appendix
8.
Air emission assessment summary
Potential odour sources were identified and published emission rates used to model
emissions from the hatchery using CALPUFF (see Figure 15 below and Table 4-3 of Appendix
8 for full details). Odour emission rates ranged from 1 OU/s (tanks) to 351 OU/s (sludge tanks).
The modelling predicts that the site will not be compliant with the EPPair, however, it has
been assessed that environmental nuisance or environmental harm is highly unlikely.
On the southern boundary, the 2 OU criterion is exceeded due to the proximity of the
composting windrow however, the adjoining land has no sensitive uses. The maximum
predicted odour concentration at the southern boundary was < 6 OU. Control of the
composting process to minimise the potential for upset such that the penetration of high
odour concentrations onto the adjoining land is minimal and is considered to not
unreasonably constrain the use of the adjoining land to the south.
34MSF DPEMP November 2020
N
Figure 15: Aerial view showing odour emission source locations.
Predicted odour emission concentrations are below the Tasmanian EPPair criterion level of 2
OUs at or beyond the northern, eastern and western boundaries of the land.
It was also found that:
• The dominant wind directions are Northerly and South-Westerly, year-round.
• Wind speeds are relatively low and show a small drop to typically below 2 m/s during
the night.
• Mixing height (height above ground that a pollutant will be mixed) is generally highest
in the mid-late afternoon at an average of about 1.5 meters.
• There are relative unstable atmospheric conditions during the day (higher
atmospheric motion) and less dispersive conditions at night.
Odour modelling methodology
Dispersion modelling of odour emissions from the MSF hatchery has been undertaken in
accordance with the Tasmanian Air Dispersion Modelling Guidelines, utilising model set up
parameters outlined in sections 4.2 of this report, to assess the predicted 99.5th percentile
ground level concentrations (glc’s) of odour (in odour units: OU) as required under schedule
three of the Tasmanian EPPair.
CALPUFF was utlised here for the modelling of odour emission from the MSF hatchery and to
generate the broad scale meteorological inputs to run CALPUFF, this study has used The Air
Pollution Model (TAPM). CALMET is an advanced non-steady-state diagnostic three-
dimensional meteorological model with micrometeorological modules for overwater and
35MSF DPEMP November 2020
overland boundary layers. The model is the meteorological preprocessor for the CALPUFF
modelling system.
Three modelling scenarios were considered as follows:
1. Emissions modelled with area sources (runways, tanks, sludge tanks and composting
windrows) and volume sources (hatchery, hatchery storage, feed store, drum filter,
and hard waste bin), (see Table 4-3 of Appendix 8).
2. Emissions from the compost windrow increased to 30 OU.m2/s across the entire
surface area to represent upset conditions.
3. Emissions from runways 12 and 13 and the sludge tanks increased as follows to
represent cleaning out of built up sludge.
Odour modelling results
The following figures present odour glc contours for each modelled scenario projected onto
an aerial view. All odour sources listed above were modelled. The glc for each contour (in OU)
is provided (white number on black background) with the 2 OU (regulatory criterion) contour
highlighted in turquoise. The location of the odour sources and nearest discrete receptor are
also shown.
Figure 16: Aerial view showing predicted 99.5th percentile 1-hour average glc odour contours (in OU), scenario
1.
36You can also read