Oodhazardreductioneffectiveness - MSc. Thesis M.A.(Marco)MendozaViteri - TU Delft Repositories
←
→
Page content transcription
If your browser does not render page correctly, please read the page content below
Salt marshes: habitat suitability and
                                flood hazard reduction effectiveness
                                MSc. Thesis

                                M.A. (Marco) Mendoza Viteri
Technische Universiteit Delft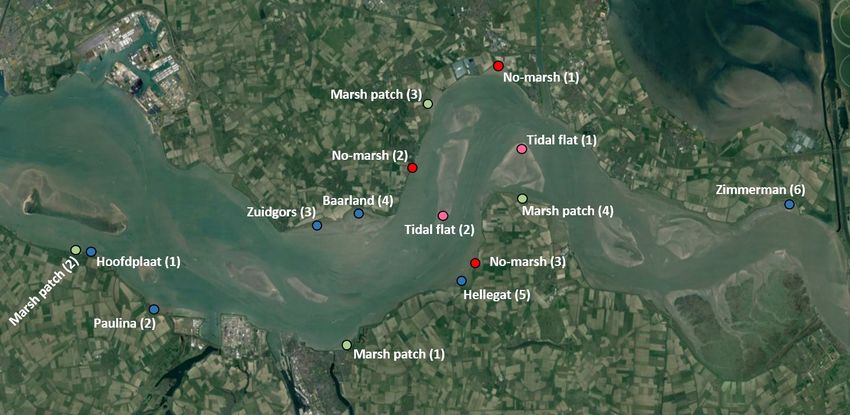
Salt marshes: habitat suitability
and flood hazard reduction
effectiveness
MSc. Thesis
by
M.A. (Marco) Mendoza Viteri
to obtain the degree of Master of Science
at the Delft University of Technology
to be defended publicly on Wednesday January 27, 2021 at 14:30 PM.
Student number: 4726073
Thesis committee: Prof. dr. ir. S.G.J. Aarninkhof TU Delft (chairman)
Dr. ir. V. Vuik TU Delft (supervisor)
Dr. ir. A.P. Luijendijk TU Delft/Deltares
Dr. ir. B.C. van Prooijen TU Delft
An electronic version of this thesis is available at http://repository.tudelft.nl/.
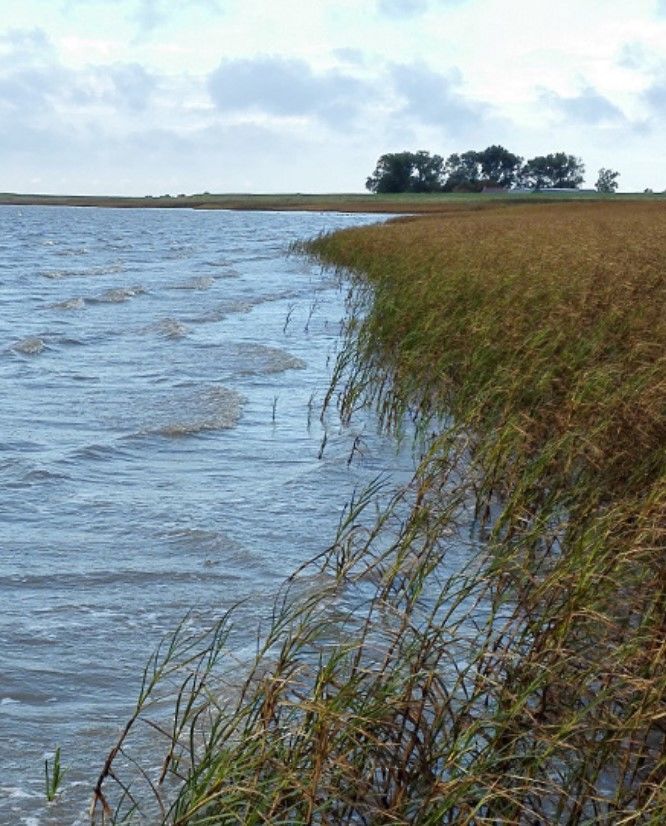
Cover: Salt marsh edge subjected to a flooding event. Photo retrieved from www.nioz.nl and captured by
Zhenchang Zhu.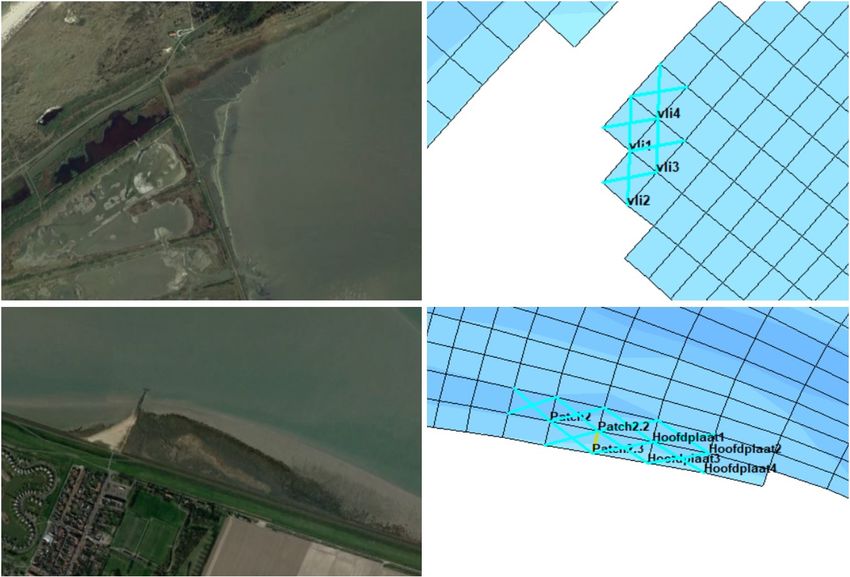
Preface
This document represents the final milestone to finalize the Master of Science program in Hydraulic Engi-
neering at the Delft University of Technology, as well as the end of a personal journey that started some five
years ago.

I would like to thank my graduation committee for all the input they gave me throughout the execution of
this thesis. Vincent, you have been incredibly supportive and enthusiastic from the first day until the last
one. Your constant (weekly, actually) guidance and advise during these unusual times were invaluable to me,
and I am truly grateful to have had you as my supervisor. Arjen, your early input and questioning of the topic
helped steer the scope of this research into what it eventually became. I’ll never forget your highly critical
comments given during our first meetings. Bram, even though you ’jumped in’ as the last piece of this com-
mittee in a later stage of the process, the knowledge you brought along shed the necessary light onto one of
the main topics of this topic. Hopefully this document serves you for future in-depth MSc’s, just as you have
suggested. And Stefan, in all of our meetings you have presented a broader perspective than the one I was
bringing forward, which helped me address the final aim of this research.

This thesis, and the overall journey over the past two years, would have not been possible without people who
I can very proudly call my friends. I have been lucky to count with them for several - and very much necessary
- study breaks, whether from a close distance (over a drink) here in the Netherlands, or from afar (still over a
drink) in Ecuador through a video call. Mayra, Tess, Vesna, Noor, Haisam, Fernando, Chris, Andrés, Sebastián,
Carlos, Jeroen, and Marnix: thank you all.

Last, but certainly not the least, I’d like to thank my family who has been a never-ending source of encour-
agement, support and joy some 9800 km away from what has been my home since August 2018. Sergio and
Isabel, thank you for your constant content sharing, without which I could not laugh as much. And to my
parents, Julio and Josa, I will be forever grateful to you for always encouraging me to pursue my personal and
professional goals. This journey would have been a completely different one without our countless hour-
lasting conversations over the phone. I am forever grateful to all, and the best is yet to come.

                                                                                  M.A. (Marco) Mendoza Viteri
                                                                                          Delft, January 2021

                                                      iii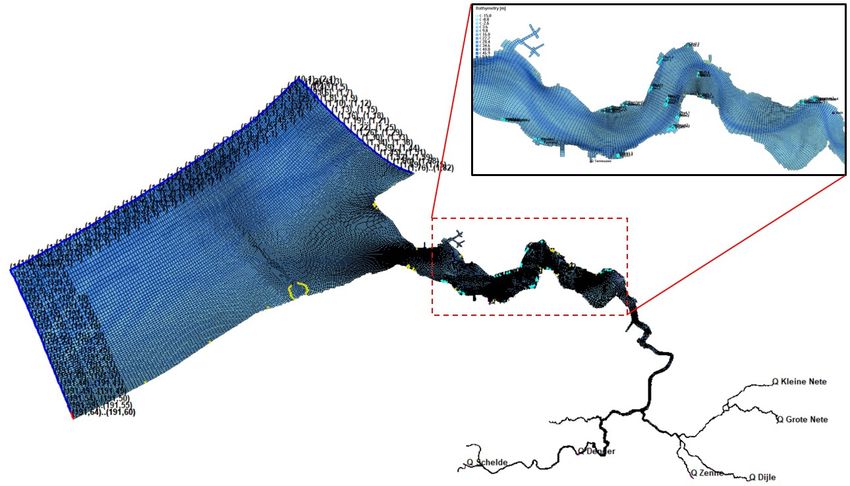
Summary
In recent years, nature-based solutions have gained recognition for their capacity to reduce flood hazard on
coastal communities. These coastal threats range from waves and tides, to future storm variability and pre-
dicted sea level rise. Vegetated foreshores are one of the measures that fall under this palette of solutions,
and are the focus of this thesis. While vegetated foreshores can be colonized by several plant species (mainly
mangroves or marshes), this thesis presents the study of phenomena occurring at salt marshes in an attempt
to determine which are relevant indicators that can predict the presence or absence of this ecosystem at a
given location. Moreover, the wave height attenuation capacity of such vegetated foreshores under different
conditions is also assessed for different effectiveness indicators, in a way the provides insight into whether
this habitat is not just feasible, but also effective as a coastal protection measure, with respect to wave height
attenuation.

The study is divided into two main sections, characterized by different methodologies: one treating the habi-
tat suitability and one addressing the effectiveness with respect to wave height attenuation rates. The habitat
suitability chapter evaluated daily conditions occurring during the months of Aprl-July (2020) at 28 differ-
ent sites located within two water systems in The Netherlands: the Western Scheldt and the Wadden Sea.
Locations were characterized by mature salt marshes, emerging salt marshes (patches of vegetation), bare in-
tertidal fringing flats, and intertidal shoals. The assessment was performed through numerical modelling of
occurring water levels (inundation-free periods), flow velocities, waves, and excess wave-induced bed-shear
stresses. Additionally, boundary conditions were affected in the model used to determine flow velocities in
the Western Scheldt in order to simulate storm conditions.

Results from the habitat suitability analysis suggest that within a water system with similar sediment compo-
sition, inundation-free period and daily-occurring hydrodynamics, such as flow velocities and wave height,
can explain the presence/absence of vegetation at most sites, while storm conditions can be the determin-
ing condition for vegetation absence in other locations. However, a generalization of these findings was not
possible between the two water systems, which was likely due to the several differences found between them.
This occurrence led to the introduction of the dimensionless wave-induced excess bed-shear stress factor,
where positive values indicate sediment re-suspension (erosion). Final results suggest that at sites across
both water systems where this dimensionless factor exceeded the 2.5, 4.2 and 5.3 values at 10%, 1%, and 0.1%
of the assessed time, respectively, were indeed non-vegetated sites. Furthermore, these conclusions indicate
the occurrence of sediment re-suspension during approximately 20% of the assessed time, at the most, in the
most energetic vegetated sites (Western Scheldt), and as little as 1% in the least energetic locations (Wadden
Sea). This analysis shows that a generalization of habitat suitability indicators has to include both external
loading and bed resistance, providing initial values for excess bed-shear stress occurrence.

The wave attenuation effectiveness assessment was likewise performed by numerical modelling of waves
propagating over a vegetated field, under different imposed boundary conditions. This assessment, assisted
by the spectral wave model SWAN, covered indicators such as relative vegetation height (h v /h), wave height
to water depth ratio (H /h) and tidal regime. Imposed boundary conditions consisted of deep (kh > 3.0) to
shallow water (kh > 0.3) conditions, as well as characteristic values described as ’Exposed coast, local wind
waves’ (H s = 1.0m; T p = 4.0s); ’Exposed coast, swell waves’ (H s = 1.0m; T p = 12.0s); and ’Sheltered coast, lo-
cal wind waves’ (H s = 0.5m; T p = 4.0s). Moreover, different surge levels and tidal regimes with characteristic
amplitudes were included so as to account for different water depths over the foreshore (micro = 0.5 m; meso
= 1.5 m; and macro = 2.5 m).

From this assessment, considerations for tidal regime, surge height, and type of wave forcing were used to
determine the degree of effectiveness of salt marshes in the studied water systems, while defining effective-
ness in terms relative to a mudflat located at MSL. Output of the simulations suggests that salt marshes that
develop in macro tidal sites, like in the Western Scheldt, can dissipate more wave energy than habitats located
in micro or meso tidal areas, such as the Wadden Sea. This is due to the fact that foreshores accrete at higher

                                                        v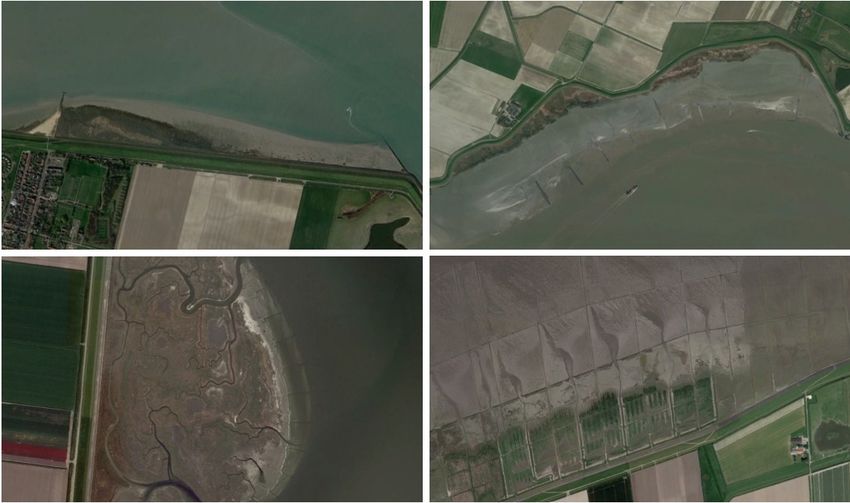
vi                                                                                                    Summary

elevations with respect to MSL, due to sediment deposition on higher levels occurring during MHWS. On the
other hand, results treating the different wave loads (swell waves, sheltered locally wind-generated waves,
and exposed wind-generated waves) further indicates that greater wave height attenuation may be achieved
in sheltered coastal locations such as the Western Scheldt estuary; which is is due to the fact that longer swell
waves are dissipated by other mechanisms (such as wave breaking and bottom friction), while shorter waves
can be largely be dissipated by the vegetated foreshore itself. This observation suggests that introduction of
this system as a flood protection measure may be more effective in sheltered than in exposed coastal areas.

Finally, the set of conclusions provided by both sections proposed generally applicable indicators that may
serve to determine whether an arbitrary location is capable of hosting salt marsh vegetation as a flood defense
measure, as well as the effectiveness of such nature-based solution with respect to wave height attenuation.
The elaboration of an assessment tool was not achieved in this thesis; however, in order to perform a quick
check for salt marsh introduction as an effective flood defense measure at a given site, results indicate the
gathering of necessary data such as bed level elevations - for inundation-free period analysis - as well as oc-
curring hydrodynamic forcing and sediment properties at such arbitrary site (excess bed shear stress determi-
nation, evaluated with the previously proposed limits). With respect to the degree of wave height reduction
effectiveness, the determination of the occurring tidal regime, design surge heights, and considerations of
sheltered/exposed coastal conditions may serve as a first estimate for this purpose.
Contents

List of Figures                                                                                                                                                                    ix
List of Tables                                                                                                                                                                    xiii
1   Introduction                                                                                                                                                                    1
    1.1   Problem description . . . . . . .     .   .   .   .   .   .     .   .   .   .   .   .   .   .   .   .   .   .   .   .   .   .   .   .   .   .   .   .   .   .   .   .     1
    1.2   Aim of research . . . . . . . . . .   .   .   .   .   .   .     .   .   .   .   .   .   .   .   .   .   .   .   .   .   .   .   .   .   .   .   .   .   .   .   .   .     2
    1.3   Methodology . . . . . . . . . . .     .   .   .   .   .   .     .   .   .   .   .   .   .   .   .   .   .   .   .   .   .   .   .   .   .   .   .   .   .   .   .   .     2
    1.4   Report outline. . . . . . . . . . .   .   .   .   .   .   .     .   .   .   .   .   .   .   .   .   .   .   .   .   .   .   .   .   .   .   .   .   .   .   .   .   .     3
    1.5   ’Building with Nature’ philosophy.    .   .   .   .   .   .     .   .   .   .   .   .   .   .   .   .   .   .   .   .   .   .   .   .   .   .   .   .   .   .   .   .     3
2   Literature review                                                                                                                                                               5
    2.1 Vegetated foreshore system . . . . .        .   .   .   .   .     .   .   .   .   .   .   .   .   .   .   .   .   .   .   .   .   .   .   .   .   .   .   .   .   .   . 5
    2.2 Salt marshes . . . . . . . . . . . .        .   .   .   .   .     .   .   .   .   .   .   .   .   .   .   .   .   .   .   .   .   .   .   .   .   .   .   .   .   .   . 6
        2.2.1 Wave attenuation studies . .          .   .   .   .   .     .   .   .   .   .   .   .   .   .   .   .   .   .   .   .   .   .   .   .   .   .   .   .   .   .   . 7
        2.2.2 Habitat suitability indicators .      .   .   .   .   .     .   .   .   .   .   .   .   .   .   .   .   .   .   .   .   .   .   .   .   .   .   .   .   .   .   . 8
        2.2.3 Effectiveness indicators . . .        .   .   .   .   .     .   .   .   .   .   .   .   .   .   .   .   .   .   .   .   .   .   .   .   .   .   .   .   .   .   . 10
3   Habitat suitability                                                                                                                                                            13
    3.1 Case studies. . . . . . . . . . . . . . . . . . . . . .                           .   .   .   .   .   .   .   .   .   .   .   .   .   .   .   .   .   .   .   .   .   .    13
    3.2 Inundation-free period . . . . . . . . . . . . . . . .                            .   .   .   .   .   .   .   .   .   .   .   .   .   .   .   .   .   .   .   .   .   .    17
        3.2.1 Western Scheldt . . . . . . . . . . . . . . . .                             .   .   .   .   .   .   .   .   .   .   .   .   .   .   .   .   .   .   .   .   .   .    19
        3.2.2 Wadden Sea . . . . . . . . . . . . . . . . . .                              .   .   .   .   .   .   .   .   .   .   .   .   .   .   .   .   .   .   .   .   .   .    20
    3.3 Flow velocities . . . . . . . . . . . . . . . . . . . .                           .   .   .   .   .   .   .   .   .   .   .   .   .   .   .   .   .   .   .   .   .   .    21
        3.3.1 Western Scheldt . . . . . . . . . . . . . . . .                             .   .   .   .   .   .   .   .   .   .   .   .   .   .   .   .   .   .   .   .   .   .    24
        3.3.2 Wadden Sea . . . . . . . . . . . . . . . . . .                              .   .   .   .   .   .   .   .   .   .   .   .   .   .   .   .   .   .   .   .   .   .    28
    3.4 Wave height . . . . . . . . . . . . . . . . . . . . . .                           .   .   .   .   .   .   .   .   .   .   .   .   .   .   .   .   .   .   .   .   .   .    30
        3.4.1 Western Scheldt . . . . . . . . . . . . . . . .                             .   .   .   .   .   .   .   .   .   .   .   .   .   .   .   .   .   .   .   .   .   .    31
        3.4.2 Wadden Sea . . . . . . . . . . . . . . . . . .                              .   .   .   .   .   .   .   .   .   .   .   .   .   .   .   .   .   .   .   .   .   .    33
    3.5 Dimensionless wave-induced excess bed-shear stress                                .   .   .   .   .   .   .   .   .   .   .   .   .   .   .   .   .   .   .   .   .   .    34
    3.6 Discussion . . . . . . . . . . . . . . . . . . . . . .                            .   .   .   .   .   .   .   .   .   .   .   .   .   .   .   .   .   .   .   .   .   .    39
4   Effectiveness: wave height reduction                                                                                                                                           41
    4.1 Vegetation . . . . . . . . . . .    .   .   .   .   .   .   .     .   .   .   .   .   .   .   .   .   .   .   .   .   .   .   .   .   .   .   .   .   .   .   .   .   .    41
        4.1.1 Relative vegetation height    .   .   .   .   .   .   .     .   .   .   .   .   .   .   .   .   .   .   .   .   .   .   .   .   .   .   .   .   .   .   .   .   .    42
    4.2 Foreshore system . . . . . . . .    .   .   .   .   .   .   .     .   .   .   .   .   .   .   .   .   .   .   .   .   .   .   .   .   .   .   .   .   .   .   .   .   .    44
        4.2.1 Tidal regime . . . . . . .    .   .   .   .   .   .   .     .   .   .   .   .   .   .   .   .   .   .   .   .   .   .   .   .   .   .   .   .   .   .   .   .   .    44
        4.2.2 H/h . . . . . . . . . . .     .   .   .   .   .   .   .     .   .   .   .   .   .   .   .   .   .   .   .   .   .   .   .   .   .   .   .   .   .   .   .   .   .    46
    4.3 Discussion . . . . . . . . . . .    .   .   .   .   .   .   .     .   .   .   .   .   .   .   .   .   .   .   .   .   .   .   .   .   .   .   .   .   .   .   .   .   .    46
    4.4 Application on water systems . .    .   .   .   .   .   .   .     .   .   .   .   .   .   .   .   .   .   .   .   .   .   .   .   .   .   .   .   .   .   .   .   .   .    48
5   Discussion                                                                                                                                                                     49
    5.1 Habitat suitability . . . . . . . . . . . . . . . . . . .                         .   .   .   .   .   .   .   .   .   .   .   .   .   .   .   .   .   .   .   .   .   .    49
        5.1.1 Water levels . . . . . . . . . . . . . . . . . .                            .   .   .   .   .   .   .   .   .   .   .   .   .   .   .   .   .   .   .   .   .   .    49
        5.1.2 Marsh edge bed level. . . . . . . . . . . . . .                             .   .   .   .   .   .   .   .   .   .   .   .   .   .   .   .   .   .   .   .   .   .    50
        5.1.3 Inundation frequency vs. inundation duration.                               .   .   .   .   .   .   .   .   .   .   .   .   .   .   .   .   .   .   .   .   .   .    51
        5.1.4 Determination of flow velocities . . . . . . . .                            .   .   .   .   .   .   .   .   .   .   .   .   .   .   .   .   .   .   .   .   .   .    51
        5.1.5 Wave heights . . . . . . . . . . . . . . . . . .                            .   .   .   .   .   .   .   .   .   .   .   .   .   .   .   .   .   .   .   .   .   .    51
        5.1.6 Sediment dynamics . . . . . . . . . . . . . .                               .   .   .   .   .   .   .   .   .   .   .   .   .   .   .   .   .   .   .   .   .   .    52
        5.1.7 Topography . . . . . . . . . . . . . . . . . .                              .   .   .   .   .   .   .   .   .   .   .   .   .   .   .   .   .   .   .   .   .   .    52

                                                                    vii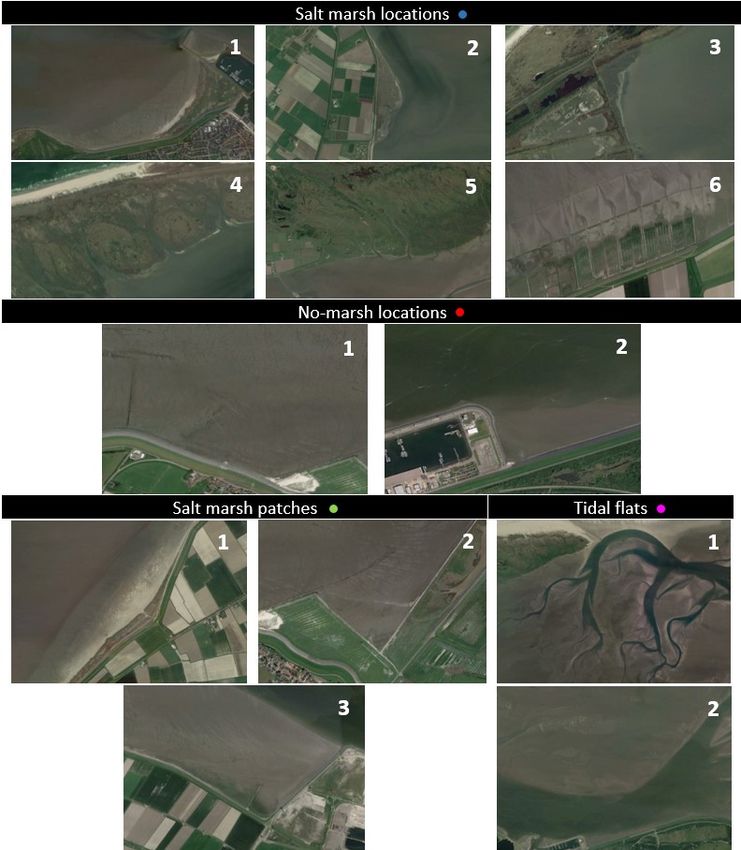
viii                                                                                                                                                                   Contents

       5.2 Effectiveness . . . . . . . . . .   .   .   .   .   .   .   .   .   .   .   .   .   .   .   .   .   .   .   .   .   .   .   .   .   .   .   .   .   .   .   .   .   .   53
           5.2.1 Definition of effectiveness   .   .   .   .   .   .   .   .   .   .   .   .   .   .   .   .   .   .   .   .   .   .   .   .   .   .   .   .   .   .   .   .   .   53
           5.2.2 Generalization . . . . . .    .   .   .   .   .   .   .   .   .   .   .   .   .   .   .   .   .   .   .   .   .   .   .   .   .   .   .   .   .   .   .   .   .   54
       5.3 Applicability . . . . . . . . . .   .   .   .   .   .   .   .   .   .   .   .   .   .   .   .   .   .   .   .   .   .   .   .   .   .   .   .   .   .   .   .   .   .   54
6      Conclusions                                                                                                                                                                 57
7      Recommendations                                                                                                                                                             59
A Validation: wave growth formulas                                                                                                                                                 65
B Case studies: Marsh edge points                                                                                                                                                  67
List of Figures
1.1 Outline of research methodology. . . . . . . . . . . . . . . . . . . . . . . . . . . . . . . . . . . . . . 3
1.2 Building with Nature design steps, as proposed by Ecoshape (2020), and link with document
structure and research questions. . . . . . . . . . . . . . . . . . . . . . . . . . . . . . . . . . . . . . 3
2.1 Schematic of a typical vegetated foreshore system trailed by a dike. Adapted from Vuik et al. (2016b) 5
2.2 Global distribution of mangroves and salt marshes. Sources: Thomas et al. (2018) (mangroves),
Mcowen et al. (2017) (salt marshes). . . . . . . . . . . . . . . . . . . . . . . . . . . . . . . . . . . . . 6
2.3 Typical transect of salt marsh zonation along a foreshore. Pioneering vegetation found on the
seaward side (left) and mature vegetation on the landward side (right) (Vlaams Instituut voor de
Zee, 2012). . . . . . . . . . . . . . . . . . . . . . . . . . . . . . . . . . . . . . . . . . . . . . . . . . . . 7
2.4 Salt marsh habitat requirements, subdivision proposed by Deltares (2018). . . . . . . . . . . . . . 9
3.1 Schematic of characteristic estuary morphology, where salt marshes sit on higher elevations.
Intertidal flats can be found either on the limits of the estuary (fringing flats) or bordered by
tidal channels (intertidal shoals). Adapted from de Vet (2020). . . . . . . . . . . . . . . . . . . . . 13
3.2 Geographical location of the referred case studies, where the Wadden Sea and the Western
Scheldt are found in the North and Southwest of The Netherlands, respectively. . . . . . . . . . . 14
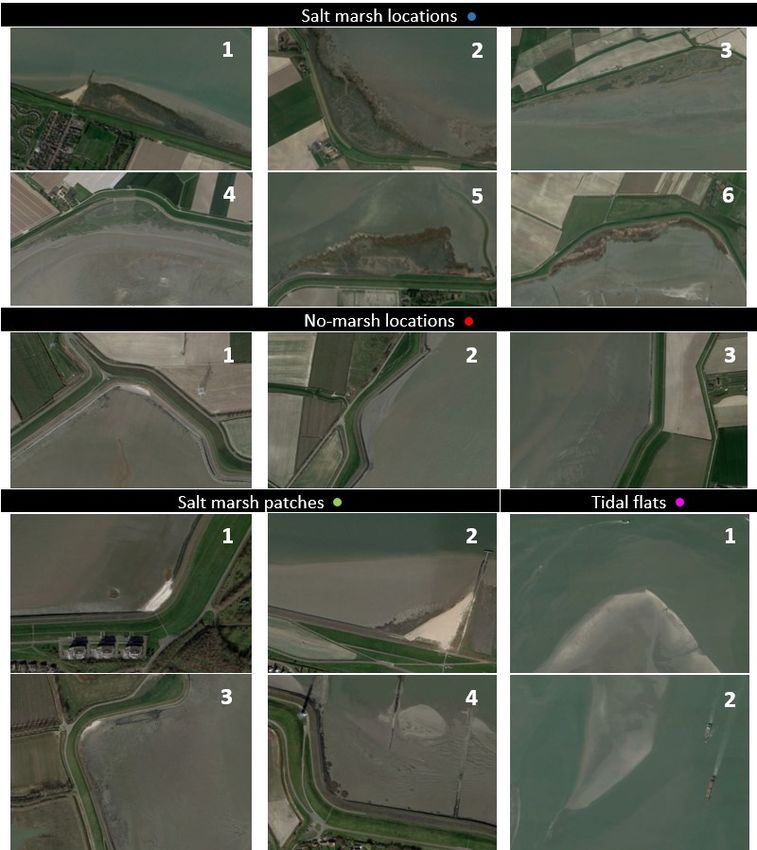
3.3 Overview of the study locations selected in the Western Scheldt (top) and close-up screenshots
(bottom) retrieved from Google Earth. Sites characterized by mature salt marsh vegetation, ’No-
marsh’ sites, ’Salt marsh patches’, and ’Tidal flats’ are denoted by blue, red, green, and pink dots,
respectively. . . . . . . . . . . . . . . . . . . . . . . . . . . . . . . . . . . . . . . . . . . . . . . . . . . 15
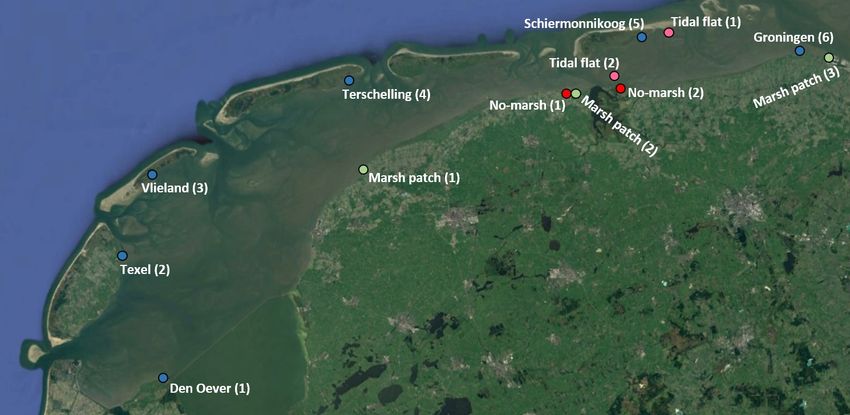
3.4 Overview of the study locations selected in the Wadden Sea (top) and close-up screenshots (bot-
tom) retrieved from Google Earth. Sites characterized by mature salt marsh vegetation, ’No-
marsh’ sites, ’Salt marsh patches’, and ’Tidal flats’ are denoted by blue, red, green, and pink
dots, respectively. . . . . . . . . . . . . . . . . . . . . . . . . . . . . . . . . . . . . . . . . . . . . . . . 16
3.5 Overview of layout used for analysis in following sections. Vegetated locations are divided into
mature salt marshes and emerging salt marshes, while non-vegetated locations are divided into
no-marsh sites located on fringing flats and tidal flats. . . . . . . . . . . . . . . . . . . . . . . . . . 17
3.6 Example of the three points selected for the inundation-free period analysis at the salt marsh
edge at Hellegatpolder (top panel). The bottom panels depict the transect for one of the points
along the aforementioned marsh edge, where the red cross denotes the location where bed level
elevation was retrieved from the AHN3 database. . . . . . . . . . . . . . . . . . . . . . . . . . . . . 18
3.7 Screenshot of Rijkswaterstaat water level stations in the Western Scheldt (top) and Wadden Zee
(bottom), as well as triangular planes used for water level time series generation. . . . . . . . . . 19
3.8 Results of inundation-free period analysis in the Western Scheldt. Vertical dashed line (red)
separates mature salt marsh locations from additional observation locations. . . . . . . . . . . . 20
3.9 Results of inundation-free period analysis in the Wadden Sea. Vertical dashed line (red) sepa-
rates mature salt marsh locations from additional observation locations. . . . . . . . . . . . . . . 21
3.10 Example of selected observation points in locations of interest. Top panels correspond to the
salt marsh location ’Vlieland’, Wadden Sea. The bottom panels correspond to ’Hoofdplaat’ and
’Salt marsh patch 2’ in the Western Scheldt. . . . . . . . . . . . . . . . . . . . . . . . . . . . . . . . 22
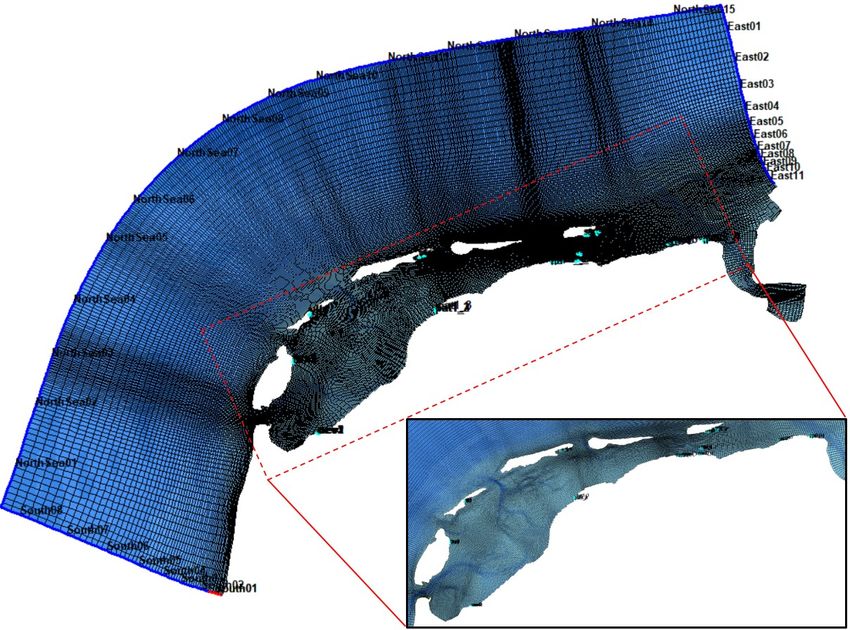
3.11 Spatial extent of the Delft3D model used for the depth-averaged flow velocity analysis in the
Western Scheldt. . . . . . . . . . . . . . . . . . . . . . . . . . . . . . . . . . . . . . . . . . . . . . . . 24
3.12 Example of the flow velocity signal at one location (Baarland). The left panel shows the signal
generated from the neap cycle simulation; the right panel shows the signal generated during
spring tide. . . . . . . . . . . . . . . . . . . . . . . . . . . . . . . . . . . . . . . . . . . . . . . . . . . . 24
ixx List of Figures
3.13 Return levels for flow velocities occurring in front of salt marsh vegetation during growth season
(daily conditions). Vertical dashed lines (red) denote maximum value observed at characteristic
percentages of exceedance. Two signals were used per location, indicated by two curves for
every site. . . . . . . . . . . . . . . . . . . . . . . . . . . . . . . . . . . . . . . . . . . . . . . . . . . . . 25
3.14 Comparison of occurring flow velocities in front of different observed locations (daily conditions). 26
3.15 Comparison of flow velocity signal at one location during daily (left panel) and storm (right
panel) conditions. . . . . . . . . . . . . . . . . . . . . . . . . . . . . . . . . . . . . . . . . . . . . . . . 26
3.16 Comparison of occurring flow velocities at different observed locations (storm conditions). Ver-
tical dashed lines (red) denote maximum value observed at characteristic percentages of ex-
ceedance. . . . . . . . . . . . . . . . . . . . . . . . . . . . . . . . . . . . . . . . . . . . . . . . . . . . . 27
3.17 Spatial extent of the Delft3D model used for the depth-averaged flow velocity analysis in the
Wadden Sea. . . . . . . . . . . . . . . . . . . . . . . . . . . . . . . . . . . . . . . . . . . . . . . . . . . 28
3.18 Return levels for flow velocities occurring in front of salt marsh sites in the Wadden Sea during
growth season (daily conditions). Vertical dashed lines (red) denote maximum value observed
at characteristic percentages of exceedance. Two signals were used per location, indicated by
two curves for every site. . . . . . . . . . . . . . . . . . . . . . . . . . . . . . . . . . . . . . . . . . . . 28
3.19 Comparison of occurring flow velocities at different observation points in the Wadden Sea model.
Vertical dashed lines (red) denote maximum value observed at characteristic percentages of ex-
ceedance. . . . . . . . . . . . . . . . . . . . . . . . . . . . . . . . . . . . . . . . . . . . . . . . . . . . . 29
3.20 Example of wind data characteristics retrieved from the Rijkswaterstaat database, Vlissingen
station. Displayed wind rose shows southwest winds as the dominant wind direction (highest
probability of occurrence) during growth season 2020. . . . . . . . . . . . . . . . . . . . . . . . . . 31
3.21 Parallel transects of bed elevation in front of salt marsh locations at Zuidgors (left) and Hellegat-
polder(right), derived from the Vaklodingen database. Mean bed level for the Western Scheldt
estuary characterized by z = - 9.60m (red dashed line). . . . . . . . . . . . . . . . . . . . . . . . . . 31
3.22 Return levels for significant wave height occurring in front of salt marsh vegetation during
growth season. Vertical dashed lines (red) denote maximum value observed at characteristic
percentages of exceedance. . . . . . . . . . . . . . . . . . . . . . . . . . . . . . . . . . . . . . . . . . 32
3.23 Comparison of significant wave height occurrence between different observed locations in the
Western Scheldt. . . . . . . . . . . . . . . . . . . . . . . . . . . . . . . . . . . . . . . . . . . . . . . . 33
3.24 Return levels for significant wave height occurring in front of salt marsh vegetation during
growth season. Vertical dashed lines (red) denote proposed threshold value for characteristic
percentages of exceedance. . . . . . . . . . . . . . . . . . . . . . . . . . . . . . . . . . . . . . . . . . 34
3.25 Comparison of significant wave height occurrence between different observed locations in the
Wadden Sea. . . . . . . . . . . . . . . . . . . . . . . . . . . . . . . . . . . . . . . . . . . . . . . . . . . 34
3.26 Bed composition of the Western Scheldt, as proposed by McLaren (1994), and adapted by Dam
et al. (2013). Magenta dots denote locations assumed to have a dominant sand fraction, while
the green dots denote more muddier site. The color bar on the right side of the Figure describes
the mud content of the soil (percentage of fines < 63µm). . . . . . . . . . . . . . . . . . . . . . . . 36
3.27 Relationship between wave height (H) and wave period (T) retrieved from measurement con-
ducted in the Western Scheldt (Vuik et al., 2016a). . . . . . . . . . . . . . . . . . . . . . . . . . . . . 37
3.28 Excess wave-induced bed-shear stress computed in the Western Scheldt. . . . . . . . . . . . . . . 38
3.29 Excess wave-induced bed-shear stress computed in the Wadden Sea. . . . . . . . . . . . . . . . . 38
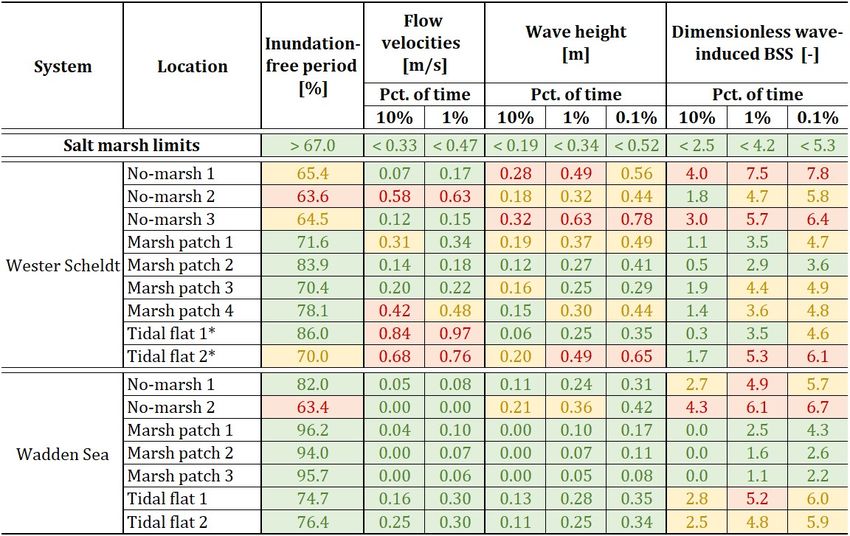
3.30 Summary of results gathered from habitat suitability indicators observed at locations in the
Western Scheldt and Wadden Sea. Harsher conditions modelled in the Western Scheldt sites
serve as general salt marsh threshold values. Colors denote agreement (green), proximity (yel-
low), or disagreement (red) with proposed habitat suitability indicators. * Flow velocities in the
Western Scheldt ’Tidal flat’ locations correspond to magnitudes gathered from a storm simula-
tion. Salt marsh limits under storm conditions were: 10%=0.41 m/s and 1%=0.62 m/s. . . . . . . 39
4.1 Schematic of 1D model used to asses the degree of effectiveness of the relative vegetation height
(h v /h). . . . . . . . . . . . . . . . . . . . . . . . . . . . . . . . . . . . . . . . . . . . . . . . . . . . . . 42
4.2 Results depicting the response of β and r wave attenuation factors with respect to relative veg-
etation height (h v /h); evaluated at deep and shallow water limit state conditions (kh 3.0 and
kh 0.3, respectively) and in intermediate water conditions (0.3 < kh < 3.0). . . . . . . . . . . . . . 43List of Figures xi
4.3 Schematization of two-step approach followed to assess effectiveness of foreshore+vegetation
system. Wave energy dissipation ratios r were computed at every scenario with the aim of com-
paring dissipation of the foreshore system in terms of the dissipation in the mudflat scenario
(step 0). . . . . . . . . . . . . . . . . . . . . . . . . . . . . . . . . . . . . . . . . . . . . . . . . . . . . . 44
4.4 Rate of wave attenuation ratio between ’bare foreshore vs bare mudflat’ (left panel) and ’vege-
tated foreshore vs bare mudflat’ (right panel). Scenario: exposed coast, locally generated wind
waves. . . . . . . . . . . . . . . . . . . . . . . . . . . . . . . . . . . . . . . . . . . . . . . . . . . . . . . 45
4.5 Rate of wave attenuation ratio between ’bare foreshore vs bare mudflat’ (left panel) and ’vege-
tated foreshore vs bare mudflat’ (right panel). Scenario: exposed coast, swell waves. . . . . . . . 45
4.6 Rate of wave attenuation ratio between ’bare foreshore vs bare mudflat’ (left panel) and ’vege-
tated foreshore vs bare mudflat’ (right panel). Scenario: sheltered coast, locally generated wind
waves. . . . . . . . . . . . . . . . . . . . . . . . . . . . . . . . . . . . . . . . . . . . . . . . . . . . . . . 45
4.7 Results of wave height to water depth ratio analysis in different tidal regimes. . . . . . . . . . . . 46
4.8 r s y st em /r mud f l at ratio across all evaluated scenarios. Water levels plotted on the x axis corre-
spond to the imposed tidal regimes + surge level (micro = 1.0m - 4.0m; meso = 2.0m - 5.0m;
macro = 3.0m - 6.0m). . . . . . . . . . . . . . . . . . . . . . . . . . . . . . . . . . . . . . . . . . . . . 47
5.1 Water level time series comparison between Delft 3D model and triangular interpolation results
generated in mature salt marsh locations ’Vlieland’ (left panel) and ’Terschelling’ (right panel)
in the Wadden Sea. Time span corresponds to 1 month of simulated signals. . . . . . . . . . . . . 50
5.2 Aerial Google Earth imagery at locations Hoofdplaat and Zimmermanpolder in the Western
Scheldt (top panels); and at Texel and Groningen in the Wadden Sea (bottom panels). . . . . . . 53
5.3 Set of conclusions gathered from the previous analysis regarding habitat suitability and wave
height reduction effectiveness of salt marsh habitats. . . . . . . . . . . . . . . . . . . . . . . . . . . 55
6.1 Set of conclusions gathered from the previous analysis. . . . . . . . . . . . . . . . . . . . . . . . . 58
A.1 Validation of modelled wave heights by means of wave growth formula. Actual data was re-
trieved from previous measurements on the marsh edge along a transect on the Hellegat salt
marsh (WS) during the months April-July 2015. . . . . . . . . . . . . . . . . . . . . . . . . . . . . . 65
A.2 Validation of modelled wave heights by means of wave growth formula. Actual data was re-
trieved from previous measurements on the marsh edge along a transect on the Groningen salt
marsh (WZ) during the month of January,2017. . . . . . . . . . . . . . . . . . . . . . . . . . . . . . 66
B.1 Marsh edge points selected at mature salt marsh locations in the Western Scheldt. Computa-
tions of the inundation-free period were performed with respect to these points. . . . . . . . . . 67
B.2 Marsh edge points selected at mature salt marsh locations in the Wadden Sea. Computations of
the inundation-free period were performed with respect to these points. . . . . . . . . . . . . . . 68List of Tables
2.1 Previous studies regarding wave height attenuation by salt marsh vegetation. Distinction is
made between natural and engineered systems. Adapted from Narayan et al. (2016). . . . . . . . 8
2.2 Summary feasibility indicators found in literature. . . . . . . . . . . . . . . . . . . . . . . . . . . . 10
2.3 Summary effectiveness indicators found in literature. . . . . . . . . . . . . . . . . . . . . . . . . . 12
3.1 Summary of selected study sites in each water system. . . . . . . . . . . . . . . . . . . . . . . . . . 17
3.2 Comparison of bed level elevation between the AHN3 database (actual elevation) and the nu-
merical model bathymetry, for the Western Scheldt (left) and Wadden Sea (right). . . . . . . . . . 23
3.3 Summary of sand-mud soil mixture characterization for both water systems, based on literature
presented by van Rijn (2020). . . . . . . . . . . . . . . . . . . . . . . . . . . . . . . . . . . . . . . . . 36
3.4 Description of bed roughness coefficients (Nikuradse coefficient) used in each of the water sys-
tems. . . . . . . . . . . . . . . . . . . . . . . . . . . . . . . . . . . . . . . . . . . . . . . . . . . . . . . 37
4.1 Summary parameters for sensitivity analysis. . . . . . . . . . . . . . . . . . . . . . . . . . . . . . . 42
4.2 Summary of parameters used for combinations run for foreshore system analysis. . . . . . . . . 44
4.3 Relation between water levels and tidal regime depicted in Figure 4.8. . . . . . . . . . . . . . . . . 47
xiii1
Introduction
1.1. Problem description
Coastal populations are constantly exposed to the risk of flooding due to their proximity to the sea and hence
to permanent hydrodynamic forcing exerted by waves, storm surge, and tides. In addition, future storm vari-
ability, sea-level rise and shoreline change are factors that enhance these coastal hazards (Woodruff et al.,
2013). For instance, it has been determined that 24% of the world’s sandy beaches are experiencing erosion,
either by natural processes or by human activity (Luijendijk et al., 2018).
Due to these coastal threats, many different types of measures have been undertaken in order to reduce the
risk of flooding, while defining flood risk as a function of the hazard, the exposure, and vulnerability of the
exposed community (UNDRR, 2016). Flood hazard is typically characterized by the aforementioned (daily
or future) phenomena; whereas exposure and vulnerability are more related to socio-economical factors (as-
sets exposed to likely damage and the capacity of society to deal with the event). Civil engineering practices
largely target the reduction - or elimination - of the hazard itself. In general terms, flood hazard reduction
measures can be summarized into structural and non-structural (Dodo et al., 1985). Typical structural mea-
sures include rouble mound breakwaters, seawalls, groynes, and other similar so-called ’hard’ interventions;
while non-structural measures include land use zoning, evacuation strategies, the use of green infrastructure,
and nature-based coastal defenses, also referred to as ’soft’ interventions.
Amongst such ’soft’ interventions, nature-based coastal defenses have proven to be an appealing alterna-
tive. When compared with traditional ’hard’ coastal defenses, they can be more cost-effective under certain
conditions (Narayan et al., 2016), improve the surrounding ecosystem’s functioning, and are generally more
adaptable to changing conditions i.e. sea level rise (van der Nat et al., 2016). Ecosystems that fall under this
category of nature-based defenses, are e.g. coral reefs, salt marshes, mangrove forests, sand dunes, beach
nourishments, and several others. Studies regarding the behavior of these ecosystems have made it possible
to better understand their response under daily and extreme conditions, as well as to determine their effec-
tiveness as flood hazard reduction measures.
Even though the flood hazard mitigation characteristics of these ’soft’ interventions have been researched
and established in several previous studies, as gathered by Narayan et al. (2016), there exists a knowledge gap
regarding which site-specific conditions can determine the introduction of these measures as an effective
flood protection solution. There is the need to establish general feasibility indicators that are able to predict
to what extent these measures are viable and effective at an arbitrary location. With such indicators - both for
habitat suitability and flood hazard reduction effectiveness - at hand, they may serve as an effective tool at a
decision-making level, where a coastal protection solution is required.
However diverse these nature-based solutions are, this thesis is focused exclusively on salt marsh-vegetated
foreshores. Furthermore, the physical feasibility (habitat suitability) of the salt marshes will be assessed,
leaving a cost-benefit feasibility analysis for further research.
12 1. Introduction
1.2. Aim of research
The aim of this thesis is to quantitatively determine limit values of various habitat suitability indicators for
salt marsh ecosystems, as well as the degree of effectiveness, regarding the flood hazard reduction capacity,
of salt marsh-foreshore systems under varying conditions. The method is based on numerical modelling of
phenomena occurring at observation sites located in salt marsh-rich water systems, through readily avail-
able open source data providing hydrodynamic and atmospheric conditions in the proximity of such sites. In
some cases, numerical modelling is performed for idealized scenarios (next section).
The following research questions will address the previously described purpose of this thesis:
1. Based on site-specific conditions, can general threshold values be given to salt marsh habitat suitability
indicators?
2. To which degree are different characteristics of salt marsh-foreshore systems effective regarding their
flood hazard reduction capacity?
3. Can the previously assessed indicators and limit values serve as an assessment tool for salt marsh habi-
tat introduction as a flood hazard reduction measure?
1.3. Methodology
This thesis is divided into two sections: i) habitat suitability for salt marsh habitats; and ii) flood hazard reduc-
tion effectiveness of salt marsh-vegetated foreshores. Therefore, different methodologies are used for each of
the thesis’ sections; however, they both start with consultation of existing literature to compile a first estimate
of habitat suitability and wave height attenuation effectiveness indicators, along with their approximate limit
values.
For the habitat suitability analysis, readily available open source data (e.g. hydrodynamic, bathymetric, at-
mospheric) will be used to generate local hydrodynamic conditions at different locations of interest in two
salt marsh-rich water systems in The Netherlands (the Western Scheldt and the Wadden Sea), selecting both
vegetated and non vegetated sites within them. These generated conditions will be assessed in order to de-
termine fundamental differences between all selected sites in order to gather limit values that would enable
habitat establishment and survival.
Likewise, the wave height reduction effectiveness indicators compiled from literature will be assessed for their
likely degree of effectiveness under several imposed boundary conditions, which would attempt to recreate
conditions found in nature. This evaluation will be done initially on the effect of vegetation alone, while latter
adding the effect of the changing bathymetry itself, caused by the presence of the foreshore. For the vegeta-
tion assessment, a sensitivity analysis on existing formulae describing wave propagation over vegetated fields
will be used. The vegetated foreshore system analysis will be done with the spectral wave model SWAN (Sim-
ulating WAves Nearshore) under the previously explained boundary conditions. Various simulations with
varying boundary conditions will aid in this step, after which the results will be compared to the water sys-
tems previously introduced.
Once the proposed habitat suitability and effectiveness indicators are determined, a link between the two will
be proposed as an assessment tool for a quick scan at an arbitrary site, with the assumption that a salt-marsh
vegetated foreshores is a desired solution for coastal protection.1.4. Report outline 3
Figure 1.1: Outline of research methodology.
1.4. Report outline
The outline of this thesis will attend each of the research questions stated in section 1.2.
• Chapter 2 discusses the existing literature on salt marsh vegetation capacity as flood hazard mitigation
measures; it also presents previously estimated conditions that can serve as habitat suitability and flood
hazard reduction effectiveness indicators.
• Chapter 3 treats the habitat suitability indicators and their limit values. The gathered data is assessed
and used to establish preliminary applicability limit values for each proposed indicator.
• Chapter 4 discusses the degree of effectiveness of salt marsh habitats under different imposed bound-
ary conditions. A sensitivity analysis is performed on different parameters and general applications are
presented.
• Chapter 5 presents the discussion of the results and the methods used throughout the thesis. Moreover,
it presents the link between the habitat suitability and flood hazard reduction effectiveness.
• Chapter 6 provides the answers for the research questions addressed along the document.
• Chapter 7 gives recommendations regarding the current document and insight on topics for further
assessment.
1.5. ’Building with Nature’ philosophy
The overall structure of this thesis follows the first three steps presented as the Building with Nature philos-
ophy, introduced by Ecoshape (2020) (Figure 1.2), where the 1st step in developing such a project is referred
as ’Understanding the system’. This first phase of the design cycle is treated by the first research question,
regarding the habitat suitability assessment. Once it is known whether a given water system is capable of
hosting salt marshes (for this case, the intended ’BwN’ solution is predefined), the following design step pro-
posed by Ecoshape (2020) is to ’Evaluate the qualities of alternatives and pre-select an integral solution’. This
step is followed by the second research question, where it is assessed whether the introduction of such a habi-
tat serves as an effective coastal protection measure.
Figure 1.2: Building with Nature design steps, as proposed by Ecoshape (2020), and link with document structure and research
questions.2
Literature review
2.1. Vegetated foreshore system
A vegetated foreshore is a system characterized by a gently sloping sediment body, covered with vegetation,
located in front of a dike; moreover, these systems can serve as an effective flood protection measure, since
propagating waves experience energy loss due to depth-induced wave breaking, bottom friction and atten-
uation by vegetation (Vuik et al., 2016a). A stand-alone bare foreshore on its own can already reduce the
hydrodynamic loading on the flood defense lying on the hinterland: maximum waves (during storm con-
ditions) can be reduced to up to 55% of the water depth, given the foreshore is wide enough (Jonkman et
al., 2018). The addition of vegetation enhances the already-effective wave attenuation capacity of this flood
defense system.
Figure 2.1: Schematic of a typical vegetated foreshore system trailed by a dike. Adapted from Vuik et al. (2016b)
Different types of vegetation can colonize a foreshore, but given that different sections of a foreshore transect
become flooded under various scenarios (spring tides, storm surges, etc.), salt-tolerant vegetation such as
salt marshes and mangroves are dominant. The presence of either of the aforementioned species is deter-
mined by local temperature fluctuations. Given that mangroves can not thrive in locations that experience
temperatures below the freezing point (Deltares, 2018), they are found in tropical and subtropical latitudes,
while salt marshes colonize foreshores developing in higher and lower latitudes (Figure 2.2).
56 2. Literature review
Figure 2.2: Global distribution of mangroves and salt marshes. Sources: Thomas et al. (2018) (mangroves), Mcowen et al. (2017) (salt
marshes).
Extensive field and flume research has been done regarding the wave attenuation capacity of waves propa-
gating over both mangrove-vegetated (Massel et al. (1999); Mazda et al. (2006); Quartel et al. (2007); Quang
Bao (2011); Horstman et al. (2012); Janssen (2016)) and salt marsh-vegetated sites (Anderson et al. (2011);
Yang et al. (2011); Anderson et al. (2014); Songy (2016); Vuik et al. (2016a)). Additionally, this previous re-
search has also provided insight regarding the factors that determine the colonization and survival of both
of these ecosystems, and will be treated in the following sections. However, as mentioned in Chapter 1, this
thesis will focus on salt marsh vegetation only, leaving a similar study for mangrove habitats for future assess-
ment.
2.2. Salt marshes
Salt marshes are vegetated habitats bordering saline or brackish water bodies under tidal influence (Deltares,
2018). Their capacity to thrive in salt water environments allows them to settle along the banks in coastal
or deltaic regions where otherwise fresh water marshes or other vegetation could not survive. This innate
characteristic make salt marshes an appealing species to choose as vegetation cover on foreshores located in
salt water environments and in temperate climates. Along a foreshore transect, salt marsh habitats follow a
specific zonation (Figure 2.3), where pioneering vegetation is found on the most seaward side of the transect,
usually fronted by a mud flat, and mature vegetation on the most upper section of the marsh on the landward
side. The species that populate these different zones correspond to their respective salinity tolerance, finding
mostly sea grasses (e.g., Zostera) and glassworts (e.g., Salicornia) on the pioneer zone, as well as e.g., Spartina
in more brackish conditions; whereas the middle and higher marsh zones, given their less frequent flood-
ing exposure, include less salt-tolerant species such as rushes (e.g., Juncus spp.), grasses (e.g., Puccinellia,
Sporobolus), and herbs (e.g., Aster, Plantago) (Healy, 2005).2.2. Salt marshes 7
Figure 2.3: Typical transect of salt marsh zonation along a foreshore. Pioneering vegetation found on the seaward side (left) and mature
vegetation on the landward side (right) (Vlaams Instituut voor de Zee, 2012).
Given this characteristic zonation, lower sections of a salt marsh experience more recurrent flooding than the
upper regions, however the whole transect becomes flooded under certain tidal occurrences. Mean High Wa-
ter Spring (MHWS) usually determines the upper boundary of the foreshore, while Mean Low Water Spring
(MLWS) determines the lower boundary; likewise, Mean High Water Neap (MHWN) tends to set the limit
for the salt marsh edge just before the beginning of the mudflat that fronts it (Willemsen et al., 2020). These
flooding events occurring at different elevations on the salt marsh, combined with suspended sediment avail-
ability and the reduced hydrodynamic forcing caused by the vegetation itself, favors the overall increase of
the bed level elevation (Bouma et al. (2007); van Wesenbeeck et al. (2008)). This positive feedback mecha-
nism generates an accretion rate on salt marshes in the order of a centimeter per year, but it is strictly linked
to local conditions, such as suspended sediment availability, tidal range and soil stability (Deltares, 2018).
2.2.1. Wave attenuation studies
Many locations around the globe have served as case studies to measure the response of salt marsh habitats
to different types of external forcing. This has provided insight regarding intrinsic properties of salt marsh
vegetation, and their response to different hydrodynamic conditions, as well as local parameters that favor
their survival. Additional to it’s wave attenuation capacity, research shows that salt marshes also offer several
innate ecosystem services such as erosion control, water purification, carbon sequestration, and can serve as
a location for tourism, recreation, education research services (Barbier et al., 2011). These different services,
along with the ecosystem’s wave attenuation capacity, add to the already increasing appeal of including these
ecosystems as means of coastal protection measures.
Nonetheless, when looking at vegetated foreshores as an alternative flood defense measure, it is necessary to
study how cost-effective they can be in contrast with traditional flood defenses. Narayan et al. (2016) com-
pared vegetated foreshores to relatable hard structures, such as submerged breakwaters, and found that veg-
etated foreshores can be more cost-efficient when exposed to wave heights of up to 0.50m and even become
more cost effective at greater depths. As presented in Figure 2.2 these habitats have their distinctive presence
on different regions around the world, which has been used by researchers and local authorities to introduce
this habitat as a coastal protection measure.
Additional to the previously described cost-effectiveness analysis, Narayan et al. (2016) also compiled a list of
studies where wave attenuation capacity by salt marsh habitats was measured. Several studies were retrieved
as part of this compilation, while making a distinction between already existing natural ecosystems (’Natural
Defenses’), and introduced nature-based flood defenses ("Nature-based Defenses’). A summary of the afore-8 2. Literature review
mentioned salt marsh case studies is presented in Table 2.1. In total, 32 locations can be gathered from the
dataset, for both natural and nature-based defenses.
Table 2.1: Previous studies regarding wave height attenuation by salt marsh vegetation. Distinction is made between natural and
engineered systems. Adapted from Narayan et al. (2016).
Natural defenses Nature-based defenses
No. of studies Locations No. of studies Locations
USA, UK, China,
15 17 USA, UK, China
Netherlands
All the studies presented in Table 2.1 were aimed at measurement of the wave attenuation capacity of the
ecosystem, and yet little is known about their ability to reduce water level increase due to storm surges. It
has been previously determined that wetlands have potential to reduce surges, but it is highly dependent on
the surrounding coastal landscape and the strength and duration of the storm forcing (Wamsley et al., 2010).
For mangrove-vegetated foreshores, Montgomery et al. (2019) found that sufficiently wide and dense forests
can reduce storm surge only to some degree; so water level attenuation by vegetated foreshores will not be
further discussed in this thesis.
It is important to mention that most of the studies gathered by Narayan et al. (2016) measured wave attenu-
ation under daily conditions; meaning that low waves with relatively low water depths were registered at the
study sites. However, due to the increasing interest in adopting salt marsh habitats as an effective flood pro-
tection measure, understanding the behavior of these habitats under storm conditions has become a point
of focus in recent years. The research done by Vuik et al. (2016a) added larger water depths and wave heights
(2.50 m and 0.70m, respectively) to the range of previously registered observations, and concluded that the
presence of vegetation leads to additional wave height reduction of 25-50% with respect to dissipation by only
wave breaking and bottom friction. More recently, Zhu et al. (2020) determined with documented historical
field evidence to which extent do salt marsh vegetation adds safety to engineered structures during severe
storms; and concluded that not only salt marsh-vegetated foreshores reduce the likelihood of dyke failure,
but also lowers flood impact by limiting breach dimensions (increasing the expected fatality rate from 0.7 to
1.0, instead of from 4.5 to 12.1 for non-vegetated foreshores).
Besides shedding light into the eventual use of vegetated foreshores as an effective flood protection mea-
sure, previous research has also added knowledge regarding the conditions that can limit the existence and
survival of salt marshes, as well as the extent up to which they remain effective as a flood hazard reduction
measure. These limiting conditions can serve as indicators for habitat introduction and, in later stages, as an
assessment for flood protection.
2.2.2. Habitat suitability indicators
Habitat suitability limitations refer to local conditions that can favor or enhance the development of salt
marsh vegetation in order to colonize a specific site. Existing literature presents information regarding habi-
tat requirements for introduction or survival, along with qualitative estimates of limit values/thresholds. It is
important to keep in mind that there are several variables that need to comply with the vegetation require-
ments in order to consider a site to be completely suitable to host the ecosystem. Deltares (2018) divides this
habitat’s requirements into biosphere, hydrosphere, lithosphere, and atmosphere (Figure 2.4), which pro-
vides the greater picture of the general required conditions. From this Figure, it is clear that different factors
are needed for salt marshes to thrive; however, this thesis will focus on the analysis and quantification of hy-
drodynamic conditions and its derived phenomena, while the local soil composition and source of seeds will
be assumed to be present.2.2. Salt marshes 9
Figure 2.4: Salt marsh habitat requirements, subdivision proposed by Deltares (2018).
Attempts to better understand the required mild/sheltered hydrodynamic conditions have led to the defini-
tion of the ’Window of Opportunity’ (WoO) term, which has been used to describe moments in time when
local conditions (usually hydrodynamic) allow the occurrence of seed settlement (Balke et al. (2011), Balke
et al. (2014), Domburg (2018), Hu et al. (2015), Yuan et al. (2020)). WoO for salt marshes have been studied
by Hu et al. (2015), who defined two necessary events that need to occur one after the other: the first WoO
is characterized by a sufficiently long inundation-free period (disturbance frequency) that allows seeds to
settle and root; then, it has to be followed by a second WoO characterized by low hydrodynamic forcing (dis-
turbance magnitude), such that the seedlings (seeds that have just sprouted) are not uprooted at the initial
growth stages. Furthermore, Hu et al. (2015) also studied the effects of bathymetry in seedling survival by ob-
serving the occurrence of wave-induced and current-induced bed shear stress on both concave and convex
foreshores. They found that even though the aforementioned bed shear stress occurring on both bathyme-
tries decrease linearly with increasing elevation, the wave-induced bed shear stress occurring over a convex
foreshore was lower than the one occurring on a concave bathymety, with a greater difference found on the
pioneer zone.
The WoO concept was further studied in Silinski et al. (2015), who performed flume experiments to measure
typical wave forcing on adult salt marsh specimens and seedlings within en estuary. This was analyzed by
generating both short and long waves, aimed to mimic locally wind-generated and ship waves, respectively,
under two distinctive water depths. Results showed that longer waves (ca. T = 10s) caused severe bending
on both mature marshes and seedling stems, while also generating greater scour depths at the base of the
stem. These results suggest that a permanent hydrodynamic forcing exerted by longer waves can prevent
the occurrence of the required WoO, which hinders the likelihood of seedling establishment. These findings
were later favored by the conclusions presented in Silinski et al. (2016a). Further studies aimed to study habi-
tat suitability conditions were presented in Silinski et al. (2016b) and Silinski et al. (2016c), where salt marsh
patches were transplanted on different sections along salt marsh sites, in both sheltered (fetch < 2km) and
exposed wind conditions. One of the critical differences found between sites was that vegetation planted on
the bare mudflat of the sheltered site survived longer than vegetation planted on the exposed bare mudflats.
This accentuates the relevance of wave action when explaining the limiting factors for salt marsh survival.
Nonetheless, no vegetation patch transplanted on bare mudflats survived at either exposed or sheltered lo-
cation on a long-term scale, suggesting that local disturbances are the dominant indicators for salt marsh
establishment. Moreover, they found that at salt marshes where wave action is limited (sheltered sites), the
bed level elevation can possibly serve as a reliable indicator for salt marsh expansion; whereas in sites that
are exposed to more aggressive wave loading, the elevation becomes a secondary suitability parameter, since
it is overruled by the forcing of the waves themselves.10 2. Literature review
Considering that the exposure to hydrodynamic forces has a major role in determining the likelihood of a site
to host salt marsh vegetation, the exposure to flooding events is also considered a relevant indicator for salt
marsh suitability. There are two main proxies that treat this occurrence: inundation duration and inundation
frequency. Balke et al. (2016) performed a global analysis of salt marsh extent in locations with different tidal
regimes, and looked into the flooding events occurring at the salt marsh edge, which is defined as the spatial
limit between the vegetated platform of the salt marsh and the bare mudflat. Results found that even though
the salt marsh edge in meso to macrotidal salt marsh sites is located at a higher level when compared to mi-
crotidal sites, inundation still occurs twice daily. Additionally, this study shows that the potentially vegetated
section of the tidal frame does not increase proportionally with increasing tidal range. This study therefore
concluded that inundation frequency, and not inundation duration, defines the global location of the sea-
ward extent of salt marshes. Nonetheless, the inundation duration may be closer linked to the initial seed
establishment previously defined in the WoO definition by Balke et al. (2011). Furthermore, Deltares (2018)
also suggests inundation frequencies to be the relevant indicator for salt marsh development, while detailing
different inundation events per salt marsh zone (Figure 2.3 and Table 2.2).
These previous studies suggest that temporarily variable hydrodynamic conditions are key in the successful
establishment and development of vegetated foreshores, and for this reason they will be further assessed in
this thesis. Several additional studies related to salt marsh habitat requirements and threshold values have
been compiled and presented in Table 2.2, among which we can find limit values for wave-induced orbital
velocities for salt marsh stem breakage of different salt marsh species (Vuik et al., 2018a), salinity concen-
tration at different levels of salt marsh elevation (Deltares, 2018), required foreshore slopes for new marshes
(van Duin et al., 2012), minimum suspended sediment concentration to keep pace with sea level rise (Kirwan
et al., 2010), among others. Even though these limitations often include a threshold based on observations
made in field or flume experiments, some habitat limitations are only qualitatively described.
Table 2.2: Summary feasibility indicators found in literature.
Habitat suitability
Species/zonation Reference
Indicator Threshold
Pioneer zone x2 per day
Low zone Inundation frequency 100-400 per year Deltares (2018)
Mid/high zone 20mg/l Kirwan et al. (2010)
- Bathymetry 1:50 - 1:500 slope van Duin et al. (2012)
Spartina 0.50 - 1.20 m/s Vuik et al. (2018a)
Scirpus Orbital velocities (winter) 0.30 - 1.00 m/s Vuik et al. (2018a)
Damage >0.42
Elymus Rupprecht et al. (2017)
m/s
Considering these previously given qualitative thresholds/limit values for temporarily variable hydrodynamic
conditions, such as inundation frequency, wave action and strong currents these are the variables that will be
further assessed in the remaining sections of this thesis.
2.2.3. Effectiveness indicators
The previous studies mentioned in Subsection 2.2.1 were targeted at understanding the general wave attenu-
ation capacity of salt marsh habitats, some of them even taking a step forward into studying to which degree
they remain an effective measure for flood protection. This previous research introduced several likely indi-
cators for the ecosystem’s wave damping capacity, such as increasing relative vegetation height (ratio between
vegetation height and water depth - h v /h) (Augustin et al., 2009; Yang et al., 2011); low water depths and high2.2. Salt marshes 11 salt marsh biomass, as well as the ratio between wave height and water depth (H /h) (Løvås et al., 2000; Vuik et al., 2016a); and higher wave steepness (Anderson et al., 2014; Wu et al., 2015). From these studies, the water depth above the foreshore stands out as a recurrent factor within the effective- ness indicators. This is due to the fact that the presence of vegetation on the foreshore introduces additional drag forces on the propagating wave, which has been observed to reduce the energy at all frequencies within a spectrum, with higher reduction on the high-frequency end of the spectra (Anderson et al., 2014). This interaction between wave and vegetation was further investigated by Vuik et al. (2016a), where field mea- surements between November 2014 and January 2015 served to explain the response of salt marsh habitats under storm conditions. The variable recorded hydrodynamics helped to assess the response of vegetation under different H/h ratios. Results showed that, under storm conditions and smaller wave height to water depth ratios, dissipation by vegetation becomes an important energy dissipation mechanism, while depth induced wave breaking is limited; additionally, they showed that for larger wave height to water depth ratios, vegetation prevents intense wave breaking to occur, possibly favoring the stabilization of sediments on the foreshore. These findings mean that not only wave height to water depth ratio serves as an effectiveness indicator, but also vegetation height (h v ). Yang et al. (2011) found that when water depths above the foreshore were 1.5 - 2.0 times larger than the vegetation height, the wave attenuation rate was reduced in contrast to barely submerged or emerging vegetation. Furthermore, they suggested that when greater water depths (relative to vegetation height) are observed, a lower drag coefficient should be considered when modeling wave growth over a vegetated foreshore. Augustin et al. (2009) further adds to the importance of vegetation height, finding greater rates of wave attenuation for emergent vegetation (h v /h > 1.0) than on barely submerged salt marsh vegetation. Additionally, in order to further understand the utility of vegetated foreshores as a flood protection measure, van Zelst (2018) attempted to assess their flood hazard reduction capacity on a global scale. This study de- fined wave damping as the difference between incoming wave height and transmitted wave height (at the end of a transect) on both vegetated and bare foreshores. Results show that salt marsh-vegetated foreshores can reduce wave transmission up to 40% in both sheltered and exposed environments, but it is highly dependent on the modelled vegetation characteristics. Nonetheless, from the global assessment it could be concluded that higher rates of wave attenuation were found for increasing vegetation width (about 10% to 25% of wave attenuation is observed in the first 450m and 900m, respectively). Moreover, this study found the highest wave attenuation rates occurring on waves propagating over milder foreshore slopes, which also falls in line with the findings by Songy (2016). Even tough the research by van Zelst (2018) assessed global potential for wave attenuation effectiveness, the assessment did not explicitly observe the response with respect to local tidal ranges. Kirwan et al. (2010) al- ready accounted for the different resilient capacity of salt marshes to increasing water levels in areas with different tidal ranges, suggesting that sites with a greater tidal range with high sediment supply could better adapt to rising sea levels, while the contrary occurring in sites with low tidal ranges little sediment supply. Furthermore, Balke et al. (2016) studied the importance of tidal range for the seaward extent of salt marsh habitats. This study gathered historical data from locations experiencing different tidal ranges, and they found that the seaward extent of the pioneering edge of a salt marsh (lowest elevation) grows logarithmi- cally with increasing tidal range. This translates to the fact that the vegetated section below mean high water does not increase for increasing tidal ranges. Given the close relationship between tidal range and salt marsh dynamics, this site-specific characteristic will be further studied as part of this thesis as a likely wave attenu- ation effectiveness indicator. Likewise, considering the general importance of water depth in the indicators described in this subsection, both vegetation height to water depth ratio (h v /h) and wave height to water depth ratio (H /h) will be further assessed in this thesis with the purpose of determining different degrees of effectiveness for both. An overview of the effectiveness indicators found in literature are presented in Table 2.3.
You can also read